MIRA INFORM REPORT
|
Report No. : |
322280 |
|
Report Date : |
06.06.2015 |
IDENTIFICATION DETAILS
|
Name : |
SHREEM ELECTRIC LIMITED |
|
|
|
|
Formerly Known
As : |
SHREEM ELECTRIC PRIVATE LIMITED [w.e.f.30.12.2009] SHREEM CAPACITORS PRIVATE LIMITED |
|
|
|
|
Registered
Office : |
Shantiban Society, Neminath Nagar, Dhamni Road, Sangli – 416416, Maharashtra |
|
Tel. No.: |
91-2322-221021 |
|
|
|
|
Country : |
India |
|
|
|
|
Financials (as
on) : |
31.03.2014 |
|
|
|
|
Date of
Incorporation : |
02.01.1976 |
|
|
|
|
Com. Reg. No.: |
11-151160 |
|
|
|
|
Capital
Investment / Paid-up Capital : |
Rs. 860.693
Million |
|
|
|
|
CIN No.: [Company Identification
No.] |
U51505PN1976PLC151160 |
|
|
|
|
IEC No.: |
Not Available |
|
|
|
|
TAN No.: [Tax Deduction &
Collection Account No.] |
KLPS03718B |
|
|
|
|
PAN No.: [Permanent Account No.] |
AACCS4893C |
|
|
|
|
Legal Form : |
A Closely Held Public Limited Liability Company |
|
|
|
|
Line of Business
: |
Manufacturer of High Voltage/Low Voltage
Capacitors, Capacitor Banks, Breakers, Control Panels, Substation Structures
and Executing Turnkey Projects for Electricity Transmission and Distribution
Sector. |
|
|
|
|
No. of Employees
: |
1500 (Approximately) |
RATING & COMMENTS
|
MIRA’s Rating : |
A (64) |
|
RATING |
STATUS |
PROPOSED CREDIT LINE |
|
|
56-70 |
A |
Financial & operational base are regarded healthy. General
unfavourable factors will not cause fatal effect. Satisfactory capability for
payment of interest and principal sums |
Fairly Large |
|
Status : |
Good |
|
|
|
|
Payment Behaviour : |
Regular |
|
|
|
|
Litigation : |
Exist |
|
|
|
|
Comments : |
Subject is a well-established company incorporated in 1976. It is a
having fine track record. It manufactures electrical equipment, mainly high tension and low tension
capacitors and other allied products used in the transmission and
distribution sectors. It earned total revenue of Rs. 60970.64 Lakhs in FY 2014 (FY 2013 Rs.
53064.1 Lakhs). There seems dip in the profit of the company i.e. Rs. 2470.52
Lakhs in FY 2013 to Rs. 1840.34 Lakhs in FY 2014. However, the rating takes into consideration its market leadership
position in manufacturing high tension and low tension capacitors and its
established position in Engineering, Procurement and Construction Contracts
for erections of sub-stations. Trade relations are reported as fair. Business is active. Payment
terms are reported to be regular and as per commitment. The company can be considered normal for business dealings at usual
trade terms and conditions. |
NOTES :
Any query related to this report can be made
on e-mail : infodept@mirainform.com
while quoting report number, name and date.
ECGC Country Risk Classification List – March 31, 2015
|
Country Name |
Previous Rating (31.12.2014) |
Current Rating (31.03.2015) |
|
India |
A1 |
A1 |
|
Risk Category |
ECGC
Classification |
|
Insignificant |
A1 |
|
Low |
A2 |
|
Moderate |
B1 |
|
High |
B2 |
|
Very High |
C1 |
|
Restricted |
C2 |
|
Off-credit |
D |
EXTERNAL AGENCY RATING
|
Rating Agency Name |
FITCH Rating |
|
Rating |
Long term Issuer Rating = IND A- |
|
Rating Explanation |
Have adequate degree of safety and low
credit risk. |
|
Date |
15.01.2015 |
|
Rating Agency Name |
FITCH Rating |
|
Rating |
Non-fund based limits = IND A2+ |
|
Rating Explanation |
Have strong degree of safety and carry low
credit risk. |
|
Date |
15.01.2015 |
RBI DEFAULTERS’ LIST STATUS
Subject’s name is not enlisted as a defaulter in
the publicly available RBI Defaulters’ list.
EPF (Employee Provident Fund) DEFAULTERS’ LIST STATUS
Subject’s name is not enlisted as a defaulter
in the publicly available EPF (Employee Provident Fund) Defaulters’ list as of
31-03-2013.
INFORMATION PARTED BY
|
Name : |
Mr. G.N. Deshpande |
|
Designation : |
Finance Head |
|
Contact No.: |
91-9370525255 |
|
Date : |
04.06.2015 |
LOCATIONS
|
Registered Office : |
Shantiban Society, Neminath Nagar, Dhamni Road, Sangli – 416416, Maharashtra,
India |
|
Tel. No.: |
Not Available |
|
Mobile No.: |
91-9370525255 (Mr. G.N. Deshpande) |
|
Fax No.: |
Not Available |
|
E-Mail : |
|
|
Website : |
|
|
Location : |
Owned |
|
|
|
|
Factory 1/ Research and Development Center/ Corporate Office : |
Plot No. 43 to 46, L.K. Industrial Estate, Jaysingpur, Tal. Shirol, District Kolhapur - 416144, Maharashtra, India |
|
Tel. No.: |
91-2322-221021/ 221022 |
|
Fax No.: |
91-2322-221023 |
|
E-Mail : |
|
|
|
|
|
Factory 2 : |
Plot No. 3, Gat No. 418/2, L.K. Industrial Estate,
Jaysingpur, Tal. Shirol, District Kolhapur, Maharashtra, India |
|
|
|
|
Factory 3 : |
Gat No. 311, Mouje Agar, Tal. Shirol, District Kolhapur,
Maharashtra, India |
|
|
|
|
Factory 4 : |
Gat No. 315/B, 259, 260, 261, Mouje Agar, Tal. Shirol, District Kolhapur,
Maharashtra, India |
|
|
|
|
Branch Offices : |
Located at: · Mumbai · Chennai · Indore · New Delhi · Bhopal · Chandigarh · Bangalore · Pune · Jammu · Jabalpur · Raipur · Lucknow |
DIRECTORS
AS ON 30.09.2014
|
Name : |
Mr. Shahaji Ramchandra Jagadale |
|
Designation : |
Managing director |
|
Address : |
“Sharvari” Near SBI Colony, Sangli – 416416, Maharashtra, India |
|
Date of Birth/Age : |
01.04.1942 |
|
Qualification : |
BME |
|
Date of Appointment : |
15.01.1976 |
|
PAN No.: |
ABAPJ7056J |
|
Background : |
Mr. S.R. Jagadale founded Shreem in year 1976. After completion of
D.M.E in 1962, he served as Sr. Engineer for 14 years (1962-1976) with
Premiere Automobiles and Telco. He has 34 Yrs. Experience in Electrical
Engineering Industries and working as Managing Director for last 27 Yrs. He
has received Training for Production Engineer in Germany and UK. |
|
DIN No.: |
00356655 |
|
|
|
|
Name : |
Mr. Vikas Shahaji Jagadale |
|
Designation : |
Managing director |
|
Address : |
“Sharvari” Near SBI Colony, Sangli – 416416, Maharashtra, India |
|
Date of Birth/Age : |
13.07.1970 |
|
Qualification : |
B. E. (ELEC) |
|
Date of Appointment : |
18.03.2006 |
|
PAN No.: |
AAWPJ5857C |
|
Passport No.: |
Z1722598 |
|
Background : |
Mr. Vikas Jagadale, Joint Managing Director, is B.E. (Electronics) by
Qualification and has 16 Yrs. Experience in Design, Engineering,
Manufacturing and Marketing in Shreem group of Industries and currently
working as Joint Managing Director. |
|
DIN No.: |
00361639 |
|
|
|
|
Name : |
Mr. Vijaykumar Madanlal Nawandhar |
|
Designation : |
Director |
|
Address : |
Pujari Plot No. 35, Narayani, Vishrambag, Sangli – 416416,
Maharashtra, India |
|
Date of Birth/Age : |
21.10.1958 |
|
Date of Appointment : |
06.11.2012 |
|
DIN No.: |
00218197 |
|
|
|
|
Name : |
Mr. Rajesh Kumar Dugar |
|
Designation : |
Director |
|
Address : |
6th Floor, Mafatlal Centre, Nariman Point, Mumbai – 400021,
Maharashtra, India |
|
Date of Appointment : |
14.10.2010 |
|
DIN No.: |
00307729 |
|
|
|
|
Name : |
Mr. Chakravarthi Sundarashyam |
|
Designation : |
Director |
|
Address : |
202, Sri Anita Apartments, 2-2-20/B/12, DD Colony, Bagh, Amberpet,
Hyderabad – 500013, Telangana, India |
|
Date of Birth/Age : |
02.01.1945 |
|
Date of Appointment : |
15.04.2011 |
|
Background : |
Mr. Chakravarthi Sundarashyam has retired from State Bank of India. He
has over 40 years of work experience in banking and financial services. He is
M. Sc, MBA, LLB, CAIIB |
|
DIN No.: |
00358052 |
|
|
|
|
Name : |
Mrs. Hema Shahaji Jagadale |
|
Designation : |
Director |
|
Address : |
“Sharvari” Near SBI Colony, Sangli – 416416, Maharashtra, India |
|
Date of Birth/Age : |
02.06.1950 |
|
Date of Appointment : |
08.04.1997 |
|
PAN No.: |
AAWPJ5856D |
|
Passport No.: |
Z2805406 |
|
DIN No.: |
00361292 |
|
|
|
|
Name : |
Mr. Vishal Shahaji Jagadale |
|
Designation : |
Whole-time director |
|
Address : |
“Sharvari” Near SBI Colony, Sangli – 416416, Maharashtra, India |
|
Date of Birth/Age : |
15.12.1973 |
|
Qualification : |
B.E. (MECH) |
|
Date of Appointment : |
18.03.2006 |
|
PAN No.: |
AAWPJ5855A |
|
Passport No.: |
J2787694 |
|
Background : |
Mr. Vishal Jagadale, Director, is B.E. (Mech.) from Voegogzad State Technical
University, USSR. He is specialized in Automation of Technological Processes
and Productions. Mr. Vishal is Director in the Company. |
|
DIN No.: |
00361449 |
KEY EXECUTIVES
|
Name : |
Mr. G.N. Deshpande |
|
Designation : |
Finance Head |
MAJOR SHAREHOLDERS / SHAREHOLDING PATTERN
AS ON 30.09.2014
|
Names of Equity Shareholders |
|
No. of Shares |
|
Shahaji Ramchandra Jagadale |
|
2790700 |
|
Shahaji Ramchandra Jagadale (HUF) |
|
1197400 |
|
Hema Shahaji Jagadale |
|
2397400 |
|
Vikas Shahaji Jagadale |
|
1052600 |
|
Vikas Shahaji Jagadale (HUF) |
|
282400 |
|
Vishal Shahaji Jagadale |
|
1052600 |
|
Vishal Shahaji Jagadale (HUF) |
|
194200 |
|
Rakhee Vikas Jagadale |
|
3800 |
|
Yogini Vishal Jagadale |
|
3800 |
|
Sharp Financial and Capital Cons. Private Limited (Previously known as
Sharp Computers Serv. and Co. Private Limited), India |
|
9578900 |
|
Hari Agri and Trading Co., India |
|
1522200 |
|
Vikas Shahaji Jagadale and Vishal Shahaji Jagadale [Shreem Electric
Employee Welfare Trust] |
|
708565 |
|
FIL Capital Management (Mauritius) Limited, Mauritius C/o Cim Fund
Services Limited |
|
298 |
|
Fidelity India Principals, India |
|
2 |
|
|
|
|
|
Total |
|
20784865 |
|
Names of Preference Shareholders |
|
No. of Shares |
|
FIL Capital Management (Mauritius) Limited, Mauritius C/o Cim Fund
Services Limited |
|
2812811 |
|
Fidelity India Principals, India |
|
21210 |
|
|
|
|
|
Total |
|
2834021 |
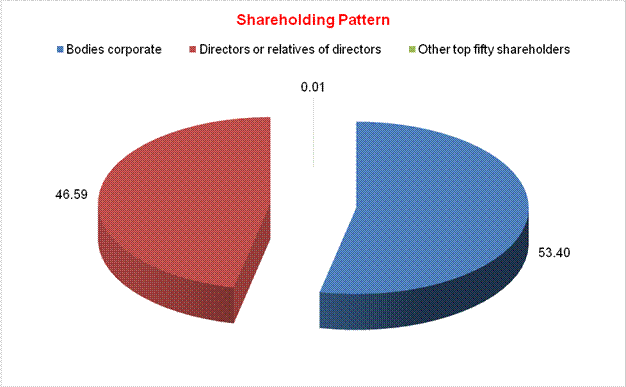
AS ON 30.09.2014
|
Equity Share Breakup |
Percentage of Holding |
|
Category |
|
|
Bodies
corporate |
53.40 |
|
Directors
or relatives of directors |
46.59 |
|
Other
top fifty shareholders |
0.01 |
|
|
|
|
Total |
100.00 |
BUSINESS DETAILS
|
Line of Business : |
Manufacturer of High Voltage/Low Voltage
Capacitors, Capacitor Banks, Breakers, Control Panels, Substation Structures and
Executing Turnkey Projects for Electricity Transmission and Distribution
Sector. |
||||||
|
|
|
||||||
|
Products : |
|
||||||
|
|
|
||||||
|
Brand Names : |
-- |
||||||
|
|
|
||||||
|
Agencies Held : |
-- |
||||||
|
|
|
||||||
|
Exports : |
|
||||||
|
Products : |
Capacitors |
||||||
|
Countries : |
· Brazil · Africa · USA · Europe |
||||||
|
|
|
||||||
|
Imports : |
|
||||||
|
Products : |
Raw Material |
||||||
|
Countries : |
· China · France · Europe |
||||||
|
|
|
||||||
|
Terms : |
|
||||||
|
Selling : |
L/C and Cheque |
||||||
|
|
|
||||||
|
Purchasing : |
L/C and Cheque |
PRODUCTION STATUS: NOT AVAILABLE
GENERAL INFORMATION
|
Suppliers : |
|
||||||||||||||||||||||||||||||
|
|
|
||||||||||||||||||||||||||||||
|
Customers : |
Retailers and End Users
|
||||||||||||||||||||||||||||||
|
|
|
||||||||||||||||||||||||||||||
|
No. of Employees : |
1500 (Approximately) |
||||||||||||||||||||||||||||||
|
|
|
||||||||||||||||||||||||||||||
|
Bankers : |
·
ICICI Bank Limited Bagal Chowk, Rajarampuri, Kolhapur - 416008,
Maharashtra, India ·
Bharat Urban Co-Operative Bank Limited Jaysingpur Branch, Jaisingpur,
Maharashtra, India ·
HDFC Bank Limited HDFC Bank House, Senapati Bapat Marg, Lower Parel
[West], Mumbai - 400013, Maharashtra, India ·
The Ratnakar Bank Limited ·
IDBI Bank Limited ·
Axis Bank Limited ·
Canara Bank · Bank of Baroda |
||||||||||||||||||||||||||||||
|
|
|
||||||||||||||||||||||||||||||
|
Facilities : |
|
|
|
|
|
Auditors 1 : |
|
|
Name : |
V. T. and Associates Chartered Accountants |
|
Address : |
168, Vakhar, Bhag, Sangli – 416416, Maharashtra,
India |
|
Income-tax
PAN of auditor or auditor's firm : |
AAFFV3492E |
|
|
|
|
Auditors 2 : |
|
|
Name : |
B B S R and Company Chartered Accountants |
|
Address : |
1st Floor, Lodha Excelus, Apollo Mills Compound,
N M Joshi Marg, Mahalaxmi, Mumbai - 400011, Maharashtra, India |
|
Income-tax
PAN of auditor or auditor's firm : |
AAKFB4397F |
|
|
|
|
Cost Auditors : |
|
|
Name : |
Adawadkar Chougule and Associates Cost Accountants |
|
Address : |
Kolhapur, Maharashtra, India |
|
|
|
|
Memberships : |
-- |
|
|
|
|
Collaborators : |
-- |
|
|
|
|
Fellow Subsidiary
company : |
Sharp Financial and Capital Consultant Private Limited
[U74999MH1987PTC034846] |
|
|
|
|
Enterprises which
are owned, or have significant influence of or are partners with Key
management personnel and their relatives : |
·
Mahan Electrical Industries Private Limited
[U31909MH1987PTC044793] ·
United Industries ·
Shreem Construction ·
Shreem Engineering Industries ·
K.N.G. Wires and Cables LLP |
CAPITAL STRUCTURE
AS ON 30.09.2014
Authorised Capital :
|
No. of Shares |
Type |
Value |
Amount |
|
|
|
|
|
|
25,000,000 |
Equity Shares |
Rs. 10/- each |
Rs. 250.000 Million |
|
2,834,021 |
Preference Shares |
Rs. 232.86/- each |
Rs. 659.930 Million |
|
|
|
|
|
|
|
Total |
|
Rs. 909.930
Million |
Issued, Subscribed & Paid-up Capital :
|
No. of Shares |
Type |
Value |
Amount |
|
|
|
|
|
|
20,784,865 |
Equity Shares |
Rs. 10/- each |
Rs. 207.849
Million |
|
2,834,021 |
Preference Shares |
Rs. 232.86/- each |
Rs. 659.930
Million |
|
|
|
|
|
|
|
Total |
|
Rs. 867.779 Million |
AS ON 31.03.2014
Authorised Capital :
|
No. of Shares |
Type |
Value |
Amount |
|
|
|
|
|
|
25,000,000 |
Equity Shares |
Rs. 10/- each |
Rs. 250.000 Million |
|
2,834,021 |
Preference Shares |
Rs. 232.86/- each |
Rs. 659.930 Million |
|
|
|
|
|
|
|
Total |
|
Rs. 909.930
Million |
Issued, Subscribed & Paid-up Capital :
|
No. of Shares |
Type |
Value |
Amount |
|
|
|
|
|
|
20,076,300 |
Equity Shares |
Rs. 10/- each |
Rs. 200.763
Million |
|
2,834,021 |
Preference Shares |
Rs. 232.86/- each |
Rs. 659.930
Million |
|
|
|
|
|
|
|
Total |
|
Rs. 860.693 Million |
FINANCIAL DATA
[all figures are
in Rupees Million]
ABRIDGED
BALANCE SHEET
|
SOURCES OF FUNDS |
31.03.2014 |
31.03.2013 |
31.03.2012 |
|
I.
EQUITY AND LIABILITIES |
|
|
|
|
(1)Shareholders' Funds |
|
|
|
|
(a) Share Capital |
860.693 |
860.693 |
860.693 |
|
(b) Reserves & Surplus |
1674.750 |
1490.716 |
1220.412 |
|
(c) Money received against share warrants |
0.000 |
0.000 |
0.000 |
|
|
|
|
|
|
(2) Share
Application money pending allotment |
0.000 |
0.000 |
0.000 |
|
Total
Shareholders’ Funds (1) + (2) |
2535.443 |
2351.409 |
2081.105 |
|
|
|
|
|
|
(3)
Non-Current Liabilities |
|
|
|
|
(a) Long-term borrowings |
15.532 |
20.528 |
22.825 |
|
(b) Deferred tax liabilities (Net) |
45.581 |
31.041 |
20.462 |
|
(c)
Other long term liabilities |
0.000 |
0.000 |
0.000 |
|
(d)
long-term provisions |
3.994 |
3.483 |
2.859 |
|
Total
Non-current Liabilities (3) |
65.107 |
55.052 |
46.146 |
|
|
|
|
|
|
(4) Current Liabilities |
|
|
|
|
(a)
Short term borrowings |
2487.234 |
1945.754 |
1206.367 |
|
(b)
Trade payables |
2042.457 |
1892.953 |
1430.284 |
|
(c)
Other current liabilities |
272.769 |
299.559 |
204.800 |
|
(d)
Short-term provisions |
21.045 |
25.970 |
57.823 |
|
Total
Current Liabilities (4) |
4823.505 |
4164.236 |
2899.274 |
|
|
|
|
|
|
TOTAL |
7424.055 |
6570.697 |
5026.525 |
|
|
|
|
|
|
II.
ASSETS |
|
|
|
|
(1) Non-current assets |
|
|
|
|
(a)
Fixed Assets |
|
|
|
|
(i)
Tangible assets |
810.737 |
652.368 |
506.364 |
|
(ii)
Intangible Assets |
6.436 |
8.582 |
0.000 |
|
(iii)
Capital work-in-progress |
0.000 |
0.000 |
1.060 |
|
(iv) Intangible assets under development |
0.000 |
0.000 |
10.728 |
|
(b) Non-current
Investments |
0.085 |
0.085 |
0.085 |
|
(c) Deferred tax assets
(net) |
0.000 |
0.000 |
0.000 |
|
(d) Long-term Loan
and Advances |
26.346 |
14.364 |
42.121 |
|
(e)
Other Non-current assets |
100.472 |
0.000 |
0.000 |
|
Total
Non-Current Assets |
944.076 |
675.399 |
560.358 |
|
|
|
|
|
|
(2) Current assets |
|
|
|
|
(a)
Current investments |
0.000 |
0.000 |
0.000 |
|
(b)
Inventories |
432.779 |
245.559 |
245.935 |
|
(c)
Trade receivables |
4557.974 |
3967.940 |
3186.558 |
|
(d)
Cash and cash equivalents |
367.366 |
292.094 |
159.413 |
|
(e)
Short-term loans and advances |
501.935 |
493.958 |
289.088 |
|
(f)
Other current assets |
619.925 |
895.747 |
585.173 |
|
Total
Current Assets |
6479.979 |
5895.298 |
4466.167 |
|
|
|
|
|
|
TOTAL |
7424.055 |
6570.697 |
5026.525 |
PROFIT
& LOSS ACCOUNT
|
|
PARTICULARS |
31.03.2014 |
31.03.2013 |
31.03.2012 |
|
|
|
SALES |
|
|
|
|
|
|
|
Revenue from Operations |
5877.072 |
5264.325 |
4867.254 |
|
|
|
Other Income |
219.992 |
42.085 |
33.723 |
|
|
|
TOTAL (A) |
6097.064 |
5306.410 |
4900.977 |
|
|
|
|
|
|
|
|
Less |
EXPENSES |
|
|
|
|
|
|
|
Cost of Materials Consumed |
4581.014 |
4046.805 |
3501.362 |
|
|
|
Changes in inventories of finished goods, work-in-progress
and Stock-in-Trade |
(39.987) |
(31.631) |
(32.077) |
|
|
|
Employees benefits expense |
173.270 |
142.315 |
136.806 |
|
|
|
Other expenses |
580.300 |
456.157 |
596.358 |
|
|
|
TOTAL (B) |
5294.597 |
4613.646 |
4202.449 |
|
|
|
|
|
|
|
|
|
PROFIT
BEFORE INTEREST, TAX, DEPRECIATION AND AMORTISATION (A-B) (C) |
802.467 |
692.764 |
698.528 |
|
|
|
|
|
|
|
|
|
Less |
FINANCIAL
EXPENSES (D) |
487.953 |
302.724 |
175.355 |
|
|
|
|
|
|
|
|
|
|
PROFIT
BEFORE TAX, DEPRECIATION AND AMORTISATION (C-D) (E) |
314.514 |
390.040 |
523.173 |
|
|
|
|
|
|
|
|
|
Less/ Add |
DEPRECIATION/
AMORTISATION (F) |
63.240 |
58.876 |
43.255 |
|
|
|
|
|
|
|
|
|
|
PROFIT BEFORE
TAX (E-F) (G) |
251.274 |
331.164 |
479.918 |
|
|
|
|
|
|
|
|
|
Less |
TAX (H) |
67.240 |
84.112 |
126.532 |
|
|
|
|
|
|
|
|
|
|
PROFIT AFTER TAX
(G-H) (I) |
184.034 |
247.052 |
353.386 |
|
|
|
|
|
|
|
|
|
|
EARNINGS IN
FOREIGN CURRENCY |
|
|
|
|
|
|
|
Export Earnings [FOB Basis] |
285.661 |
216.760 |
288.986 |
|
|
|
|
|
|
|
|
|
IMPORTS |
|
|
|
|
|
|
|
Raw Materials |
262.599 |
202.176 |
290.799 |
|
|
|
Capital Goods |
11.040 |
19.508 |
7.044 |
|
|
TOTAL IMPORTS |
273.639 |
221.684 |
297.843 |
|
|
|
|
|
|
|
|
|
|
Earnings Per
Share (Rs.) |
|
|
|
|
|
|
Basic
|
8.85 |
11.88 |
17.00 |
|
|
|
Diluted
|
7.79 |
10.46 |
14.96 |
|
CURRENT MATURITIES
OF LONG TERM DEBT DETAILS
|
Particulars |
31.03.2014 |
31.03.2013 |
31.03.2012 |
|
Current Maturities of Long term debt |
110.845 |
100.692 |
7.899 |
|
|
|
|
|
|
Cash (used in) operations |
43.698 |
(283.016) |
(233.254) |
KEY
RATIOS
|
PARTICULARS |
|
31.03.2014 |
31.03.2013 |
31.03.2012 |
|
Net Profit Margin (PAT / Sales) |
(%) |
3.13 |
4.69 |
7.26 |
|
|
|
|
|
|
|
Operating Profit Margin (PBDIT/Sales) |
(%) |
13.65 |
13.16 |
14.35 |
|
|
|
|
|
|
|
Return on Total Assets (PBT/Total Assets} |
(%) |
3.38 |
5.04 |
9.57 |
|
|
|
|
|
|
|
Return on Investment (ROI) (PBT/Networth) |
|
0.10 |
0.14 |
0.23 |
|
|
|
|
|
|
|
Debt Equity Ratio (Total Liability/Networth) |
|
1.03 |
0.88 |
0.59 |
|
|
|
|
|
|
|
Current Ratio (Current Asset/Current Liability) |
|
1.34 |
1.42 |
1.54 |
Total Liability = Short-term Debt + Long-term Debt + Current Maturities
of Long-term debts
FINANCIAL ANALYSIS
[all figures are
in Rupees Million]
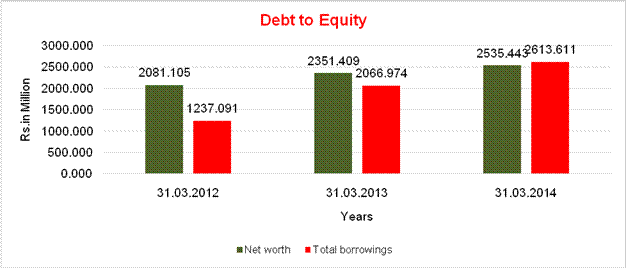
DEBT EQUITY RATIO
|
Particular |
31.03.2012 |
31.03.2013 |
31.03.2014 |
|
|
(Rs.
In Million) |
(Rs.
In Million) |
(Rs.
In Million) |
|
Share Capital |
860.693 |
860.693 |
860.693 |
|
Reserves & Surplus |
1220.412 |
1490.716 |
1674.750 |
|
Money received against share warrants |
0.000 |
0.000 |
0.000 |
|
Share Application money pending allotment |
0.000 |
0.000 |
0.000 |
|
Net
worth |
2081.105 |
2351.409 |
2535.443 |
|
|
|
|
|
|
Long-term borrowings |
22.825 |
20.528 |
15.532 |
|
Short term borrowings |
1206.367 |
1945.754 |
2487.234 |
|
CURRENT MATURITIES OF LONG-TERM DEBTS |
7.899 |
100.692 |
110.845 |
|
Total
borrowings |
1237.091 |
2066.974 |
2613.611 |
|
Debt/Equity ratio |
0.594 |
0.879 |
1.031 |
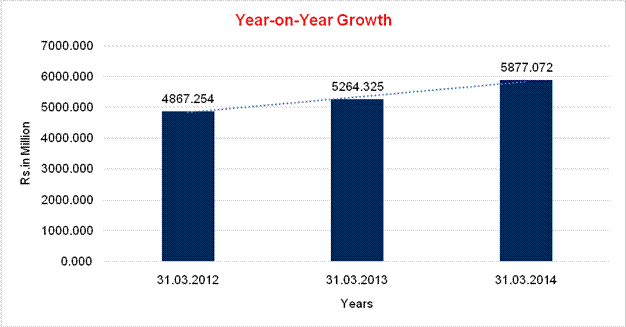
YEAR-ON-YEAR GROWTH
|
Year on Year Growth |
31.03.2012 |
31.03.2013 |
31.03.2014 |
|
|
(Rs.
In Million) |
(Rs.
In Million) |
(Rs.
In Million) |
|
Sales |
4867.254 |
5264.325 |
5877.072 |
|
|
|
8.158 |
11.640 |
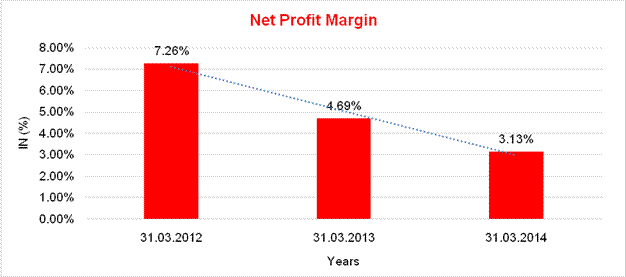
NET PROFIT MARGIN
|
Net Profit Margin |
31.03.2012 |
31.03.2013 |
31.03.2014 |
|
|
(Rs.
In Million) |
(Rs.
In Million) |
(Rs.
In Million) |
|
Sales |
4867.254 |
5264.325 |
5877.072 |
|
Profit |
353.386 |
247.052 |
184.034 |
|
|
7.26% |
4.69% |
3.13% |
LOCAL AGENCY FURTHER INFORMATION
|
Sr. No. |
Check list by
info agents |
Available in
Report (Yes/No) |
|
1 |
Year of establishment |
Yes |
|
2 |
Constitution of the entity -Incorporation
details |
Yes |
|
3 |
Locality of the entity |
Yes |
|
4 |
Premises details |
No |
|
5 |
Buyer visit details |
-- |
|
6 |
Contact numbers |
Yes |
|
7 |
Name of the person contacted |
Yes |
|
8 |
Designation of contact person |
Yes |
|
9 |
Promoter’s background |
Yes |
|
10 |
Date of Birth of Proprietor / Partners /
Directors |
Yes |
|
11 |
Pan Card No. of Proprietor / Partners |
Yes |
|
12 |
Voter Id Card No. of Proprietor / Partners |
No |
|
13 |
Type of business |
Yes |
|
14 |
Line of Business |
Yes |
|
15 |
Export/import details (if applicable) |
Yes |
|
16 |
No. of employees |
Yes |
|
17 |
Details of sister concerns |
Yes |
|
18 |
Major suppliers |
No |
|
19 |
Major customers |
No |
|
20 |
Banking Details |
Yes |
|
21 |
Banking facility details |
Yes |
|
22 |
Conduct of the banking account |
Yes |
|
23 |
Financials, if provided |
Yes |
|
24 |
Capital in the business |
Yes |
|
25 |
Last accounts filed at ROC, if applicable |
Yes |
|
26 |
Turnover of firm for last three years |
Yes |
|
27 |
Reasons for variation <> 20% |
-- |
|
28 |
Estimation for coming financial year |
Yes |
|
29 |
Profitability for last three years |
Yes |
|
30 |
Major shareholders, if available |
Yes |
|
31 |
External Agency Rating, if available |
Yes |
|
32 |
Litigations that the firm/promoter
involved in |
Yes |
|
33 |
Market information |
-- |
|
34 |
Payments terms |
Yes |
|
35 |
Negative Reporting by Auditors in the
Annual Report |
No |
------------------------------------------------------------------------------------------------------------------------------
LITIGATION DETAILS
|
HIGH COURT OF
BOMBAY |
|
CASE DETAILS BENCH: BOMBAY |
|
Presentation
Date: 27.01.2015 |
|
Lodging No: CPL/79/2015 Filing Date: 27.01.2015 Reg. No.: CP/420/2015 Reg. Date: 18.04.2015 |
|
Petitioner: TRANSPORT CORPORATION OF INDIA Respondent: SHREEM
ELECTRIC LTD. Petn. Adv : AJAY LAW ASSOCIATES (I8130) District: MUMBAI |
|
Bench: SINGLE Status: Pre-Admission
Category: COMPANY PETITION U/SEC 433, 434, 439 COMPANIES ACT Next Date: 08.06.2015
Stage: FOR ADMISSION [ORIGINAL SIDE MATTERS] Coram: HON’BLE SHRI JUSTICE S.C. GUPTE Last Date: 20.04.2015
Stage: FOR ACCEPTANCE Last Coram: HON’BLE SHRI JUSTICE S.J. KATHAWALLA |
|
Act: Companies Act & Rules 1956
UNDER SECTION: 433 434 |
------------------------------------------------------------------------------------------------------------------------------
UNSECURED LOANS
(RS.
IN MILLION)
|
PARTICULARS |
31.03.2014 |
31.03.2013 |
|
LONG-TERM BORROWINGS |
|
|
|
Deferred payment liabilities |
14.629 |
20.528 |
|
SHORT TERM BORROWINGS |
|
|
|
Deposits |
11.855 |
0.000 |
|
|
|
|
|
Total |
26.484 |
20.528 |
------------------------------------------------------------------------------------------------------------------------------
CALCULATION OF DEBT SERVICE COVERAGE RATIO
(RS.
IN MILLION)
|
PARTICULARS |
2014-15 Estimates |
2015-16 Projection |
|
|
|
|
|
Retained
Cash Accruals |
305.500 |
389.200 |
|
|
|
|
|
Interest
on TL / DPG (& Term deposit / Liabilities) |
25.000 |
25.000 |
|
|
|
|
|
Repayment
Obligations of TL / DPG |
229.700 |
82.600 |
|
|
|
|
|
Repayment
of Term deposits/ term liabilities |
-- |
-- |
|
|
|
|
|
Total
Repayment |
254.700 |
107.600 |
|
|
|
|
|
Net
Debt Service Coverage Ratio (DSCR) |
1.33 |
4.71 |
|
|
|
|
|
Gross
Debt Service Coverage Ratio (DSCR) |
1.30 |
3.85 |
|
|
|
|
|
Average
Net DSCR |
-- |
-- |
|
|
|
|
|
Average
Gross DSCR |
-- |
-- |
------------------------------------------------------------------------------------------------------------------------------
ASSESSMENT OF WORKING CAPITAL REQUIREMENTS
OPERATING STATEMENT
(RS. IN MILLION)
|
SR. NO. |
PARTICULARS |
2014-15 Estimates |
2015-16 Projection |
|
|
|
|
|
|
1 |
i.
Domestic Sale |
6182.300 |
6800.500 |
|
|
ii.
Export Sale |
260.200 |
286.200 |
|
|
iii.
Other Operating Income |
-- |
-- |
|
|
|
|
|
|
1 |
Total
Gross Sales |
6442.500 |
7086.800 |
|
|
|
|
|
|
2 |
Less
: Excise Duty |
205.000 |
225.500 |
|
|
|
|
|
|
3 |
Net
Sales (1-2) |
6237.500 |
6861.300 |
|
|
|
|
|
|
4 |
Growth
in sales |
8% |
10% |
|
|
|
|
|
|
|
Cost
of Sales |
|
|
|
5 |
a.
Raw Material (Imported) |
257.900 |
283.700 |
|
|
b.
Raw material (Indigenous) |
1169.600 |
1286.600 |
|
|
c.
Stores and Spares (Imported) |
-- |
-- |
|
|
d.
Stores and Spares (Indigenous) |
3289.200 |
3618.100 |
|
|
|
|
|
|
6 |
Power
and Fuel |
7.000 |
7.700 |
|
|
|
|
|
|
7 |
Direct
Labour |
190.000 |
209.000 |
|
|
|
|
|
|
8 |
Repairs
and Maintenance |
10.600 |
11.700 |
|
|
|
|
|
|
9 |
Other
Mfg. Expenses |
117.500 |
129.300 |
|
|
|
|
|
|
10 |
Depreciation
|
54.000 |
59.400 |
|
|
|
|
|
|
11 |
Others
expenses |
-- |
-- |
|
|
|
|
|
|
a |
Operating
expenses |
-- |
-- |
|
b |
|
-- |
-- |
|
c |
|
-- |
-- |
|
d |
|
-- |
-- |
|
|
Sub
Total |
5095.800 |
5605.400 |
|
|
|
|
|
|
12 |
Add:
Opening Stock in Process |
32.400 |
41.400 |
|
|
|
|
|
|
|
Sub
Total |
5128.200 |
5646.800 |
|
|
|
|
|
|
13 |
Deduct
: Closing Stock in Process |
41.400 |
47.400 |
|
|
|
|
|
|
|
Cost
of Production |
5086.800 |
5599.400 |
|
|
|
|
|
|
14 |
Add:
Opening Stock of Finished Goods |
86.000 |
94.100 |
|
|
|
|
|
|
|
Sub
Total |
5172.800 |
5693.500 |
|
|
|
|
|
|
15 |
Deduct
: Closing Stock OF Finished Goods |
94.100 |
97.100 |
|
|
|
|
|
|
|
Sub
Total ( Total Cost of Sales) |
5078.700 |
5596.400 |
|
|
|
|
|
|
16 |
Gross
profit |
1158.800 |
1264.900 |
|
|
|
|
|
|
|
Gross
Profit/ Sales |
18.58% |
18.43% |
|
|
|
|
|
|
17 |
Selling
Expenses |
117.500 |
126.000 |
|
|
|
|
|
|
18 |
Administrative
Expenses |
265.000 |
272.600 |
|
|
|
|
|
|
|
Sub
Total |
5461.200 |
5995.000 |
|
|
|
|
|
|
19 |
Operating
Profit before interest |
776.300 |
866.300 |
|
|
a.
Interest on CC. |
384.000 |
384.000 |
|
|
b.
Interest on TL / DPG |
25.000 |
25.000 |
|
|
c.
Other interests |
100.000 |
85.000 |
|
|
|
|
|
|
20 |
Total
Interest |
509.000 |
494.000 |
|
|
|
|
|
|
21 |
Operating
Profit after Interest |
267.300 |
372.300 |
|
|
|
|
|
|
22 |
Add:
Other non operating Income |
|
|
|
a |
Interest/Dividend/Royalties
etc. |
-- |
-- |
|
b |
Other
Income |
88.000 |
90.000 |
|
c |
|
-- |
-- |
|
d |
|
-- |
-- |
|
|
Sub
Total |
88.000 |
90.000 |
|
|
|
|
|
|
23 |
Deduct
other non operating expenses |
|
|
|
a |
Interest/Dividend/Royalties
etc. |
-- |
-- |
|
b |
Other
Expenses |
20.000 |
22.500 |
|
c |
Intangibles
written off -1 |
-- |
-- |
|
d |
interest
to partners |
-- |
-- |
|
e |
|
|
|
|
|
Sub
Total |
20.000 |
22.500 |
|
|
|
|
|
|
24 |
Net
of other non operating Income/Expenses |
68.000 |
67.500 |
|
|
|
|
|
|
25 |
Profit
before Tax /Loss (PBT) |
335.300 |
439.800 |
|
|
|
|
|
|
26 |
Provision
for Taxes |
83.800 |
109.900 |
|
|
|
|
|
|
27 |
Net
Profit/Loss (PAT) |
251.500 |
329.800 |
|
|
|
|
|
|
28 |
Cash
Accruals |
305.500 |
389.200 |
|
|
|
|
|
|
29 |
Dividend
paid + IT on Dividend |
-- |
-- |
|
|
|
|
|
|
30 |
Retained
Profit |
251.500 |
329.800 |
|
|
|
|
|
|
31 |
Retained
Cash Accruals |
305.500 |
389.200 |
------------------------------------------------------------------------------------------------------------------------------
ANALYSIS OF BALANCE SHEET
(RS. IN MILLION)
|
SR. NO. |
PARTICULARS |
2014-15 Estimates |
2015-16 Projection |
|
|
|
|
|
|
|
LIABILITIES |
|
|
|
|
CURRENT
LIABILITIES |
|
|
|
1 |
Short
Term loans from Applicant Bank
including BP and BD |
800.000 |
800.000 |
|
|
Short
Term loans From Other banks including BP and BD |
1200.000 |
1200.000 |
|
|
|
|
|
|
|
Sub Total (A) |
2000.000 |
2000.000 |
|
|
|
|
|
|
2 |
Short
Term Borrowings from Others (Ratnakar Bank/ Other Banks Corporate Loan/CC) |
350.000 |
350.000 |
|
|
|
|
|
|
3 |
Sundry
Creditors (Trade) |
2051.500 |
2273.000 |
|
|
|
|
|
|
4 |
Advance
Payment from Customers |
-- |
-- |
|
|
|
|
|
|
5 |
Net
Provision for Taxation (if positive) |
-- |
-- |
|
|
|
|
|
|
6 |
Dividend
Payable |
-- |
-- |
|
|
|
|
|
|
7 |
Other
Statutory Liab. (Due within one Year) |
-- |
-- |
|
|
|
|
|
|
8 |
Overdue
Term Liabilities |
-- |
-- |
|
|
|
|
|
|
9 |
Instalments
of term Loans/ DPGs due within next year |
82.600 |
148.800 |
|
|
|
|
|
|
10 |
Other
Current Liabilities and Provisions (due within one year) |
|
|
|
a |
Deposits
and advances |
-- |
-- |
|
b |
Provisions |
-- |
-- |
|
c |
|
-- |
-- |
|
d |
Sales
Tax Deferment |
-- |
-- |
|
|
|
|
|
|
11 |
Sub
Total (B) |
2484.100 |
2771.800 |
|
|
|
|
|
|
12 |
TOTAL
CURRENT LIABILITIES |
4484.100 |
4771.800 |
|
|
|
|
|
|
|
TERM
LIABILITIES |
|
|
|
13 |
Debentures
(not maturing within one Year) |
-- |
-- |
|
|
|
|
|
|
14 |
Ratnakar
Bank Term Loan |
-- |
-- |
|
|
|
|
|
|
15 |
Term
Loan from our Bank(Less next Year Instalments) |
-- |
-- |
|
|
|
|
|
|
15 a) |
Term
Loan from Other Banks / FIs.(Excl. Instal. due next year) Ratnakar Bank Term
Loan |
325.100 |
226.000 |
|
|
|
|
|
|
15 b) |
Deferred
Payment Guarantee/s (Excl. Instal. due next
Year) |
-- |
-- |
|
|
|
|
|
|
16 |
DTL |
-- |
-- |
|
|
|
|
|
|
17 |
Other
term Liabilities |
|
|
|
a |
Interest
free Sales Tax Loan (MEDA) |
-- |
-- |
|
b |
Security
Deposit |
-- |
-- |
|
c |
Compulsory
convertible debentures/Provisions |
-- |
-- |
|
|
|
|
|
|
18 |
TOTAL
TERM LIABILITIES |
325.100 |
226.000 |
|
|
|
|
|
|
19 |
TOTAL
OF OUTSIDE LIABILITIES |
4809.200 |
4997.800 |
|
|
|
|
|
|
|
NET
WORTH |
|
|
|
20 |
Share
Capital |
200.800 |
200.800 |
|
|
|
|
|
|
21 |
General
Reserve |
-- |
-- |
|
|
|
|
|
|
22 |
Revaluation
Reserve |
-- |
-- |
|
|
|
|
|
|
23 |
Adjustments
for previous Year costs |
-- |
-- |
|
|
|
|
|
|
24 |
Other
reserves (excluding Provisions) |
74.100 |
74.100 |
|
|
|
|
|
|
25 |
Others |
674.700 |
659.900 |
|
a |
CCPs |
659.900 |
659.900 |
|
b |
Share
Application Money |
-- |
-- |
|
c |
Share
Premium |
14.800 |
-- |
|
|
|
|
|
|
26 |
Surplus
(+) or deficit (-) in Profit and Loss a/c |
1884.400 |
2214.200 |
|
|
|
|
|
|
27 |
NET
WORTH |
2834.000 |
3149.000 |
|
|
|
|
|
|
28 |
TOTAL
LIABILITIES (18+24) |
7643.200 |
8146.800 |
|
|
|
|
|
|
|
ASSETS |
|
|
|
|
CURRENT
ASSETS |
|
|
|
1 |
Cash
and Bank Balances |
57.900 |
47.300 |
|
|
|
|
|
|
2 |
Govt.
and other Trustee securities |
-- |
-- |
|
|
|
|
|
|
3 |
Fixed
Deposits with Banks |
452.000 |
547.800 |
|
|
|
|
|
|
4 |
Domestic
Receivables including BP/BD |
3482.000 |
3752.300 |
|
|
|
|
|
|
5 |
Export
Receivables including BP/BD) |
-- |
-- |
|
|
|
|
|
|
6 |
Deferred
Receivables (due within one year) underlying for Ratnakar Bank WCTL |
850.000 |
850.000 |
|
|
|
|
|
|
7 |
Imported
Raw Material |
23.000 |
25.000 |
|
|
|
|
|
|
8 |
Indigenous
Raw material |
270.000 |
295.000 |
|
|
|
|
|
|
9 |
Stock
in Process |
41.400 |
47.400 |
|
|
|
|
|
|
10 |
Finished
Goods |
94.100 |
97.100 |
|
|
|
|
|
|
11 |
Imported
Consumables |
-- |
-- |
|
|
|
|
|
|
12 |
Indigenous
consumables |
-- |
-- |
|
|
|
|
|
|
13 |
Advances
to Suppliers |
170.000 |
187.000 |
|
|
|
|
|
|
14 |
Net
Advance Payment of Taxes (if positive) |
149.900 |
264.800 |
|
|
|
|
|
|
15 |
Other
Current Assets (specify major items) |
610.100 |
695.200 |
|
a |
Excise,
tie-up dep, others |
10.100 |
-- |
|
b |
Other
current assets |
-- |
-- |
|
c |
Deposits |
600.000 |
695.200 |
|
d |
|
|
|
|
16 |
TOTAL
CURRENT ASSETS |
6200.400 |
6808.900 |
|
|
|
|
|
|
|
FIXED
ASSETS |
|
|
|
17 |
Gross
Block (Land and Building, Machinery) |
1153.700 |
1209.100 |
|
|
|
|
|
|
18 |
Add
Capital expenditure in work-in-process |
-- |
-- |
|
|
|
|
|
|
19 |
Depreciation
to Date |
325.700 |
385.100 |
|
|
|
|
|
|
20 |
NET
BLOCK |
828.000 |
824.000 |
|
|
|
|
|
|
21 |
OTHER
NON CURRENT ASSETS |
|
|
|
a |
Investments
in Sub. cos./ affiliates |
-- |
-- |
|
|
|
|
|
|
b |
Investment
in Others |
0.100 |
0.100 |
|
|
|
|
|
|
c |
Advance
to suppliers of Capital goods and Contractors |
-- |
-- |
|
|
|
|
|
|
d |
Deferred
Receivables (Maturing after a year) |
459.500 |
424.600 |
|
|
|
|
|
|
e |
Other
Non-current investments |
-- |
-- |
|
|
|
|
|
|
f |
Non
Consumable Stores and Spares |
-- |
-- |
|
|
|
|
|
|
g |
Long
outstanding dues and Other non Current Assets /dues from Directors |
14.400 |
14.400 |
|
|
|
|
|
|
h |
Long
Term Trade Receivable + Advance tax |
132.200 |
66.200 |
|
|
|
|
|
|
i |
Deposits
with court/GOVT |
-- |
-- |
|
|
|
|
|
|
|
TOTAL
OTHER NON CURRENT ASSETS |
606.200 |
505.300 |
|
|
|
|
|
|
22 |
Intangible
Assets |
|
|
|
a |
Preliminary
Expenses |
8.600 |
8.600 |
|
b |
Deferred
Revenue expenditures |
-- |
-- |
|
c |
Other
Intangibles (patents, goodwill, etc.) |
-- |
-- |
|
d |
|
-- |
-- |
|
e |
|
-- |
-- |
|
23 |
Total
Intangible Assets |
8.600 |
8.600 |
|
|
|
|
|
|
24 |
TOTAL
ASSETS |
7643.200 |
8146.800 |
|
|
|
|
|
|
|
TANGIBLE
NET WORTH (TNW) |
2825.400 |
3140.400 |
|
|
NET
WORKING CAPITAL (NWC) |
1716.300 |
2037.100 |
|
|
|
|
|
|
|
Movement
of TNW |
|
|
|
|
Opening
TNW |
2529.000 |
2825.400 |
|
|
|
|
|
|
|
Plough
back of profit |
251.500 |
329.800 |
|
|
|
|
|
|
|
Increase
in capital/reserves |
47.000 |
(14.800) |
|
|
|
|
|
|
|
Intangibles
written off |
(2.200) |
-- |
|
|
|
|
|
|
|
Closing
TNW |
2825.400 |
3140.400 |
|
|
|
|
|
|
|
IMPORTANT
RATIOS: |
|
|
|
|
Current
Ratio |
1.38 |
1.43 |
|
|
|
|
|
|
|
Debt/Equity |
0.12 |
0.07 |
|
|
|
|
|
|
|
TOL/Equity |
1.70 |
1.59 |
|
|
|
|
|
|
|
Current
Assets/Tangible Assets |
81.21% |
83.67% |
|
|
|
|
|
|
|
ROCE
(PBDIT incl. Other income/TTA) |
11.77% |
12.20% |
|
|
|
|
|
|
|
Inventory
+ Receivables as days of Net Sales |
279 |
270 |
------------------------------------------------------------------------------------------------------------------------------
FUND FLOW ANALYSIS
(RS. IN MILLION)
|
SR. NO. |
PARTICULARS |
2014-15 Estimates |
2015-16 Projection |
|
|
|
|
|
|
1 |
LONG
TERM SOURCES |
|
|
|
|
Profit
after Tax |
251.500 |
329.800 |
|
|
|
|
|
|
|
Depreciation |
54.000 |
59.400 |
|
|
|
|
|
|
|
Intangibles
written off |
-- |
-- |
|
|
|
|
|
|
|
Increase
in capital and reserves |
47.000 |
-- |
|
|
|
|
|
|
|
Increase
in Term Liability |
95.700 |
-- |
|
|
i. Decrease in Fixed Assets |
-- |
-- |
|
|
ii.
Decrease in Other non-current assets |
484.200 |
100.900 |
|
|
|
|
|
|
2 |
LONG
TERM USES |
|
|
|
|
Net
Loss |
-- |
-- |
|
|
|
|
|
|
|
Increase
in Intangibles |
2.200 |
-- |
|
|
|
|
|
|
|
Decrease
in Capital and Reserves |
-- |
14.800 |
|
|
|
|
|
|
|
Decrease
in Term Liabilities |
-- |
99.100 |
|
|
i. Increase in Fixed Assets |
71.300 |
55.400 |
|
|
|
|
|
|
|
Increase
in non-Current Assets |
-- |
-- |
|
|
iii.
Increase in Intangibles |
-- |
-- |
|
|
|
|
|
|
|
Dividend
paid |
-- |
-- |
|
|
|
|
|
|
|
Surplus/
Deficit |
73.500 |
169.300 |
|
|
Short
Term Sources |
859.000 |
320.800 |
|
|
Increase
in Bank Borrowings |
-- |
-- |
|
|
|
|
|
|
|
Increase
in other Current Liabilities |
-- |
287.700 |
|
|
|
|
|
|
|
Decrease
in Inventory |
4.300 |
-- |
|
|
|
|
|
|
|
Decrease
in Receivables |
-- |
-- |
|
|
|
|
|
|
|
Decrease
in Cash/Deposits/Govt Sec. |
-- |
-- |
|
|
|
|
|
|
|
Decrease
in Other Current Assets |
-- |
-- |
|
|
Total |
4.300 |
287.700 |
|
|
|
|
|
|
|
Short
Term Uses |
|
|
|
|
Increase
in Inventory |
-- |
36.000 |
|
|
|
|
|
|
|
Increase
in Receivables |
102.500 |
270.300 |
|
|
|
|
|
|
|
Increase
in Cash/Deposits/Govt Sec. |
68.700 |
85.200 |
|
|
|
|
|
|
|
Increase in Other Current Assets |
517.000 |
217.000 |
|
|
|
|
|
|
|
Decrease
in Other Current Liabilities |
3.100 |
-- |
|
|
|
|
|
|
|
Decrease
in Bank Borrowings |
172.000 |
-- |
|
|
Total |
863.300 |
608.500 |
|
|
|
|
|
|
|
SUMMARY
OF FUND FLOW ANALYSIS |
|
|
|
|
Long
Term Sources |
932.500 |
490.100 |
|
|
|
|
|
|
|
Long
Term Uses |
73.500 |
169.300 |
|
|
|
|
|
|
|
Surplus
/Deficit (i-ii) |
859.000 |
320.800 |
|
|
|
|
|
|
|
Short
term sources |
4.300 |
287.700 |
|
|
|
|
|
|
|
Short
term uses |
863.300 |
608.500 |
|
|
|
|
|
|
|
Surplus
/Deficit (iii-iv) |
(859.000) |
(320.800) |
------------------------------------------------------------------------------------------------------------------------------
COMPARATIVE STATEMENT OF CURRENT ASSETS
& CURRENT LIABILITIES
WORKING CAPITAL / BANK
BORROWING ASSESSMENTS
(RS. IN MILLION)
|
SR. NO. |
PARTICULARS |
2014-15 Estimates |
2015-16 Projection |
|
|
|
|
|
|
A. |
WORKING CAPITAL ASSESSMENT |
|
|
|
|
Stock
of Imported RM - Days Consumption |
33 |
32 |
|
|
|
|
|
|
|
Stock
of Indigenous RM - Days Consumption |
84 |
84 |
|
|
|
|
|
|
|
Imported
Consumables - (Days Consumption) |
-- |
-- |
|
|
|
|
|
|
|
Indigenous
Consumables - (Days Consumption) |
-- |
-- |
|
|
|
|
|
|
|
Stock
in process- (Days of Cost of
Production) |
3 |
3 |
|
|
|
|
|
|
|
Finished
Goods - (Days Cost of Sales) |
7 |
6 |
|
|
|
|
|
|
|
Total
Inventory |
428.500 |
464.500 |
|
|
Total
Inventory/Sales (days) |
25 |
25 |
|
|
|
|
|
|
|
Domestic
receivables (Days Gross dom. Sales) |
206 |
201 |
|
|
Export
Receivables - (Days Exports) |
-- |
-- |
|
|
|
|
|
|
|
Total
Receivables |
3482.000 |
3752.300 |
|
|
Total
Receivables/Gross Sales (days) |
197 |
193 |
|
|
|
|
|
|
|
Creditors
- (days Consumption) |
159 |
160 |
|
|
|
|
|
|
|
Total
Current Assets |
6200.400 |
6808.900 |
|
|
|
|
|
|
|
FINANCED
BY |
|
|
|
|
Sundry
Cr. % of Current Assets |
33.09% |
33.38% |
|
|
Other
Current Liabilities % of Current Assets |
6.98% |
7.33% |
|
|
Bank
Finance % of Current Assets |
32.26% |
29.37% |
|
|
NWC
% to Current Assets |
27.68% |
29.92% |
|
|
|
|
|
|
|
BY
PBS METHOD |
|
|
|
|
Total
Current assets |
6200.400 |
6808.900 |
|
|
Other
Current Liabilities |
2484.100 |
2771.800 |
|
|
Working
Capital gap |
3716.300 |
4037.100 |
|
|
Net
Working capital |
1716.300 |
2037.100 |
|
|
Bank
Finance |
2000.000 |
2000.000 |
------------------------------------------------------------------------------------------------------------------------------
RATIOS
(RS. IN MILLION)
|
SR. NO. |
PARTICULARS |
2014-15 Estimates |
2015-16 Projection |
|
|
|
|
|
|
1 |
Growth
in Sales |
8% |
10% |
|
|
|
|
|
|
2 |
Gross
Profit Ratio |
18.58% |
18.43% |
|
|
|
|
|
|
3 |
PBDIT |
898.300 |
993.200 |
|
|
|
|
|
|
4 |
PBDIT/sales |
14.40% |
14.48% |
|
|
|
|
|
|
5 |
Operating
Profits/Sales |
4.29% |
5.43% |
|
|
|
|
|
|
6 |
PBT/Sales |
5.38% |
6.41% |
|
|
|
|
|
|
7 |
PAT/Sales |
4.03% |
4.81% |
|
|
|
|
|
|
8 |
Cash
Accruals/ Sales |
4.90% |
5.67% |
|
|
|
|
|
|
9 |
Sales/Equity |
2.21 |
2.18 |
|
|
|
|
|
|
10 |
Sales
/ TTA |
0.82 |
0.84 |
|
|
|
|
|
|
11 |
Interest
Coverage (Interest/PBDIT) |
65.56% |
57.03% |
|
|
|
|
|
|
12 |
PBDIT
/ Interest (Times) |
1.76 |
2.01 |
|
|
|
|
|
|
13 |
Deferred
Debt/ Equity |
0.12 |
0.07 |
|
|
|
|
|
|
14 |
TOL/Equity |
1.70 |
1.59 |
|
|
|
|
|
|
15 |
Current
Ratio (CA / CL) |
1.38 |
1.43 |
|
|
|
|
|
|
16 |
Current
Ratio excluding TL Instalments |
1.41 |
1.47 |
|
|
|
|
|
|
17 |
CA
/ TTA (%) |
81.21% |
83.67% |
|
|
|
|
|
|
18 |
Inventory
+ Receivables as days of Net Sales |
279 |
270 |
|
|
|
|
|
|
19 |
Bank
Borrowings/Current Assets |
32.26% |
29.37% |
|
|
|
|
|
|
20 |
RM
content in sales |
75.41% |
75.52% |
|
|
|
|
|
|
21 |
ROCE
(PBDIT incl. Other income/TTA) |
11.77% |
12.20% |
------------------------------------------------------------------------------------------------------------------------------
KEY INDICATORS
(RS. IN MILLION)
|
PARTICULARS |
2014-15 Estimates |
2015-16 Projection |
|
|
|
|
|
Net
Sales |
6237.500 |
6861.300 |
|
|
|
|
|
Operating
Profit |
267.300 |
372.300 |
|
|
|
|
|
(Net)
Other income |
68.000 |
67.500 |
|
|
|
|
|
PBDIT/Sales |
14.40% |
14.48% |
|
|
|
|
|
PBT/Sales
|
5.38% |
6.41% |
|
|
|
|
|
PAT |
251.500 |
329.800 |
|
|
|
|
|
PAT/Net
Sales |
4.03% |
4.81% |
|
|
|
|
|
Cash
Accruals |
305.500 |
389.200 |
|
|
|
|
|
Cash
Accruals/Sales |
4.90% |
5.67% |
|
|
|
|
|
Paid
up Capital (PUC) |
200.800 |
200.800 |
|
|
|
|
|
TNW
|
2825.400 |
3140.400 |
|
Adjusted
TNW (TNW-Investment in associates) |
2825.400 |
3140.400 |
|
|
|
|
|
TOL/TNW |
1.70 |
1.59 |
|
TOL/Adjusted
TNW |
1.70 |
1.59 |
|
|
|
|
|
C/R |
1.38 |
1.43 |
|
C/R
excluding T/L instalments due in 1 yr |
1.41 |
1.47 |
|
|
|
|
|
NWC |
1716.300 |
2037.100 |
|
NWC
including T/L instalments due in 1 yr |
1798.900 |
2185.900 |
|
|
|
|
|
Net
Sales/TTA (Times) |
0.82 |
0.84 |
|
|
|
|
|
PBT/TTA
(%) |
4.39% |
5.40% |
|
|
|
|
|
Operating
costs/ sales (%) |
95.71% |
94.57% |
|
|
|
|
|
Bank
Finance / Current Assets (%) |
32.26% |
29.37% |
|
|
|
|
|
Inv
+ Rec. /N.S. (DAYS) |
279 |
270 |
|
|
|
|
|
NWC
/ CA (%) |
27.68% |
29.92% |
|
|
|
|
|
PAT
/ Operating Income (%) |
2.62% |
3.50% |
|
|
|
|
|
Retained
Profit / Total Assets (%) |
3.29% |
4.05% |
|
|
|
|
|
Net
Cash Accruals / Total Debt (%) |
6.35% |
7.79% |
------------------------------------------------------------------------------------------------------------------------------
PERFORMANCE AND FINANCIAL INDICATORS
(RS. IN MILLION)
|
SR. NO. |
PARTICULARS |
2014-15 Estimates |
2015-16 Projection |
|
|
|
|
|
|
1 |
Net
Sales |
6237.500 |
6861.300 |
|
|
|
|
|
|
2 |
Exports |
260.200 |
286.200 |
|
|
|
|
|
|
3 |
Operating
Profit |
267.300 |
372.300 |
|
|
|
|
|
|
4 |
PBT |
335.300 |
439.800 |
|
|
|
|
|
|
5 |
PBT/Sales
(%) |
5.38 |
6.41 |
|
|
|
|
|
|
6 |
PAT |
251.500 |
329.800 |
|
|
|
|
|
|
7 |
Cash
Accruals |
305.500 |
389.200 |
|
|
|
|
|
|
8 |
PBDIT |
898.300 |
993.200 |
|
|
|
|
|
|
9 |
PUC |
200.800 |
200.800 |
|
|
|
|
|
|
10 |
TNW |
2825.400 |
3140.400 |
|
|
|
|
|
|
11 |
Adjusted
TNW |
2825.400 |
3140.400 |
|
|
|
|
|
|
12 |
TOL/TNW |
1.70 |
1.59 |
|
|
|
|
|
|
13 |
TOL/
Adjusted TNW |
1.70 |
1.59 |
|
|
|
|
|
|
14 |
Total
C.A. |
6200.400 |
6808.900 |
|
|
|
|
|
|
15 |
Current
Ratio |
1.38 |
1.43 |
|
|
|
|
|
|
16 |
NWC |
1716.300 |
2037.100 |
------------------------------------------------------------------------------------------------------------------------------
NETWORTH OF THE DIRECTORS OF SHREEM ELECTRIC
LIMITED
(RS. IN MILLION)
|
SR. NO. |
NAME OF DIRECTORS |
AMOUNT AS ON 31.03.2014 |
|
|
|
|
|
1 |
Mr. Shahaji Ramchandra Jagadale |
330.082 |
|
|
|
|
|
2 |
Mrs. Hema S. Jagadale |
253.577 |
|
|
|
|
|
3 |
Mr. Vikas Shahaji Jagadale |
187.941 |
|
|
|
|
|
4 |
Mr. Vishal Shahaji Jagadale |
191.104 |
------------------------------------------------------------------------------------------------------------------------------
COMPANY PROFILE
BRIEF HISTORY
Shreem Electric Limited (Shreem) is a Pioneer in Reactive Power
Compensation and feeding reactive power to Nation’s Grid since 1976. The
company manufactures a wide range of medium and high voltage equipments like
capacitors, circuit breakers, instrument transformers, control & relay
panels, lightening arrestors and other measuring / monitoring devices. Shreem
also offers turnkey solutions for capacitor banks and substations across
various voltage classes
Over the years, Shreem has not only developed manufacturing capabilities
in capacitor and other equipments, but also specialized in project management,
product installation and service network.
Shreem enjoys around 40 percent market share in domestic capacitor
market and has created Shreem brand in capacitor manufacturing in Indian and
Overseas market. Shreem supplies to around 35 countries globally.
In addition, Shreem has successfully engineered more than 300
substations from 12 kv to 400 kv class. Technical Collaboration with GE Energy,
USA is yet another feather in Shreem’s cap. Shreem has attained expertise in
manufacturing in several other products also such as Switch Gears, C&R
Panels, and Lightening Arrestors.
There have been some benchmarks, for instance, in 1988, the Company
began exporting to all over the world. In 2000, Shreem received the ISO
certification. Further, in 2009, the Company has achieved the status of $75
million power company.
The existing facilities of the Company are as follows:
|
SR. NO. |
NAME OF UNIT |
LOCATION |
LAND (ACRES) |
TYPE OF
OWNERSHIP OF LAND |
BUILDING
CONST’ED (SQ.
FT.) |
PRODUCTS MANUFACTURED |
|
1 |
Shreem
Electric Limited (S-I) |
Plot No. 43 to
46 , L.K. Akiwate
Ind. Estate, Jaysingpur, Tal. Shirol, Dist. Kolhapur. |
0.88 Acre |
Leased from L K
Akiwate Industrial Estate |
13596.44 Sq. Ft. |
H.T./L.T.
Capacitors |
|
2 |
Shreem Electric
Limited (S-II) |
Plot No. 3, Gat no.
418/2, L.K. Akiwate Industrial Estate, Jaysingpur, Tal. Shirol, Dist.
Kolhapur. |
0.53 Acre |
Leased from L K
Akiwate Industrial Estate |
4172.21 Sq. Ft. |
APFC Panel |
|
3 |
Shreem Electric
Limited (S-III) |
Gat no.
311, Mouje Agar, Tal. Shirol, Dist. Kolhapur. |
3.5 Acre |
Owned |
22488.72 Sq. Ft. |
L.T. Capacitors,
Lighting Arrestors |
|
4 |
Shreem Electric
Limited (S-IV) |
Gat no. 315/B,
259,260,261; Mouje Agar, Tal. Shirol, Dist. Kolhapur. |
12.73 Acre |
Owned |
30859.68 Sq. Ft. |
Switchgears,
Series Reactors and CT/PT |
For last more than a decade, Shreem has executed turnkey projects of
capacitor banks and substations across various voltage class. With the help of
in-house manufacturing, Shreem would be able to complete backward integration
and capture the margins.
The Company has bagged “Excellence in Quality Award” from G.E. Energy
(USA) in the year 2008-09.The company has a large manufacturing base in
Kolhapur and project offices in most states across India.
Government of Maharashtra has awarded Mega Unit Status to Shreem in
2011. The said status gives following benefits to the Company:
· Tax benefits:
· Stamp duty waiver
The major customers of the Company are State Electricity Boards, Railways
and Power Grid Corporation. The Company receives repeat orders as well as fresh
orders from these customers by maintaining the quality of product/ service at
competitive prices.
Considering Shreem’s strong market standing, business potential, in October
2010, Fidelity Growth Partners India (FGPI) invested Rs.660.000 Million with a
minority stake in the company.
Owing to its experience, the Company is confident of significant growth
potential and wants to expand. Proposed expansion will enable Shreem to create
product-wise manufacturing facility for HT Capacitors, Lightening Arrestors,
Switchgears, Panels and Sheet Metal, Structures, Instrument Transformers and
Reactors. Expansion will help Shreem to consolidate manufacturing activity.
Separate plants will enhance productivity, efficiency, quality and product
delivery on time. It will further improve customer confidence and ensure repeat
orders.
------------------------------------------------------------------------------------------------------------------------------
VALUATION REPORT
(GENERAL DETAILS)
The site of Shreem Electric Limited Registered Office at Plot Nos. 43 to
46, L.K. Akiwate Cooperative Industrial Estate, Jaisingpur, Tal- Shirol,
District Kolhapur on 09th February 2012 for the Valuation of the
Fixed Assets (Flats) at Flat Nos. 313
and 314, 3rd Floor, Embassy Centre, Municipal No. 71/58, Crescent
Road, BBMP Ward No. 77 PID No. 77-107-71/58, Bangalore as requested by the
General Manager (Finance and Purchase). The Valuation Report is as under:
|
SR. NO. |
DESCRIPTION |
VALUATION IN RS. IN MILLION |
|
|
|
|
|
1 |
Valuation of immovable property as Flat Nos. 313 and 314 |
10.002 |
|
|
|
|
|
|
TOTAL OF ASSETS |
10.002 |
Grand Total Valuation (Summery) of the property (Flats) is Rs. 10.002 Million.
The Distressed Value will be
more than Rs. 9.502 Million as the
location is at the Heart of Metro City.
------------------------------------------------------------------------------------------------------------------------------
VALUATION REPORT
(GENERAL DETAILS)
The site of Shreem Electric Limited Registered Office at Plot Nos. 43 to
46, L.K. Akiwate Cooperative Industrial Estate, Jaisingpur, Tal- Shirol,
District Kolhapur on 04th February 2012 for the Valuation of the
Fixed Assets (Land and Buildings) at C.S.
No. 7596, Sahyadrinagar, Near SBI Colony, Sangli as requested by the
General Manager (Finance and Purchase). The Valuation Report is as under:
|
SR. NO. |
DESCRIPTION |
VALUATION IN RS. IN MILLION |
|
|
|
|
|
1 |
Valuation of immovable property as Land (C.S. o. 7596) |
5.176 |
|
|
|
|
|
2 |
Valuation of immovable property as Buildings on C.S. No. 7596 |
4.800 |
|
|
|
|
|
|
TOTAL OF ASSETS |
9.976 |
Grand Total Valuation (Summery) of the property (Land and Buildings) is Rs. 9.976 Million.
The Distressed Value will be
more than Rs. 4.917 Million.
------------------------------------------------------------------------------------------------------------------------------
VALUATION REPORT
(GENERAL DETAILS)
The site of Shreem Electric Limited Registered Office at Plot Nos. 43 to
46, L.K. Akiwate Cooperative Industrial Estate, Jaisingpur, Tal- Shirol,
District Kolhapur on 05th February 2012 for the Valuation of the
Fixed Assets (Land) at Plot No. 33,
Kashi-Laxmi Sahakari Gruh Nirman Sanstha Maryadit, Kupwad, Tal. Miraj, Dist.
Sangli as requested by the General Manager (Finance and Purchase). The
Valuation Report is as under:
|
SR. NO. |
DESCRIPTION |
VALUATION IN RS. IN MILLION |
|
|
|
|
|
1 |
Valuation of immovable property as Land (Plot No. 33) |
2.075 |
|
|
|
|
|
|
TOTAL OF ASSETS |
2.075 |
Grand Total Valuation (Summery) of the property (Land) is Rs. 2.075 Million.
------------------------------------------------------------------------------------------------------------------------------
VALUATION REPORT
(GENERAL DETAILS)
The site of Shreem Electric Limited Registered Office at Plot Nos. 43 to
46, L.K. Akiwate Cooperative Industrial Estate, Jaisingpur, Tal- Shirol,
District Kolhapur on 04th February 2012 for the Valuation of the
Fixed Assets (Land and Buildings) at Gat
No. 371/2B, Plot No. 22, Shantiban Colony, Vishrambag, Sangli as requested
by the General Manager (Finance and Purchase). The Valuation Report is as
under:
|
SR. NO. |
DESCRIPTION |
VALUATION IN RS. IN MILLION |
|
|
|
|
|
1 |
Valuation of immovable property as Land (Gat No. 371/2B, Plot No.22) |
2.070 |
|
|
|
|
|
2 |
Valuation of immovable property as Buildings on Gat No. 371/2B, Plot
No. 22 |
2.482 |
|
|
|
|
|
|
TOTAL OF ASSETS |
4.552 |
Grand Total Valuation (Summery) of the property (Land and Buildings) is Rs. 4.552 Million.
------------------------------------------------------------------------------------------------------------------------------
VALUATION REPORT
(GENERAL DETAILS)
The site of Shreem Electric Limited Registered Office at Plot Nos. 43 to
46, L.K. Akiwate Cooperative Industrial Estate, Jaisingpur, Tal- Shirol,
District Kolhapur on 06th February 2012 for the Valuation of the
Fixed Assets (Land and Foundation Work) at Gat
No. 260, A/P Mouje Agar, Tal Shirol, District Kolhapur as requested by the
General Manager (Finance and Purchase). The Valuation Report is as under:
|
SR. NO. |
DESCRIPTION |
VALUATION IN RS. IN MILLION |
|
|
|
|
|
1 |
Valuation of immovable property as Land with foundation work (Gat No.
260) |
39.290 |
|
|
|
|
|
|
TOTAL OF ASSETS |
39.290 |
Grand Total Valuation (Summery) of the property (Land and Buildings,
Plant and Machinery) is Rs. 39.290
Million.
------------------------------------------------------------------------------------------------------------------------------
VALUATION REPORT
(GENERAL DETAILS)
The site of Shreem Electric Limited Registered Office at Plot Nos. 43 to
46, L.K. Akiwate Cooperative Industrial Estate, Jaisingpur, Tal- Shirol,
District Kolhapur on 05th February 2012 for the Valuation of the
Fixed Assets (Land and Buildings, Plant and Machinery) at Plot Nos. 43 to 46 and 52, L.K. Akiwate Cooperative Industrial Estate,
Jaisingpur, Tal- Shirol, District Kolhapur as requested by the General
Manager (Finance and Purchase). The Valuation Report is as under:
|
SR. NO. |
DESCRIPTION |
VALUATION IN RS. IN MILLION |
|
|
|
|
|
1 |
Valuation of immovable property as Land (Plot No. 43 to 46 and 52) |
15.934 |
|
|
|
|
|
2 |
Valuation of immovable property as Buildings on Plot No. 43 to 46 |
26.716 |
|
|
|
|
|
3 |
Valuation of immovable property as Buildings on Plot No. 52 |
3.300 |
|
|
|
|
|
4 |
Valuation of Plant and Machinery on Plot Nos. 43 to 46 |
64.526 |
|
|
|
|
|
|
TOTAL OF ASSETS |
110.476 |
Grand Total Valuation (Summery) of the property (Land and Buildings,
Plant and Machinery) is Rs. 110.476
Million.
------------------------------------------------------------------------------------------------------------------------------
VALUATION REPORT
(GENERAL DETAILS)
The Site of Shreem Electric Limited Registered Office at Plot Nos. 43 to
46, L.K. Akiwate Cooperative Industrial Estate, Jaisingpur, Tal- Shirol,
District Kolhapur on 05th February 2012 for the Valuation of the
Fixed Assets (Land) at Plot No. 35,
Kashi-Laxmi Sahakari Gruh Nirman Sanstha Maryadit, Kupwad, Tal. Miraj, District
Sangli as requested by the General Manager (Finance and Purchase). The
Valuation Report is as under:
|
SR. NO. |
DESCRIPTION |
VALUATION IN RS. IN MILLION |
|
|
|
|
|
1 |
Valuation of immovable property as Land (Plot No. 35) |
1.814 |
|
|
|
|
|
|
TOTAL OF ASSETS |
1.814 |
Grand Total Valuation (Summary) of the property (Land) is Rs. 1.814 Million.
------------------------------------------------------------------------------------------------------------------------------
VALUATION REPORT
(GENERAL DETAILS)
The Windfarm site of Shreem Electric Limited at 65, 66, Kondameedipalli Village in Kolimigundla Mandal, Kurnool
District, Andhra Pradesh, for the Valuation of the Wind Mills as per the
request by Mr. Jagadale. The Valuation Report is as under:
|
SR. NO. |
DESCRIPTION |
VALUATION IN RS. IN MILLION |
|
|
|
|
|
1 |
Land and Foundations |
14.880 |
|
|
|
|
|
2 |
Wind Mills |
85.000 |
|
|
|
|
|
|
TOTAL |
99.880 |
The Fair Market Value comes
to Rs. 99.880 Million.
The Distressed Value will be Rs. 94.900 Million.
------------------------------------------------------------------------------------------------------------------------------
VALUATION REPORT
(GENERAL DETAILS)
The Windfarm site of Shreem Electric Limited at S. Nos. 50, 51, 52 and 58, Karpewadi Village (Gude Pachgani), Tal-
Patan, District Satara, for the Valuation of the Wind Mills as per the
request by Mr. Jagadale. The Valuation Report is as under:
|
SR. NO. |
DESCRIPTION |
VALUATION IN RS. IN MILLION |
|
|
|
|
|
1 |
Land and Foundations |
15.820 |
|
|
|
|
|
2 |
Wind Mills |
164.000 |
|
|
|
|
|
|
TOTAL |
179.820 |
The Fair Market Value comes
to Rs. 179.820 Million.
The Distressed Value will be Rs. 170.800 Million.
------------------------------------------------------------------------------------------------------------------------------
VALUATION REPORT
(GENERAL DETAILS)
The Windfarm site of Shreem Electric Limited at S. Nos. 134, 139, 140, 141, 143 and 144, Matrewadi Village, Dhankewadi
of Main Village, Kalgaon, Tal- Patan, District Satara, for the Valuation of
the Land and Wind Mills as per the request by Mr. Jagadale. The Valuation
Report is as under:
|
SR. NO. |
DESCRIPTION |
VALUATION IN RS. IN MILLION |
|
|
|
|
|
1 |
Land and Foundations |
12.710 |
|
|
|
|
|
2 |
Wind Mills |
44.000 |
|
|
|
|
|
|
TOTAL |
56.710 |
The Fair Market Value comes
to Rs. 56.710 Million.
The Distressed Value will be Rs. 53.875 Million.
------------------------------------------------------------------------------------------------------------------------------
VALUATION REPORT
(GENERAL DETAILS)
The Site of Shreem Electric Limited Registered Office at Plot Nos. 43 to
46, L.K. Akiwate Cooperative Industrial Estate, Jaisingpur, Tal- Shirol,
District Kolhapur on 07th February 2012 for the Valuation of the
Fixed Assets (Land and Buildings, Plant and Machinery) at Gat No. 311, A/P Mouje Agar, Tal Shirol, District Kolhapur as
requested by the General Manager (Finance and Purchase). The Valuation Report
is as under:
|
SR. NO. |
DESCRIPTION |
VALUATION IN RS. IN MILLION |
|
|
|
|
|
1 |
Valuation of immovable property as Land (Gat No. 311) |
60.893 |
|
|
|
|
|
2 |
Valuation of immovable property as Buildings on Gat No. 311 |
34.386 |
|
|
|
|
|
3 |
Valuation of Plant and Machinery on Gat No. 311 |
25.014 |
|
|
|
|
|
|
TOTAL OF ASSETS |
120.293 |
Grand Total
Valuation (Summary) of the Property (Land and Buildings) is Rs. 120.293 Million.
------------------------------------------------------------------------------------------------------------------------------
VALUATION REPORT
(GENERAL DETAILS)
The Site of Shreem Electric Limited Registered Office at Plot Nos. 43 to
46, L.K. Akiwate Cooperative Industrial Estate, Jaisingpur, Tal- Shirol,
District Kolhapur on 06th February 2012 for the Valuation of the
Fixed Assets (Land and Buildings) at Gat
No. 315/B, A/P Mouje Agar, Tal Shirol, District Kolhapur as requested by
the General Manager (Finance and Purchase). The Summary Valuation Report is as
under:
|
SR. NO. |
DESCRIPTION |
VALUATION IN RS. IN MILLION |
|
|
|
|
|
1 |
Valuation of immovable property as Land (Gat No. 315/B) |
33.639 |
|
|
|
|
|
2 |
Valuation of immovable property as Buildings on Gat No. 315/B |
21.502 |
|
|
|
|
|
|
TOTAL OF ASSETS |
55.141 |
Grand Total
Valuation (Summary) of the Property (Land and Buildings) is Rs. 55.141 Million.
------------------------------------------------------------------------------------------------------------------------------
VALUATION REPORT
(GENERAL DETAILS)
The Windfarm site of Shreem Electric Limited at HTSC – 951 (Phase I) and HTSC-983 (Phase II), S.F. No. 252 and 194/1 of
Chinakampalayam Village, Tal Dharmapuram, District Erode, Tamilnadu, for
the Valuation of the Wind Mills as per the request by Mr. Jagadale. The
Valuation Report is as under:
|
SR. NO. |
DESCRIPTION |
VALUATION IN RS. IN MILLION |
|
|
|
|
|
1 |
Land and Foundations |
10.500 |
|
|
|
|
|
2 |
Wind Mills |
78.000 |
|
|
|
|
|
|
TOTAL |
88.500 |
The Fair Market Value comes
to Rs. 88.500 Million.
------------------------------------------------------------------------------------------------------------------------------
INDEX OF CHARGES
|
S.NO. |
CHARGE ID |
DATE OF CHARGE CREATION/MODIFICATION |
CHARGE AMOUNT SECURED |
CHARGE HOLDER |
ADDRESS |
SERVICE REQUEST NUMBER (SRN) |
|
1 |
10514471 |
26/02/2015 * |
350,000,000.00 |
SBERBANK |
UPPER GROUND FLOOR, GOPAL DAS BHAWAN, 28,,
BARAKHAMBA ROAD, CONNAUGHT PLACE, NEW DELHI, DELHI - 110001, INDIA |
C49843410 |
|
2 |
10467841 |
31/10/2013 |
6,895,000.00 |
ICICI BANK LIMITED |
BAGAL CHOWK, RAJARAMPURI, KOLHAPUR,
MAHARASHTRA - |
B92617034 |
|
3 |
10460452 |
26/02/2015 * |
150,000,000.00 |
THE RATNAKAR BANK LIMITED |
SHAHUPURI, KOLHAPUR, KOLHAPUR, MAHARASHTRA -
416001, INDIA |
C47600994 |
|
4 |
10444422 |
29/06/2013 |
15,069,239.00 |
ICICI BANK LIMITED |
BAGAL CHOWK, RAJARAMPURI, KOLHAPUR,
MAHARASHTRA - |
B82784828 |
|
5 |
10430385 |
28/05/2013 |
120,000,000.00 |
THE RATNAKAR BANK LIMITED |
SANGLI MAIN BRANCH, VAKHARBHAG, SANGLI,
MAHARASHTRA - 416416, INDIA |
B76838275 |
|
6 |
10425020 |
22/03/2013 |
100,000,000.00 |
STATE BANK OF INDIA INDUSTRIAL FINANCE
BRANCH |
TARA CHAMBERS,2ND FLOOR,NEAR MARIAAIPOLICE
CHOWKY, OLD PUNE MUMBAI HIGHWAY,WAKDEWADI, PUNE, MAHARASHTRA - 411003,
INDIA |
B74904715 |
|
7 |
10309471 |
30/08/2011 |
3,500,000.00 |
HDFC BANK LIMITED |
HDFC BANK HOUSE, SENAPATI BAPAT MARG, LOWER
PAREL W, MUMBAI, MAHARASHTRA - 400013, INDIA |
B22231898 |
|
8 |
10191641 |
26/12/2014 * |
9,150,000,000.00 |
SBICAP TRUSTEE COMPANY LIMITED |
202, MAKER TOWER, 'E', CUFFE PARADE,
COLABA, MUMBAI, MAHARASHTRA - 400005, INDIA |
C47452354 |
* Date of charge modification
------------------------------------------------------------------------------------------------------------------------------
COMPANY BACKGROUND
Subject was incorporated on 2 January 1976 in the name of Shreem
Capacitors Private Limited. On 30 December 2009 the Company changed its name to
Shreem Electric Private Limited from Shreem Capacitors Private Limited. On 26
February 2010 the Company was converted into a Public Limited Company - Shreem
Electric Limited. The Company has its registered office, factory and in-house
Research and Development (R & D) centre located in Jaysingpur, District
Kolhapur. The Company is involved in the business of manufacturing High
Voltage/Low Voltage capacitors, capacitor banks, breakers, control panels,
substation structures and executing turnkey projects for electricity
transmission and distribution sector.
YEAR IN RETROSPECT:
The
Company reinforced its current domestic leadership role in the Power Sector’s
Capacitor / Reactive Power Compensation Market during the year and made a
strong and ebullient presence in the turnkey project field also in the State
Electricity utilitarian establishments. The Company is eminently placed in the
multifarious aspects of project execution in creating state of the art
substation projects up to 400 KV systems, and is engaged in multiproduct
manufacturing for the Transmission and Distribution equipment.
In
the financial year 2013-14, the Company could cross the earlier bench mark of
Rs. 216.760 Million to Rs. 285.661 Million, covering over 38 countries, in the
exports sphere. Continuing its focus on globalization, Company has achieved
consistent growth in its exports. The Company participated in many global
exhibitions on power sector industry during the year and received manifold
responses, including many new, important and valuable orders in the target
markets, where even planned projects are often being put on slow execution path
in the current context. Export enquiries and orders are flowing from multiple
international market sources. Therefore, the Company has significantly upped
the immediate goal for exports to an ambitious Rs. 350.000 Million in the
current financial year.
The
Company expanded the scope and capabilities of its activities and vastly
diversified its product range. The Company’s Switchgears and 33 KV Vacuum
Circuit Breakers activity is further enlarged by adding indoor 11 KV Vacuum
Circuit Breakers, besides capacitor switches. As part of new expansion are LBS,
Lightning Arresters and Dry Type Series Reactors, all made for 11 KV to 33 KV.
The Structure Division is quite active, providing valuable services employing
its CNC machines. The Capacitor Division has consolidated at new place with
large area.
PERFORMANCE (FINANCIAL AND OPERATIONAL)
REVIEW:
The
performance of the Company during this year reflects marked improvement on all
fronts, as compared to the previous year, in spite of slowdown and low growth
of Indian economy and the challenges continuing to confront the Power Sector.
The gross sales have been Rs 5306.410 Million in the year ended 31-03-2013 and
these have touched a new high of Rs. 6097.064 Million in the year ended
31-03-2014.
|
Sr. No. |
Parameters |
FY 2013-14 |
|
1 |
Gross
Profit Margin |
19.91% |
|
|
|
|
|
2 |
Fixed
Assets Turnover (times) |
7.41% |
|
|
|
|
|
3 |
Interest
Coverage (times) |
1.38% |
|
|
|
|
|
4 |
ROCE |
7.44% |
The
vital parameters continue to show steady performance, if not a small growth, though
at a subdued level, reflecting the robust inner strength and the high standards
of quality and performance held up by the Company.
MANAGEMENT DISCUSSION AND ANALYSIS:
ECONOMY AND MARKET OVERVIEW:
The
Capital Goods industry being the ‘mother’ of all manufacturing industry is
extremely crucial for the development of the country’s economy. The capital
goods (CG) sector is highly diverse with a large variety of industrial
equipment, products, and services, including those used for agriculture, construction,
and transportation, as well as production of energy and power generation,
building and plant infrastructure, and general manufacturing. It is also
considered as a strategic sector and development of domestic capabilities is
paramount from a national self-reliance and security perspective. Indian
capital goods industry contributes 12% to the total manufacturing activity
(which is about 15% of the GDP) in the country.
Demand
for capital goods is sensitive to fluctuations of business confidence and correlates
with economic swings. The global capital goods industry which is export-driven
was severely affected by recession post 2008. Economy of India that is now
largely integrated with the world has been affected by global and domestic
factors. With almost all major customers of the capital goods sector, such as
power, oil and gas, metals and cement operating at subdued capacities, the CG
industry is experiencing manufacturing capacity under utilisation, pricing
pressure and dwindling order book in recent years.
Today,
Global economy is expanding at sluggish pace but is running above the
post-crisis average. On the current reckoning, global growth is likely to be in
the vicinity of 3½ per cent in 2014, about ½ a percentage point higher than in
2013 as per estimates of RBI. Key industry indicators, such as industrial
production and non-residential construction, point to a modest uptick in growth
for global capital goods companies during 2014. However, downside risks to
growth trajectory arise from ongoing tapering of quantitative easing in the US,
continuing deflation concerns and weak balance sheets in the euro area and,
inflationary pressures in the emerging market and developing economies. With
weakening growth and financial fragilities in China due to rapid credit in
recent years, global trade and growth are on the precipice of a large risk.
The
outlook for the Indian economy has improved with expected political stability,
cautiously positive business sentiments, improved consumer confidence,
expectations of a modest recovery in growth and decline in inflation
expectations. The real GDP behaviour over the past three decades reinforces the
cyclical behaviour of economic growth in India and this gives reasonable
confidence for economic recovery in near-term. In the long run, underlying
trends such as urbanisation, changing demography, energy security, climate
change and inclusive development in India and the global movement toward energy
efficient products and processes should help fuel demand for capital goods in
India.
INDUSTRIAL SECTOR SCENARIO:
The
power generation entities in India can be divided into two broad categories:
Generation Utilities and Generation Non-Utilities or Captive Power Plants
(CPPs). The central government, state government, or private investors own the
generation utilities. On the other hand, industries principally commission the
CPPs. Electricity Act 2003 defines CPPs as a power plant set up by any person
to generate electricity primarily for his own use and includes a power plant
set up by any co-operative society or association of persons for generating
electricity primarily for use of members of such cooperative society or
association.
The
Electricity Act 2003 encouraged captive power generation in India and further
provisions in the Act took captive power to competitive market by opening the
market for players to invest in captive power generation. Open access allows
captive generators to sell surplus power to any buyer no matter what the
location.
As
per Central Electricity Authority, Installed capacity of captive power plants
increased from 21,468 MW in 2005-06, 34,444 MW in 2010-11 and 39,375 MW in
2011-12. This was driven by industrial and commercial demand. Industrial
consumers who are suffering from inadequate power supply and high tariff rate
find captive generation as the best alternative for meeting their demand.
Coal-based generation dominates captive power generation also and constitutes
around 57% of the captive capacity. Another reason for higher capacity of coal based
captive generation is the cost of generating electricity from coal, which is
cheaper than diesel and naphtha. In recent times, cogeneration and waste heat
recovery are emerging options for CPPs, as companies get the Clean Development
Mechanism (CDM) benefits under this system in addition to achieving energy
efficiency.
OPERATIONS OVERVIEW:
The
Company operated, positioning itself strategically in a widening performance
spectrum, in both manufacturing and project execution sectors, and met squarely
fresh changing scenario in the not too encouraging economic and industrial
environment in the country. However, the power sector continued positive
outlook with felt need for support to the electrical T&D expansion. The
Company, with its reputation well noted and appreciated, measured up to
standards of commitments, higher technology and evolved control systems in
handling the complex energy environment. It also strengthened the Company's
management team suitably and recruited senior technology experts and buttressed
the research support wing in no small measure.
The
Company's emphasis on low voltage high tech products and forays into project
execution helped it to withstand the stagnant economy and, more importantly, wide
competition from foreign companies with access to high technology and superior
resources.
The
Company's surge into projects up to 400KVA helped it to withstand the downturn
and post remarkable results in the composite project execution and also enabled
it to procure large orders from well entrenched sources. The current on hand
orders at the yearend are a record and enable the Company to go ahead with its
programmed growth pleas and touch the set goals of performance and
profitability. The company succeeded in keeping up its profits high, in-spite
of increased sundry debtors, provisions and finance charges, through judicious
handling of manufacture and administrative expenses.
The
Company has been planning surge in exports and succeeded in making deep forays
into emerging foreign markets. The Company expects to benefit from its plans to
execute composite projects in foreign countries, as such activities are having
excellent potential to generate such earnings.
OUTLOOK:
PROSPECTS FOR THE CURRENT YEAR:
The
outlook for the current year is expected to be better than the previous year.
They improved product quality and strengthened marketing efforts and control
systems. They are therefore, hopeful of achieving further improved results in
the current year. The position of the orders on hand at the yearend is Rs.
10000.000 Million. Taking these and other favorable trends in market into
account, the Company looks forward to the future with confidence and hope.
FIXED ASSETS:
·
Land
·
Buildings
·
Plant and equipment
·
Factory equipments
·
Furniture and fixtures
·
Vehicles
·
Office equipment
·
Computer equipments
·
Other equipments
·
Know-how
CMT REPORT (Corruption, Money Laundering & Terrorism]
The Public Notice information has been collected from various sources including
but not limited to: The Courts,
1] INFORMATION ON
DESIGNATED PARTY
No exist designating subject or any of its beneficial owners,
controlling shareholders or senior officers as terrorist or terrorist organization
or whom notice had been received that all financial transactions involving
their assets have been blocked or convicted, found guilty or against whom a
judgement or order had been entered in a proceedings for violating
money-laundering, anti-corruption or bribery or international economic or
anti-terrorism sanction laws or whose assets were seized, blocked, frozen or
ordered forfeited for violation of money laundering or international
anti-terrorism laws.
2] Court Declaration :
No exist to suggest that subject is or was
the subject of any formal or informal allegations, prosecutions or other
official proceeding for making any prohibited payments or other improper
payments to government officials for engaging in prohibited transactions or
with designated parties.
3] Asset Declaration :
No records exist to suggest that the property or assets of the subject
are derived from criminal conduct or a prohibited transaction.
4] Record on Financial
Crime :
Charges or conviction
registered against subject: None
5] Records on Violation of
Anti-Corruption Laws :
Charges or
investigation registered against subject: None
6] Records on Int’l
Anti-Money Laundering Laws/Standards :
Charges or
investigation registered against subject: None
7] Criminal Records
No
available information exist that suggest that subject or any of its principals
have been formally charged or convicted by a competent governmental authority
for any financial crime or under any formal investigation by a competent government
authority for any violation of anti-corruption laws or international anti-money
laundering laws or standard.
8] Affiliation with
Government :
No record
exists to suggest that any director or indirect owners, controlling
shareholders, director, officer or employee of the company is a government
official or a family member or close business associate of a Government
official.
9] Compensation Package :
Our market
survey revealed that the amount of compensation sought by the subject is fair
and reasonable and comparable to compensation paid to others for similar
services.
10] Press Report :
No press reports / filings exists on
the subject.
CORPORATE GOVERNANCE
MIRA INFORM as part of its Due Diligence do provide comments on
Corporate Governance to identify management and governance. These factors often
have been predictive and in some cases have created vulnerabilities to credit
deterioration.
Our Governance Assessment focuses principally on the interactions
between a company’s management, its Board of Directors, Shareholders and other
financial stakeholders.
CONTRAVENTION
Subject is not known to have contravened any existing local laws,
regulations or policies that prohibit, restrict or otherwise affect the terms
and conditions that could be included in the agreement with the subject.
FOREIGN EXCHANGE RATES
|
Currency |
Unit
|
Indian Rupees |
|
US Dollar |
1 |
Rs. 63.90 |
|
|
1 |
Rs. 97.98 |
|
Euro |
1 |
Rs. 71.82 |
INFORMATION DETAILS
|
Information
Gathered by : |
SVA |
|
|
|
|
Analysis Done by
: |
RAS |
|
|
|
|
Report Prepared
by : |
BVA |
SCORE & RATING EXPLANATIONS
|
SCORE FACTORS |
RANGE |
POINTS |
|
HISTORY |
1~10 |
8 |
|
PAID-UP CAPITAL |
1~10 |
7 |
|
OPERATING SCALE |
1~10 |
7 |
|
FINANCIAL CONDITION |
|
|
|
--BUSINESS SCALE |
1~10 |
7 |
|
--PROFITABILIRY |
1~10 |
6 |
|
--LIQUIDITY |
1~10 |
7 |
|
--LEVERAGE |
1~10 |
7 |
|
--RESERVES |
1~10 |
8 |
|
--CREDIT LINES |
1~10 |
7 |
|
--MARGINS |
-5~5 |
-- |
|
DEMERIT POINTS |
|
|
|
--BANK CHARGES |
YES/NO |
YES |
|
--LITIGATION |
YES/NO |
YES |
|
--OTHER ADVERSE INFORMATION |
YES/NO |
NO |
|
MERIT POINTS |
|
|
|
--SOLE DISTRIBUTORSHIP |
YES/NO |
NO |
|
--EXPORT ACTIVITIES |
YES/NO |
NO |
|
--AFFILIATION |
YES/NO |
YES |
|
--LISTED |
YES/NO |
NO |
|
--OTHER MERIT FACTORS |
YES/NO |
YES |
|
DEFAULTER |
|
|
|
--RBI |
YES/NO |
NO |
|
--EPF |
YES/NO |
NO |
|
TOTAL |
|
64 |
This score serves as a reference to assess
SC’s credit risk and to set the amount of credit to be extended. It is calculated
from a composite of weighted scores obtained from each of the major sections of
this report. The assessed factors and their relative weights (as indicated
through %) are as follows:
Financial
condition (40%) Ownership
background (20%) Payment record
(10%)
Credit history
(10%) Market trend (10%) Operational size
(10%)
RATING EXPLANATIONS
|
RATING |
STATUS |
PROPOSED CREDIT LINE |
|
|
>86 |
Aaa |
Possesses an extremely sound financial base with the strongest capability
for timely payment of interest and principal sums |
Unlimited |
|
71-85 |
Aa |
Possesses adequate working capital. No caution needed for credit
transaction. It has above average (strong) capability for payment of interest
and principal sums |
Large |
|
56-70 |
A |
Financial & operational base are regarded healthy. General
unfavourable factors will not cause fatal effect. Satisfactory capability for
payment of interest and principal sums |
Fairly Large |
|
41-55 |
Ba |
Overall operation is considered normal. Capable to meet normal
commitments. |
Satisfactory |
|
26-40 |
B |
Capability to overcome financial difficulties seems comparatively
below average. |
Small |
|
11-25 |
Ca |
Adverse factors are apparent. Repayment of interest and principal sums
in default or expected to be in default upon maturity |
Limited with
full security |
|
<10 |
C |
Absolute credit risk exists. Caution needed to be exercised |
Credit not
recommended |
|
-- |
NB |
New Business |
-- |
This report is issued at your request without any
risk and responsibility on the part of MIRA INFORM PRIVATE LIMITED (MIPL)
or its officials.