MIRA INFORM REPORT
|
Report No. : |
325877 |
|
Report Date : |
08.06.2015 |
IDENTIFICATION DETAILS
|
Name : |
THAI-MC COMPANY LIMITED |
|
|
|
|
Registered Office : |
24th - 26th Floor, 968
U-Chuliang Foundation Building,
Rama 4 Road,
Silom, Bangrak, Bangkok
10500 |
|
|
|
|
Country : |
Thailand |
|
|
|
|
Financials (as on) : |
31.03.2014 |
|
|
|
|
Date of Incorporation : |
25.12.1973 |
|
|
|
|
Com. Reg. No.: |
0105516013941 [Former : 633/
2522] |
|
|
|
|
Legal Form : |
Private Limited Company |
|
|
|
|
Line of Business : |
The subject’s activity
is an international trading
company which handles
a wide range
of industrial products
such as chemicals,
machineries, living essential
products, by importing
products for supporting
its local customers,
and exports of
local products to
overseas customers. |
|
|
|
|
No. of Employee
: |
150 |
RATING & COMMENTS
|
MIRA’s Rating : |
A |
|
RATING |
STATUS |
PROPOSED CREDIT LINE |
|
|
56-70 |
A |
Financial & operational base are regarded healthy. General
unfavourable factors will not cause fatal effect. Satisfactory capability for
payment of interest and principal sums |
Fairly Large |
|
Status : |
Good |
|
Payment Behaviour : |
Regular |
|
Litigation : |
Clear |
NOTES :
Any query related to this report can be made
on e-mail : infodept@mirainform.com
while quoting report number, name and date.
ECGC Country Risk Classification List – December 31, 2014
|
Country Name |
Previous Rating (30.09.2014) |
Current Rating (31.12.2014) |
|
Thailand |
B1 |
B1 |
|
Risk Category |
ECGC
Classification |
|
Insignificant |
A1 |
|
Low |
A2 |
|
Moderate |
B1 |
|
High |
B2 |
|
Very High |
C1 |
|
Restricted |
C2 |
|
Off-credit |
D |
THAILAND - ECONOMIC OVERVIEW
With a well-developed infrastructure, a free-enterprise
economy, generally pro-investment policies, and strong export industries,
Thailand has had a strong economy due in part to industrial and agriculture exports
- mostly electronics, agricultural commodities, automobiles and parts, and
processed foods. Thailand attracts nearly 2.5 million migrant workers from
neighboring countries. The Thai government in 2013 implemented a nation-wide
300 baht ($10) per day minimum wage policy and deployed new tax reforms
designed to lower rates on middle-income earners. The Thai economy has
weathered both internal and external economic shocks in recent years. The
global economic recession severely cut Thailand's exports, with most sectors
experiencing double-digit drops. In late 2011 Thailand's recovery was
interrupted by historic flooding in the industrial areas in Bangkok and its
five surrounding provinces, crippling the manufacturing sector. Government
approved flood mitigation projects, worth $11.7 billion, were started in 2012
to prevent a repeat. Thai growth slowed in 2013 and has remained low since, as
the country faced political uncertainty and a coup in May 2014. The interim
government is implementing a special $11 billion short-term stimulus package
and has approved a budget of more than $80 billion to aid an economic rebound.
|
Source
: CIA |
Company
name
THAI-MC COMPANY
LIMITED
SUMMARY
BUSINESS ADDRESS : 24th - 26th FLOOR, 968 U-CHULIANG FOUNDATION
BUILDING,
RAMA 4 ROAD,
SILOM, BANGRAK,
BANGKOK
10500, THAILAND
TELEPHONE : [66] 2632-4100
FAX : [66] 2632-4199
E-MAIL ADDRESS : info@mitsubishithai-mc.com
thaimc@hadyai.loxinfo.co.th
REGISTRATION ADDRESS : SAME AS BUSINESS
ADDRESS
ESTABLISHED : 1973
REGISTRATION NO. : 0105516013941 [Former : 633/ 2522]
CAPITAL REGISTERED : BHT.
800,000,000
CAPITAL PAID-UP : BHT.
800,000,000
SHAREHOLDER’S PROPORTION : THAI : 76.00%
JAPANESE :
24.00%
FISCAL YEAR CLOSING DATE : MARCH 31
LEGAL STATUS : PRIVATE LIMITED
COMPANY
EXECUTIVE : MR. AKIRA MURAKOSHI,
JAPANESE
PRESIDENT
NO. OF STAFF : 150
LINES OF BUSINESS : INTERNATIONAL TRADING
COMPANY
CORPORATE
PROFILE
OPERATING TREND : STABLE
PRESENT SITUATION : OPERATING NORMALLY
REPUTATION : GOOD
WITH NORMAL BUSINESS
ENGAGEMENT
MANAGEMENT STANDARD : MANAGEMENT
WITH GOOD PERFORMANCE
HISTORY
The subject was
initially established on December
25, 1973 as a
private limited company
under the registered
name “Thai
Trading And Investment Co., Ltd.”, by
a joint venture
between Mitsubishi Corporation
from Japan and
Mitsubishi Company [Thailand]
Ltd., and other Thai
partners. Its business
objective is engaged
in international trading
business of industrial
products such as
chemicals, machineries,
living essential products
and etc., to
both local and
overseas markets. It
currently employs approximately
150 staff.
On April 30,
1984, the subject’s
name was changed
to THAI-MC COMPANY LIMITED.
The major shareholders
are Mitsubishi Company
[Thailand] Ltd., and
Mitsubishi
Corporation of Japan,
with holding around
25% and 24%
of the subject’s
shares respectively.
The subject’s registered
address was at 10th
- 17th Floor, 208
Tower Building, 208
Wireless Rd., Lumpini,
Pathumwan, Bangkok 10330.
In 2005, subject’s
registered address was
relocated to 24th - 26th Floor, 968 U-Chuliang Foundation Bldg., Rama
4 Rd., Silom, Bangrak, Bangkok 10500,
and this is
the company’s current
operation address.
THE
BOARD OF DIRECTORS
|
Name |
|
Nationality |
Age |
|
|
|
|
|
|
Mr. Prayad Boonsoong :
Chairman |
[x] |
Thai |
77 |
|
Mr. Pornwut Sarasin |
[x] |
Thai |
56 |
|
Mr. Ekwan Sunsue |
[x] |
Thai |
57 |
|
Mr. Kunchit Ngamapichart |
[x] |
Thai |
61 |
|
Mr. Amporn Udomsakpaibool |
[x] |
Thai |
54 |
|
Mr. Taimei Watanabe |
|
Japanese |
47 |
|
Mr. Masahiro Miyazaki |
|
Japanese |
48 |
|
Mr. Akira Murakoshi |
|
Japanese |
57 |
|
Mr. Nobuyuki Kawai |
|
Japanese |
52 |
|
Mr. Masahiro Yamakawa |
|
Japanese |
- |
AUTHORIZED
PERSON
Anyone of the
mentioned directors [x]
can jointly sign
with one of
the rest directors on
behalf of the
subject with company’s
affixed.
MANAGEMENT
Mr. Akira Murakoshi
is the President.
He is Japanese
nationality with the
age of 57
years old.
BUSINESS
OPERATIONS
The subject’s activity
is an international
trading company which
handles a wide
range of industrial
products such as
chemicals, machineries, living
essential products, by
importing products for
supporting its local
customers, and exports
of local products
to overseas customers.
Products &
Services:
Energy
Business Group: handles
an extensive variety
of petroleum, gas,
carbon-related products.
Metal Group:
- Non-Ferrous Metal
Materials such as
aluminium, copper, lead,
zinc and other
metals.
- Non-Ferrous Metal
Products such as
aluminium sheets, aluminium
tubes, copper tubes and
etc.
- Information & Communication
Technology is contributing development of modern technologies for
telecommunications.
Machinery Group: promoting
sales, finances and
investment of complete utility plants,
industrial plants, system
and equipment which
form the integral
parts of manufacturing
and service sectors.
Chemical Group: offers
a broad line
of products not
only chemicals but
also plastics, glue,
compounds, fertilizers and
various kinds of
additives.
Investment Business Group:
- Investment in
other companies, in
the field of
metal works, steels,
chemical, foods, textiles and
other industries.
Infrastructure & Logistic
Business Group
Living Essential Group:
- such as foods,
textiles, general goods,
merchandise, etc.
PURCHASE
The products are
purchased from both
local and overseas
suppliers in Japan,
United States of America, United Kingdom, Hong Kong, Republic
of China, Taiwan, Singapore
and the countries
in Europe.
MAJOR
SUPPLIER
Mitsubishi Corporation : Japan
SALES
100% of the
imported products is
sold locally to
manufacturers, wholesalers and
Thai Government.
EXPORT
100% of the
local products are exported
to Japan, Saudi
Arabia, Indonesia, Malaysia,
Hong Kong, United
States of America,
Singapore, Taiwan, Vietnam,
Laos and Middle
East countries.
RELATED COMPANY
Mitsubishi Company [Thailand]
Ltd.
Business Type : Importer,
distributor and exporter
of various kinds
of merchandises
LITIGATION
Bankruptcy and Receivership
There are no
litigation on bankruptcy
and receivership cases
filed against the
subject found at Legal Execution
Department for the
past five years.
Others
There are no
legal suits filed
against the subject
according for the
past two years.
CREDIT
Sales are by
cash or on
the credits term
of 30-60 days.
Local bills are
paid by cash
or on the
credits term of
30-60 days.
Imports are by
L/C at sight or
on the credits
term of 120-360
days or T/T.
Exports are against
L/C at sight
or T/T.
BANKING
Bank of Tokyo-Mitsubishi UFJ
Ltd.
[Bangkok Branch
: North Sathorn
Rd., Bangkok]
Bank of America
NT & SA
[Bangkok Branch
: Silom Rd.,
Bangkok]
Bangkok Bank Public
Co., Ltd.
[Head Office
: Silom Rd.,
Bangkok]
The Siam Commercial
Bank Public Co.,
Ltd.
[Rajdamri Branch
: Bangkok]
Bank of Ayudhya
Public Co., Ltd.
Sumitomo Mitsui Banking
Corporation
[Bangkok Branch]
EMPLOYMENT
The subject employs
approximately 150 staff.
[office and sales
staff]
LOCATION
DETAILS
The premise is
rented for administrative office
at the heading
address. It is
located in commercial
area.
Branch office is
located at 5
Preedarom Road, T. Hadyai,
A. Hadyai, Songkhla 90110.
Tel. [66] 74
244-900-1, Fax. [66]
74 234-265.
COMMENT
The subject attributed the improvement to the
successful sales of its
products. Subject performed
well in the
previous year. The
subject also provides
the capability and
resources to rapidly
develop a new
products to meet
unique customer needs.
FINANCIAL
INFORMATION
The capital was
initially registered at
Bht. 1,000,000 divided
into 10,000 shares
of Bht. 100 each.
The capital was
increased later as
following:
Bht. 5,000,000
in January 1975
Bht. 100,000,000
in September 1989
Bht. 200,000,000
in April 1990
Bht. 800,000,000
on March 27,
2009
The latest registered
capital was increased
to Bht. 800,000,000 divided
into 8,000,000 shares of
Bht. 100 each
with fully paid.
MAIN
SHAREHOLDERS
[as at
November 14, 2014]
|
NAME |
HOLDING |
% |
|
|
|
|
|
Mitsubishi Company [Thailand]
Ltd. Nationality: Thai Address : 24th – 26th Floor, 968
U-Chuliang Foundation Building,
Rama 4 Rd.,
Silom, Bangrak,
Bangkok |
2,000,000 |
25.00 |
|
Mitsubishi Corporation Nationality: Japanese Address : 3-1,
Marunouchi 2-Chome, Chiyoda-ku, Tokyo 100-8086,
Japan |
1,920,000 |
24.00 |
|
MCT Management Co.,
Ltd. Nationality: Thai Address : 24th – 26th Floor, 968
U-Chuliang
Foundation Building, Rama
4 Rd., Silom,
Bangrak,
Bangkok |
1,600,000 |
20.00 |
|
Mr. Prayad Boonsoong Nationality: Thai Address : 45/2
Soi Ekamai 28,
Klongton,
Wattana, Bangkok |
912,000 |
11.40 |
|
Mr. Ekwan Chunsue Nationality: Thai Address : 222
Soi Srinakorn, Linchee
Rd.,
Chongnonsee, Yannawa, Bangkok |
240,000 |
3.00 |
|
Ms. Yuwadee Chunsue Nationality: Thai Address : 222
Soi Srinakorn, Linchee
Rd.,
Chongnonsee, Yannawa, Bangkok |
240,000 |
3.00 |
|
Mr. Ekthai Chunsue Nationality: Thai Address : 222
Soi Srinakorn, Linchee
Rd.,
Chongnonsee, Yannawa, Bangkok |
240,000 |
3.00 |
|
Mr. Pornwut Sarasin Nationality: Thai Address : 122
Saladaeng Rd., Silom,
Bangrak, Bangkok |
160,000 |
2.00 |
|
Mr. Pongsak Assakul Nationality: Thai Address : 879 Bangkok-Nonthaburi Rd.,
Bangsue, Bangkok |
160,000 |
2.00 |
|
Others |
528,000 |
6.60 |
Total Shareholders : 17
Share Structure
[as at November
14, 2014]
|
Nationality |
Shareholders |
No. of Share |
% Shares |
|
|
|
|
|
|
Thai |
16 |
6,080,000 |
76.00 |
|
Foreign - Japanese |
1 |
1,920,000 |
24.00 |
|
Total |
17 |
8,000,000 |
100.00 |
NAME OF AUDITOR & CERTIFIED PUBLIC
ACCOUNTANT NO.
Ms. Chupong Surachutikarn No.
4325
BALANCE
SHEET [BAHT]
The latest financial figures published
as at March
31, 2014, 2013
& 2012 were:
ASSETS
|
Current Assets |
2014 |
2013 |
2012 |
|
|
|
|
|
|
Cash and Cash Equivalents |
196,151,250 |
496,301,022 |
234,969,681 |
|
Trade Accounts &
Other Receivable |
3,714,338,491 |
3,646,173,704 |
3,729,389,128 |
|
Current Portion of Long-term
Employee |
1,491,053 |
1,505,149 |
1,702,220 |
|
Short-term Loans |
523,500,000 |
224,500,000 |
378,500,000 |
|
Inventories |
549,698,005 |
565,156,779 |
556,043,143 |
|
Other Current Assets
|
28,567,579 |
34,942,201 |
9,237,856 |
|
|
|
|
|
|
Total Current Assets
|
5,013,746,378 |
4,968,578,855 |
4,909,842,028 |
|
For-sales Investment |
405,000 |
382,500 |
279,375 |
|
Investment in Associated |
31,713,102 |
31,712,249 |
31,712,249 |
|
Investment in Subsidiaries |
155,759,900 |
155,759,900 |
155,760,000 |
|
Other Long-term Investment
|
347,282,740 |
347,538,498 |
340,568,498 |
|
Long-term Loan to Employee |
1,894,157 |
1,967,543 |
2,525,892 |
|
Fixed Assets |
154,857,371 |
119,938,169 |
57,283,012 |
|
Intangible Assets |
15,089,946 |
10,428,650 |
7,720,034 |
|
Other Non - current Assets |
14,102,164 |
11,886,304 |
12,071,369 |
|
Total Assets |
5,734,850,758 |
5,648,192,668 |
5,517,762,457 |
LIABILITIES &
SHAREHOLDERS’ EQUITY [BAHT]
|
Current
Liabilities |
2014 |
2013 |
2012 |
|
|
|
|
|
|
Bank Overdraft & Short-term Loan From Financial Institutions |
- |
- |
312,691,514 |
|
Trade Accounts & Other
Payable |
2,419,962,548 |
2,603,865,710 |
2,302,479,124 |
|
Short-term Loan from Related
Company |
- |
30,000,000 |
55,000,000 |
|
Accrued Income Tax |
40,181,506 |
26,365,337 |
42,501,123 |
|
Other Current Liabilities |
26,636,897 |
27,172,578 |
20,620,323 |
|
|
|
|
|
|
Total Current Liabilities |
2,486,780,951 |
2,687,403,625 |
2,733,292,084 |
|
Employee Benefits Obligation |
111,601,605 |
104,791,915 |
94,198,430 |
|
Provision for the Cost of
Demolition and Restoration the Place |
10,630,778 |
10,630,778 |
10,630,778 |
|
Total Liabilities |
2,609,013,334 |
2,802,826,318 |
2,838,121,292 |
|
|
|
|
|
|
Shareholders' Equity |
|
|
|
|
|
|
|
|
|
Share capital : Baht 100
par value authorized, issued
and fully paid share
capital 8,000,000 shares |
800,000,000 |
800,000,000 |
800,000,000 |
|
|
|
|
|
|
Capital Paid |
800,000,000 |
800,000,000 |
800,000,000 |
|
Retained Earnings: Appropriated for Statutory
reserve |
80,000,000 |
79,109,900 |
62,109,900 |
|
General reserve |
1,100,000,000 |
1,100,000,000 |
1,100,000,000 |
|
Unappropriated |
1,145,582,424 |
866,023,950 |
717,401,890 |
|
Other Components of Shareholder’s Equity |
255,000 |
232,500 |
129,375 |
|
Total Shareholders' Equity |
3,125,837,424 |
2,845,366,350 |
2,679,641,165 |
|
Total Liabilities & Shareholders' Equity |
5,734,850,758 |
5,648,192,668 |
5,517,762,457 |
PROFIT
& LOSS ACCOUNT
|
Revenue |
2014 |
2013 |
2012 |
|
|
|
|
|
|
Sales Income |
22,388,794,076 |
21,487,657,496 |
22,004,115,280 |
|
Compensation Income |
236,149,872 |
235,714,242 |
315,139,045 |
|
Other Income |
440,936,086 |
323,954,609 |
314,831,168 |
|
Total Revenues |
23,065,880,034 |
22,047,326,347 |
22,634,085,493 |
|
Expenses |
|
|
|
|
|
|
|
|
|
Cost of Goods
Sold |
21,692,641,316 |
20,763,182,783 |
21,288,666,634 |
|
Selling Expenses |
645,708,288 |
643,815,324 |
670,434,930 |
|
Administrative Expenses |
199,693,199 |
232,256,186 |
225,688,171 |
|
Total Expenses |
22,538,042,803 |
21,639,254,293 |
22,184,789,735 |
|
|
|
|
|
|
Profit / [Loss] before Financial Cost & Income
Tax |
527,837,231 |
408,072,054 |
449,295,758 |
|
Financial Cost |
[1,029,342] |
[3,454,782] |
[11,000,465] |
|
Profit / [Loss] before Income
Tax |
526,807,889 |
404,617,272 |
438,295,293 |
|
Income Tax |
[76,359,315] |
[68,995,212] |
[98,372,510] |
|
|
|
|
|
|
Net Profit / [Loss] |
450,448,574 |
335,622,060 |
339,922,783 |
FINANCIAL
ANALYSIS
|
ITEM |
UNIT |
2014 |
2013 |
2012 |
|
|
|
|
|
|
|
LIQUIDITY RATIO |
|
|
|
|
|
CURRENT RATIO |
TIMES |
2.02 |
1.85 |
1.80 |
|
QUICK RATIO |
TIMES |
1.78 |
1.63 |
1.59 |
|
|
|
|
|
|
|
ACTIVITY RATIO |
|
|
|
|
|
FIXED ASSETS TURNOVER |
TIMES |
144.58 |
179.16 |
384.13 |
|
TOTAL ASSETS TURNOVER |
TIMES |
3.90 |
3.80 |
3.99 |
|
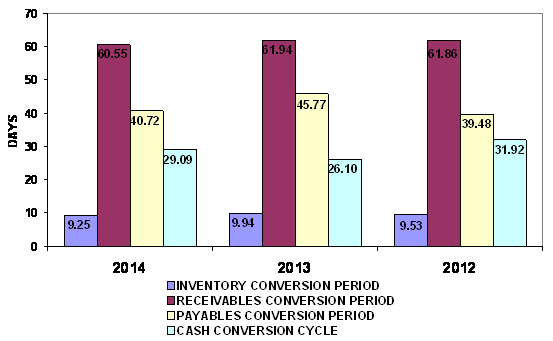
INVENTORY CONVERSION PERIOD |
DAYS |
9.25 |
9.94 |
9.53 |
|
INVENTORY TURNOVER |
TIMES |
39.46 |
36.74 |
38.29 |
|
RECEIVABLES CONVERSION PERIOD |
DAYS |
60.55 |
61.94 |
61.86 |
|
RECEIVABLES TURNOVER |
TIMES |
6.03 |
5.89 |
5.90 |
|
PAYABLES CONVERSION PERIOD |
DAYS |
40.72 |
45.77 |
39.48 |
|
CASH CONVERSION CYCLE |
DAYS |
29.09 |
26.10 |
31.92 |
|
|
|
|
|
|
|
PROFITABILITY RATIO |
|
|
|
|
|
COST OF GOODS SOLD |
% |
96.89 |
96.63 |
96.75 |
|
SELLING & ADMINISTRATION |
% |
3.78 |
4.08 |
4.07 |
|
INTEREST |
% |
0.00 |
0.02 |
0.05 |
|
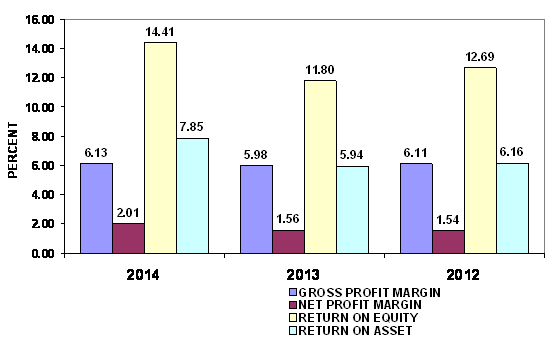
GROSS PROFIT MARGIN |
% |
6.13 |
5.98 |
6.11 |
|
NET PROFIT MARGIN BEFORE EX. ITEM |
% |
2.36 |
1.90 |
2.04 |
|
NET PROFIT MARGIN |
% |
2.01 |
1.56 |
1.54 |
|
RETURN ON EQUITY |
% |
14.41 |
11.80 |
12.69 |
|
RETURN ON ASSET |
% |
7.85 |
5.94 |
6.16 |
|
EARNING PER SHARE |
BAHT |
56.31 |
41.95 |
42.49 |
|
|
|
|
|
|
|
LEVERAGE RATIO |
|
|
|
|
|
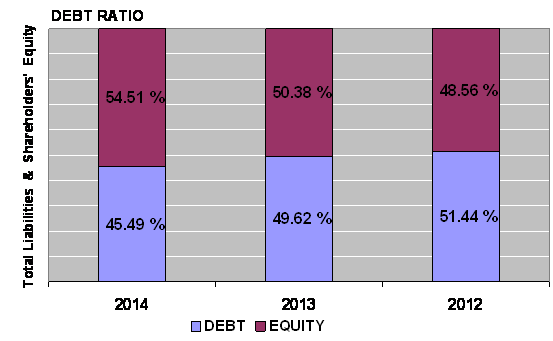
DEBT RATIO |
TIMES |
0.45 |
0.50 |
0.51 |
|
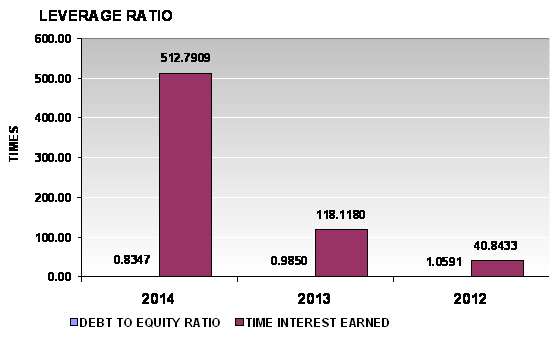
DEBT TO EQUITY RATIO |
TIMES |
0.83 |
0.99 |
1.06 |
|
TIME INTEREST EARNED |
TIMES |
512.79 |
118.12 |
40.84 |
|
|
|
|
|
|
|
ANNUAL GROWTH |
|
|
|
|
|
SALES GROWTH |
% |
4.19 |
(2.35) |
|
|
OPERATING PROFIT |
% |
29.35 |
(9.18) |
|
|
NET PROFIT |
% |
34.21 |
(1.27) |
|
|
FIXED ASSETS |
% |
29.11 |
109.38 |
|
|
TOTAL ASSETS |
% |
1.53 |
2.36 |
|
ANNUAL GROWTH : EXCELLENT
An annual sales growth is 4.19%. Turnover has increased from THB 21,487,657,496.00
in 2013 to THB 22,388,794,076.00 in 2014. While net profit has increased from
THB
PROFITABILITY : IMPRESSIVE
PROFITABILITY
RATIO
|
Gross Profit Margin |
6.13 |
Impressive |
Industrial Average |
0.91 |
|
Net Profit Margin |
2.01 |
Satisfactory |
Industrial Average |
2.22 |
|
Return on Assets |
7.85 |
Impressive |
Industrial Average |
7.20 |
|
Return on Equity |
14.41 |
Impressive |
Industrial Average |
12.95 |
Gross Profit Margin used to assess a firm's financial health by revealing
the proportion of money left over from revenues after accounting for the cost
of goods sold. Gross profit margin serves as the source for paying additional
expenses and future savings. The
company’s figure is 6.13%. When
compared with the industry average, the ratio of the company was higher,
indicated that company was more profitable than the same industry.
Net Profit Margin is the indicator of the company's efficiency in that
net profit takes into consideration all expenses of the company. A low profit
margin indicates a low margin of safety, higher risk that a decline in sales
will erase profits and result in a net loss. The company's figure is 2.01%.
When compared with the industry average, the ratio of the company was lower.
Return on Assets measures how efficiently profits are being generated
from the assets employed in the business when compared with the ratios of firms
in a similar business. A low ratio in comparison with industry averages
indicates an inefficient use of business assets. Return on Assets ratio is 7.85%, higher figure when compared with those
of its average competitors in the same industry, indicated that business was an
efficient profit in a dominant position within its industry.
Return on Equity indicates how profitable a company is by comparing its
net income to its average shareholders' equity, ROE measures how much the
shareholders earned for their investment in the company. Return on Equity ratio
is 14.41%, higher figure when compared with those of its average competitors in
the same industry, indicated that business was an efficient profit in a dominant position within its industry.
Trend of the average competitors in the same industry for last 5 years
Return on Assets Uptrend
Return on Equity Uptrend
LIQUIDITY : IMPRESSIVE
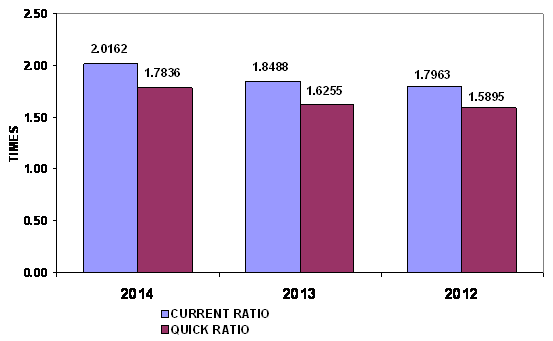
LIQUIDITY RATIO
|
Current Ratio |
2.02 |
Impressive |
Industrial Average |
1.76 |
|
Quick Ratio |
1.78 |
|
|
|
|
Cash Conversion Cycle |
29.09 |
|
|
|
The Current Ratio is to ascertain whether a company's short-term assets
are readily available to pay off its short-term liabilities. The company's
figure is 2.02 times in 2014, increased from 1.85 times, then it is generally considered
to have good short-term financial strength. When compared with the industry
average, the ratio of the company was higher, indicated that company was an
efficient operator in a dominant position within its industry.
The Quick Ratio is a liquidity indicator that further refines the
current ratio by measuring the amount of the most liquid current assets there
are to cover current liabilities. The company's figure is 1.78 times in 2014,
increased from 1.63 times, although excluding inventory so the company still
have good short-term financial strength.
The Cash Conversion Cycle measures the number of days a company's cash
is tied up in the production and sales process of its operations and the
benefit from payment terms from its creditors. It meant the company could
survive when no cash inflow was received from sale for 30 days.
Trend of the average competitors in the same industry for last 5 years
Current Ratio Uptrend
LEVERAGE : EXCELLENT
LEVERAGE RATIO
|
Debt Ratio |
0.45 |
Impressive |
Industrial Average |
0.51 |
|
Debt to Equity Ratio |
0.83 |
Impressive |
Industrial Average |
1.05 |
|
Times Interest Earned |
512.79 |
Impressive |
Industrial Average |
- |
Debt to Equity Ratio a measurement of how much suppliers, lenders,
creditors and obligors have committed to the company versus what the shareholders
have committed. A lower the percentage means that the company is using less
leverage and has a stronger equity position.
Times Interest Earned measuring a company's ability to meet its debt
obligations. Ratio is 512.8 higher than 1, so the company can pay interest
expenses on outstanding debt.
Debt Ratio shows the proportion of a company's assets which are financed
through debt. The company's figure is 0.45 less than 0.5, most of the company's
assets are financed through equity.
Trend of the average competitors in the same industry for last 5 years
Debt Ratio Uptrend
Times Interest Earned Stable
ACTIVITY : IMPRESSIVE
ACTIVITY RATIO
|
Fixed Assets Turnover |
144.58 |
Impressive |
Industrial Average |
- |
|
Total Assets Turnover |
3.90 |
Impressive |
Industrial Average |
3.24 |
|
Inventory Conversion Period |
9.25 |
|
|
|
|
Inventory Turnover |
39.46 |
Impressive |
Industrial Average |
25.28 |
|
Receivables Conversion Period |
60.55 |
|
|
|
|
Receivables Turnover |
6.03 |
Satisfactory |
Industrial Average |
6.54 |
|
Payables Conversion Period |
40.72 |
|
|
|
The company's Account Receivable Ratio is calculated as 6.03 and
Inventory Turnover in Days Ratio indicates the liquidity of inventory. It
estimates the number of days that it will take to sell the current inventory.
Inventory is particularly sensitive to change in business activities. The
inventory turnover in days has decreased from 10 days at the end of 2013 to 9
days at the end of 2014. This represents a positive trend. And Inventory
turnover has increased from 36.74 times in year 2013 to 39.46 times in year
2014.
The company's Total Asset Turnover is calculated as 3.9 times and 3.8
times in 2014 and 2013 respectively. This ratio is determined by dividing total
assets into total sales turnover. The ratio measures the activity of the assets
and the ability of the firm to generate sales through the use of the assets.
Trend of the average competitors in the same industry for last 5 years
Fixed Assets Turnover Stable
Total Assets Turnover Uptrend
Inventory Turnover Uptrend
Receivables Turnover Uptrend
FOREIGN EXCHANGE RATES
|
Currency |
Unit
|
Indian Rupees |
|
US Dollar |
1 |
Rs.64.11 |
|
|
1 |
Rs.97.84 |
|
Euro |
1 |
Rs.71.12 |
INFORMATION DETAILS
|
Analysis Done by
: |
SAN |
|
|
|
|
Report Prepared
by : |
SDA |
RATING EXPLANATIONS
|
RATING |
STATUS |
PROPOSED CREDIT LINE |
|
|
>86 |
Aaa |
Possesses an extremely sound financial base with the strongest capability
for timely payment of interest and principal sums |
Unlimited |
|
71-85 |
Aa |
Possesses adequate working capital. No caution needed for credit
transaction. It has above average (strong) capability for payment of interest
and principal sums |
Large |
|
56-70 |
A |
Financial &
operational base are regarded healthy. General unfavourable factors will not
cause fatal effect. Satisfactory capability for payment of interest and
principal sums |
Fairly Large |
|
41-55 |
Ba |
Overall operation is considered normal. Capable to meet normal
commitments. |
Satisfactory |
|
26-40 |
B |
Capability to overcome financial difficulties seems comparatively
below average. |
Small |
|
11-25 |
Ca |
Adverse factors are apparent. Repayment of interest and principal sums
in default or expected to be in default upon maturity |
Limited with
full security |
|
<10 |
C |
Absolute credit risk exists. Caution needed to be exercised |
Credit not
recommended |
|
-- |
NB |
New Business |
-- |
This score serves as a reference to assess
SC’s credit risk and to set the amount of credit to be extended. It is calculated
from a composite of weighted scores obtained from each of the major sections of
this report. The assessed factors and their relative weights (as indicated
through %) are as follows:
Financial
condition (40%) Ownership
background (20%) Payment record
(10%)
Credit history
(10%) Market trend (10%) Operational size
(10%)
This report is issued at your request without any
risk and responsibility on the part of MIRA INFORM PRIVATE LIMITED (MIPL)
or its officials.