MIRA INFORM REPORT
|
Report No. : |
326323 |
|
Report Date : |
10.06.2015 |
IDENTIFICATION DETAILS
|
Name : |
ANDRES PINTALUBA SOCIEDAD ANONIMA |
|
|
|
|
Registered Office : |
C/ Prudenci Bertrana, 5 - POL. IND. Agro Reus - Reus - 43206 - Tarragona |
|
|
|
|
Country : |
Spain |
|
|
|
|
Financials (as on) : |
31.12.2013 |
|
|
|
|
Date of Incorporation : |
19.01.1979 |
|
|
|
|
Legal Form : |
Public Limited Company |
|
|
|
|
Line of Business : |
Wholesale of chemical products |
|
|
|
|
No. of Employees : |
97 (2013) |
RATING & COMMENTS
|
MIRA’s Rating : |
Ba |
|
RATING |
STATUS |
PROPOSED CREDIT LINE |
|
|
41-55 |
Ba |
Overall operation is considered normal. Capable to meet normal
commitments. |
Satisfactory |
|
Status : |
Satisfactory |
|
|
|
|
Payment Behaviour : |
No Complaints |
|
|
|
|
Litigation : |
Clear |
NOTES:
Any query related to this report can be made
on e-mail: infodept@mirainform.com
while quoting report number, name and date.
ECGC Country Risk Classification List – December 31, 2014
|
Country Name |
Previous Rating (30.09.2014) |
Current Rating (31.12.2014) |
|
Spain |
A2 |
A1 |
|
Risk Category |
ECGC
Classification |
|
Insignificant |
A1 |
|
Low |
A2 |
|
Moderate |
B1 |
|
High |
B2 |
|
Very High |
C1 |
|
Restricted |
C2 |
|
Off-credit |
D |
SPAIN - ECONOMIC OVERVIEW
Spain experienced a prolonged recession in the wake of the global financial crisis. GDP contracted by 3.7% in 2009, ending a 16-year growth trend, and continued contracting through most of 2013. Economic growth resumed briefly in late 2013, albeit only modestly, as credit contraction in the private sector, fiscal austerity, and high unemployment continued to weigh on domestic consumption and investment. Exports, however, have been resilient throughout the economic downturn and helped to bring Spain's current account into surplus in 2013 for the first time since 1986. The unemployment rate rose from a low of about 8% in 2007 to more than 26% in 2013, straining Spain's public finances as spending on social benefits increased while tax revenues fell. Spain’s budget deficit peaked at 11.4% of GDP in 2010. Spain gradually reduced the deficit to just under 7% of GDP in 2013-14, slightly above the 6.5% target negotiated between Spain and the EU. Public debt has increased substantially – from 60.1% of GDP in 2010 to more than 97% in 2014. Rising labor productivity, moderating labor costs, and lower inflation have helped to improve foreign investor interest in the economy and to reduce government borrowing costs. The government's ongoing efforts to implement reforms - labor, pension, health, tax, and education - are aimed at supporting investor sentiment. The government also has shored up struggling banks exposed to Spain's depressed domestic construction and real estate sectors by successfully completing an EU-funded restructuring and recapitalization program in January 2014. Recently increased private consumption helped bring real GDP growth back into positive territory at 1.3% in 2014, and labor reforms prompted a modest reduction in the unemployment rate, from more than 26% in 2013 to 24% in 2014. Despite the uptic in economic activity, inflation dropped sharply, from 1.5% in 2013 to flat in 2014. Spain’s 2015 budget, published in September 2014, rolls back some recently imposed taxes in advance of national elections in November 2015 and leaves untouched the country’s value-added tax (VAT) regime, which generates significantly lower revenue than the EU average. Spain’s borrowing costs are dramatically lower since their peak in mid-2012.
|
Source
: CIA |
EXECUTIVE
SUMMARY
|
Name: |
ANDRES
PINTALUBA SOCIEDAD ANONIMA |
|
NIF
/ Fiscal code: |
A43030378 |
|
Status: |
ACTIVE
WITH PARTIAL DIVISION OF CAPITAL |
|
Incorporation
Date: |
19/01/1979 |
|
Register Data |
Register
Section 8 Sheet 1786 |
|
Last Publication in BORME: |
04/05/2015
[Miscellaneous Concepts] |
|
Last
Published Account Deposit: |
2013 |
|
Share
Capital: |
6.000.000 |
|
Localization: |
C/
PRUDENCI BERTRANA, 5 - POL. IND. AGRO REUS - REUS - 43206 - TARRAGONA |
|
Telephone
- Fax - Email - Website: |
Telephone.
977 317 111 Email. pintaluba@pintaluba.com Website. www.pintaluba.com |
|
Number
of Branches |
5 |
|
Activity: |
|
|
NACE: |
4675
- Wholesale of chemical products |
|
Registered
Trademarks: |
|
|
Audited
/ Opinion: |
Si
/ |
|
Tenders
and Awards: |
|
|
Subsidies: |
29
for a total cost of 4753598.149999999 |
|
Main
products / services: |
Vitamins-hillsmedicationsacids |
|
Quality
Certificate: |
No |
|
Payment
Behaviour: |
According
to the agreed terms |
|
Prospects: |
Consolidation |
|
Industry
situation: |
Maturity |
Defaults, Legal
Claims and Insolvency Proceedings :
|
|
Number |
Amount
(€) |
Most
Recent Entry |
|
Insolvency
Proceedings, Bankruptcy and Suspension of Payments |
Unpublished |
--- |
--- |
|
Defaults
on debt with Financial Institutions and Large Companies |
None |
--- |
--- |
|
Judicial
Claims (Notices, Executive Proceedings, Attachments, Auctions, Bad Debt) |
None |
0 |
--- |
|
Proceedings
heard by the Civil Court |
Unpublished |
0 |
--- |
|
Proceedings
heard by the Labour Court |
Unpublished |
0 |
--- |
|
Partners: |
|
|
|
ANDRES
PINTALUBA ESPORRIN |
|
|
|
ANGLOXELL
VALORES Y PARTICIPACIONES SOCIEDAD LIMITADA |
99.99
% |
|
|
MARIA
GLORIA MITJA SASTRE |
|
|
|
Shares: |
15 |
|
|
Other
Links: |
9 |
|
|
No.
of Active Corporate Bodies: |
CHIEF
EXECUTIVE OFFICER 1 |
|
|
Ratios |
2013 |
2012 |
Change |
|
|
Nº
of employees: |
97 |
|
|
|
|
|
|
|
Guarantees: |
|
|
Properties
Registered: |
Company
NO, Administrator NO |
|
Financing
/ Guarantee Sources : |
Sources
YES, Guarantees YES |
|
|
|
|
|
|
|
INVESTIGATION
SUMMARY |
|
|
It
is a founded in 1979, dedicated to the manufacture and sale of additives and
chemicals for the manufacture of feed materials. It operates nationally and
internationally. In the sources consulted appears nothing against him. In
light of the above we believe that is possible to continue operations
relating to risk, commensurate with their importance. |
|
|
Interviewed
Person: |
|
Identification
|
Social Denomination: |
ANDRES PINTALUBA SOCIEDAD
ANONIMA |
|
NIF / Fiscal code: |
A43030378 |
|
Corporate Status: |
ACTIVE WITH PARTIAL
DIVISION OF CAPITAL |
|
Start of activity: |
1991 |
|
Registered Office: |
C/ PRUDENCI BERTRANA, 5 -
POL. IND. AGRO REUS |
|
Locality: |
REUS |
|
Province: |
TARRAGONA |
|
Postal Code: |
43206 |
|
Telephone: |
977 317 111 |
|
Fax: |
977 323 188 |
|
Website: |
www.pintaluba.com |
|
Email: |
pintaluba@pintaluba.com |
|
Interviewed Person: |
Data obtained through
indirect sources. |
Branch
Offices
|
Address |
Postal Code |
City |
Province |
|
Joaquin Turina, 2 |
28224 |
POZUELO DE ALARCON |
MADRID |
|
Ctra. Alcolea del Pinar, S/N |
43206 |
REUS |
TARRAGONA |
|
Sagrat Cor (Pol. Ind. Sabater), 61 |
43529 |
ROQUETES |
TARRAGONA |
|
Avda. Europa 34 D, 3º A-2 |
28023 |
MADRID |
MADRID |
|
Rovira i Virgili, 37-41 |
43206 |
REUS |
TARRAGONA |
Activity
|
NACE: |
4675 |
|
Legal Form: |
Manufacturing, marketing,
REPRESENTATION OF CHEMICAL ADDITIVES AND CHEMICAL PRODUCTS FOR FEED. |
|
Additional Information: |
Manufacturing and sale of adittives
and chemical productos for the manufacturing of feed. |
|
Additional Address: |
Registered office and
offices in the head address. It has some facilities which will be explained. |
|
Franchise: |
NO |
|
Import / export: |
IMPORTS / EXPORTS |
|
Future Perspective: |
Consolidation |
|
Industry situation: |
Maturity |
Main products /
services
|
Product |
% Over Sales |
|
Vitamins-hills |
|
|
medications |
|
|
acids |
|
|
coccidiostats |
|
|
flavoring |
|
|
protein |
|
|
antioxidants |
|
|
amino acids |
|
|
minerals |
|
|
Comp. nutritional |
|
|
dyes |
|
|
Hygiene Prod. |
|
|
sweeteners |
|
Number
of Employees
|
Year |
No. of employees |
Established |
Incidentals |
|
2013 |
97 |
|
|
The data of employees is from
the latest available financial statements. Failing that, are estimates data
calculated by statistical methods
Chronological
Summary
|
Year |
Act |
|
1991 |
Accounts deposit (year 1989, 1990) Adaptation to Law (1) Appointments/
Re-elections (3) Cessations/ Resignations/ Reversals (1) Change of Social
Purpose (1) Increase of Capital (1) |
|
1992 |
Accounts deposit (year 1991) |
|
1993 |
Accounts deposit (year 1992) |
|
1994 |
Accounts deposit (year 1993) Appointments/ Re-elections (1) Increase
of Capital (2) Statutory Modifications (1) |
|
1995 |
Accounts deposit (year 1994) Appointments/ Re-elections (2) Statutory
Modifications (1) |
|
1996 |
Accounts deposit (year 1995) Appointments/ Re-elections (3)
Cessations/ Resignations/ Reversals (2) Correction (2) |
|
1997 |
Accounts deposit (year 1996 consolidated, 1996) Appointments/
Re-elections (2) Other Concepts/ Events (1) |
|
1998 |
Accounts deposit (year 1997 consolidated, 1997) |
|
1999 |
Accounts deposit (year 1998) Appointments/ Re-elections (3) Capital
Reduction (1) Cessations/ Resignations/ Reversals (3) Increase of Capital (1)
Partial split (4) Statutory Modifications (1) |
|
2000 |
Accounts deposit (year 1998 consolidated, 1999) Partial split (1) |
|
2001 |
Accounts deposit (year 2000) Appointments/ Re-elections (3)
Cessations/ Resignations/ Reversals (2) |
|
2002 |
Accounts deposit (year 2001 consolidated, 2001) Appointments/ Re-elections
(1) Cessations/ Resignations/ Reversals (1) |
|
2003 |
Accounts deposit (year 2002 consolidated, 2002) Appointments/
Re-elections (2) Cessations/ Resignations/ Reversals (1) |
|
2004 |
Accounts deposit (year 2003) Appointments/ Re-elections (1)
Cessations/ Resignations/ Reversals (1) |
|
2005 |
Accounts deposit (year 2004 consolidated, 2004) Appointments/
Re-elections (2) Cessations/ Resignations/ Reversals (1) |
|
2006 |
Accounts deposit (year 2005 consolidated, 2005) Appointments/
Re-elections (1) Cessations/ Resignations/ Reversals (1) |
|
2007 |
Accounts deposit (year 2006 consolidated, 2006) Appointments/
Re-elections (3) Cessations/ Resignations/ Reversals (1) |
|
2008 |
Accounts deposit (year 2007 consolidated, 2007) Appointments/
Re-elections (1) |
|
2009 |
Accounts deposit (year 2008 consolidated, 2008) Appointments/
Re-elections (2) |
|
2010 |
Accounts deposit (year 2009 consolidated, 2009) |
|
2011 |
Accounts deposit (year 2010) Appointments/ Re-elections (2)
Cessations/ Resignations/ Reversals (1) Other Concepts/ Events (1) |
|
2012 |
Accounts deposit (year 2010 consolidated, 2011 consolidated, 2011) |
|
2013 |
Accounts deposit (year 2012 consolidated, 2012) Appointments/
Re-elections (1) Cessations/ Resignations/ Reversals (1) |
|
2014 |
Accounts deposit (year 2013) |
|
2015 |
Appointments/ Re-elections (2) Cessations/ Resignations/ Reversals (2)
Other Concepts/ Events (1) |
Breakdown
of Owners' Equity
|
Registered Capital: |
6.000.000 |
|
Paid up capital: |
6.000.000 |
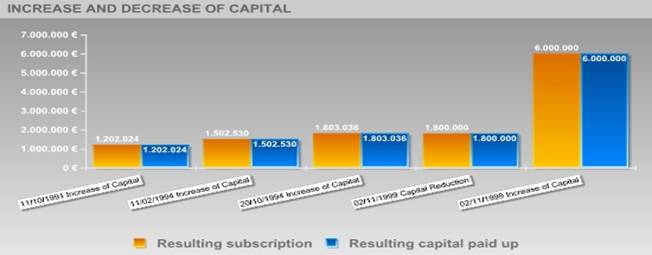
Updated Evolution of
the Subscribed and Paid-in Capital
|
Publishing Date |
Registration Type |
Capital Subscribed |
Paid up capital |
Underwritten result |
Disbursed Result |
|
11/10/1991 |
Increase of Capital |
601.012 |
601.012 |
1.202.024 |
1.202.024 |
|
11/02/1994 |
Increase of Capital |
300.506 |
300.506 |
1.502.530 |
1.502.530 |
|
20/10/1994 |
Increase of Capital |
300.506 |
300.506 |
1.803.036 |
1.803.036 |
|
02/11/1999 |
Capital Reduction |
-3.036 |
-3.036 |
1.800.000 |
1.800.000 |
|
02/11/1999 |
Increase of Capital |
4.200.000 |
4.200.000 |
6.000.000 |
6.000.000 |
Active
Social Bodies
|
Post published |
Social Body's Name |
Appointment Date |
Other Positions in this Company |
|
PRESIDENT |
PINTALUBA ESPORRIN ANDRES |
23/08/2011 |
16 |
|
MEMBER OF THE BOARD |
PINTALUBA ESPORRIN ANDRES |
23/08/2011 |
16 |
|
|
PINTALUBA MITJA ANDRES |
23/08/2011 |
8 |
|
|
PINTALUBA MITJA MERITXELL |
23/08/2011 |
3 |
|
|
PINTALUBA MITJA MARIA GLORIA |
23/08/2011 |
3 |
|
PROXY |
CABRE LLABERIA JOAQUIM |
13/12/2007 |
1 |
|
|
ALARCON RUIZ ANDRES MIGUEL |
17/03/2003 |
1 |
|
|
MITJA SASTRE MARIA GLORIA |
28/01/1999 |
4 |
|
|
MITJA MARTI JOSE MARIA |
29/01/1997 |
8 |
|
|
PINTALUBA MITJA ANDRES |
29/09/1995 |
8 |
|
CHIEF EXECUTIVE OFFICER |
PINTALUBA ESPORRIN ANDRES |
23/08/2011 |
16 |
|
SECRETARY |
PINTALUBA MITJA ANDRES |
23/08/2011 |
8 |
|
REPRESENTATIVE |
JOSE MARIANO HERRAIZ PUCHOL |
11/03/2002 |
1 |
|
ACCOUNTS' AUDITOR / HOLDER |
AUDIT CONCEPT SL |
24/04/2015 |
1 |
Historical
Social Bodies
|
Social Body's Name |
Post published |
End Date |
Other Positions in this Company |
|
AUDIT CONCEPT SOCIEDAD LIMITADA PROFESIONAL |
ACCOUNTS' AUDITOR / HOLDER |
24/03/2015 |
1 |
|
AUDITORES CONSULTORES BALAÑA EGUIA SA |
ACCOUNTS' AUDITOR / HOLDER |
23/08/1996 |
1 |
|
AUDITORES CONSULTORES BALAÑA EGUIA SL |
ACCOUNTS' AUDITOR / HOLDER |
26/10/1999 |
1 |
|
AUDITORES Y CONSULTORES BALAÑA & EGUIA SL |
ACCOUNTS' AUDITOR / HOLDER |
23/01/2008 |
8 |
|
|
CONSOLIDATED ACCOUNTS' AUDITOR |
23/01/2008 |
|
|
|
CONSOLIDATED ACCOUNTS' AUDITOR |
23/02/2009 |
|
|
|
ACCOUNTS' AUDITOR / HOLDER |
23/02/2009 |
|
|
|
ACCOUNTS' AUDITOR / HOLDER |
23/02/2009 |
|
|
|
ACCOUNTS' AUDITOR / HOLDER |
23/08/2011 |
|
|
|
ACCOUNTS' AUDITOR / HOLDER |
21/11/2013 |
|
|
|
CONSOLIDATED ACCOUNTS' AUDITOR |
21/11/2013 |
|
|
AUDITORES Y CONSULTORES BALAÑA EGUIA SL |
ACCOUNTS' AUDITOR / HOLDER |
11/03/2002 |
11 |
|
|
ACCOUNTS' AUDITOR / HOLDER |
02/01/2003 |
|
|
|
ACCOUNTS' AUDITOR / HOLDER |
13/01/2004 |
|
|
|
ACCOUNTS' AUDITOR / HOLDER |
11/01/2005 |
|
|
|
ACCOUNTS' AUDITOR / HOLDER |
03/01/2007 |
|
|
|
CONSOLIDATED ACCOUNTS' AUDITOR |
03/01/2007 |
|
|
|
CONSOLIDATED ACCOUNTS' AUDITOR |
03/01/2007 |
|
|
|
CONSOLIDATED ACCOUNTS' AUDITOR |
22/03/2001 |
|
|
|
CONSOLIDATED ACCOUNTS' AUDITOR |
11/03/2002 |
|
|
|
CONSOLIDATED ACCOUNTS' AUDITOR |
02/01/2003 |
|
|
|
CONSOLIDATED ACCOUNTS' AUDITOR |
12/12/2005 |
|
|
AUDITORES Y CONSULTORES BALAÑA EGUIA SLP |
ACCOUNTS' AUDITOR / HOLDER |
24/03/2015 |
2 |
|
|
ACCOUNTS' AUDITOR / HOLDER |
24/04/2015 |
|
|
MITJA MARTI JOSE MARIA |
MEMBER OF THE BOARD |
23/08/2011 |
8 |
|
|
PROXY |
09/07/1996 |
|
|
|
CHIEF EXECUTIVE OFFICER |
07/07/2006 |
|
|
|
PRESIDENT |
09/07/1996 |
|
|
|
PRESIDENT |
13/09/2001 |
|
|
|
PRESIDENT |
07/07/2006 |
|
|
|
PRESIDENT |
23/08/2011 |
|
|
MITJA SASTRE JOSE MARIA |
PRESIDENT |
13/09/2001 |
1 |
|
MITJA SASTRE MARIA GLORIA |
PROXY |
28/01/1999 |
4 |
|
|
SECRETARY |
09/07/1996 |
|
|
|
SECRETARY |
28/01/1999 |
|
|
PINTALUBA ESPORRIN ANDRES |
SINGLE ADMINISTRATOR |
11/10/1991 |
16 |
|
|
MEMBER OF THE BOARD |
07/07/2006 |
|
|
|
MEMBER OF THE BOARD |
23/08/2011 |
|
|
|
CHIEF EXECUTIVE OFFICER |
09/07/1996 |
|
|
|
CHIEF EXECUTIVE OFFICER |
28/01/1999 |
|
|
|
CHIEF EXECUTIVE OFFICER |
13/09/2001 |
|
|
|
CHIEF EXECUTIVE OFFICER |
07/07/2006 |
|
|
|
CHIEF EXECUTIVE OFFICER |
23/08/2011 |
|
|
|
SECRETARY |
13/09/2001 |
|
|
|
SECRETARY |
07/07/2006 |
|
|
|
SECRETARY |
23/08/2011 |
|
|
|
MEMBER |
09/07/1996 |
|
|
|
MEMBER |
13/09/2001 |
|
|
PINTALUBA MITJA ANDRES |
MEMBER |
09/07/1996 |
8 |
|
|
MEMBER OF THE BOARD |
23/08/2011 |
|
|
|
MEMBER OF THE BOARD |
07/07/2006 |
|
|
|
MEMBER OF THE BOARD |
13/09/2001 |
|
|
|
MEMBER |
28/01/1999 |
|
|
PINTALUBA MITJA MARIA GLORIA |
MEMBER |
09/07/1996 |
3 |
|
|
MEMBER |
28/01/1999 |
|
|
PINTALUBA MITJA MERITXELL |
MEMBER |
09/07/1996 |
3 |
|
|
MEMBER |
28/01/1999 |
|
Executive
board
|
Post |
NIF |
Name |
|
FINANCIAL DIRECTOR |
|
JOAQUIN CABRE LLABERIA |
|
MANAGING DIRECTOR |
|
ANDRES PINTALUBA MITJA |
Defaults, Legal
Claims and Insolvency Proceedings
Section enabling assessment of the degree of compliance of the company queried with its payment obligations. It provides information on the existence and nature of all stages of Insolvency and Legal Proceedings published with reference to the Company in the country's various Official Bulletins and national newspapers, as well Defaults Registered in the main national credit bureaus (ASNEF Industrial and RAI ).
> Summary
Chronological
summary
|
|
|
Number
of Publications |
Amount
(_) |
Start
date |
End
date |
|
Insolvency
Proceedings, Bankruptcy and Suspension of Payments |
|
Unpublished |
--- |
--- |
--- |
|
Request/Declaration |
|
0 |
--- |
date |
|
|
Proceedings |
|
--- |
--- |
|
--- |
|
Resolution |
|
--- |
--- |
|
--- |
|
Defaults
on debt with Financial Institutions and Large Companies |
Bank
and Commercial Delinquency |
None |
0 |
|
|
|
Status:
Friendly |
|
--- |
|
|
|
|
Status:
Pre-Litigation |
|
--- |
|
|
|
|
Status:
Litigation |
|
--- |
|
|
|
|
Status:
Non-performing |
|
--- |
|
|
|
|
Status:
insolvency proceedings, bankruptcy and suspension of payments |
|
--- |
|
|
|
|
Other
status |
|
--- |
|
|
|
|
Legal
and Administrative Proceedings |
|
Unpublished |
--- |
|
|
|
Notices
of defaults and enforcement |
|
--- |
--- |
|
--- |
|
Seizures |
|
--- |
--- |
|
--- |
|
Auctions |
|
--- |
--- |
|
--- |
|
Declarations
of insolvency and bad debt |
|
--- |
--- |
|
--- |
|
Proceedings
heard by the Civil Court |
|
Unpublished |
--- |
|
|
|
Proceedings
heard by the Labour Court |
|
Unpublished |
--- |
|
|
>
Details
> Basis for scoring
|
Positive Factors |
Adverse Factors |
|
No judicial claims have been detected in the Official Gazettes, regarding
any Entity's outstanding debts with the Tax Bureau or Social Security
administrations, as submitted by Courts of the various court jurisdictions. No irregular payment performance has been detected based on
information obtained from credit bureaus. It is one of the major domestic companies in terms of sales volume. ANDRES PINTALUBA SOCIEDAD ANONIMA 's borrowing cost is appropriate
according to its volume of external financing sources. Significant operating income. The Company has the necessary return on
the investments for its main activity in comparison with its assets. This
return is higher than that of the financial year 2012 which means that the
company's financial situation has improved. |
The development of the debt structure during the last two years
indicates an increase of the debt with credit institutions and trade
creditors in respect to all liabilities. The higher the level of debt, the
greater the dependence on suppliers' capital and the more compromised will be
its financial situation. Reduced level of liquidity. The company shows not enough capacity to
meet its obligations with a maturity of less than one year with the available
liquid assets. In the previous 3 financial years, the company presented modified
audit reports. |
Probability
of default
> Estimated Probability of Default for the next 12 months: 0.434 %
|
Sector in which comparison is carried out: 467 Other specialised wholesale |
|
|
Relative Position:
|
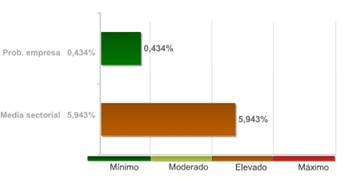
The company's comparative analysis with the rest of the companies that comprise the sector, shows the company holds a better position with regard to the probability of non-compliance.
The 99.00% of the companies of the sector ANDRES PINTALUBA SOCIEDAD ANONIMA belongs to show a higher probability of non-compliance.
The probability of the company's non-compliance with its payment obligations within deadlines estimated by our qualifications models is 0.434%.
In the event they fail to comply with the payment, the seriousness of the loss will depend on factors such as the promptness of the commencement of the charging management, the existence of executive documents which match the credit or the existence of guarantees and free debt assets under the name of the debtor. Therefore, the probability of non-compliance should not be solely interpreted as the total loss of the owed amount.
LEGAL
CLAIMS
Summary of Judicial Claims
|
|
|
|
|
|
|
|
||
|
|
|
No
se han publicado |
|
|
|
|
No
se han publicado |
|
|
|
|
||
|
|
|
No
se han publicado |
|
|
|
|
No
se han publicado |
|
|
|
|
No
se han publicado |
|
|
|
|
No
se han publicado |
|
|
|
|
||
|
|
|
No
se han publicado |
|
|
|
|
No
se han publicado |
|
|
|
|
||
|
|
|
No
se han publicado |
|
Guarantees
|
References |
|
|
|
|
Link
List
|
BELONGS TO THE ADMINISTRATION BOARD OF: |
1 Entities |
|
IS RELATED WITH: |
6 Entities |
|
PARTICIPATES IN: |
15 Entities |
|
SE ESCINDE PARCIALMENTE EN: |
2 Entities |
|
SHAREHOLDERS: |
3 Entities |
> Shareholders
|
Relationship |
Entity |
Province |
Shareholding stake |
|
SHAREHOLDERS |
ANDRES PINTALUBA ESPORRIN |
|
|
|
|
ANGLOXELL VALORES Y
PARTICIPACIONES SOCIEDAD LIMITADA |
TARRAGONA |
99.99 |
|
|
MARIA GLORIA MITJA SASTRE |
|
|
|
PARTICIPATES IN |
POLICHEM SOCIEDAD LIMITADA |
TARRAGONA |
100 |
|
|
ADIVETER SOCIEDAD LIMITADA |
TARRAGONA |
75.06 |
|
|
LABORATORIOS APSA SOCIEDAD
LIMITADA |
TARRAGONA |
98 |
|
|
APSA LOGISTICS SOCIEDAD
LIMITADA |
TARRAGONA |
99.99 |
|
|
APSA INTERNACIONAL,
SOCIEDAD ANONIMA, (ARGENTINA) |
|
69 |
|
|
VETALMEX ADITIVOS QUIMICOS
LDA (PORTUGAL) |
|
99.98 |
|
|
MATERIAS Y ACTIVIDADES
SOCIEDAD DE RESPONSABILIDAD LIMITADA |
TARRAGONA |
99.81 |
|
|
APSA LAB SOCIEDAD LIMITADA |
TARRAGONA |
75 |
|
|
PINTALUBA IMPORTAÇAO E COMERCIO
DE PRODUCTOS AGROPECUARIOS LTDA (BRASIL) |
|
100 |
|
|
VETALMEX ADITIVOS QUIMICOS
LDA |
|
99.98 |
|
|
APSA INTERNACIONAL, S.A. |
|
69 |
|
|
APSA TECH 2003 SOCIEDAD
LIMITADA |
TARRAGONA |
|
|
|
ADIVETER ARGENTINA, S.A. |
|
|
|
|
ADIVETER INTERNACIONAL
SOCIEDAD LIMITADA |
TARRAGONA |
|
|
|
PRODUCTOS AGROPECUARIOS
LPDA (BRASIL) |
|
100 |
> Other relationships
|
Relationship |
Entity |
Province |
Shareholding stake |
|
IS RELATED WITH |
| | |
|
|
|
|
ADIVETER INTERNACIONAL
SOCIEDAD LIMITADA |
TARRAGONA |
|
|
|
ADIVETER ARGENTINA, S.A. |
|
|
|
|
POLICHEM LIBIA DE
FABRICACION Y PRODUCCION DE MEDICAMENTOS DE USO VETERINARIO Y COMPUESTOS DE
PIENSO |
|
|
|
|
POLICHEM LYBIA, S.A. |
|
|
|
|
IBERDROLA INGENIERIA Y
CONSTRUCCION SOCIEDAD ANONIMA |
VIZCAYA |
|
|
|
ANGLOXELL VALORES Y
PARTICIPACIONES SOCIEDAD LIMITADA |
TARRAGONA |
|
|
SE ESCINDE PARCIALMENTE EN |
ANGLOXELL INMOBILIARIA,
S.L. |
TARRAGONA |
|
|
|
| | |
|
|
|
BELONGS TO THE
ADMINISTRATION BOARD OF |
APSA LAB SOCIEDAD LIMITADA |
TARRAGONA |
|
Turnover
|
Total Sales 2013 |
133.891.653,67 |
The sales data is from the latest available financial statements. Failing
that, are estimates data calculated by statistical methods.
Estimated
Balance
|
ESTIMED FIGURES FOR 2.014 -NOT
CURRENT ASSETS.....................................................10.777.000
Euro/s -CURRENT ASSETS...........................................................60.852.000
Euro/s -NET
EQUITY.............................................................29.851.000
Euro/s -NOT CURRENT
LIABILITIES.......................................................3.960.000
Euro/s -CURRENT
LIABILITIES...........................................................37.818.000
Euro/s -TOTAL ................................................71.629.000
Euro/s -SALES
(2.014)...............................................................130.000.000
Euro/s |
Financial
Accounts and Balance Sheets
Financial Years
Presented
|
Ejercicio |
Tipo de Cuentas Anuales |
Fecha Presentacion |
|
2013 |
Normales |
October 2014 |
|
2012 |
Consolidadas |
August 2013 |
|
2012 |
Normales |
October 2013 |
|
2011 |
Consolidadas |
September 2012 |
|
2011 |
Normales |
September 2012 |
|
2010 |
Consolidadas |
July 2012 |
|
2010 |
Normales |
December 2011 |
|
2009 |
Consolidadas |
December 2010 |
|
2009 |
Normales |
September 2000 |
|
2008 |
Consolidadas |
October 2009 |
|
2008 |
Normales |
October 2009 |
|
2007 |
Consolidadas |
October 2008 |
|
2007 |
Normales |
October 2008 |
|
2006 |
Consolidadas |
November 2007 |
|
2006 |
Normales |
October 2007 |
|
2005 |
Consolidadas |
November 2006 |
|
2005 |
Normales |
November 2006 |
|
2004 |
Consolidadas |
October 2005 |
|
2004 |
Normales |
October 2005 |
|
2003 |
Normales |
August 2004 |
|
2003 |
Normales |
August 2004 |
|
2002 |
Consolidadas |
November 2003 |
|
2002 |
Normales |
November 2003 |
|
2001 |
Consolidadas |
October 2002 |
|
2001 |
Normales |
October 2002 |
|
2000 |
Normales |
October 2001 |
|
2000 |
Normales |
December 2001 |
|
1999 |
Normales |
September 2000 |
|
1998 |
Consolidadas |
January 2000 |
|
1998 |
Normales |
October 1999 |
|
1997 |
Consolidadas |
October 1998 |
|
1997 |
Normales |
October 1998 |
|
1996 |
Consolidadas |
September 1997 |
|
1996 |
Normales |
September 1997 |
|
1995 |
Normales |
September 1996 |
|
1994 |
Normales |
August 1995 |
|
1993 |
Normales |
August 1994 |
|
1992 |
Normales |
August 1993 |
|
1991 |
Normales |
August 1992 |
|
1990 |
Normales |
July 1991 |
|
1989 |
Normales |
July 1990 |
The data in the report regarding the last
Company Accounts submitted by the company is taken from the TRADE REGISTER
serving the region in which the company's address is located 31/12/2013
> Normal
format Balance in accordance with the New Accounting Plan 2007
Information corresponding to the fiscal year
2013 2012 2011 2010 2009 is taken from information
submitted to the TRADE REGISTER. Data corresponding to fiscal years before
2013 2012 2011 2010 2009 has been compiled based on
the equivalence criteria stipulated in Act JUS/206/2009. Where the provisions
of the Act did not establish relevant equivalence criteria. To view details on
the methodology.
|
|
ORIGINAL |
ORIGINAL |
ORIGINAL |
ORIGINAL |
ORIGINAL |
|
|
Assets |
2013 |
2012 |
2011 |
2010 |
2009 |
|
|
A) NON-CURRENT ASSETS: 11000 |
11.099.697,00 |
11.325.992,00 |
12.081.092,00 |
11.967.284,00 |
12.956.632,00 |
|
|
I. Intangible fixed
assets : 11100 |
3.248.475,00 |
2.693.778,00 |
2.501.347,00 |
2.247.229,00 |
2.081.411,00 |
|
|
1. Development: 11110 |
0,00 |
0,00 |
0,00 |
0,00 |
0,00 |
|
|
2. Concessions: 11120 |
0,00 |
0,00 |
910.536,00 |
695.852,00 |
190.809,00 |
|
|
3.
Patents, licencing, trade marks and similar: 11130 |
601.631,00 |
900.906,00 |
0,00 |
0,00 |
0,00 |
|
|
4. Goodwill: 11140 |
0,00 |
0,00 |
0,00 |
0,00 |
0,00 |
|
|
5. IT applications: 11150 |
26.356,00 |
32.023,00 |
31.243,00 |
17.292,00 |
17.779,00 |
|
|
6. Investigation: 11160 |
0,00 |
0,00 |
0,00 |
0,00 |
0,00 |
|
|
7. Intellectual property: 11180 |
0,00 |
0,00 |
0,00 |
0,00 |
0,00 |
|
|
8.
Greenhouse gas emission allowance: 11190 |
0,00 |
0,00 |
0,00 |
0,00 |
0,00 |
|
|
9. Other intangible fixed assets. : 11170 |
2.620.489,00 |
1.760.849,00 |
1.559.567,00 |
1.534.085,00 |
1.872.824,00 |
|
|
II. Tangible fixed
assets : 11200 |
3.452.528,00 |
4.082.771,00 |
4.770.792,00 |
4.908.960,00 |
5.658.011,00 |
|
|
1. Land and buildings: 11210 |
1.112.949,00 |
1.168.326,00 |
1.223.703,00 |
1.279.768,00 |
1.378.774,00 |
|
|
2. Technical installations and other tangible fixed assets: 11220 |
2.315.359,00 |
2.914.446,00 |
3.185.237,00 |
3.328.768,00 |
3.978.813,00 |
|
|
3. Tangible asset in progress and advances: 11230 |
24.220,00 |
0,00 |
361.853,00 |
300.424,00 |
300.424,00 |
|
|
III. Real estate
investment: 11300 |
0,00 |
0,00 |
0,00 |
0,00 |
0,00 |
|
|
1. Land: 11310 |
0,00 |
0,00 |
0,00 |
0,00 |
0,00 |
|
|
2. Buildings: 11320 |
0,00 |
0,00 |
0,00 |
0,00 |
0,00 |
|
|
IV. Long-term
investments in Group companies and associates : 11400 |
4.051.706,00 |
4.348.050,00 |
4.604.464,00 |
4.594.384,00 |
4.933.423,00 |
|
|
1. Equity instruments: 11410 |
3.789.191,00 |
4.085.535,00 |
4.341.949,00 |
4.331.869,00 |
4.287.908,00 |
|
|
2. Credits to businesses: 11420 |
262.515,00 |
262.515,00 |
262.515,00 |
262.515,00 |
645.515,00 |
|
|
3. Debt securities: 11430 |
0,00 |
0,00 |
0,00 |
0,00 |
0,00 |
|
|
4. Derivatives : 11440 |
0,00 |
0,00 |
0,00 |
0,00 |
0,00 |
|
|
5. Other financial assets : 11450 |
0,00 |
0,00 |
0,00 |
0,00 |
0,00 |
|
|
6. Other investments: 11460 |
0,00 |
0,00 |
0,00 |
0,00 |
0,00 |
|
|
V. Long-term
financial investments: 11500 |
242.981,00 |
201.393,00 |
204.489,00 |
216.712,00 |
283.787,00 |
|
|
1. Equity instruments: 11510 |
157.858,00 |
130.159,00 |
135.263,00 |
151.376,00 |
224.451,00 |
|
|
2. Credits to third parties : 11520 |
0,00 |
0,00 |
0,00 |
0,00 |
0,00 |
|
|
3. Debt securities: 11530 |
0,00 |
0,00 |
0,00 |
0,00 |
0,00 |
|
|
4. Derivatives : 11540 |
0,00 |
0,00 |
0,00 |
0,00 |
0,00 |
|
|
5. Other financial assets : 11550 |
85.123,00 |
71.234,00 |
69.225,00 |
65.335,00 |
59.335,00 |
|
|
6. Other investments: 11560 |
0,00 |
0,00 |
0,00 |
0,00 |
0,00 |
|
|
VI. Assets for
deferred tax : 11600 |
104.007,00 |
0,00 |
0,00 |
0,00 |
0,00 |
|
|
VII. Non-current
trade debts : 11700 |
0,00 |
0,00 |
0,00 |
0,00 |
0,00 |
|
|
B) CURRENT ASSETS: 12000 |
62.674.010,00 |
58.688.079,00 |
52.231.797,00 |
52.069.115,00 |
43.484.628,00 |
|
|
I. Non-current assets
held for sale : 12100 |
0,00 |
0,00 |
0,00 |
0,00 |
0,00 |
|
|
II. Stocks:
12200 |
10.956.780,00 |
11.045.488,00 |
12.515.337,00 |
10.271.100,00 |
7.537.440,00 |
|
|
1. Commercial: 12210 |
8.960.466,00 |
9.180.479,00 |
10.516.612,00 |
8.786.959,00 |
6.388.095,00 |
|
|
2. Primary material and other supplies: 12220 |
253.959,00 |
228.715,00 |
239.013,00 |
234.196,00 |
133.186,00 |
|
|
3. Work in progress: 12230 |
94.085,00 |
9.475,00 |
16.732,00 |
15.280,00 |
7.039,00 |
|
|
a) Of long-term production cycle : 12231 |
0,00 |
0,00 |
0,00 |
0,00 |
0,00 |
|
|
b) Of short-term production cycle : 12232 |
94.085,00 |
9.475,00 |
16.732,00 |
15.280,00 |
7.039,00 |
|
|
4. Finished goods: 12240 |
1.638.734,00 |
1.620.450,00 |
1.751.487,00 |
1.234.533,00 |
1.009.119,00 |
|
|
a) Of long-term production cycle : 12241 |
0,00 |
0,00 |
0,00 |
0,00 |
0,00 |
|
|
b) Of short-term production cycle : 12242 |
1.638.734,00 |
1.620.450,00 |
1.751.487,00 |
1.234.533,00 |
1.009.119,00 |
|
|
5.
By-products, residues and recycled materials: 12250 |
0,00 |
0,00 |
0,00 |
0,00 |
0,00 |
|
|
6. Advances to suppliers: 12260 |
9.536,00 |
6.369,00 |
-8.507,00 |
131,00 |
0,00 |
|
|
III. Trade debtors and
others receivable accounts: 12300 |
41.833.940,00 |
42.237.624,00 |
38.692.597,00 |
38.114.624,00 |
32.748.344,00 |
|
|
1. Trade debtors / accounts receivable: 12310 |
35.409.719,00 |
34.778.003,00 |
31.476.831,00 |
31.268.460,00 |
27.119.478,00 |
|
|
a) Long-term receivables from sales and services
supplied : 12311 |
0,00 |
0,00 |
0,00 |
0,00 |
0,00 |
|
|
b) Customers for sales and provisions of services :
12312 |
35.409.719,00 |
34.778.003,00 |
31.476.831,00 |
31.268.460,00 |
27.119.478,00 |
|
|
2. Customers, Group companies and associates : 12320 |
6.195.397,00 |
6.747.091,00 |
6.603.701,00 |
6.376.497,00 |
5.164.831,00 |
|
|
3.
Other accounts receivable: 12330 |
202.666,00 |
678.100,00 |
347.996,00 |
392.629,00 |
274.388,00 |
|
|
4. Personnel: 12340 |
26.159,00 |
34.430,00 |
38.575,00 |
36.418,00 |
53.343,00 |
|
|
5.
Assets for deferred tax: 12350 |
0,00 |
0,00 |
0,00 |
0,00 |
0,00 |
|
|
6. Other debtors, including tax and social security: 12360 |
0,00 |
0,00 |
225.493,00 |
40.621,00 |
136.303,00 |
|
|
7.
Called up share capital: 12370 |
0,00 |
0,00 |
0,00 |
0,00 |
0,00 |
|
|
IV. Short-term
investments in Group companies and associates: 12400 |
0,00 |
454.210,00 |
-628.419,00 |
2.714.829,00 |
0,00 |
|
|
1.
Equity instruments: 12410 |
0,00 |
454.210,00 |
-628.419,00 |
2.714.829,00 |
0,00 |
|
|
2. Credits to businesses: 12420 |
0,00 |
0,00 |
0,00 |
0,00 |
0,00 |
|
|
3. Debt securities: 12430 |
0,00 |
0,00 |
0,00 |
0,00 |
0,00 |
|
|
4. Derivatives : 12440 |
0,00 |
0,00 |
0,00 |
0,00 |
0,00 |
|
|
5. Other financial assets : 12450 |
0,00 |
0,00 |
0,00 |
0,00 |
0,00 |
|
|
6. Other investments: 12460 |
0,00 |
0,00 |
0,00 |
0,00 |
0,00 |
|
|
V. Short-term
financial investments : 12500 |
5.335.711,00 |
3.500.860,00 |
0,00 |
0,00 |
2.335.387,00 |
|
|
1. Equity instruments: 12510 |
0,00 |
0,00 |
0,00 |
0,00 |
0,00 |
|
|
2.
Credits to businesses: 12520 |
0,00 |
0,00 |
0,00 |
0,00 |
0,00 |
|
|
3. Debt securities: 12530 |
0,00 |
1.490.860,00 |
0,00 |
0,00 |
0,00 |
|
|
4. Derivatives : 12540 |
0,00 |
0,00 |
0,00 |
0,00 |
0,00 |
|
|
5. Other financial assets : 12550 |
5.335.711,00 |
2.010.000,00 |
0,00 |
0,00 |
2.335.387,00 |
|
|
6. Other investments: 12560 |
0,00 |
0,00 |
0,00 |
0,00 |
0,00 |
|
|
VI. Short-term
accruals: 12600 |
155.633,00 |
47.001,00 |
44.799,00 |
25.416,00 |
53.304,00 |
|
|
VII. Cash and other
equivalent liquid assets : 12700 |
4.391.946,00 |
1.402.895,00 |
1.607.482,00 |
943.146,00 |
810.153,00 |
|
|
1. Treasury: 12710 |
4.391.946,00 |
1.402.895,00 |
1.607.482,00 |
943.146,00 |
810.153,00 |
|
|
2. Other equivalent liquid assets: 12720 |
0,00 |
0,00 |
0,00 |
0,00 |
0,00 |
|
|
TOTAL ASSETS (A + B) : 10000 |
73.773.707,00 |
70.014.071,00 |
64.312.888,00 |
64.036.399,00 |
56.441.260,00 |
|
|
|
ORIGINAL |
ORIGINAL |
ORIGINAL |
ORIGINAL |
ORIGINAL |
|
|
Liabilities and Net Worth |
2013 |
2012 |
2011 |
2010 |
2009 |
|
|
A) NET WORTH: 20000 |
30.744.349,00 |
28.489.134,00 |
25.882.751,00 |
24.321.983,00 |
22.095.162,00 |
|
|
A-1) Shareholders'
equity: 21000 |
30.290.150,00 |
28.168.053,00 |
25.641.374,00 |
24.014.104,00 |
21.682.219,00 |
|
|
I. Capital:
21100 |
6.000.000,00 |
6.000.000,00 |
6.000.000,00 |
6.000.000,00 |
6.000.000,00 |
|
|
1. Registered capital : 21110 |
6.000.000,00 |
6.000.000,00 |
6.000.000,00 |
6.000.000,00 |
6.000.000,00 |
|
|
2. (Uncalled capital): 21120 |
0,00 |
0,00 |
0,00 |
0,00 |
0,00 |
|
|
II. Share premium:
21200 |
0,00 |
0,00 |
0,00 |
0,00 |
0,00 |
|
|
III. Reserves:
21300 |
19.418.053,00 |
18.291.374,00 |
16.114.104,00 |
14.402.219,00 |
13.386.167,00 |
|
|
1.
Legal and statutory: 21310 |
1.200.000,00 |
1.200.000,00 |
1.200.000,00 |
1.200.000,00 |
1.200.000,00 |
|
|
2. Other reserves: 21320 |
18.218.053,00 |
17.091.374,00 |
14.914.104,00 |
13.202.219,00 |
12.186.167,00 |
|
|
3. Revaluation reserves: 21330 |
0,00 |
0,00 |
0,00 |
0,00 |
0,00 |
|
|
IV. (Common stock
equity): 21400 |
0,00 |
0,00 |
0,00 |
0,00 |
0,00 |
|
|
V. Results from
previous periods: 21500 |
0,00 |
0,00 |
0,00 |
0,00 |
0,00 |
|
|
1. Brought forward: 21510 |
0,00 |
0,00 |
0,00 |
0,00 |
0,00 |
|
|
2. (Negative results from previous periods): 21520 |
0,00 |
0,00 |
0,00 |
0,00 |
0,00 |
|
|
VI. Other
shareholders' contributions: 21600 |
0,00 |
0,00 |
0,00 |
0,00 |
0,00 |
|
|
VII. Result of the
period: 21700 |
4.872.097,00 |
3.876.678,00 |
3.527.271,00 |
3.611.885,00 |
2.296.052,00 |
|
|
VIII. (Interim
dividend): 21800 |
0,00 |
0,00 |
0,00 |
0,00 |
0,00 |
|
|
IX. Other net worth
instruments: 21900 |
0,00 |
0,00 |
0,00 |
0,00 |
0,00 |
|
|
A-2) Adjustments due
to changes in value: 22000 |
47.709,00 |
28.319,00 |
31.892,00 |
43.172,00 |
94.324,00 |
|
|
I. Financial assets held
for sale: 22100 |
47.709,00 |
28.319,00 |
31.892,00 |
43.172,00 |
94.324,00 |
|
|
II. Hedge operations:
22200 |
0,00 |
0,00 |
0,00 |
0,00 |
0,00 |
|
|
III. Linked
non-current assets and liabilities held for sale : 22300 |
0,00 |
0,00 |
0,00 |
0,00 |
0,00 |
|
|
IV. Exchange rate
difference: 22400 |
0,00 |
0,00 |
0,00 |
0,00 |
0,00 |
|
|
V. Other: 22500 |
0,00 |
0,00 |
0,00 |
0,00 |
0,00 |
|
|
A-3) Received subsidies,
donations and legacies: 23000 |
406.491,00 |
292.762,00 |
209.484,00 |
264.708,00 |
318.619,00 |
|
|
B) NON-CURRENT LIABILITIES: 31000 |
4.079.050,00 |
5.526.554,00 |
2.508.335,00 |
3.139.837,00 |
4.504.103,00 |
|
|
I. Long-term
provisions: 31100 |
304.562,00 |
248.911,00 |
207.687,00 |
82.346,00 |
308.820,00 |
|
|
1. Long-term employee benefits liability: 31110 |
221.205,00 |
165.553,00 |
124.330,00 |
82.346,00 |
40.537,00 |
|
|
2.
Environmental actions: 31120 |
0,00 |
0,00 |
0,00 |
0,00 |
0,00 |
|
|
3. Restructuring provisions: 31130 |
0,00 |
0,00 |
0,00 |
0,00 |
0,00 |
|
|
4. Other provisions: 31140 |
83.358,00 |
83.358,00 |
83.358,00 |
0,00 |
268.283,00 |
|
|
II Long-term
creditors: 31200 |
3.576.375,00 |
5.136.341,00 |
2.193.264,00 |
2.512.217,00 |
3.182.403,00 |
|
|
1. Liabilities and other securities: 31210 |
0,00 |
0,00 |
0,00 |
0,00 |
0,00 |
|
|
2. Amounts owed to credit institutions: 31220 |
2.219.168,00 |
3.317.504,00 |
602.641,00 |
0,00 |
2.257.761,00 |
|
|
3. Creditors from financial leasing: 31230 |
56.577,00 |
109.396,00 |
149.940,00 |
0,00 |
381.754,00 |
|
|
4. Derivatives : 31240 |
0,00 |
0,00 |
0,00 |
0,00 |
0,00 |
|
|
5. Other financial liabilities : 31250 |
1.300.630,00 |
1.709.441,00 |
1.440.683,00 |
2.512.217,00 |
542.887,00 |
|
|
III. Long-term debts with
Group companies and associates: 31300 |
0,00 |
0,00 |
0,00 |
400.000,00 |
800.000,00 |
|
|
IV. Liabilities for
deferred tax: 31400 |
198.112,00 |
141.302,00 |
107.384,00 |
145.274,00 |
212.880,00 |
|
|
V. Long-term accruals:
31500 |
0,00 |
0,00 |
0,00 |
0,00 |
0,00 |
|
|
VI. Non-current trade
creditors : 31600 |
0,00 |
0,00 |
0,00 |
0,00 |
0,00 |
|
|
VII. Special
long-term debts : 31700 |
0,00 |
0,00 |
0,00 |
0,00 |
0,00 |
|
|
C) CURRENT LIABILITIES : 32000 |
38.950.308,00 |
35.998.382,00 |
35.921.802,00 |
36.574.579,00 |
29.841.994,00 |
|
|
I. Liabilities linked
to non-current assets held for sale: 32100 |
0,00 |
0,00 |
0,00 |
0,00 |
0,00 |
|
|
II. Short-term
provisions: 32200 |
0,00 |
0,00 |
0,00 |
0,00 |
0,00 |
|
|
1. Provisions from greenhouse gas emission allowance: 32210 |
0,00 |
0,00 |
0,00 |
0,00 |
0,00 |
|
|
2. Other provisions: 32220 |
0,00 |
0,00 |
0,00 |
0,00 |
0,00 |
|
|
III. Short-term
creditors : 32300 |
16.677.678,00 |
11.712.538,00 |
11.457.196,00 |
13.594.310,00 |
9.105.052,00 |
|
|
1. Liabilities and other securities: 32310 |
0,00 |
0,00 |
0,00 |
0,00 |
0,00 |
|
|
2. Amounts owed to credit institutions: 32320 |
16.281.019,00 |
11.398.404,00 |
10.989.028,00 |
12.384.522,00 |
8.711.963,00 |
|
|
3. Creditors from financial leasing: 32330 |
41.257,00 |
40.011,00 |
198.947,00 |
258.777,00 |
309.721,00 |
|
|
4. Derivatives : 32340 |
0,00 |
0,00 |
0,00 |
0,00 |
0,00 |
|
|
5. Other financial liabilities : 32350 |
355.402,00 |
274.123,00 |
269.221,00 |
951.011,00 |
83.367,00 |
|
|
IV. Short-term debts
with Group companies and associates: 32400 |
71.775,00 |
0,00 |
560.634,00 |
475.798,00 |
475.798,00 |
|
|
V. Trade creditors
and other accounts payable: 32500 |
21.108.099,00 |
22.921.043,00 |
22.412.213,00 |
21.329.644,00 |
19.040.515,00 |
|
|
1. Suppliers: 32510 |
15.801.312,00 |
17.265.298,00 |
17.539.157,00 |
16.954.131,00 |
15.369.971,00 |
|
|
a) Long-term debts : 32511 |
0,00 |
0,00 |
0,00 |
0,00 |
0,00 |
|
|
b) Short-term debts : 32512 |
15.801.312,00 |
17.265.298,00 |
17.539.157,00 |
16.954.131,00 |
15.369.971,00 |
|
|
2. Suppliers, Group companies and associates: 32520 |
2.145.352,00 |
2.085.613,00 |
1.758.934,00 |
1.907.094,00 |
1.532.674,00 |
|
|
3. Other creditors: 32530 |
2.391.156,00 |
2.940.125,00 |
2.575.334,00 |
1.934.567,00 |
1.633.571,00 |
|
|
4. Personnel (remuneration due): 32540 |
439.369,00 |
439.734,00 |
385.082,00 |
366.800,00 |
300.708,00 |
|
|
5. Liabilities for current tax: 32550 |
0,00 |
0,00 |
0,00 |
0,00 |
0,00 |
|
|
6. Other accounts payable to Public Administrations.: 32560 |
330.911,00 |
190.273,00 |
153.706,00 |
167.052,00 |
203.590,00 |
|
|
7. Advances from clients: 32570 |
0,00 |
0,00 |
0,00 |
0,00 |
0,00 |
|
|
VI. Short-term
accruals: 32600 |
1.092.756,00 |
1.364.801,00 |
1.491.759,00 |
1.174.828,00 |
1.220.630,00 |
|
|
VII. Special
short-term debts : 32700 |
0,00 |
0,00 |
0,00 |
0,00 |
0,00 |
|
|
TOTAL NET WORTH AND LIABILITIES (A + B +
C) : 30000 |
73.773.707,00 |
70.014.071,00 |
64.312.888,00 |
64.036.399,00 |
56.441.260,00 |
|
|
|
ORIGINAL |
ORIGINAL |
ORIGINAL |
ORIGINAL |
ORIGINAL |
|
|
Profit and Loss |
2013 |
2012 |
2011 |
2010 |
2009 |
|
|
1. Net turnover: 40100 |
133.891.654,00 |
135.192.903,00 |
126.707.739,00 |
120.270.770,00 |
102.839.573,00 |
|
|
a) Sales: 40110 |
131.679.158,00 |
133.124.675,00 |
124.984.954,00 |
118.658.976,00 |
101.133.605,00 |
|
|
b) Rendering of
services: 40120 |
2.212.496,00 |
2.068.229,00 |
1.722.785,00 |
1.611.794,00 |
1.705.968,00 |
|
|
c) Income of
financial nature of holding companies: 40130 |
0,00 |
0,00 |
0,00 |
0,00 |
0,00 |
|
|
2. Changes in stocks of finished goods and
work in progress: 40200 |
1.144.556,00 |
923.038,00 |
621.516,00 |
306.972,00 |
82.145,00 |
|
|
3. Works carried out by the company for
its assets: 40300 |
0,00 |
0,00 |
10.686,00 |
18.824,00 |
0,00 |
|
|
4. Supplies : 40400 |
-115.572.808,00 |
-118.014.435,00 |
-110.572.236,00 |
-104.110.281,00 |
-87.515.297,00 |
|
|
a) Stock consumption:
40410 |
-111.857.406,00 |
-114.797.437,00 |
-106.739.720,00 |
-100.767.626,00 |
-85.483.148,00 |
|
|
b) Consumption of raw
materials and miscellaneous consumable ones: 40420 |
-3.566.425,00 |
-2.958.100,00 |
-3.654.961,00 |
-3.174.856,00 |
-2.236.359,00 |
|
|
c) Works carried out
by other companies: 40430 |
-148.978,00 |
-146.743,00 |
-177.555,00 |
-167.798,00 |
-110.314,00 |
|
|
d) Impairment of stock,
primary material and other supplies: 40440 |
0,00 |
-112.155,00 |
0,00 |
0,00 |
314.524,00 |
|
|
5. Other operating income: 40500 |
443.973,00 |
483.420,00 |
720.487,00 |
569.049,00 |
751.979,00 |
|
|
a) Auxiliary income and
other from current management: 40510 |
438.397,00 |
483.292,00 |
549.621,00 |
428.805,00 |
732.029,00 |
|
|
b) Operation
subsidies included in the Period's result: 40520 |
5.576,00 |
129,00 |
170.866,00 |
140.244,00 |
19.950,00 |
|
|
6. Personnel costs: 40600 |
-4.343.896,00 |
-4.406.507,00 |
-3.777.225,00 |
-3.631.187,00 |
-3.375.731,00 |
|
|
a) Wages, salaries et
al.: 40610 |
-3.464.425,00 |
-3.549.709,00 |
-3.011.936,00 |
-2.853.493,00 |
-2.677.688,00 |
|
|
b) Social security
costs: 40620 |
-879.471,00 |
-856.798,00 |
-765.289,00 |
-777.694,00 |
-698.042,00 |
|
|
c) Provisions :
40630 |
0,00 |
0,00 |
0,00 |
0,00 |
0,00 |
|
|
7. Other operating costs: 40700 |
-9.222.266,00 |
-9.165.135,00 |
-8.614.587,00 |
-8.427.683,00 |
-8.842.445,00 |
|
|
a) External services:
40710 |
-8.832.578,00 |
-8.551.897,00 |
-8.205.722,00 |
-8.006.266,00 |
-8.429.544,00 |
|
|
b) Taxes: 40720 |
-75.339,00 |
-51.777,00 |
-68.470,00 |
-79.535,00 |
-41.956,00 |
|
|
c) Losses,
impairments and variation in provisions from trade operations : 40730 |
-314.510,00 |
-567.458,00 |
-341.508,00 |
-344.938,00 |
-325.148,00 |
|
|
d) Other current management
expenditure : 40740 |
161,00 |
5.996,00 |
1.113,00 |
3.055,00 |
-45.797,00 |
|
|
e) Expenses due to
greenhouse gas emissions: 40750 |
0,00 |
0,00 |
0,00 |
0,00 |
0,00 |
|
|
8. Amortisation of fixed assets:
40800 |
-1.155.638,00 |
-1.206.272,00 |
-1.119.693,00 |
-1.127.674,00 |
-1.002.863,00 |
|
|
9. Allocation of subsidies of
non-financial fixed assets and other: 40900 |
87.156,00 |
113.574,00 |
0,00 |
0,00 |
171.735,00 |
|
|
10. Excess provisions : 41000 |
0,00 |
0,00 |
0,00 |
0,00 |
0,00 |
|
|
11. Impairment and result of transfers of
fixed assets: 41100 |
0,00 |
-126.641,00 |
-3.231,00 |
457.007,00 |
224.888,00 |
|
|
a) Impairment and
losses : 41110 |
0,00 |
0,00 |
0,00 |
0,00 |
0,00 |
|
|
b) Results for
transfers and other : 41120 |
0,00 |
-126.641,00 |
-3.231,00 |
457.007,00 |
224.888,00 |
|
|
c) Impairment and
profit due to disposals of assets of holding companies: 41130 |
0,00 |
0,00 |
0,00 |
0,00 |
0,00 |
|
|
12. Negative difference in combined
businesses: 41200 |
0,00 |
0,00 |
0,00 |
0,00 |
0,00 |
|
|
13. Other results : 41300 |
0,00 |
0,00 |
-20.752,00 |
323.565,00 |
0,00 |
|
|
A.1) OPERATING INCOME (1 + 2 + 3 + 4 + 5 +
6 + 7 + 8 + 9 + 10 + 11 + 12 + 13) : 49100 |
5.272.731,00 |
3.793.946,00 |
3.952.704,00 |
4.649.363,00 |
3.333.984,00 |
|
|
14. Financial income : 41400 |
1.524.576,00 |
1.339.520,00 |
585.748,00 |
388.854,00 |
390.443,00 |
|
|
a) Of shares in
equity instruments : 41410 |
1.418.017,00 |
1.307.495,00 |
576.831,00 |
348.000,00 |
348.000,00 |
|
|
a 1) In Group companies and associates: 41411 |
1.418.017,00 |
1.307.495,00 |
576.831,00 |
348.000,00 |
348.000,00 |
|
|
a 2) In third parties: 41412 |
0,00 |
0,00 |
0,00 |
0,00 |
0,00 |
|
|
b) From negotiable
securities and other financial instruments : 41420 |
106.559,00 |
32.025,00 |
8.917,00 |
40.854,00 |
42.443,00 |
|
|
b 1) From Group companies and associates : 41421 |
0,00 |
0,00 |
0,00 |
0,00 |
0,00 |
|
|
b 2) From third parties : 41422 |
106.559,00 |
32.025,00 |
8.917,00 |
40.854,00 |
42.443,00 |
|
|
c) Allocation of
financial subsidies, donations and legacies : 41430 |
0,00 |
0,00 |
0,00 |
0,00 |
0,00 |
|
|
15. Financial expenditure: 41500 |
-435.080,00 |
-397.856,00 |
-388.197,00 |
-128.946,00 |
-443.971,00 |
|
|
a) Amounts owed to
Group companies and associates : 41510 |
0,00 |
0,00 |
0,00 |
0,00 |
0,00 |
|
|
b) For debts with
third parties : 41520 |
-435.080,00 |
-397.856,00 |
-388.197,00 |
-128.946,00 |
-443.971,00 |
|
|
c) Stock renewal :
41530 |
0,00 |
0,00 |
0,00 |
0,00 |
0,00 |
|
|
16. Changes in fair value of financial
instruments : 41600 |
0,00 |
1.897,00 |
-6.037,00 |
-195.595,00 |
0,00 |
|
|
a) Trading book and
other : 41610 |
0,00 |
1.897,00 |
-6.037,00 |
3.485,00 |
0,00 |
|
|
b) Allocation of
financial assets held for sale to the result for the period: 41620 |
0,00 |
0,00 |
0,00 |
-199.080,00 |
0,00 |
|
|
17. Exchange rate differences :
41700 |
-524.989,00 |
-88.881,00 |
91.757,00 |
-19.884,00 |
-144.488,00 |
|
|
18. Impairment and result for transfers of
financial instruments: 41800 |
0,00 |
-251.840,00 |
10.080,00 |
-554.992,00 |
0,00 |
|
|
a) Impairment and
losses : 41810 |
0,00 |
-251.840,00 |
0,00 |
0,00 |
0,00 |
|
|
b) Results for
transfers and other : 41820 |
0,00 |
0,00 |
10.080,00 |
-554.992,00 |
0,00 |
|
|
19. Other financial income and
expenditure: 42100 |
0,00 |
0,00 |
0,00 |
0,00 |
0,00 |
|
|
a) Incorporation of
financial expenditure to assets: 42110 |
0,00 |
0,00 |
0,00 |
0,00 |
0,00 |
|
|
b) Financial income
from arrangement with creditors: 42120 |
0,00 |
0,00 |
0,00 |
0,00 |
0,00 |
|
|
c) Other income and expenditure:
42130 |
0,00 |
0,00 |
0,00 |
0,00 |
0,00 |
|
|
A.2) FINANCIAL REVENUE (14+15+16+17+18+19)
: 49200 |
564.508,00 |
602.841,00 |
293.352,00 |
-510.563,00 |
-198.017,00 |
|
|
A.3) NET RESULT BEFORE TAXES (A.1+A.2) :
49300 |
5.837.239,00 |
4.396.786,00 |
4.246.056,00 |
4.138.800,00 |
3.135.967,00 |
|
|
20. Income taxes: 41900 |
-965.142,00 |
-520.108,00 |
-718.785,00 |
-526.915,00 |
-839.915,00 |
|
|
A.4) PROFIT AFTER TAXES (A.3+20) :
49400 |
4.872.097,00 |
3.876.678,00 |
3.527.271,00 |
3.611.885,00 |
2.296.052,00 |
|
|
21. Result of the year coming from
interrupted operations : 42000 |
0,00 |
0,00 |
0,00 |
0,00 |
0,00 |
|
|
A.5) RESULT OF THE PERIOD (A.4+21) :
49500 |
4.872.097,00 |
3.876.678,00 |
3.527.271,00 |
3.611.885,00 |
2.296.052,00 |
|
> Normal Balance
Sheet under the rules of the 1990 General Accounting Plan (repealed since 1st
January of 2008)
Information corresponding to the fiscal
year 2013 2012 2011 2010 2009 has been compiled based
on the equivalence criteria stipulated in Act JUS/206/2009. Where the
provisions of the Act did not establish relevant equivalence criteria. To view
details on the methodology 2013 2012 2011 2010 2009
is taken from information submitted to the TRADE REGISTER.
|
|
EQUIVALENCIA |
EQUIVALENCIA |
EQUIVALENCIA |
EQUIVALENCIA |
EQUIVALENCIA |
|
|
ASSETS |
2013 |
2012 |
2011 |
2010 |
2009 |
|
|
A) SHAREHOLDERS (PARTNERS) BY UNCALLED
SUSCRIBED CAPITAL: |
0,00 |
0,00 |
0,00 |
0,00 |
0,00 |
|
|
B) FIXED ASSETS: |
10.995.690,00 |
11.325.992,00 |
12.081.092,00 |
11.967.284,00 |
12.956.632,00 |
|
|
I. Formation
expenses: |
0,00 |
0,00 |
0,00 |
0,00 |
0,00 |
|
|
II. Intangible fixed
assets: |
3.248.475,00 |
2.693.778,00 |
2.501.347,00 |
2.247.229,00 |
2.081.411,00 |
|
|
1. Research and development costs: |
0,00 |
0,00 |
0,00 |
0,00 |
0,00 |
|
|
2. Concessions, patents, licences, trademarks et al.: |
601.631,00 |
900.906,00 |
910.536,00 |
695.852,00 |
190.809,00 |
|
|
3. Goodwill: |
0,00 |
0,00 |
0,00 |
0,00 |
0,00 |
|
|
4. Key money paid for premises: |
0,00 |
0,00 |
0,00 |
0,00 |
0,00 |
|
|
5.
Software: |
26.356,00 |
32.023,00 |
31.243,00 |
17.292,00 |
17.779,00 |
|
|
6. Assets under capital leases: |
0,00 |
0,00 |
0,00 |
0,00 |
0,00 |
|
|
7. Payments on account: |
2.620.489,00 |
1.760.849,00 |
1.559.567,00 |
1.534.085,00 |
1.872.824,00 |
|
|
8. Provisions: |
0,00 |
0,00 |
0,00 |
0,00 |
0,00 |
|
|
9. Accumulated depreciation: |
0,00 |
0,00 |
0,00 |
0,00 |
0,00 |
|
|
III. Tangible fixed
assets: |
3.452.528,00 |
4.082.771,00 |
4.770.792,00 |
4.908.960,00 |
5.658.011,00 |
|
|
1. Land and construction: |
1.112.949,00 |
1.168.326,00 |
1.223.703,00 |
1.279.768,00 |
1.378.774,00 |
|
|
2.
Technical installations and machinery: |
1.113.018,00 |
1.401.005,00 |
1.531.177,00 |
1.600.174,00 |
1.912.657,00 |
|
|
3. Other installations, tools and furniture: |
1.045.469,00 |
1.315.979,00 |
1.438.251,00 |
1.503.060,00 |
1.796.579,00 |
|
|
4. Payments on account and tangible fixed assets under construction: |
24.220,00 |
0,00 |
361.853,00 |
300.424,00 |
300.424,00 |
|
|
5. Other tangible assets: |
156.872,00 |
197.462,00 |
215.809,00 |
225.534,00 |
269.576,00 |
|
|
6. Provisions: |
0,00 |
0,00 |
0,00 |
0,00 |
0,00 |
|
|
7. Accumulated depreciation: |
0,00 |
0,00 |
0,00 |
0,00 |
0,00 |
|
|
IV. Financial
investments: |
4.294.687,00 |
4.549.442,00 |
4.808.953,00 |
4.811.096,00 |
5.217.210,00 |
|
|
1. Equity investments in group companies: |
3.789.191,00 |
4.085.535,00 |
4.341.949,00 |
4.331.869,00 |
4.287.908,00 |
|
|
2.
Receivables from group companies: |
262.515,00 |
262.515,00 |
262.515,00 |
262.515,00 |
645.515,00 |
|
|
3. Equity investment in associated companies: |
0,00 |
0,00 |
0,00 |
0,00 |
0,00 |
|
|
4.
Credits to associated companies: |
0,00 |
0,00 |
0,00 |
0,00 |
0,00 |
|
|
5. Long-term securities portfolio: |
157.858,00 |
130.159,00 |
135.263,00 |
151.376,00 |
224.451,00 |
|
|
6. Other receivables: |
0,00 |
0,00 |
0,00 |
0,00 |
0,00 |
|
|
7. Long term guarantees and deposits: |
85.123,00 |
71.234,00 |
69.225,00 |
65.335,00 |
59.335,00 |
|
|
8. Provisions: |
0,00 |
0,00 |
0,00 |
0,00 |
0,00 |
|
|
9.
Long-term receivables from public bodies: |
0,00 |
0,00 |
0,00 |
0,00 |
0,00 |
|
|
V. Own shares: |
0,00 |
0,00 |
0,00 |
0,00 |
0,00 |
|
|
VI. Long-term trade
receivables: |
0,00 |
0,00 |
0,00 |
0,00 |
0,00 |
|
|
C) Deferred expenses: |
0,00 |
0,00 |
0,00 |
0,00 |
0,00 |
|
|
D) CURRENT ASSETS: |
62.778.017,00 |
58.688.079,00 |
52.231.797,00 |
52.069.115,00 |
43.484.628,00 |
|
|
I. Called-up share
capital (not paid): |
0,00 |
0,00 |
0,00 |
0,00 |
0,00 |
|
|
II. Stocks: |
10.956.780,00 |
11.045.488,00 |
12.515.337,00 |
10.271.100,00 |
7.537.440,00 |
|
|
1. Goods for resale: |
8.960.466,00 |
9.180.479,00 |
10.516.612,00 |
8.786.959,00 |
6.388.095,00 |
|
|
2. Raw materials and other consumables: |
253.959,00 |
228.715,00 |
239.013,00 |
234.196,00 |
133.186,00 |
|
|
3. Goods in process and semifinished ones: |
94.085,00 |
9.475,00 |
16.732,00 |
15.280,00 |
7.039,00 |
|
|
4. Finished products: |
1.638.734,00 |
1.620.450,00 |
1.751.487,00 |
1.234.533,00 |
1.009.119,00 |
|
|
5. Byproducts, scrap and recovered materials: |
0,00 |
0,00 |
0,00 |
0,00 |
0,00 |
|
|
6.
Payments on account: |
9.536,00 |
6.369,00 |
-8.507,00 |
131,00 |
0,00 |
|
|
7. Provisions: |
0,00 |
0,00 |
0,00 |
0,00 |
0,00 |
|
|
III. Debtors: |
41.937.948,00 |
42.237.624,00 |
38.692.597,00 |
38.114.624,00 |
32.748.344,00 |
|
|
1. Trade debtors / accounts receivable: |
35.409.719,00 |
34.778.003,00 |
31.476.831,00 |
31.268.460,00 |
27.119.478,00 |
|
|
2. Accounts receivable, Group companies: |
6.195.397,00 |
6.747.091,00 |
6.603.701,00 |
6.376.497,00 |
5.164.831,00 |
|
|
3. Accounts receivable, associated companies: |
0,00 |
0,00 |
0,00 |
0,00 |
0,00 |
|
|
4. Other debtors: |
202.666,00 |
678.100,00 |
347.996,00 |
392.629,00 |
274.388,00 |
|
|
5. Staff: |
26.159,00 |
34.430,00 |
38.575,00 |
36.418,00 |
53.343,00 |
|
|
6. Public bodies: |
104.007,00 |
0,00 |
225.493,00 |
40.621,00 |
136.303,00 |
|
|
7. Provisions: |
0,00 |
0,00 |
0,00 |
0,00 |
0,00 |
|
|
IV. Short-term
investments: |
5.335.711,00 |
3.955.070,00 |
-628.419,00 |
2.714.829,00 |
2.335.387,00 |
|
|
1. Equity investments in group companies: |
0,00 |
454.210,00 |
-628.419,00 |
2.714.829,00 |
0,00 |
|
|
2. Receivables from group companies: |
0,00 |
0,00 |
0,00 |
0,00 |
0,00 |
|
|
3. Equity investment in associated companies: |
0,00 |
0,00 |
0,00 |
0,00 |
0,00 |
|
|
4.
Credits to associated companies: |
0,00 |
0,00 |
0,00 |
0,00 |
0,00 |
|
|
5. Short term securities portfolio: |
0,00 |
1.490.860,00 |
0,00 |
0,00 |
0,00 |
|
|
6. Other receivables: |
0,00 |
0,00 |
0,00 |
0,00 |
0,00 |
|
|
7. Shor term guarantees and deposits: |
5.335.711,00 |
2.010.000,00 |
0,00 |
0,00 |
2.335.387,00 |
|
|
8. Provisions: |
0,00 |
0,00 |
0,00 |
0,00 |
0,00 |
|
|
V. Short-term
treasury shares: |
0,00 |
0,00 |
0,00 |
0,00 |
0,00 |
|
|
VI. Cash at bank and
in hand: |
4.391.946,00 |
1.402.895,00 |
1.607.482,00 |
943.146,00 |
810.153,00 |
|
|
VII. Prepayments and
accrued income: |
155.633,00 |
47.001,00 |
44.799,00 |
25.416,00 |
53.304,00 |
|
|
GENERAL TOTAL (A + B + C + D): |
73.773.707,00 |
70.014.071,00 |
64.312.888,00 |
64.036.399,00 |
56.441.260,00 |
|
MERCANTILE
REGISTRY.
|
|
EQUIVALENCIA |
EQUIVALENCIA |
EQUIVALENCIA |
EQUIVALENCIA |
EQUIVALENCIA |
|
|
LIABILITIES |
2013 |
2012 |
2011 |
2010 |
2009 |
|
|
A) EQUITY: |
30.459.806,00 |
28.284.201,00 |
25.736.112,00 |
24.136.688,00 |
21.872.129,00 |
|
|
I. Subscribed
capital: |
6.000.000,00 |
6.000.000,00 |
6.000.000,00 |
6.000.000,00 |
6.000.000,00 |
|
|
II. Share premium:
|
0,00 |
0,00 |
0,00 |
0,00 |
0,00 |
|
|
III. Revaluation
reserves: |
0,00 |
0,00 |
0,00 |
0,00 |
0,00 |
|
|
IV. Reserves: |
19.587.709,00 |
18.407.522,00 |
16.208.841,00 |
14.524.803,00 |
13.576.077,00 |
|
|
1. Legal reserve: |
1.200.000,00 |
1.200.000,00 |
1.200.000,00 |
1.200.000,00 |
1.200.000,00 |
|
|
2. Reserves for own shares: |
0,00 |
0,00 |
0,00 |
0,00 |
0,00 |
|
|
3. Reserves for shares of the controlling company: |
0,00 |
0,00 |
0,00 |
0,00 |
0,00 |
|
|
4. Statutory reserves: |
0,00 |
0,00 |
0,00 |
0,00 |
0,00 |
|
|
5.
Miscellaneous reserves: |
18.387.709,00 |
17.207.522,00 |
15.008.841,00 |
13.324.803,00 |
12.376.077,00 |
|
|
Differences due to capital adjustement to euros: |
0,00 |
0,00 |
0,00 |
0,00 |
0,00 |
|
|
V. Profit or loss brought
forward: |
0,00 |
0,00 |
0,00 |
0,00 |
0,00 |
|
|
1. Retained earnings: |
0,00 |
0,00 |
0,00 |
0,00 |
0,00 |
|
|
2. Prior year losses: |
0,00 |
0,00 |
0,00 |
0,00 |
0,00 |
|
|
3. Partners' contributions so as to compensate losses: |
0,00 |
0,00 |
0,00 |
0,00 |
0,00 |
|
|
VI. Profit or loss
for the financial year: |
4.872.097,00 |
3.876.678,00 |
3.527.271,00 |
3.611.885,00 |
2.296.052,00 |
|
|
VII. Interim dividend
paid: |
0,00 |
0,00 |
0,00 |
0,00 |
0,00 |
|
|
VIII. Own shares for
capital reduction: |
0,00 |
0,00 |
0,00 |
0,00 |
0,00 |
|
|
B) Deferred income: |
284.543,00 |
204.933,00 |
146.639,00 |
185.296,00 |
223.034,00 |
|
|
1. Capital grants: |
284.543,00 |
204.933,00 |
146.639,00 |
185.296,00 |
223.034,00 |
|
|
2. Unrealised exchange gains: |
0,00 |
0,00 |
0,00 |
0,00 |
0,00 |
|
|
3.
Other deferred income: |
0,00 |
0,00 |
0,00 |
0,00 |
0,00 |
|
|
4. Public revenues to distribute in several financial years: |
0,00 |
0,00 |
0,00 |
0,00 |
0,00 |
|
|
C) PROVISIONS FOR LIABILITIES AND CHARGES:
|
304.562,00 |
248.911,00 |
207.687,00 |
82.346,00 |
308.820,00 |
|
|
1. Provisions for pension fund and other similar obligations: |
221.205,00 |
165.553,00 |
124.330,00 |
82.346,00 |
40.537,00 |
|
|
2. Provisions for taxes: |
0,00 |
0,00 |
0,00 |
0,00 |
268.283,00 |
|
|
3. Other provisions: |
83.358,00 |
83.358,00 |
83.358,00 |
0,00 |
0,00 |
|
|
4. Reversion fund: |
0,00 |
0,00 |
0,00 |
0,00 |
0,00 |
|
|
D) LONG TERM LIABILITIES: |
3.774.487,00 |
5.277.644,00 |
2.300.647,00 |
3.057.491,00 |
4.195.283,00 |
|
|
I. Issued debentures
and other marketable securities: |
0,00 |
0,00 |
0,00 |
0,00 |
0,00 |
|
|
1. Non-convertible debentures: |
0,00 |
0,00 |
0,00 |
0,00 |
0,00 |
|
|
2. Convertible debentures: |
0,00 |
0,00 |
0,00 |
0,00 |
0,00 |
|
|
3. Other debt securities: |
0,00 |
0,00 |
0,00 |
0,00 |
0,00 |
|
|
II. Amounts owed to
credit institutions: |
2.275.745,00 |
3.426.900,00 |
752.580,00 |
0,00 |
2.639.516,00 |
|
|
1. Loans and other liabilities: |
2.219.168,00 |
3.317.504,00 |
602.641,00 |
0,00 |
2.257.761,00 |
|
|
2.
Long-term liabilities from capital leases: |
56.577,00 |
109.396,00 |
149.940,00 |
0,00 |
381.754,00 |
|
|
III. Debts with
companies of the group and affiliated ones: |
0,00 |
0,00 |
0,00 |
400.000,00 |
800.000,00 |
|
|
1. Amounts owed to group companies: |
0,00 |
0,00 |
0,00 |
400.000,00 |
800.000,00 |
|
|
2. Amounts owed to associated companies: |
0,00 |
0,00 |
0,00 |
0,00 |
0,00 |
|
|
IV. Other creditors:
|
1.498.742,00 |
1.850.743,00 |
1.548.067,00 |
2.657.491,00 |
755.767,00 |
|
|
1. Long-term bills of exchange payable: |
0,00 |
0,00 |
0,00 |
0,00 |
0,00 |
|
|
2. Other creditors: |
1.300.630,00 |
1.709.441,00 |
1.440.683,00 |
2.512.217,00 |
542.887,00 |
|
|
3. Long term guarantees and deposits received: |
0,00 |
0,00 |
0,00 |
0,00 |
0,00 |
|
|
4. Long term payables to public bodies: |
198.112,00 |
141.302,00 |
107.384,00 |
145.274,00 |
212.880,00 |
|
|
V. Unpaid portion of
equity investment: |
0,00 |
0,00 |
0,00 |
0,00 |
0,00 |
|
|
1. Group companies: |
0,00 |
0,00 |
0,00 |
0,00 |
0,00 |
|
|
2. Associated companies: |
0,00 |
0,00 |
0,00 |
0,00 |
0,00 |
|
|
3. Third parties: |
0,00 |
0,00 |
0,00 |
0,00 |
0,00 |
|
|
VI. Long term trade
creditors: |
0,00 |
0,00 |
0,00 |
0,00 |
0,00 |
|
|
E) SHORT TERM CREDITORS: |
38.950.308,00 |
35.998.382,00 |
35.921.802,00 |
36.574.579,00 |
29.841.994,00 |
|
|
I. Issued debentures
and other marketable securities: |
0,00 |
0,00 |
0,00 |
0,00 |
0,00 |
|
|
1. Non-convertible debentures: |
0,00 |
0,00 |
0,00 |
0,00 |
0,00 |
|
|
2. Convertible debentures: |
0,00 |
0,00 |
0,00 |
0,00 |
0,00 |
|
|
3. Other debt securities: |
0,00 |
0,00 |
0,00 |
0,00 |
0,00 |
|
|
4. Accrued interest on debentures and other debt securities: |
0,00 |
0,00 |
0,00 |
0,00 |
0,00 |
|
|
II. Amounts owed to
credit institutions: |
16.322.276,00 |
11.438.416,00 |
11.187.975,00 |
12.643.299,00 |
9.021.684,00 |
|
|
1. Loans and other liabilities: |
16.281.019,00 |
11.398.404,00 |
10.989.028,00 |
12.384.522,00 |
8.711.963,00 |
|
|
2. Accrued interest on liabilities with credit institutions: |
0,00 |
0,00 |
0,00 |
0,00 |
0,00 |
|
|
3. Short-term liabilities from capital leases: |
41.257,00 |
40.011,00 |
198.947,00 |
258.777,00 |
309.721,00 |
|
|
III. Short-term
amounts owed to group and associated companies: |
2.217.126,00 |
2.085.613,00 |
2.319.568,00 |
2.382.891,00 |
2.008.472,00 |
|
|
1.
Amounts owed to group companies: |
2.217.126,00 |
2.085.613,00 |
2.319.568,00 |
2.382.891,00 |
2.008.472,00 |
|
|
2. Amounts owed to associated companies: |
0,00 |
0,00 |
0,00 |
0,00 |
0,00 |
|
|
IV. Trade creditors:
|
18.192.468,00 |
20.205.423,00 |
20.114.491,00 |
18.888.698,00 |
17.003.542,00 |
|
|
1. Advanced payments from customers: |
0,00 |
0,00 |
0,00 |
0,00 |
0,00 |
|
|
2. Amounts owed for purchases of goods or services: |
18.192.468,00 |
20.205.423,00 |
20.114.491,00 |
18.888.698,00 |
17.003.542,00 |
|
|
3. Debts represented by notes payable: |
0,00 |
0,00 |
0,00 |
0,00 |
0,00 |
|
|
V. Other creditors:
|
1.125.682,00 |
904.130,00 |
808.009,00 |
1.484.863,00 |
587.665,00 |
|
|
1. Public bodies: |
330.911,00 |
190.273,00 |
153.706,00 |
167.052,00 |
203.590,00 |
|
|
2. Bills of exchange payable: |
0,00 |
0,00 |
0,00 |
0,00 |
0,00 |
|
|
3. Miscellaneous debts: |
355.402,00 |
274.123,00 |
269.221,00 |
951.011,00 |
83.367,00 |
|
|
4. Wages and salaries payable: |
439.369,00 |
439.734,00 |
385.082,00 |
366.800,00 |
300.708,00 |
|
|
5.
Guarantees and deposits received at short term: |
0,00 |
0,00 |
0,00 |
0,00 |
0,00 |
|
|
VI. Provisions:
|
0,00 |
0,00 |
0,00 |
0,00 |
0,00 |
|
|
VII. Prepayments and
accrued income: |
1.092.756,00 |
1.364.801,00 |
1.491.759,00 |
1.174.828,00 |
1.220.630,00 |
|
|
F) SHORT-TERM PROVISIONS FOR LIABILITIES
AND CHARGES: |
0,00 |
0,00 |
0,00 |
0,00 |
0,00 |
|
|
GENERAL TOTAL (A + B + C + D + E + F):
|
73.773.707,00 |
70.014.071,00 |
64.312.888,00 |
64.036.399,00 |
56.441.260,00 |
|
MERCANTILE
REGISTRY.
|
|
EQUIVALENCIA |
EQUIVALENCIA |
EQUIVALENCIA |
EQUIVALENCIA |
EQUIVALENCIA |
|
|
DEBIT |
2013 |
2012 |
2011 |
2010 |
2009 |
|
|
A) CHARGES (A.1 to A.15): |
132.219.818,00 |
134.177.674,00 |
125.220.743,00 |
118.726.642,00 |
102.164.711,00 |
|
|
A.1. Stock reduction of both manufactured goods and the ones in process:
|
0,00 |
0,00 |
0,00 |
0,00 |
0,00 |
|
|
A.2. Supplies: |
115.572.808,00 |
117.902.279,00 |
110.572.236,00 |
104.110.281,00 |
87.829.821,00 |
|
|
a) Stock consumption: |
111.857.406,00 |
114.797.437,00 |
106.739.720,00 |
100.767.626,00 |
85.483.148,00 |
|
|
b) Consumption of raw materials and miscellaneous
consumable ones: |
3.566.425,00 |
2.958.100,00 |
3.654.961,00 |
3.174.856,00 |
2.236.359,00 |
|
|
c) Miscellaneous external expenditure: |
148.978,00 |
146.743,00 |
177.555,00 |
167.798,00 |
110.314,00 |
|
|
A.3. Staff costs: |
4.343.896,00 |
4.406.507,00 |
3.777.225,00 |
3.631.187,00 |
3.375.731,00 |
|
|
a) Wages, salaries et al.: |
3.464.425,00 |
3.549.709,00 |
3.011.936,00 |
2.853.493,00 |
2.677.688,00 |
|
|
b) Social security costs: |
879.471,00 |
856.798,00 |
765.289,00 |
777.694,00 |
698.042,00 |
|
|
A.4. Depreciation expense: |
1.155.638,00 |
1.206.272,00 |
1.119.693,00 |
1.127.674,00 |
1.002.863,00 |
|
|
A.5. Variation of trade provisions and losses of unrecovered receivables:
|
314.510,00 |
679.613,00 |
341.508,00 |
344.938,00 |
10.624,00 |
|
|
a) Stock provision variation: |
0,00 |
112.155,00 |
0,00 |
0,00 |
-314.524,00 |
|
|
b) Variation in provision and bad debt losses: |
314.510,00 |
567.458,00 |
341.508,00 |
344.938,00 |
325.148,00 |
|
|
c) Variation of other trade provisions: |
0,00 |
0,00 |
0,00 |
0,00 |
0,00 |
|
|
A.6. Other operating charges: |
8.907.756,00 |
8.597.678,00 |
8.273.079,00 |
8.082.746,00 |
8.517.297,00 |
|
|
a) External services: |
8.832.578,00 |
8.551.897,00 |
8.205.722,00 |
8.006.266,00 |
8.429.544,00 |
|
|
b) Taxes: |
75.339,00 |
51.777,00 |
68.470,00 |
79.535,00 |
41.956,00 |
|
|
c) Other operating expenses: |
-161,00 |
-5.996,00 |
-1.113,00 |
-3.055,00 |
45.797,00 |
|
|
d) Allocation to revision fund: |
0,00 |
0,00 |
0,00 |
0,00 |
0,00 |
|
|
A.I. OPERATING BENEFITS
(B.1+B.2+B.3+B.4-A.1-A.2-A.3-A.4-A.5-A.6): |
5.185.576,00 |
3.807.013,00 |
3.976.688,00 |
3.868.790,00 |
2.937.361,00 |
|
|
A.7. Financial and similar charges: |
435.080,00 |
397.856,00 |
388.197,00 |
683.938,00 |
443.971,00 |
|
|
a) Due to liabilities with companies of the group:
|
0,00 |
0,00 |
0,00 |
0,00 |
0,00 |
|
|
b) Due to liabilities with associated companies: |
0,00 |
0,00 |
0,00 |
0,00 |
0,00 |
|
|
c) Due to other debts.: |
435.080,00 |
397.856,00 |
388.197,00 |
128.946,00 |
443.971,00 |
|
|
d) Losses from financial investments: |
0,00 |
0,00 |
0,00 |
554.992,00 |
0,00 |
|
|
A.8.
Changes in financial investment provisions: |
0,00 |
251.840,00 |
6.037,00 |
199.080,00 |
0,00 |
|
|
A.9. Exchange losses: |
524.989,00 |
88.881,00 |
0,00 |
19.884,00 |
144.488,00 |
|
|
A.II. NET FINANCIAL INCOME
(B.5+B.6+B.7+B.8-A.7-A.8-A.9): |
564.508,00 |
602.841,00 |
293.352,00 |
0,00 |
0,00 |
|
|
A.III. PROFIT FROM
ORDINARY ACTIVITIES (A.I+A.II-B.I-B.II): |
5.750.083,00 |
4.409.854,00 |
4.270.039,00 |
3.354.743,00 |
2.739.344,00 |
|
|
A.10. Changes in provisions for intangible, tangible and securities
portfolio: |
0,00 |
0,00 |
0,00 |
0,00 |
0,00 |
|
|
A.11. Losses from tangible and intangible fixed assets and securities
portfolio: |
0,00 |
126.641,00 |
3.231,00 |
0,00 |
0,00 |
|
|
A.12. Losses from transactions with own shares and debentures: |
0,00 |
0,00 |
0,00 |
0,00 |
0,00 |
|
|
A.13. Extraordinary expenses: |
0,00 |
0,00 |
20.752,00 |
0,00 |
0,00 |
|
|
A.14. Expenses and losses of former financial years: |
0,00 |
0,00 |
0,00 |
0,00 |
0,00 |
|
|
A.IV. EXTRAORDINARY
PROFIT (B.9+B.10+B.11+B.12+B.13-A.10-A.11-A.12-A.13-A.14): |
87.156,00 |
0,00 |
0,00 |
780.572,00 |
396.623,00 |
|
|
A.V. PROFIT BEFORE
TAXES (A.III+A.IV-B.III-B.IV): |
5.837.239,00 |
4.396.786,00 |
4.246.056,00 |
4.135.315,00 |
3.135.967,00 |
|
|
A.15. Corporation tax: |
965.142,00 |
520.108,00 |
718.785,00 |
526.915,00 |
839.915,00 |
|
|
A.16. Miscellaneous taxes: |
0,00 |
0,00 |
0,00 |
0,00 |
0,00 |
|
|
A.VI. FINANCIAL YEAR
RESULTS (PROFIT) (A.V-A.15-A.16): |
4.872.097,00 |
3.876.678,00 |
3.527.271,00 |
3.608.400,00 |
2.296.052,00 |
|
MERCANTILE
REGISTRY.
|
|
EQUIVALENCIA |
EQUIVALENCIA |
EQUIVALENCIA |
EQUIVALENCIA |
EQUIVALENCIA |
|
|
CREDIT |
2013 |
2012 |
2011 |
2010 |
2009 |
|
|
B) INCOME ( B.1 to B.13): |
137.091.915,00 |
138.054.353,00 |
128.748.014,00 |
122.335.042,00 |
104.460.763,00 |
|
|
B.1. Net total sales: |
133.891.654,00 |
135.192.903,00 |
126.707.739,00 |
120.270.770,00 |
102.839.573,00 |
|
|
a) Sales: |
132.735.649,00 |
134.192.764,00 |
125.987.737,00 |
119.611.004,00 |
101.945.023,00 |
|
|
b) Rendering of services: |
2.212.496,00 |
2.068.229,00 |
1.722.785,00 |
1.611.794,00 |
1.705.968,00 |
|
|
Returns and Rappel on sales: |
-1.056.492,00 |
-1.068.089,00 |
-1.002.782,00 |
-952.028,00 |
-811.418,00 |
|
|
B.2. Stock increase of manufactured goods and products in process: |
1.144.556,00 |
923.038,00 |
621.516,00 |
306.972,00 |
82.145,00 |
|
|
B.3. Works performed by the company for fixed assets: |
0,00 |
0,00 |
10.686,00 |
18.824,00 |
0,00 |
|
|
B.4. Miscellaneous operating income: |
443.973,00 |
483.420,00 |
720.487,00 |
569.049,00 |
751.979,00 |
|
|
a) Auxiliary income and other from current management:
|
438.397,00 |
483.292,00 |
549.621,00 |
428.805,00 |
732.029,00 |
|
|
b) Grants: |
5.576,00 |
129,00 |
170.866,00 |
140.244,00 |
19.950,00 |
|
|
c) Liabilities and charges provisions surplus: |
0,00 |
0,00 |
0,00 |
0,00 |
0,00 |
|
|
B.I. PÉRDIDAS DE
EXPLOTACIÓN (A.1+A.2+A.3+A.4+A.5-A.6-B.1-B.2-B.3-B.4): |
0,00 |
0,00 |
0,00 |
0,00 |
0,00 |
|
|
B.5.
Income from equity investment: |
1.418.017,00 |
1.307.495,00 |
576.831,00 |
348.000,00 |
348.000,00 |
|
|
a) In companies of the group: |
1.418.017,00 |
1.307.495,00 |
576.831,00 |
348.000,00 |
348.000,00 |
|
|
b) In associated companies: |
0,00 |
0,00 |
0,00 |
0,00 |
0,00 |
|
|
c) Third parties: |
0,00 |
0,00 |
0,00 |
0,00 |
0,00 |
|
|
B.6.
Income from other marketable securities and long-term receivables: |
0,00 |
0,00 |
0,00 |
0,00 |
0,00 |
|
|
a) From companies of the group: |
0,00 |
0,00 |
0,00 |
0,00 |
0,00 |
|
|
b) From associated companies: |
0,00 |
0,00 |
0,00 |
0,00 |
0,00 |
|
|
c) From companies out of the group: |
0,00 |
0,00 |
0,00 |
0,00 |
0,00 |
|
|
B.7. Miscellaneous interests or similar income: |
106.559,00 |
33.922,00 |
18.997,00 |
40.854,00 |
42.443,00 |
|
|
a) From companies of the group: |
0,00 |
0,00 |
0,00 |
0,00 |
0,00 |
|
|
b) From associated companies: |
0,00 |
0,00 |
0,00 |
0,00 |
0,00 |
|
|
c) Miscellaneous interests: |
106.559,00 |
32.025,00 |
8.917,00 |
40.854,00 |
42.443,00 |
|
|
d) Profit on financial investment: |
0,00 |
1.897,00 |
10.080,00 |
0,00 |
0,00 |
|
|
B.8.
Exchange positive differences: |
0,00 |
0,00 |
91.757,00 |
0,00 |
0,00 |
|
|
B.II. NEGATIVE
FINANCIAL RESULTS (A.7+A.8+A.9-B.5-B.6-B.7-B.8): |
0,00 |
0,00 |
0,00 |
514.047,00 |
198.017,00 |
|
|
B.III. LOSSES ON ORDINARY
ACTIVITIES ( B.I + B.II - A.I - A.II ): |
0,00 |
0,00 |
0,00 |
0,00 |
0,00 |
|
|
B.9.Profit on disposal of both tangible and intangible fixed assets and
securities portfolio: |
0,00 |
0,00 |
0,00 |
457.007,00 |
224.888,00 |
|
|
B.10. Profit on transactions with own shares and debentures: |
0,00 |
0,00 |
0,00 |
0,00 |
0,00 |
|
|
B.11. Capital grants transferred to profit and loss: |
87.156,00 |
113.574,00 |
0,00 |
0,00 |
171.735,00 |
|
|
B.12. Extraordinary income: |
0,00 |
0,00 |
0,00 |
323.565,00 |
0,00 |
|
|
B.13. Income and profit of former financial years: |
0,00 |
0,00 |
0,00 |
0,00 |
0,00 |
|
|
B.IV. NEGATIVE EXTRAORDINARY
RESULTS (A.10+A.11+A.12+A.13+A.14-B.9-B.10-B.11-B.12-B.13): |
0,00 |
13.067,00 |
23.983,00 |
0,00 |
0,00 |
|
|
B.V. LOSSES BEFORE
TAXES (B.III+B.IV-A.III-A.IV): |
0,00 |
0,00 |
0,00 |
0,00 |
0,00 |
|
|
B.VI. RESULT OF THE
PERIOD (LOSSES) (B.V+A.15+A.16): |
0,00 |
0,00 |
0,00 |
0,00 |
0,00 |
|
MERCANTILE
REGISTRY.
CASHFLOW
STATEMENT
Model: Normal
> Source of information: Data contained in this section is taken from the information declared in the Annual Accounts submitted to the Trade Register.
|
|
2013 |
2012 |
2011 |
2010 |
2009 |
|
|
1. Fiscal year result before taxes.:
61100 |
5.837.239,00 |
4.396.786,00 |
4.246.056,00 |
4.138.800,00 |
3.135.967,00 |
|
|
2. Results adjustments.: 61200 |
-28.149,00 |
933.089,00 |
1.451.221,00 |
1.234.054,00 |
472.522,00 |
|
|
a) Fixed Assets
Amortization (+).: 61201 |
1.155.638,00 |
1.206.272,00 |
1.119.693,00 |
1.127.674,00 |
1.002.863,00 |
|
|
b) Obsolescence
Allowances (+/-). : 61202 |
-62.787,00 |
614.191,00 |
545.616,00 |
368.691,00 |
-227.784,00 |
|
|
c) Variation in
Provision (+/-). : 61203 |
55.652,00 |
41.223,00 |
125.342,00 |
-226.474,00 |
40.537,00 |
|
|
d) Allocation of
grants (-).: 61204 |
-87.156,00 |
-113.574,00 |
-170.866,00 |
-120.294,00 |
-171.735,00 |
|
|
e) Results on
disposal of fixed assets (+/-). : 61205 |
0,00 |
126.641,00 |
22.951,00 |
-337.188,00 |
-224.888,00 |
|
|
f) Results on
disposal of financial instruments (+/-).: 61206 |
0,00 |
0,00 |
0,00 |
485.958,00 |
0,00 |
|
|
g) Financial income
(-).: 61207 |
-1.524.576,00 |
-1.339.520,00 |
-579.712,00 |
-392.339,00 |
-390.443,00 |
|
|
h) Financial Expenses
(+). : 61208 |
435.080,00 |
397.856,00 |
388.197,00 |
328.026,00 |
443.971,00 |
|
|
3. Changes in current capital equity.:
61300 |
948.442,00 |
-7.466.988,00 |
-1.424.913,00 |
-2.810.935,00 |
-1.167.229,00 |
|
|
a) Stock (+/-).:
61301 |
347.314,00 |
1.668.178,00 |
-2.448.969,00 |
-2.910.148,00 |
2.175.529,00 |
|
|
d) Debtors and other
accounts receivable (+/-). : 61302 |
207.864,00 |
-4.105.707,00 |
-918.858,00 |
-5.688.402,00 |
2.260.918,00 |
|
|
c) Other current
assets (+/-). : 61303 |
-1.380.640,00 |
-4.583.489,00 |
3.343.248,00 |
-379.442,00 |
-1.990.996,00 |
|
|
d) Creditors and
other accounts payable (+/-). : 61304 |
-3.263.010,00 |
-140.679,00 |
651.944,00 |
1.677.799,00 |
-1.483.291,00 |
|
|
e) Other current
liabilities (+/-).: 61305 |
5.036.914,00 |
-305.291,00 |
-2.052.277,00 |
4.489.258,00 |
-2.129.390,00 |
|
|
4. Other cash flows for operating
activities.: 61400 |
1.089.496,00 |
941.664,00 |
191.514,00 |
64.313,00 |
-53.528,00 |
|
|
a) Interest payments
(-). : 61401 |
-435.080,00 |
-397.856,00 |
-388.197,00 |
-328.026,00 |
-443.971,00 |
|
|
c) Interest
collection (+). : 61403 |
1.524.576,00 |
1.339.520,00 |
579.711,00 |
392.339,00 |
390.443,00 |
|
|
5. Operating activity cash flows (1 + 2 +
3 + 4) : 61500 |
7.847.028,00 |
-1.195.449,00 |
4.463.879,00 |
2.626.232,00 |
2.387.731,00 |
|
|
6. Payments for investment (-).:
62100 |
-1.139.837,00 |
-847.789,00 |
-1.279.259,00 |
-670.875,00 |
-976.030,00 |
|
|
b) Intangible fixed
assets. : 62102 |
-920.221,00 |
-663.888,00 |
-544.774,00 |
-500.896,00 |
-565.085,00 |
|
|
c) Fixed assets. :
62103 |
-205.727,00 |
-181.892,00 |
-720.515,00 |
-146.978,00 |
-410.945,00 |
|
|
e) Other financial
assets. : 62105 |
-13.889,00 |
-2.009,00 |
-13.970,00 |
-23.000,00 |
0,00 |
|
|
7. Divestment payment collection (+). :
62200 |
342.200,00 |
13.031,00 |
6.695,00 |
504.914,00 |
294.539,00 |
|
|
a) Companies of the
group and affiliates. : 62201 |
296.344,00 |
4.575,00 |
0,00 |
0,00 |
27.539,00 |
|
|
b) Intangible fixed
assets. : 62202 |
45.856,00 |
0,00 |
0,00 |
0,00 |
0,00 |
|
|
c) Fixed assets. :
62203 |
0,00 |
8.456,00 |
6.695,00 |
504.914,00 |
267.000,00 |
|
|
8. Investment activity cash flows (6 + 7)
minus Amortization: 62300 |
-797.637,00 |
-834.757,00 |
-1.272.564,00 |
-165.961,00 |
-681.491,00 |
|
|
9. Payment collection and payments for
equity instruments. : 63100 |
249.625,00 |
232.542,00 |
91.975,00 |
22.908,00 |
124.205,00 |
|
|
e) Grants, donations and
bequests received (+). : 63105 |
249.625,00 |
232.542,00 |
91.975,00 |
22.908,00 |
124.205,00 |
|
|
10. Payment collection and payments for
financial liabilities instruments.: 63200 |
-1.559.966,00 |
2.943.078,00 |
-718.953,00 |
-1.070.186,00 |
-1.360.337,00 |
|
|
a) Issuance :
63201 |
0,00 |
2.943.078,00 |
0,00 |
0,00 |
0,00 |
|
|
2. Debts incurred
with credit institutions (+). : 63203 |
-268.758,00 |
2.674.320,00 |
0,00 |
0,00 |
0,00 |
|
|
5. Other debts (+). :
63206 |
268.758,00 |
268.758,00 |
0,00 |
0,00 |
0,00 |
|
|
b) Repayment and
amortization of : 63207 |
-1.559.966,00 |
0,00 |
-718.953,00 |
-1.070.186,00 |
-1.360.337,00 |
|
|
5. Other debts (-). :
63212 |
-1.559.966,00 |
0,00 |
-718.953,00 |
-1.070.186,00 |
-1.360.337,00 |
|
|
11. Payments from dividends and
remunerations from other assets instruments. : 63300 |
-2.750.000,00 |
-1.350.000,00 |
-1.900.000,00 |
-1.280.000,00 |
-1.000.000,00 |
|
|
a) Dividends (-).:
63301 |
-2.750.000,00 |
-1.350.000,00 |
-1.900.000,00 |
-1.280.000,00 |
-1.000.000,00 |
|
|
12. Cash flows for financing activities
(9+10+11).: 63400 |
-4.060.341,00 |
1.825.619,00 |
-2.526.978,00 |
-2.327.278,00 |
-2.236.133,00 |
|
|
D) EFFECT OF EXCHANGE RATE CHANGES:
64000 |
0,00 |
0,00 |
0,00 |
0,00 |
0,00 |
|
|
E) NET INCREASE/DECREASE OF CASH OR
EQUIVALENT ASSETS (+/-5+/-8+/12+/-D) : 65000 |
2.989.050,00 |
-204.587,00 |
664.336,00 |
132.993,00 |
-529.892,00 |
|
|
Cash or equivalent
assets as of beginning of the fiscal year.: 65100 |
1.402.895,00 |
1.607.482,00 |
943.146,00 |
810.153,00 |
1.340.045,00 |
|
|
Cash or equivalent
assets as of end of the fiscal year.: 65200 |
4.391.946,00 |
1.402.895,00 |
1.607.482,00 |
943.146,00 |
810.153,00 |
|
FINANCIAL
DIAGNOSIS
>
Economic-Financial Comparative Analysis
Data used in
the following ratios and indicators is taken from the Annual Accounts submitted
by the company to the TRADE REGISTER.
> Comparison
within the Sector
|
Cash Flow |
2013 |
2012 |
Variación 2013 -
2012 |
|
|||
|
|
Empresa |
Sector |
Empresa |
Sector |
Empresa |
Sector |
|
|
Cash Flow over Sales: |
0,02 % |
0,01 % |
0,00 % |
0,01 % |
|
47,33 % |
|
|
EBITDA over Sales: |
4,74 % |
11,49 % |
3,71 % |
9,02 % |
27,72 % |
27,32 % |
|
|
Cash Flow Yield: |
0,04 % |
0,00 % |
0,00 % |
0,00 % |
|
|
|
|
Profitability |
2013 |
2012 |
Variación 2013 -
2012 |
|
|||
|
|
Empresa |
Sector |
Empresa |
Sector |
Empresa |
Sector |
|
|
Operating economic profitability: |
8,22 % |
6,99 % |
6,17 % |
4,97 % |
33,27 % |
40,74 % |
|
|
Total economic profitability: |
8,50 % |
3,85 % |
6,85 % |
2,39 % |
24,15 % |
61,24 % |
|
|
Financial profitability: |
16,08 % |
4,47 % |
13,76 % |
1,03 % |
16,87 % |
332,24 % |
|
|
Margin: |
3,93 % |
6,82 % |
2,80 % |
4,64 % |
40,36 % |
47,18 % |
|
|
Mark-up: |
4,35 % |
4,65 % |
3,24 % |
1,38 % |
34,09 % |
238,03 % |
|
|
Solvency |
2013 |
2012 |
Variación 2013 -
2012 |
|
|||
|
|
Empresa |
Sector |
Empresa |
Sector |
Empresa |
Sector |
|
|
Liquidity: |
0,11 |
0,13 |
0,04 |
0,12 |
189,34 |
13,91 |
|
|
Acid Test: |
1,32 |
0,86 |
1,32 |
0,85 |
0,12 |
1,21 |
|
|
Working Capital / Investment: |
0,32 |
0,05 |
0,32 |
0,03 |
-0,77 |
89,61 |
|
|
Solvency: |
1,61 |
1,18 |
1,63 |
1,17 |
-1,14 |
0,16 |
|
|
Indebtedness |
2013 |
2012 |
Variación 2013 -
2012 |
|
|||
|
|
Empresa |
Sector |
Empresa |
Sector |
Empresa |
Sector |
|
|
Indebtedness level: |
1,38 |
1,38 |
1,44 |
1,63 |
-4,14 |
-15,15 |
|
|
Borrowing Composition: |
0,10 |
1,00 |
0,15 |
1,03 |
-33,90 |
-2,06 |
|
|
Repayment Ability: |
14,29 |
132,89 |
-201,75 |
205,36 |
107,08 |
-35,29 |
|
|
Warranty: |
1,73 |
1,73 |
1,70 |
1,62 |
1,80 |
6,90 |
|
|
Generated resources / Total creditors:
|
0,14 |
0,08 |
0,13 |
0,07 |
6,91 |
27,91 |
|
|
Efficiency |
2013 |
2012 |
Variación 2013 -
2012 |
|
|||
|
|
Empresa |
Sector |
Empresa |
Sector |
Empresa |
Sector |
|
|
Productivity: |
2,46 |
1,88 |
2,14 |
1,70 |
15,07 |
10,10 |
|
|
Turnover of Collection Rights : |
3,21 |
5,05 |
3,21 |
4,78 |
-0,03 |
5,53 |
|
|
Turnover of Payment Entitlements: |
5,97 |
3,66 |
5,59 |
3,51 |
6,76 |
4,31 |
|
|
Stock rotation: |
11,79 |
7,33 |
11,94 |
6,48 |
-1,27 |
13,04 |
|
|
Assets turnover: |
2,09 |
1,03 |
2,21 |
1,07 |
-5,05 |
-4,38 |
|
|
Borrowing Cost: |
1,02 |
2,85 |
0,96 |
2,95 |
5,65 |
-3,33 |
|
> Trend of indicators under the General
Accounting Plan of 2007 (2013, 2012, 2011, 2010, 2009)
|
Cash Flow |
2013 |
2012 |
2011 |
2010 |
2009 |
|
|
Cash Flow over Sales: |
0,02 % |
0,00 % |
0,01 % |
0,00 % |
-0,52 % |
|
|
EBITDA over Sales: |
4,74 % |
3,71 % |
4,02 % |
4,15 % |
3,83 % |
|
|
Cash Flow Yield: |
0,04 % |
0,00 % |
0,01 % |
0,00 % |
-0,94 % |
|
|
Profitability |
2013 |
2012 |
2011 |
2010 |
2009 |
|
|
Operating economic profitability: |
8,22 % |
6,17 % |
6,61 % |
7,65 % |
6,82 % |
|
|
Total economic profitability: |
8,50 % |
6,85 % |
7,21 % |
6,66 % |
6,34 % |
|
|
Financial profitability: |
16,08 % |
13,76 % |
13,76 % |
15,04 % |
10,59 % |
|
|
Margin: |
3,93 % |
2,80 % |
3,12 % |
3,58 % |
3,22 % |
|
|
Mark-up: |
4,35 % |
3,24 % |
3,35 % |
3,16 % |
3,03 % |
|
|
Solvency |
2013 |
2012 |
2011 |
2010 |
2009 |
|
|
Liquidity: |
0,11 |
0,04 |
0,04 |
0,03 |
0,03 |
|
|
Acid Test: |
1,32 |
1,32 |
1,10 |
1,14 |
1,20 |
|
|
Working Capital / Investment: |
0,32 |
0,32 |
0,25 |
0,24 |
0,24 |
|
|
Solvency: |
1,61 |
1,63 |
1,45 |
1,42 |
1,46 |
|
|
Indebtedness |
2013 |
2012 |
2011 |
2010 |
2009 |
|
|
Indebtedness level: |
1,38 |
1,44 |
1,47 |
1,63 |
1,53 |
|
|
Borrowing Composition: |
0,10 |
0,15 |
0,06 |
0,08 |
0,14 |
|
|
Repayment Ability: |
14,29 |
-201,75 |
57,53 |
298,00 |
9,43 |
|
|
Warranty: |
1,73 |
1,70 |
1,68 |
1,62 |
1,66 |
|
|
Generated resources / Total creditors:
|
0,14 |
0,13 |
0,12 |
0,13 |
0,09 |
|
|
Efficiency |
2013 |
2012 |
2011 |
2010 |
2009 |
|
|
Productivity: |
2,46 |
2,14 |
2,35 |
2,38 |
2,17 |
|
|
Turnover of Collection Rights : |
3,21 |
3,21 |
3,29 |
3,17 |
3,16 |
|
|
Turnover of Payment Entitlements: |
5,97 |
5,59 |
5,35 |
5,29 |
5,06 |
|
|
Stock rotation: |
11,79 |
11,94 |
9,86 |
11,39 |
13,35 |
|
|
Assets turnover: |
2,09 |
2,21 |
2,12 |
2,14 |
2,12 |
|
|
Borrowing Cost: |
1,02 |
0,96 |
1,02 |
0,33 |
1,30 |
|
COMPARATIVE SECTORIAL BALANCE
Sector-based Comparison under the rules of
the New General Accounting Plan.
|
|
Variación - |
|
|
|
Empresa |
Sector |
|
|
Variación - |
|
|
|
Empresa |
Sector |
|
|
Variación - |
|
|
|
Empresa |
Sector |
News
--
Public
Tenders and Works Won
No Public Tenders
assigned to the name of the company.
Detail
of Subsidies appearing in Balances Memories
|
Entity |
IBERDROLA
INGENIERIA Y CONSTRUCCION SOCIEDAD ANONIMA |
|
Subsidy Concept |
Subvención de
capital |
|
Status |
CONCEDIDA |
|
Amount Granted |
275.740,00 |
|
Notes |
El importe
reflejado corresponde al saldo al cierre. |
|
Entity |
ORGANISMO NO
ESPECIFICADO |
|
Status |
CONCEDIDA |
|
Amount Granted |
186.899,60 |
|
Notes |
El importe reflejado
corresponde al saldo al cierre. |
|
Entity |
DIRECCION
GENERAL DEL TESORO |
|
Subsidy Concept |
Subvención de
capital |
|
Status |
CONCEDIDA |
|
Amount Granted |
61.117,38 |
|
Notes |
El importe
reflejado corresponde al saldo al cierre. |
|
Entity |
MINISTERIO DE
CIENCIA Y TECNOLOGIA |
|
Subsidy Concept |
Subvención de
capital |
|
Status |
CONCEDIDA |
|
Amount Granted |
56.943,89 |
|
Notes |
El importe
reflejado corresponde al saldo al cierre. |
|
Entity |
ORGANISMO NO ESPECIFICADO |
|
Status |
CONCEDIDA |
|
Amount Granted |
157.138,08 |
|
Notes |
El importe
reflejado corresponde al saldo al cierre. |
|
Entity |
IBERDROLA
INGENIERIA Y CONSTRUCCION SOCIEDAD ANONIMA |
|
Subsidy Concept |
Subvención de
capital |
|
Status |
CONCEDIDA |
|
Amount Granted |
126.166,00 |
|
Notes |
El importe
reflejado corresponde al saldo al cierre. |
|
Entity |
DIRECCION
GENERAL DEL TESORO |
|
Subsidy Concept |
Subvención de
capital |
|
Status |
CONCEDIDA |
|
Amount Granted |
69.848,44 |
|
Notes |
El importe
reflejado corresponde al saldo al cierre. |
|
Entity |
MINISTERIO DE
CIENCIA Y TECNOLOGIA |
|
Subsidy Concept |
Subvención de
capital |
|
Status |
CONCEDIDA |
|
Amount Granted |
65.078,73 |
|
Notes |
El importe reflejado
corresponde al saldo al cierre. |
|
Entity |
IRGANISMO NO
ESPECIFICADO |
|
Subsidy Concept |
Subvención de
explotación |
|
Status |
CONCEDIDA |
|
Amount Granted |
128,69 |
|
Entity |
DIRECCION
GENERAL DEL TESORO |
|
Subsidy Concept |
Subvención de
capital |
|
Status |
CONCEDIDA |
|
Amount Granted |
78.579,50 |
|
Notes |
El importe
reflejado corresponde al saldo al cierre. |
|
Entity |
MINISTERIO DE
CIENCIA Y TECNOLOGIA |
|
Subsidy Concept |
Subvención de
capital |
|
Status |
CONCEDIDA |
|
Amount Granted |
73.213,57 |
|
Notes |
El importe
reflejado corresponde al saldo al cierre. |
|
Entity |
MINISTERIO DE
CIENCIA Y TECNOLOGIA |
|
Subsidy Concept |
Subvención de
capital |
|
Status |
CONCEDIDA |
|
Amount Granted |
122.515,58 |
|
Notes |
Saldo al
31/12/2010. |
|
Entity |
ORGANISMO NO
ESPECIFICADO |
|
Status |
CONCEDIDA |
|
Amount Granted |
834.118,26 |
|
Entity |
DIRECCION
GENERAL DEL TESORO |
|
Subsidy Concept |
Subvención de
capital |
|
Status |
CONCEDIDA |
|
Amount Granted |
30.000,00 |
|
Entity |
ADM |
|
Subsidy Concept |
Subvención de
capital. |
|
Status |
CONCEDIDA |
|
Amount Granted |
834.118,26 |
|
Notes |
Subvención para la
adecuación de las instalaciones de los clientes de la sociedad, para que
estos puedan consumir los productos que suministra dicho proveedor y que
previamente ha financiado la sociedad. El importe traspasado a resultados es
207.058,74 euros, quedando pendiente al cierre 388.746,32 euros |
|
Entity |
MINISTERIO DE
CIENCIA Y TECNOLOGIA |
|
Status |
CONCEDIDA |
|
Amount Granted |
326.000,00 |
|
Notes |
Subvención
reembolsable para el Programa Nacional de Biomedicina (acción profarma) concedida
el 14/10/2003 El importe pendiente de imputar es de 254.847,28 euros |
|
Entity |
FEDER - CDTI |
|
Status |
CONCEDIDA |
|
Amount Granted |
219.000,00 |
|
Notes |
Subvención reembolsable
concedida en 2004 por la colaboración en el desarrollo del proyecto de
desarrollo tecnológico denominado "premezclas medicamentosas y polvos
orales de uso veterinario" . El importe pendiente de imputar es de
326.800 euros |
|
Entity |
MINISTERIO DE
CIENCIA Y TECNOLOGIA |
|
Status |
CONCEDIDA |
|
Amount Granted |
136.524,22 |
|
Notes |
Subvención
reembolsable para el Programa Nacional de Biomedicina (acción profarma) concedida
el 09/01/2003. El importe pendiente de imputar es de 97.247,10 euros |
|
Entity |
FEDER - CDTI |
|
Status |
CONCEDIDA |
|
Amount Granted |
126.200,00 |
|
Notes |
Subvención reembolsable
por la colaboración en el desarrollo del proyecto de desarrollo tecnológico
denominado "Proyecto de promoción tecnológica; promoción tecnológica
internacional de premezclas medicamentosas para sanidad animal" El
importe pendiente de imputar es de 113.038,20 euros |
|
Entity |
MINISTERIO DE
CIENCIA Y TECNOLOGIA |
|
Status |
CONCEDIDA |
|
Amount Granted |
120.202,42 |
|
Notes |
Subvención
reembolsable para el Programa Nacional de Biomedicina (acción profarma) concedida
el 19/01/2002. El importe pendiente de imputar es de 68.687,70 euros |
|
Entity |
CENTRO PARA EL
DESARROLLO TECNOLOGICO INDUSTRIAL |
|
Status |
CONCEDIDA |
|
Amount Granted |
101.280,00 |
|
Notes |
Subvención reembolsable
para Colaboración en el Proyecto de Promoción Tecnológica denominado
PROMOCIÓN TECNOLÓGICA DE PREMEZCLAS MEDICAMENTOSAS PARA INCORPORACIÓN A
PIENSOS concedida el 01/07/2003. El importe pendiente de imputar es de
69.938,18 euros |
|
Entity |
MINISTERIO DE
CIENCIA Y TECNOLOGIA |
|
Status |
CONCEDIDA |
|
Amount Granted |
60.000,00 |
|
Notes |
Subvención
COATING fue concedida en 2002. El saldo pendiente de imputar es 136.128,42
euros |
|
Entity |
MINISTERIO DE
TURISMO Y COMERCIO |
|
Status |
CONCEDIDA |
|
Amount Granted |
30.000,00 |
|
Notes |
Subvención de la
Dirección General del tesoro fue concedida el 18/12/2007 para el desarrollo
de nueva metodología de recubrimiento de la Bacitrian. El saldo pendiente de imputar
es 30.000 euros |
|
Entity |
CENTRO PARA EL
DESARROLLO TECNOLOGICO INDUSTRIAL |
|
Status |
CONCEDIDA |
|
Amount Granted |
25.065,00 |
|
Notes |
Subvención fue
concedida el 24/12/2007 como ayuda prefinanciación. El saldo reflejado es el pendiente
de imputar |
|
Entity |
CENTRO PARA EL
DESARROLLO TECNOLOGICO INDUSTRIAL |
|
Status |
CONCEDIDA |
|
Amount Granted |
219.000,00 |
|
Entity |
ADM |
|
Subsidy Concept |
Subvención de
capital. |
|
Status |
CONCEDIDA |
|
Amount Granted |
211.699,23 |
|
Notes |
El importe
reflejado es el imputado a resultados. |
|
Entity |
MINISTERIO DE
CIENCIA Y TECNOLOGIA |
|
Status |
CONCEDIDA |
|
Amount Granted |
101.280,00 |
|
Entity |
MINISTERIO DE
CIENCIA Y TECNOLOGIA |
|
Status |
CONCEDIDA |
|
Amount Granted |
45.741,30 |
|
Notes |
El importe
reflejado corresponde al saldo al cierre. |
|
Entity |
MINISTERIO DE
CIENCIA Y TECNOLOGIA |
|
Subsidy Concept |
SUBVENCION DE
CAPITAL |
|
Status |
CONCEDIDA |
|
Project |
ADECUACION DE
LAS INSTALACIONES DE LOS CLIENTES DE LA SOCIEDAD |
|
Amount Granted |
60.000,00 |
Research
Summary
It is a founded in 1979, dedicated to the manufacture and sale of additives and chemicals for the manufacture of feed materials. It operates nationally and internationally. In the sources consulted appears nothing against him. In light of the above we believe that is possible to continue operations relating to risk, commensurate with their importance.
Sources
Registry of Commerce's Official Gazette. Own and external data bases Company References
FOREIGN EXCHANGE RATES
|
Currency |
Unit
|
Indian Rupees |
|
US Dollar |
1 |
Rs.63.94 |
|
UK Pound |
1 |
Rs.98.27 |
|
Euro |
1 |
Rs.72.37 |
INFORMATION DETAILS
|
Analysis Done by
: |
RAS |
|
|
|
|
Report Prepared
by : |
VNT |
RATING EXPLANATIONS
|
RATING |
STATUS |
PROPOSED CREDIT LINE |
|
|
|
>86 |
Aaa |
Possesses an extremely sound financial base with the strongest
capability for timely payment of interest and principal sums |
Unlimited |
|
|
71-85 |
Aa |
Possesses adequate working capital. No caution needed for credit
transaction. It has above average (strong) capability for payment of interest
and principal sums |
Large |
|
|
56-70 |
A |
Financial & operational base are regarded healthy. General
unfavourable factors will not cause fatal effect. Satisfactory capability for
payment of interest and principal sums |
Fairly Large |
|
|
41-55 |
Ba |
Overall operation is considered normal. Capable to meet normal
commitments. |
Satisfactory |
|
|
26-40 |
B |
Capability to overcome financial difficulties seems comparatively
below average. |
Small |
|
|
11-25 |
Ca |
Adverse factors are apparent. Repayment of interest and principal sums
in default or expected to be in default upon maturity |
Limited with
full security |
|
|
<10 |
C |
Absolute credit risk exists. Caution needed to be exercised |
Credit not
recommended |
|
|
-- |
NB |
New Business |
-- |
|
This score serves as a reference to assess
SC’s credit risk and to set the amount of credit to be extended. It is
calculated from a composite of weighted scores obtained from each of the major sections
of this report. The assessed factors and their relative weights (as indicated
through %) are as follows:
Financial
condition (40%) Ownership
background (20%) Payment
record (10%)
Credit history
(10%) Market trend (10%) Operational size
(10%)
This report is issued at your request without any
risk and responsibility on the part of MIRA INFORM PRIVATE LIMITED (MIPL)
or its officials.