MIRA INFORM REPORT
|
Report No. : |
327151 |
|
Report Date : |
20.06.2015 |
IDENTIFICATION DETAILS
|
Name : |
K Y P ACCESORIES SL |
|
|
|
|
Registered Office : |
Calle Madrid 22 Naves 11-12 - Torres De La Alameda - 28813 - Madrid |
|
|
|
|
Country : |
Spain |
|
|
|
|
Financials (as on) : |
2013 |
|
|
|
|
Date of Incorporation : |
09.11.1992 |
|
|
|
|
Legal Form : |
Private Company |
|
|
|
|
Line of Business : |
|
|
|
|
|
No. of Employee : |
39 |
RATING & COMMENTS
|
MIRA’s Rating : |
Ba |
|
RATING |
STATUS |
PROPOSED CREDIT LINE |
|
|
41-55 |
Ba |
Overall operation is considered normal. Capable to meet normal
commitments. |
Satisfactory |
|
Status : |
Satisfactory |
|
|
|
|
Payment Behaviour : |
No complaints |
|
|
|
|
Litigation : |
Clear |
NOTES :
Any query related to this report can be made on
e-mail : infodept@mirainform.com
while quoting report number, name and date.
ECGC Country Risk Classification List – March 31, 2015
|
Country Name |
Previous Rating (31.12.2014) |
Current Rating (31.03.2015) |
|
Spain |
A1 |
A1 |
|
Risk Category |
ECGC
Classification |
|
Insignificant |
A1 |
|
Low |
A2 |
|
Moderate |
B1 |
|
High |
B2 |
|
Very High |
C1 |
|
Restricted |
C2 |
|
Off-credit |
D |
SPAIN - ECONOMIC OVERVIEW
Spain experienced a prolonged recession in the wake of the global financial crisis. GDP contracted by 3.7% in 2009, ending a 16-year growth trend, and continued contracting through most of 2013. Economic growth resumed briefly in late 2013, albeit only modestly, as credit contraction in the private sector, fiscal austerity, and high unemployment continued to weigh on domestic consumption and investment. Exports, however, have been resilient throughout the economic downturn and helped to bring Spain's current account into surplus in 2013 for the first time since 1986. The unemployment rate rose from a low of about 8% in 2007 to more than 26% in 2013, straining Spain's public finances as spending on social benefits increased while tax revenues fell. Spain’s budget deficit peaked at 11.4% of GDP in 2010. Spain gradually reduced the deficit to just under 7% of GDP in 2013-14, slightly above the 6.5% target negotiated between Spain and the EU. Public debt has increased substantially – from 60.1% of GDP in 2010 to more than 97% in 2014. Rising labor productivity, moderating labor costs, and lower inflation have helped to improve foreign investor interest in the economy and to reduce government borrowing costs. The government's ongoing efforts to implement reforms - labor, pension, health, tax, and education - are aimed at supporting investor sentiment. The government also has shored up struggling banks exposed to Spain's depressed domestic construction and real estate sectors by successfully completing an EU-funded restructuring and recapitalization program in January 2014. Recently increased private consumption helped bring real GDP growth back into positive territory at 1.3% in 2014, and labor reforms prompted a modest reduction in the unemployment rate, from more than 26% in 2013 to 24% in 2014. Despite the uptic in economic activity, inflation dropped sharply, from 1.5% in 2013 to flat in 2014. Spain’s 2015 budget, published in September 2014, rolls back some recently imposed taxes in advance of national elections in November 2015 and leaves untouched the country’s value-added tax (VAT) regime, which generates significantly lower revenue than the EU average. Spain’s borrowing costs are dramatically lower since their peak in mid-2012.
|
Source
: CIA |
|
EXECUTIVE
SUMMARY
|
|
|
|
|
|
Name: |
K Y P ACCESORIES SL |
|
NIF / Fiscal
code: |
B60175650 |
|
Status: |
ACTIVE |
|
Incorporation
Date: |
09/11/1992 |
|
Register Data |
Register Section
8 Sheet 116434 |
|
Last Publication in BORME: |
20/06/2012 [Increase
of Capital] |
|
Last Published
Account Deposit: |
2013 |
|
Share Capital: |
60.101,20 |
|
|
|
|
Localization: |
CALLE MADRID 22
NAVES 11-12 - TORRES DE LA ALAMEDA - 28813 - MADRID |
|
Telephone - Fax
- Email - Website: |
Telephone. 918 863
090 Email. info@kypaccesorios.com Website. www.kypaccesorios.com |
|
|
|
|
Activity: |
|
|
NACE: |
2829 -
Manufacture of other general-purpose machinery |
|
Registered
Trademarks: |
|
|
Audited /
Opinion: |
No |
|
Tenders and
Awards: |
|
|
Subsidies: |
0 for a total
cost of 0 |
|
Quality
Certificate: |
No |
|
|
|
|
Scoring and Risk: |
|
|
Default Risk: |
1.526% |
|
Payment
Behaviour: |
According to the
agreed terms |
|
Prospects: |
Consolidation |
|
Industry
situation: |
Maturity |
|
|
|
|
Defaults, Legal Claims and Insolvency Proceedings
: |
|
|
|
|
|
|
Number |
Amount (€) |
Most Recent
Entry |
|
Insolvency
Proceedings, Bankruptcy and Suspension of Payments |
Unpublished |
--- |
--- |
|
Defaults on debt
with Financial Institutions and Large Companies |
None |
--- |
--- |
|
Judicial Claims
(Notices, Executive Proceedings, Attachments, Auctions, Bad Debt) |
1 |
0 |
--- |
|
Proceedings
heard by the Civil Court |
Unpublished |
0 |
--- |
|
Proceedings
heard by the Labour Court |
Unpublished |
0 |
--- |
|
|
|
Partners: |
|
|
|
RAUL PAZ
FERNANDEZ |
|
|
|
ÑUIS MANUEL
SOARES |
|
|
|
Shares: |
0 |
|
|
Other Links: |
0 |
|
|
No. of Active
Corporate Bodies: |
|
|
|
Ratios |
2013 |
2012 |
Change |
|
|
|
|
|
Guarantees: |
|
|
Properties
Registered: |
Company NO,
Administrator NO |
|
Financing /
Guarantee Sources : |
Sources NO,
Guarantees NO |
|
|
|
|
|
|
|
INVESTIGATION SUMMARY |
|
|
It is a firm contitued
in 1.992, engaged in the manufacturing and sale of machinery for the glass
industry. Its activity is engaged nationally and internationally. Sources
consulted do not appear anything against it. In light of the above we believe
that he can continue operations relating to risk commensurate with its size. |
|
|
Interviewed
Person: |
|
|
Identification
|
|
|
Social Denomination: |
K Y P ACCESORIES
SL |
|
NIF / Fiscal code: |
B60175650 |
|
Corporate Status: |
ACTIVE |
|
Start of activity: |
1993 |
|
Registered Office: |
CALLE MADRID 22
NAVES 11-12 |
|
Locality: |
TORRES DE LA
ALAMEDA |
|
Province: |
MADRID |
|
Postal Code: |
28813 |
|
Telephone: |
918 863 090 |
|
Fax: |
918 868 371 |
|
Website: |
www.kypaccesorios.com |
|
Email: |
info@kypaccesorios.com |
|
Interviewed Person: |
Srta.: Esperanza
García |
|
Activity
|
|
|
NACE: |
2829 |
|
Legal Form: |
Import, export,
sale, distribution of materials and computer security systems. DESIGN, DEVELOPMENT
AND MARKETING OF EXPERTS OR INTEGRATED SYSTEMS UNDERSTANDING MICROCOMPUTING,
robotics, etc. MANUFACTURING AND MARKETING OF SPARE PARTS FOR precision
machinery, maintenance and repair as well as their import and export. |
|
Additional Information: |
Manufacturing of
machinery for the glass sector. |
|
Additional Address: |
The registered
office, offices and premises in the head address. |
|
Franchise: |
No |
|
Import / export: |
IMPORTS /
EXPORTS |
|
Future Perspective: |
Consolidation |
|
Industry situation: |
Maturity |
|
Number
of Employees
|
|
|
|
|
|
|
Year |
No. of employees |
Established |
Incidentals |
|
|
|
2015 |
39 |
|
|
|
The data of
employees is from the latest available financial statements in . Failing that,
are estimates data
calculated by statistical methods
|
Chronological
Summary
|
|||
|
|
|
|
|
|
|
Year |
Act |
|
|
|
1993 |
Accounts deposit
(year 1992) Appointments/ Re-elections (1) Change of Social address (1)
Company Formation (1) |
|
|
|
1995 |
Accounts deposit
(year 1994) Change of Social Purpose (1) Change of Social address (1) |
|
|
|
1996 |
Accounts deposit
(year 1995) Adaptation to Law (1) Appointments/ Re-elections (1) |
|
|
|
1997 |
Appointments/ Re-elections
(1) |
|
|
|
1998 |
Accounts deposit
(year 1996, 1997) Appointments/ Re-elections (1) Cessations/ Resignations/
Reversals (1) Statutory Modifications (1) |
|
|
|
1999 |
Accounts deposit
(year 1998) |
|
|
|
2000 |
Change of Social
address (1) Increase of Capital (1) |
|
|
|
2002 |
Accounts deposit
(year 1999, 2000, 2001) Change of Social address (1) |
|
|
|
2003 |
Accounts deposit
(year 2002) |
|
|
|
2004 |
Accounts deposit
(year 2003) |
|
|
|
2005 |
Accounts deposit
(year 2004) Cessations/ Resignations/ Reversals (1) |
|
|
|
2006 |
Accounts deposit
(year 2005) |
|
|
|
2011 |
Appointments/
Re-elections (1) |
|
|
|
2012 |
Accounts deposit
(year 2008, 2009, 2010, 2011) Cessations/ Resignations/ Reversals (1)
Increase of Capital (1) |
|
|
|
2013 |
Accounts deposit
(year 2012) |
|
|
|
2014 |
Accounts deposit
(year 2013) |
|
|
Breakdown
of Owners' Equity
|
|
|
Registered Capital: |
60.101,20 |
|
Paid up capital: |
60.101,20 |
|
|
|
|
|
|
|
|
Publishing Date |
Registration
Type |
Capital
Subscribed |
Paid up capital |
Underwritten
result |
Disbursed Result |
|
20/01/1993 |
Company
Formation |
6.010 |
6.010 |
6.010 |
6.010 |
|
10/01/2000 |
Increase of
Capital |
18.030 |
18.030 |
24.040 |
24.040 |
|
08/06/2012 |
Increase of
Capital |
36.061 |
36.061 |
60.101 |
60.101 |
|
Active
Social Bodies
|
|
|
|
|
|
Post published |
Social Body's
Name |
Appointment Date |
Other Positions
in this Company |
|
JOINT
ADMINISTRATOR |
PAZ FERNANDEZ
RAUL |
26/03/1998 |
3 |
|
|
SOARES LUIS
MANUEL |
26/03/1998 |
1 |
|
PROXY |
GALLARDO
GONZALEZ JOSE |
20/01/1997 |
2 |
|
|
GALIDIE DIDIER
PASCAL JEAN |
20/01/1997 |
2 |
|
ACCOUNTS'
AUDITOR / HOLDER |
RAMOS SERRANO
AGUSTIN |
06/05/2011 |
1 |
|
Historical
Social Bodies
|
|
|
|
|
|
Social Body's
Name |
Post published |
End Date |
Other Positions in
this Company |
|
GALIDIE DIDIER
PASCAL JEAN |
JOINT
ADMINISTRATOR |
14/11/2005 |
2 |
|
GALLARDO
GONZALEZ JOSE |
JOINT
ADMINISTRATOR |
08/06/2012 |
2 |
|
PAZ FERNANDEZ
RAUL |
SINGLE
ADMINISTRATOR |
26/03/1998 |
3 |
|
|
ADMINISTRATOR |
20/06/1996 |
|
|
Executive
board
|
||
|
|
|
|
|
Post |
NIF |
Name |
|
ADMINISTRATOR |
|
MANUEL SOARES
LUIS |
|
ADMINISTRATOR |
|
RAUL PAZ
FERNANDEZ |
|
FINANCIAL
DIRECTOR |
|
LAURA BURGOS |
|
MANAGING
DIRECTOR |
|
RAUL PAZ
FERNANDEZ |
Defaults,
Legal Claims and Insolvency Proceedings
|
|
|
|
|
Section enabling
assessment of the degree of compliance of the company queried with its payment
obligations.
It provides
information on the existence and nature of all stages of Insolvency and Legal
Proceedings
published with
reference to the Company in the country's various Official
Bulletins and
national newspapers, as well Defaults Registered in the main national credit
bureaus
(ASNEF Industrial
and RAI ).
> Summary
Chronological
summary
|
|
|
Number of
Publications |
Amount (_) |
Start date |
End date |
|
Insolvency
Proceedings, Bankruptcy and Suspension of Payments |
|
Unpublished |
--- |
--- |
--- |
|
Request/Declaration |
|
0 |
--- |
date |
|
|
Proceedings |
|
--- |
--- |
|
--- |
|
Resolution |
|
--- |
--- |
|
--- |
|
Defaults on debt
with Financial Institutions and Large Companies |
Bank and
Commercial Delinquency |
None |
0 |
|
|
|
Status: Friendly |
|
--- |
|
|
|
|
Status:
Pre-Litigation |
|
--- |
|
|
|
|
Status:
Litigation |
|
--- |
|
|
|
|
Status:
Non-performing |
|
--- |
|
|
|
|
Status:
insolvency proceedings, bankruptcy and suspension of payments |
|
--- |
|
|
|
|
Other status |
|
--- |
|
|
|
|
Legal and
Administrative Proceedings |
|
1 |
--- |
14/10/2014 |
14/10/2014 |
|
Notices of
defaults and enforcement |
|
1 |
--- |
|
--- |
|
Seizures |
|
--- |
--- |
|
--- |
|
Auctions |
|
--- |
--- |
|
--- |
|
Declarations of
insolvency and bad debt |
|
--- |
--- |
|
--- |
|
Proceedings
heard by the Civil Court |
|
Unpublished |
--- |
|
|
|
Proceedings
heard by the Labour Court |
|
Unpublished |
--- |
|
|
> Details
> Basis for
scoring
|
Positive Factors |
Adverse Factors |
|
No irregular
payment performance has been detected based on information obtained from
credit bureaus. Adequate level
of financial autonomy. The financial autonomy of the entity represents the
36.84 %. In principle, an increase in this ratio would indicate an
improvement in the corporate's balace sheets. High financial
profitability. Net return from the company's main activity performed using
its own equity is high. This income return has decreased in comparison with
the previous financial year. It presents a
limited operating margins. Net margin shows positive, although adjusted,
company costs management as income exceed operating expenses. Positive Working
CapitalThe Company's Working Capital quality is significant, i.e. much of the
Company financing comes from its equity. A structure is considered optimal if
its liquidity level is slightly above its debt volume as a result of low
idleness levels of its financial resources involved. |
Presents legal
proceedings. Debts resulting from non-payment to Public Administrations or
from lawsuits filed by individuals before the Courts of the different
jurisdictions have been published in the Official Gazettes. The current debt
represents a 55.42% of the financial structure. In principle, a decrease in
this ratio would indicate an improvement in the short-term financial
situation. No Company's
subsidiaries or branches are known. Possible
difficulty accessing financing. Uncertainties about economic recovery will
hinder access to credit for new projects or for obtaining the liquidity
necessary for short-term needs. |
|
TREND
OF SCORING
|
|
|
|
|
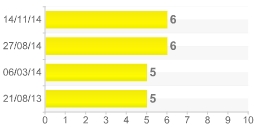
> Latest
Scoring Changes :
|
Scoring |
Evolution |
Date |
Event |
|
|
Neutral |
14/11/14 |
Review of legal
claims against the name of the individual in question. |
|
Positive |
27/08/14 |
Updating of
financial statements. |
|
|
Neutral |
06/03/14 |
Scoring revision
by one of 's expert analysts. |
|
|
Neutral |
21/08/13 |
Updating of
financial statements. |
Legal implications
checking for the company.
Probability
of default
|
|
|
|
|
> Estimated Probability
of Default for the next 12 months: 1.526 %
|
Sector in which
comparison is carried out: 282 Manufacture
of other general-purpose machinery |
|
|
Relative
Position:
|
The company's
comparative analysis with the rest of the companies that comprise the sector,
shows the c
ompany holds a
better position with regard to the probability of non-compliance.
The 79.00% of the
companies of the sector K Y P ACCESORIES SL belongs to show a higher
probability
of non-compliance.
The probability of
the company's non-compliance with its payment obligations within deadlines
estimated
by our
qualifications models is 1.526%.
In
the event they fail to comply with the payment, the seriousness of the loss
will depend on factors such as
the
promptness of the commencement of the charging management, the existence of
executive documents
which
match the credit or the existence of guarantees and free debt assets under the
name of the debtor.
Therefore,
the probability of non-compliance should not be solely interpreted as the total
loss of the owed amount.
Recommended
commercial credit
|
|
|
|
|
Favourable
until 152.000 € (Guideline
value of outstanding commercial balance that
recommends be awarded t
o
or maintained with the company queried)
|
Result of query
submitted to the R.A.I. (Spanish Bad Debt Register) on |
LEGAL
CLAIMS
|
|
|
|
|
|
Summary of
Judicial Claims |
|
|
|
|
|
|
|
|
||
|
|
|
No se han
publicado |
|
|
|
|
No se han
publicado |
|
|
|
|
||
|
|
|
No se han
publicado |
|
|
|
|
No se han
publicado |
|
|
|
|
No se han
publicado |
|
|
|
|
1 Incidence for
a total cost of 0,00 E |
|
|
|
|
||
|
|
|
No se han
publicado |
|
|
|
|
No se han
publicado |
|
|
|
|
||
|
|
|
No se han
publicado |
|
|
Incidences
Detailed |
|
Incidences with
the Local Administration |
|
|
|
Last Published
Stage: |
EXECUTION
NOTIFICATION |
|
Amount of the
incidence: |
0,00 E |
|
Requested by: |
ADMINISTRACION
LOCAL |
|
Published
domicile: |
(DESCONOCIDA) |
|
Source: |
B.O.P. GRANADA
Nº211, 2014 PAGINA 12 |
|
Guarantees
|
|
References |
|
|
|
|
|
|
Suppliers |
|
|
|
Name |
NIF |
Telephone |
|
|
|
PHESTO NEUMÁTICA |
|
|
|
|
|
LENCE
TRANSMISIONES |
|
|
|
|
Link
List
|
|
|
|
|
|
SHAREHOLDERS: |
2 Entities |
> Shareholders
|
Relationship |
Entity |
Province |
Shareholding
stake |
|
SHAREHOLDERS |
RAUL PAZ
FERNANDEZ |
|
|
|
|
ÑUIS MANUEL
SOARES |
|
|
|
Turnover
|
|
|
Total Sales 2013 |
4.600.747,62 |
The
sales data is from the latest available financial statements in . Failing that, are estimates data calculated
by statistical methods.
|
Estimated Balance |
|
ESTIMED FIGURES FOR
2.014 -NOT CURRENT
ASSETS.......................................................180.000 Euro/s
-CURRENT
ASSETS..........................................................2.204.000
Euro/s -NET EQUITY...............................................................879.000
Euro/s -NOT CURRENT
LIABILITIES.......................................................184.000
Euro/s -CURRENT
LIABILITIES..........................................................1.321.000
Euro/s -TOTAL ...............................................2.384.000 Euro/s
-SALES
(2.014)................................................................4.850.000
Euro/s |
|
Financial
Accounts and Balance Sheets
|
|
|
|
|
Financial Years Presented
|
Ejercicio |
Tipo de Cuentas
Anuales |
Fecha
Presentacion |
|
2013 |
Normales |
August
2014 |
|
2012 |
Normales |
August
2013 |
|
2011 |
Normales |
September
2012 |
|
2010 |
Normales |
April 2012 |
|
2009 |
Normales |
April 2012 |
|
2008 |
Normales |
April 2012 |
|
2007 |
Normales |
No publicado en
BORME |
|
2005 |
Normales |
November
2006 |
|
2004 |
Normales |
September
2005 |
|
2003 |
Normales |
October
2004 |
|
2002 |
Normales |
October
2003 |
|
2001 |
Normales |
December
2002 |
|
2000 |
Normales |
September
2002 |
|
1999 |
Normales |
September
2002 |
|
1998 |
Normales |
October
1999 |
|
1997 |
Normales |
October
1998 |
|
1996 |
Normales |
March 1998 |
|
1995 |
Normales |
October
1996 |
|
1994 |
Normales |
November
1995 |
|
1992 |
Normales |
November
1993 |
The data in the report regarding the last Company
Accounts submitted by the company is taken from the TRADE REGISTER serving the
region in which the company's address is located 31/12/2013
> Balance
en formato Pyme de acuerdo al Nuevo Plan General Contable 2007
Information
corresponding to the fiscal year
2013 2012 2011 2010 2009 is taken from information
submitted to the TRADE REGISTER. Data corresponding to fiscal years before
2013 2012 2011 2010 2009 has been compiled based on
the equivalence criteria stipulated in Act JUS/206/2009. Where the provisions
of the Act did not establish relevant equivalence criteria, created such criteria using its own
methodology. To view details on the methodology.
|
|
ORIGINAL |
ORIGINAL |
ORIGINAL |
ORIGINAL |
ORIGINAL |
|
Assets |
2013 |
2012 |
2011 |
2010 |
2009 |
|
A) NON-CURRENT
ASSETS: 11000 |
171.360,00 |
65.827,00 |
30.797,00 |
26.788,00 |
41.636,00 |
|
I. Intangible fixed assets : 11100 |
0,00 |
0,00 |
0,00 |
0,00 |
0,00 |
|
II. Tangible fixed assets : 11200 |
163.703,00 |
59.279,00 |
25.549,00 |
15.540,00 |
30.388,00 |
|
III. Real estate investment: 11300 |
0,00 |
0,00 |
0,00 |
0,00 |
0,00 |
|
IV. Long-term investments in Group companies and associates :
11400 |
0,00 |
0,00 |
0,00 |
0,00 |
0,00 |
|
V. Long-term financial investments: 11500 |
7.657,00 |
6.548,00 |
5.248,00 |
11.248,00 |
11.248,00 |
|
VI. Assets for deferred tax : 11600 |
0,00 |
0,00 |
0,00 |
0,00 |
0,00 |
|
VII. Non-current trade debtors : 11700 |
0,00 |
0,00 |
0,00 |
0,00 |
0,00 |
|
B) CURRENT
ASSETS: 12000 |
2.090.236,00 |
2.158.806,00 |
1.401.859,00 |
1.680.875,00 |
1.248.858,00 |
|
I. Stocks : 12200 |
821.959,00 |
747.868,00 |
599.046,00 |
866.442,00 |
419.785,00 |
|
II. Trade debtors and others receivable accounts : 12300 |
793.735,00 |
792.241,00 |
636.940,00 |
205.522,00 |
416.078,00 |
|
1. Trade debtors / accounts receivable:
12380 |
793.735,00 |
792.241,00 |
636.940,00 |
11.080,00 |
236.569,00 |
|
a) Long-term receivables
from sales and services supplied : 12381 |
0,00 |
0,00 |
0,00 |
0,00 |
0,00 |
|
b) Customers for sales and
provisions of services : 12382 |
793.735,00 |
792.241,00 |
636.940,00 |
11.080,00 |
236.569,00 |
|
2. Called up share capital: 12370 |
0,00 |
0,00 |
0,00 |
0,00 |
0,00 |
|
3. Other accounts receivable : 12390 |
0,00 |
0,00 |
0,00 |
194.442,00 |
179.509,00 |
|
III. Short-term investment in Group companies and associates:
12400 |
0,00 |
0,00 |
0,00 |
0,00 |
0,00 |
|
IV. Short-term financial investments : 12500 |
126,00 |
140.126,00 |
126,00 |
200.126,00 |
127.272,00 |
|
V. Short-term accruals : 12600 |
0,00 |
0,00 |
0,00 |
0,00 |
0,00 |
|
VI. Cash and other equivalent liquid assets : 12700 |
474.416,00 |
478.570,00 |
165.746,00 |
408.784,00 |
285.724,00 |
|
TOTAL ASSETS (A
+ B) : 10000 |
2.261.596,00 |
2.224.633,00 |
1.432.656,00 |
1.707.663,00 |
1.290.494,00 |
|
|
ORIGINAL |
ORIGINAL |
ORIGINAL |
ORIGINAL |
ORIGINAL |
|
Liabilities and
Net Worth |
2013 |
2012 |
2011 |
2010 |
2009 |
|
A) NET WORTH:
20000 |
833.242,00 |
719.684,00 |
635.203,00 |
531.258,00 |
489.845,00 |
|
A-1)
Shareholders' equity: 21000 |
833.242,00 |
719.684,00 |
635.203,00 |
531.258,00 |
489.845,00 |
|
I. Capital: 21100 |
60.101,00 |
60.101,00 |
60.101,00 |
24.040,00 |
24.040,00 |
|
1. Registered capital : 21110 |
60.101,00 |
60.101,00 |
60.101,00 |
24.040,00 |
24.040,00 |
|
2. (Uncalled capital): 21120 |
0,00 |
0,00 |
0,00 |
0,00 |
0,00 |
|
II. Share premium: 21200 |
0,00 |
0,00 |
0,00 |
0,00 |
0,00 |
|
III. Reserves: 21300 |
3.276,00 |
3.276,00 |
3.276,00 |
3.276,00 |
3.276,00 |
|
IV. (Common stock equity): 21400 |
0,00 |
0,00 |
0,00 |
0,00 |
0,00 |
|
V. Profit or loss brought forward: 21500 |
656.307,00 |
571.825,00 |
503.942,00 |
462.529,00 |
382.716,00 |
|
VI. Other shareholders' contributions: 21600 |
0,00 |
0,00 |
0,00 |
0,00 |
0,00 |
|
VII. Result of the period: 21700 |
113.558,00 |
84.482,00 |
67.884,00 |
41.413,00 |
79.812,00 |
|
VIII. (Interim dividend): 21800 |
0,00 |
0,00 |
0,00 |
0,00 |
0,00 |
|
A-2) Changes in net
worth : 22000 |
0,00 |
0,00 |
0,00 |
0,00 |
0,00 |
|
A-3) Received
subsidies, donations and legacies: 23000 |
0,00 |
0,00 |
0,00 |
0,00 |
0,00 |
|
B) NON-CURRENT
LIABILITIES: 31000 |
174.929,00 |
91.287,00 |
135.217,00 |
177.832,00 |
41.166,00 |
|
I. Long-term provisions: 31100 |
49.845,00 |
34.620,00 |
38.550,00 |
0,00 |
0,00 |
|
II. Long-term creditors : 31200 |
125.085,00 |
56.667,00 |
96.667,00 |
177.832,00 |
41.166,00 |
|
1. Amounts owed to credit institutions:
31220 |
76.963,00 |
56.667,00 |
96.667,00 |
177.832,00 |
41.166,00 |
|
2. Creditors from financial leasing : 31230 |
48.122,00 |
0,00 |
0,00 |
0,00 |
0,00 |
|
3. Other long-term creditors : 31290 |
0,00 |
0,00 |
0,00 |
0,00 |
0,00 |
|
III. Long-term debts with Group companies and associates: 31300 |
0,00 |
0,00 |
0,00 |
0,00 |
0,00 |
|
IV. Liabilities for deferred tax: 31400 |
0,00 |
0,00 |
0,00 |
0,00 |
0,00 |
|
V. Long-term accruals: 31500 |
0,00 |
0,00 |
0,00 |
0,00 |
0,00 |
|
VI. Non-current trade creditors : 31600 |
0,00 |
0,00 |
0,00 |
0,00 |
0,00 |
|
VII. Special long-term debts : 31700 |
0,00 |
0,00 |
0,00 |
0,00 |
0,00 |
|
C) CURRENT
LIABILITIES : 32000 |
1.253.424,00 |
1.413.662,00 |
662.236,00 |
998.572,00 |
759.483,00 |
|
I. Short-term provisions: 32200 |
85.385,00 |
0,00 |
0,00 |
0,00 |
0,00 |
|
II. Short-term creditors : 32300 |
137.833,00 |
1.413.662,00 |
48.426,00 |
74.855,00 |
36.764,00 |
|
1. Amounts owed to credit institutions:
32320 |
64.878,00 |
40.000,00 |
48.426,00 |
40.000,00 |
31.248,00 |
|
2. Creditors from financial leasing : 32330 |
19.527,00 |
0,00 |
0,00 |
0,00 |
0,00 |
|
3. Other short-term creditors : 32390 |
53.428,00 |
1.373.662,00 |
0,00 |
34.855,00 |
5.516,00 |
|
III. Short-term amounts owed to group and associated companies:
32400 |
0,00 |
0,00 |
0,00 |
0,00 |
0,00 |
|
IV. Trade creditors and other accounts payable: 32500 |
1.030.206,00 |
0,00 |
613.810,00 |
923.717,00 |
722.719,00 |
|
1. Suppliers: 32580 |
542.595,00 |
0,00 |
613.810,00 |
390.845,00 |
351.330,00 |
|
a) Long-term debts :
32581 |
0,00 |
0,00 |
0,00 |
0,00 |
0,00 |
|
b) Short-term debts :
32582 |
542.595,00 |
0,00 |
613.810,00 |
390.845,00 |
351.330,00 |
|
2. Other creditors: 32590 |
487.611,00 |
0,00 |
0,00 |
532.871,00 |
371.390,00 |
|
V. Short-term accruals : 32600 |
0,00 |
0,00 |
0,00 |
0,00 |
0,00 |
|
VI. Special short-term debts : 32700 |
0,00 |
0,00 |
0,00 |
0,00 |
0,00 |
|
TOTAL NET WORTH
AND LIABILITIES (A + B + C) : 30000 |
2.261.596,00 |
2.224.633,00 |
1.432.656,00 |
1.707.663,00 |
1.290.494,00 |
|
|
ORIGINAL |
ORIGINAL |
ORIGINAL |
ORIGINAL |
ORIGINAL |
|
Profit and
Loss |
2013 |
2012 |
2011 |
2010 |
2009 |
|
1. Net turnover: 40100 |
4.600.748,00 |
3.987.279,00 |
3.175.022,00 |
2.945.663,00 |
1.734.173,00 |
|
2. Changes in stocks of finished goods and work in progress:
40200 |
74.091,00 |
0,00 |
0,00 |
0,00 |
0,00 |
|
3. Works carried out by the company for its assets: 40300 |
0,00 |
0,00 |
0,00 |
0,00 |
0,00 |
|
4. Supplies : 40400 |
-2.702.866,00 |
-2.359.339,00 |
-1.910.193,00 |
-1.762.148,00 |
-931.371,00 |
|
5. Other operating income: 40500 |
113.661,00 |
70.965,00 |
75.908,00 |
64.775,00 |
24.109,00 |
|
6. Personnel costs: 40600 |
-1.405.465,00 |
-1.194.285,00 |
-955.733,00 |
-862.369,00 |
-503.381,00 |
|
7. Other operating costs: 40700 |
-568.889,00 |
-397.526,00 |
-258.616,00 |
-320.623,00 |
-192.822,00 |
|
8. Amortisation of fixed assets: 40800 |
-33.177,00 |
-7.614,00 |
-9.594,00 |
-24.106,00 |
-24.885,00 |
|
9. Allocation of subsidies of non-financial fixed assets and other:
40900 |
0,00 |
0,00 |
0,00 |
0,00 |
0,00 |
|
10. Excess provisions : 41000 |
34.620,00 |
0,00 |
0,00 |
0,00 |
0,00 |
|
11. Impairment and result of transfers of fixed assets: 41100 |
-488,00 |
0,00 |
0,00 |
0,00 |
0,00 |
|
12. Other results : 41300 |
0,00 |
985,00 |
0,00 |
0,00 |
0,00 |
|
A) OPERATING INCOME
(1 + 2 + 3 + 4 + 5 + 6 + 7 + 8 + 9 + 10 + 11 + 12) : 49100 |
112.233,00 |
100.465,00 |
116.794,00 |
41.192,00 |
105.823,00 |
|
13. Financial income : 41400 |
2.099,00 |
485,00 |
8.603,00 |
3.426,00 |
1.569,00 |
|
a) Allocation of financial subsidies, donations
and legacies: 41430 |
0,00 |
0,00 |
0,00 |
0,00 |
0,00 |
|
b) Other financial income: 41490 |
2.099,00 |
485,00 |
8.603,00 |
3.426,00 |
1.569,00 |
|
14. Financial expenditure : 41500 |
-8.144,00 |
-4.314,00 |
-7.455,00 |
0,00 |
-3.677,00 |
|
15. Changes in fair value of financial instruments : 41600 |
0,00 |
0,00 |
0,00 |
-6.790,00 |
0,00 |
|
16. Exchange rate differences: 41700 |
0,00 |
0,00 |
0,00 |
3.585,00 |
-5.973,00 |
|
17. Impairment and result for transfers of financial instruments :
41800 |
0,00 |
0,00 |
-30.009,00 |
0,00 |
0,00 |
|
18. Other financial income and expenditure: 42100 |
0,00 |
0,00 |
0,00 |
0,00 |
0,00 |
|
a) Incorporation of financial expenditure to
assets: 42110 |
0,00 |
0,00 |
0,00 |
0,00 |
0,00 |
|
b) Financial income from arrangement with
creditors: 42120 |
0,00 |
0,00 |
0,00 |
0,00 |
0,00 |
|
c) Other income and expenditure: 42130 |
0,00 |
0,00 |
0,00 |
0,00 |
0,00 |
|
B) FINANCIAL
REVENUE ( 13 + 14 + 15 + 16 + 17 +18 ) : 49200 |
-6.045,00 |
-3.828,00 |
-28.861,00 |
221,00 |
-8.080,00 |
|
C) NET RESULT BEFORE
TAXES ( A + B ) : 49300 |
106.188,00 |
96.637,00 |
87.934,00 |
41.413,00 |
97.743,00 |
|
19. Income taxes : 41900 |
7.370,00 |
-12.155,00 |
-20.050,00 |
0,00 |
-17.931,00 |
|
D) RESULT OF THE
PERIOD ( C + 19 ) : 49500 |
113.558,00 |
84.482,00 |
67.884,00 |
41.413,00 |
79.812,00 |
> Normal
Balance Sheet under the rules of the 1990 General Accounting Plan (repealed
since 1st January of 2008)
Information corresponding to the fiscal year
2013 2012 2011 2010 2009 has been compiled based
on the equivalence criteria stipulated in Act
JUS/206/2009. Where the provisions of the Act did not
establish relevant equivalence criteria, created such criteria using its own
methodology. To view
details on the methodology 2013 2012 2011 2010 2009
is taken from information submitted to the
TRADE REGISTER.
|
|
EQUIVALENCIA |
EQUIVALENCIA |
EQUIVALENCIA |
EQUIVALENCIA |
EQUIVALENCIA |
|
ASSETS |
2013 |
2012 |
2011 |
2010 |
2009 |
|
A) SHAREHOLDERS (PARTNERS)
BY UNCALLED SUSCRIBED CAPITAL: |
0,00 |
0,00 |
0,00 |
0,00 |
0,00 |
|
B) FIXED ASSETS:
|
171.360,00 |
65.827,00 |
30.797,00 |
26.788,00 |
41.636,00 |
|
I. Formation expenses: |
0,00 |
0,00 |
0,00 |
0,00 |
0,00 |
|
II. Intangible fixed assets: |
0,00 |
0,00 |
0,00 |
0,00 |
0,00 |
|
III. Tangible fixed assets: |
163.703,00 |
59.279,00 |
25.549,00 |
15.540,00 |
30.388,00 |
|
IV. Financial investments: |
7.657,00 |
6.548,00 |
5.248,00 |
11.248,00 |
11.248,00 |
|
V. Own shares: |
0,00 |
0,00 |
0,00 |
0,00 |
0,00 |
|
VI. Long-term trade receivables: |
0,00 |
0,00 |
0,00 |
0,00 |
0,00 |
|
C) Deferred
expenses: |
0,00 |
0,00 |
0,00 |
0,00 |
0,00 |
|
D) CURRENT
ASSETS: |
2.090.236,00 |
2.158.806,00 |
1.401.859,00 |
1.680.875,00 |
1.248.858,00 |
|
I. Called-up share capital (not paid): |
0,00 |
0,00 |
0,00 |
0,00 |
0,00 |
|
II. Stocks: |
821.959,00 |
747.868,00 |
599.046,00 |
866.442,00 |
419.785,00 |
|
III. Debtors: |
793.735,00 |
792.241,00 |
636.940,00 |
205.522,00 |
416.078,00 |
|
IV. Short-term investments: |
126,00 |
140.126,00 |
126,00 |
200.126,00 |
127.272,00 |
|
V. Short-term treasury shares: |
0,00 |
0,00 |
0,00 |
0,00 |
0,00 |
|
VI. Cash at bank and in hand: |
474.416,00 |
478.570,00 |
165.746,00 |
408.784,00 |
285.724,00 |
|
VII. Prepayments and accrued income: |
0,00 |
0,00 |
0,00 |
0,00 |
0,00 |
|
GENERAL TOTAL (A
+ B + C + D): |
2.261.596,00 |
2.224.633,00 |
1.432.656,00 |
1.707.663,00 |
1.290.494,00 |
MERCANTILE REGISTRY.
|
|
EQUIVALENCIA |
EQUIVALENCIA |
EQUIVALENCIA |
EQUIVALENCIA |
EQUIVALENCIA |
|
LIABILITIES |
2013 |
2012 |
2011 |
2010 |
2009 |
|
A) EQUITY:
|
833.242,00 |
719.684,00 |
635.203,00 |
531.258,00 |
489.845,00 |
|
I. Subscribed capital: |
60.101,00 |
60.101,00 |
60.101,00 |
24.040,00 |
24.040,00 |
|
II. Share premium: |
0,00 |
0,00 |
0,00 |
0,00 |
0,00 |
|
III. Revaluation reserves: |
0,00 |
0,00 |
0,00 |
0,00 |
0,00 |
|
IV. Reserves: |
3.276,00 |
3.276,00 |
3.276,00 |
3.276,00 |
3.276,00 |
|
a) Differences for capital adjustment to euros:
|
0,00 |
0,00 |
0,00 |
0,00 |
0,00 |
|
b) Remaining Reserves: |
3.276,00 |
3.276,00 |
3.276,00 |
3.276,00 |
3.276,00 |
|
V. Profit or loss brought forward: |
656.307,00 |
571.825,00 |
503.942,00 |
462.529,00 |
382.716,00 |
|
VI. Profit or loss for the financial year: |
113.558,00 |
84.482,00 |
67.884,00 |
41.413,00 |
79.812,00 |
|
VII. Interim dividend paid: |
0,00 |
0,00 |
0,00 |
0,00 |
0,00 |
|
VIII. Own shares for capital reduction: |
0,00 |
0,00 |
0,00 |
0,00 |
0,00 |
|
B) Deferred
income: |
0,00 |
0,00 |
0,00 |
0,00 |
0,00 |
|
C) PROVISIONS
FOR LIABILITIES AND CHARGES: |
49.845,00 |
34.620,00 |
38.550,00 |
0,00 |
0,00 |
|
D) LONG TERM
LIABILITIES: |
125.085,00 |
56.667,00 |
96.667,00 |
177.832,00 |
41.166,00 |
|
E) SHORT TERM
CREDITORS: |
1.168.039,00 |
1.413.662,00 |
662.236,00 |
998.572,00 |
759.483,00 |
|
F) SHORT-TERM PROVISIONS
FOR LIABILITIES AND CHARGES: |
85.385,00 |
0,00 |
0,00 |
0,00 |
0,00 |
|
GENERAL TOTAL (A
+ B + C + D + E + F): |
2.261.596,00 |
2.224.633,00 |
1.432.656,00 |
1.707.663,00 |
1.290.494,00 |
MERCANTILE REGISTRY.
|
|
EQUIVALENCIA |
EQUIVALENCIA |
EQUIVALENCIA |
EQUIVALENCIA |
EQUIVALENCIA |
|
DEBIT |
2013 |
2012 |
2011 |
2010 |
2009 |
|
A) CHARGES (A.1
to A.15): |
4.637.569,00 |
3.975.232,00 |
3.191.649,00 |
2.976.036,00 |
1.680.039,00 |
|
A.1. Operating consumption: |
2.628.776,00 |
2.359.339,00 |
1.910.193,00 |
1.762.148,00 |
931.371,00 |
|
A.2. Staff Costs: |
1.405.465,00 |
1.194.285,00 |
955.733,00 |
862.369,00 |
503.381,00 |
|
a) Wages, salaries et al.:
|
0,00 |
0,00 |
0,00 |
0,00 |
0,00 |
|
b) Social security costs:
|
1.405.465,00 |
1.194.285,00 |
955.733,00 |
862.369,00 |
503.381,00 |
|
A.3. Depreciation expense: |
33.177,00 |
7.614,00 |
9.594,00 |
24.106,00 |
24.885,00 |
|
A.4. Variation of trade provisions and losses of
unrecovered receivables: |
0,00 |
0,00 |
0,00 |
0,00 |
0,00 |
|
A.5. Other operating charges: |
568.889,00 |
397.526,00 |
258.616,00 |
320.623,00 |
192.822,00 |
|
A.I. OPERATING BENEFITS (B.1-A.1-A.2-A.3-A.4-A.5): |
112.722,00 |
99.481,00 |
116.794,00 |
41.192,00 |
105.823,00 |
|
A.6. Financial and similar charges: |
8.144,00 |
4.314,00 |
37.464,00 |
0,00 |
3.677,00 |
|
a) Due to liabilities with
companies of the group: |
0,00 |
0,00 |
0,00 |
0,00 |
0,00 |
|
b) Due to liabilities with
associated companies: |
0,00 |
0,00 |
0,00 |
0,00 |
0,00 |
|
c) Due to other debts:
|
8.144,00 |
4.314,00 |
7.455,00 |
0,00 |
3.677,00 |
|
d) Losses from financial
investments: |
0,00 |
0,00 |
30.009,00 |
0,00 |
0,00 |
|
A.7. Financial investment provision change:
|
0,00 |
0,00 |
0,00 |
6.790,00 |
0,00 |
|
A.8. Exchange losses: |
0,00 |
0,00 |
0,00 |
0,00 |
5.973,00 |
|
A.II. POSITIVE FINANCIAL RESULTS (B.2+B.3-A.6-A.7-A.8): |
0,00 |
0,00 |
0,00 |
221,00 |
0,00 |
|
A.III. PROFIT FROM ORDINARY ACTIVITIES (A.I+A.II-B.I-B.II): |
106.677,00 |
95.652,00 |
87.934,00 |
41.413,00 |
97.743,00 |
|
A.9. Changes in provisions for intangible, tangible
and securities portfolio: |
0,00 |
0,00 |
0,00 |
0,00 |
0,00 |
|
A.10. Losses from tangible and intangible fixed
assets and portfolio: |
488,00 |
0,00 |
0,00 |
0,00 |
0,00 |
|
A.11. Losses from transactions with own shares
and debentures: |
0,00 |
0,00 |
0,00 |
0,00 |
0,00 |
|
A.12. Extraordinary expenses: |
0,00 |
0,00 |
0,00 |
0,00 |
0,00 |
|
A.13. Prior year expenses and losses: |
0,00 |
0,00 |
0,00 |
0,00 |
0,00 |
|
A.IV. EXTRAORDINARY PROFIT
(B.4+B.5+B.6+B.7+B.8-A.9-A.10-A.11-A.12-A.13): |
0,00 |
985,00 |
0,00 |
0,00 |
0,00 |
|
A.V. PROFIT BEFORE TAXES (A.III+A.IV-B.III-B.IV): |
106.188,00 |
96.637,00 |
87.934,00 |
41.413,00 |
97.743,00 |
|
A.14. Corporation Tax: |
-7.370,00 |
12.155,00 |
20.050,00 |
0,00 |
17.931,00 |
|
A.15. Miscellaneous taxes: |
0,00 |
0,00 |
0,00 |
0,00 |
0,00 |
|
A.VI. FINANCIAL YEAR RESULT (PROFIT) (A.V-A.14-A.15): |
113.558,00 |
84.482,00 |
67.884,00 |
41.413,00 |
79.812,00 |
MERCANTILE REGISTRY.
|
|
EQUIVALENCIA |
EQUIVALENCIA |
EQUIVALENCIA |
EQUIVALENCIA |
EQUIVALENCIA |
|
CREDIT |
2013 |
2012 |
2011 |
2010 |
2009 |
|
B) INCOME ( B.1
to B.8): |
4.751.127,00 |
4.059.713,00 |
3.259.533,00 |
3.017.449,00 |
1.759.852,00 |
|
B.1. Operating income: |
4.749.028,00 |
4.058.244,00 |
3.250.930,00 |
3.010.438,00 |
1.758.282,00 |
|
a) Net total sales: |
4.600.748,00 |
3.987.279,00 |
3.175.022,00 |
2.945.663,00 |
1.734.173,00 |
|
b) Miscellaneous operating
income: |
148.281,00 |
70.965,00 |
75.908,00 |
64.775,00 |
24.109,00 |
|
B.I. PÉRDIDAS DE EXPLOTACIÓN (A.1+A.2+A.3+A.4+A.5-B.1 ): |
0,00 |
0,00 |
0,00 |
0,00 |
0,00 |
|
B.2. Financial income: |
2.099,00 |
485,00 |
8.603,00 |
3.426,00 |
1.569,00 |
|
a) Companies of the group:
|
2.099,00 |
485,00 |
8.603,00 |
3.426,00 |
1.569,00 |
|
b) In associated companies:
|
0,00 |
0,00 |
0,00 |
0,00 |
0,00 |
|
c) Miscellaneous: |
0,00 |
0,00 |
0,00 |
0,00 |
0,00 |
|
d) Profit on financial
investment: |
0,00 |
0,00 |
0,00 |
0,00 |
0,00 |
|
B.3. Exchange gains: |
0,00 |
0,00 |
0,00 |
3.585,00 |
0,00 |
|
B.II. NEGATIVE FINANCIAL RESULTS (A.6+A.7+A.8-B.2-B.3): |
6.045,00 |
3.828,00 |
28.861,00 |
0,00 |
8.080,00 |
|
B.III. LOSSES ON ORDINARY ACTIVITIES ( B.I + B.II - A.I - A.II ):
|
0,00 |
0,00 |
0,00 |
0,00 |
0,00 |
|
B.4. Profit on disposal of both tangible and intangible
fixed assets and securities portfolio: |
0,00 |
0,00 |
0,00 |
0,00 |
0,00 |
|
B.5. Profit on transactions with own shares and
debentures: |
0,00 |
0,00 |
0,00 |
0,00 |
0,00 |
|
B.6. Capital grants transferred to profit and
loss: |
0,00 |
0,00 |
0,00 |
0,00 |
0,00 |
|
B.7. Extraordinary income: |
0,00 |
985,00 |
0,00 |
0,00 |
0,00 |
|
B.8. Income and profit of former financial years:
|
0,00 |
0,00 |
0,00 |
0,00 |
0,00 |
|
B.IV. NEGATIVE EXTRAORDINARY RESULTS
(A.9+A.10+A.11+A.12+A.13-B.4-B.5-B.6-B.7-B.8): |
488,00 |
0,00 |
0,00 |
0,00 |
0,00 |
|
B.V. LOSSES BEFORE TAXES (B.III+B.IV-A.III-A.IV): |
0,00 |
0,00 |
0,00 |
0,00 |
0,00 |
|
B.VI. FINANCIAL YEAR RESULTS (LOSSES) (B.V+A.14+A.15): |
0,00 |
0,00 |
0,00 |
0,00 |
0,00 |
MERCANTILE REGISTRY.
|
CASHFLOW
STATEMENT
|
|
|
|
|
Model: Normal
> Source of information:
Data contained in this section is taken from the information declared in the
Annual Accounts submitted to the Trade Register.
|
|
2013 |
2012 |
2011 |
2010 |
2009 |
|
1. Fiscal year
result before taxes.: 61100 |
106.188,00 |
96.637,00 |
87.934,00 |
41.413,00 |
97.743,00 |
|
2. Results
adjustments.: 61200 |
139.832,00 |
7.512,00 |
46.996,00 |
20.679,00 |
26.993,00 |
|
a) Fixed Assets Amortization (+).: 61201 |
33.177,00 |
7.614,00 |
9.594,00 |
24.106,00 |
24.885,00 |
|
c) Variation in Provision (+/-). : 61203 |
100.610,00 |
-3.930,00 |
38.550,00 |
0,00 |
0,00 |
|
g) Financial income (-).: 61207 |
-2.099,00 |
-485,00 |
-8.603,00 |
-3.426,00 |
-1.569,00 |
|
h) Financial Expenses (+). : 61208 |
8.144,00 |
4.314,00 |
7.455,00 |
0,00 |
3.677,00 |
|
3. Changes in
current capital equity.: 61300 |
1.101.991,00 |
-1.070.089,00 |
-293.978,00 |
-107.959,00 |
-31.342,00 |
|
a) Stock (+/-).: 61301 |
-74.091,00 |
-148.822,00 |
267.396,00 |
-446.657,00 |
29.565,00 |
|
d) Debtors and other accounts receivable (+/-). : 61302 |
-1.494,00 |
-155.302,00 |
-431.417,00 |
210.556,00 |
-277.654,00 |
|
c) Other current assets (+/-). : 61303 |
140.000,00 |
-140.000,00 |
200.000,00 |
-72.854,00 |
-94.857,00 |
|
d) Creditors and other accounts payable (+/-). : 61304 |
1.037.576,00 |
-625.965,00 |
-329.957,00 |
200.997,00 |
311.604,00 |
|
4. Other cash flows
for operating activities.: 61400 |
-6.045,00 |
-3.828,00 |
1.148,00 |
3.426,00 |
-2.107,00 |
|
a) Interest payments (-). : 61401 |
-8.144,00 |
-4.314,00 |
-7.455,00 |
0,00 |
-3.677,00 |
|
c) Interest collection (+). : 61403 |
2.099,00 |
485,00 |
8.603,00 |
3.426,00 |
1.569,00 |
|
5. Operating
activity cash flows (1 + 2 + 3 + 4) : 61500 |
1.341.967,00 |
-969.768,00 |
-157.901,00 |
-42.440,00 |
91.287,00 |
|
6. Payments for
investment (-).: 62100 |
-105.533,00 |
-35.030,00 |
-10.009,00 |
0,00 |
-7.000,00 |
|
c) Fixed assets. : 62103 |
-104.424,00 |
-33.730,00 |
-10.009,00 |
0,00 |
0,00 |
|
e) Other financial assets. : 62105 |
-1.109,00 |
-1.300,00 |
0,00 |
0,00 |
-7.000,00 |
|
7. Divestment
payment collection (+). : 62200 |
0,00 |
0,00 |
6.000,00 |
14.848,00 |
24.885,00 |
|
c) Fixed assets. : 62203 |
0,00 |
0,00 |
0,00 |
14.848,00 |
24.885,00 |
|
e) Other financial assets. : 62205 |
0,00 |
0,00 |
6.000,00 |
0,00 |
0,00 |
|
8. Investment
activity cash flows (6 + 7) minus Amortization: 62300 |
-138.711,00 |
-42.644,00 |
-13.603,00 |
-9.258,00 |
-7.000,00 |
|
9. Payment
collection and payments for equity instruments. : 63100 |
0,00 |
0,00 |
36.061,00 |
0,00 |
0,00 |
|
a) Issuance of equity instruments (+). : 63101 |
0,00 |
0,00 |
36.061,00 |
0,00 |
0,00 |
|
10. Payment
collection and payments for financial liabilities instruments.: 63200 |
-1.207.410,00 |
1.325.236,00 |
-107.595,00 |
174.758,00 |
78.337,00 |
|
a) Issuance : 63201 |
112.824,00 |
1.373.662,00 |
8.426,00 |
174.758,00 |
78.337,00 |
|
2. Debts incurred with credit institutions (+). : 63203 |
45.174,00 |
0,00 |
8.426,00 |
145.419,00 |
72.413,00 |
|
4. Special characteristic debts (+). : 63205 |
67.650,00 |
0,00 |
0,00 |
0,00 |
0,00 |
|
5. Other debts (+). : 63206 |
0,00 |
1.373.662,00 |
0,00 |
29.339,00 |
5.924,00 |
|
b) Repayment and amortization of : 63207 |
-1.320.234,00 |
-48.426,00 |
-116.021,00 |
0,00 |
0,00 |
|
2. Debts incurred with credit institutions (-).: 63209 |
0,00 |
-48.426,00 |
-81.166,00 |
0,00 |
0,00 |
|
5. Other debts (-). : 63212 |
-1.320.234,00 |
0,00 |
-34.855,00 |
0,00 |
0,00 |
|
11. Payments
from dividends and remunerations from other assets instruments. : 63300 |
0,00 |
0,00 |
0,00 |
0,00 |
0,00 |
|
12. Cash flows for
financing activities (9+10+11).: 63400 |
-1.207.410,00 |
1.325.236,00 |
-71.534,00 |
174.758,00 |
78.337,00 |
|
D) EFFECT OF
EXCHANGE RATE CHANGES: 64000 |
0,00 |
0,00 |
0,00 |
0,00 |
0,00 |
|
E) NET INCREASE/DECREASE
OF CASH OR EQUIVALENT ASSETS (+/-5+/-8+/12+/-D) : 65000 |
-4.154,00 |
312.824,00 |
-243.038,00 |
123.060,00 |
162.624,00 |
|
Cash or equivalent assets as of beginning of the fiscal year.:
65100 |
478.570,00 |
165.746,00 |
408.784,00 |
285.724,00 |
123.099,00 |
|
Cash or equivalent assets as of end of the fiscal year.: 65200 |
474.416,00 |
478.570,00 |
165.746,00 |
408.784,00 |
285.724,00 |
|
FINANCIAL
DIAGNOSIS
|
|
|
|
|
> Economic-Financial
Comparative Analysis
Data used in
the following ratios and indicators is taken from the Annual Accounts submitted
by the company to the TRADE REGISTER.
> Comparison
within the Sector
|
Cash Flow |
2013 |
2012 |
Variación 2013 -
2012 |
|||
|
|
Empresa |
Sector |
Empresa |
Sector |
Empresa |
Sector |
|
Cash Flow over
Sales: |
0,00 % |
0,01 % |
0,08 % |
0,17 % |
-101,15 % |
-96,02 % |
|
EBITDA over
Sales: |
2,42 % |
4,39 % |
2,69 % |
7,58 % |
-9,95 % |
-42,07 % |
|
Cash Flow Yield:
|
0,00 % |
0,00 % |
0,14 % |
0,04 % |
-101,31 % |
-86,63 % |
|
Profitability |
2013 |
2012 |
Variación 2013 -
2012 |
|||
|
|
Empresa |
Sector |
Empresa |
Sector |
Empresa |
Sector |
|
Operating
economic profitability: |
4,98 % |
1,65 % |
4,79 % |
0,51 % |
4,02 % |
220,18 % |
|
Total economic
profitability: |
5,06 % |
1,50 % |
4,54 % |
-0,03 % |
11,40 % |
5.545,38 % |
|
Financial
profitability: |
13,63 % |
0,05 % |
11,74 % |
-3,94 % |
16,10 % |
101,38 % |
|
Margin: |
2,38 % |
1,71 % |
2,45 % |
0,94 % |
-2,88 % |
81,57 % |
|
Mark-up: |
2,25 % |
0,24 % |
2,36 % |
-6,14 % |
-4,44 % |
103,83 % |
|
Solvency |
2013 |
2012 |
Variación 2013 -
2012 |
|||
|
|
Empresa |
Sector |
Empresa |
Sector |
Empresa |
Sector |
|
Liquidity:
|
0,41 |
0,26 |
0,34 |
0,16 |
19,98 |
64,78 |
|
Acid Test:
|
1,09 |
1,10 |
1,00 |
0,86 |
8,79 |
27,29 |
|
Working Capital
/ Investment: |
0,37 |
0,21 |
0,33 |
0,08 |
10,47 |
151,05 |
|
Solvency: |
1,79 |
1,76 |
1,53 |
1,43 |
17,18 |
22,74 |
|
Indebtedness |
2013 |
2012 |
Variación 2013 -
2012 |
|||
|
|
Empresa |
Sector |
Empresa |
Sector |
Empresa |
Sector |
|
Indebtedness
level: |
1,46 |
1,03 |
1,95 |
1,07 |
-24,88 |
-3,84 |
|
Borrowing
Composition: |
0,11 |
0,73 |
0,04 |
1,22 |
167,16 |
-39,98 |
|
Repayment
Ability: |
-311,27 |
103,97 |
4,70 |
14,17 |
-6.722,46 |
633,79 |
|
Warranty: |
1,75 |
1,98 |
1,51 |
1,94 |
15,59 |
1,96 |
|
Generated
resources / Total creditors: |
0,11 |
0,06 |
0,06 |
0,01 |
81,16 |
348,18 |
|
Efficiency |
2013 |
2012 |
Variación 2013 -
2012 |
|||
|
|
Empresa |
Sector |
Empresa |
Sector |
Empresa |
Sector |
|
Productivity:
|
1,08 |
1,20 |
1,09 |
1,30 |
-0,96 |
-7,95 |
|
Turnover of
Collection Rights : |
5,94 |
4,36 |
5,12 |
3,64 |
15,95 |
19,89 |
|
Turnover of
Payment Entitlements: |
3,25 |
2,92 |
|
2,35 |
|
24,20 |
|
Stock rotation:
|
5,64 |
4,21 |
5,29 |
2,20 |
6,56 |
91,23 |
|
Assets turnover:
|
2,09 |
0,96 |
1,95 |
0,55 |
7,10 |
76,33 |
|
Borrowing Cost:
|
0,63 |
2,14 |
0,29 |
2,83 |
114,67 |
-24,10 |
> Trend of indicators
under the General Accounting Plan of 2007 (2013, 2012, 2011, 2010, 2009)
|
Cash Flow |
2013 |
2012 |
2011 |
2010 |
2009 |
|
Cash Flow over
Sales: |
0,00 % |
0,08 % |
-0,08 % |
0,04 % |
0,09 % |
|
EBITDA over
Sales: |
2,42 % |
2,69 % |
3,98 % |
2,22 % |
7,54 % |
|
Cash Flow Yield:
|
0,00 % |
0,14 % |
-0,17 % |
0,07 % |
0,13 % |
|
Profitability |
2013 |
2012 |
2011 |
2010 |
2009 |
|
Operating
economic profitability: |
4,98 % |
4,79 % |
8,18 % |
2,75 % |
9,19 % |
|
Total economic
profitability: |
5,06 % |
4,54 % |
6,66 % |
2,43 % |
7,86 % |
|
Financial
profitability: |
13,63 % |
11,74 % |
10,69 % |
7,80 % |
16,29 % |
|
Margin: |
2,38 % |
2,45 % |
3,59 % |
1,37 % |
6,02 % |
|
Mark-up: |
2,25 % |
2,36 % |
2,70 % |
1,38 % |
5,56 % |
|
Solvency |
2013 |
2012 |
2011 |
2010 |
2009 |
|
Liquidity:
|
0,41 |
0,34 |
0,25 |
0,41 |
0,38 |
|
Acid Test:
|
1,09 |
1,00 |
1,21 |
0,82 |
1,09 |
|
Working Capital /
Investment: |
0,37 |
0,33 |
0,52 |
0,40 |
0,38 |
|
Solvency: |
1,79 |
1,53 |
2,12 |
1,68 |
1,64 |
|
Indebtedness |
2013 |
2012 |
2011 |
2010 |
2009 |
|
Indebtedness
level: |
1,46 |
1,95 |
1,13 |
2,21 |
1,63 |
|
Borrowing Composition:
|
0,11 |
0,04 |
0,15 |
0,18 |
0,05 |
|
Repayment
Ability: |
-311,27 |
4,70 |
-3,12 |
9,56 |
4,92 |
|
Warranty: |
1,75 |
1,51 |
1,89 |
1,45 |
1,61 |
|
Generated
resources / Total creditors: |
0,11 |
0,06 |
0,14 |
0,06 |
0,13 |
|
Efficiency |
2013 |
2012 |
2011 |
2010 |
2009 |
|
Productivity:
|
1,08 |
1,09 |
1,13 |
1,08 |
1,26 |
|
Turnover of
Collection Rights : |
5,94 |
5,12 |
5,10 |
14,65 |
4,23 |
|
Turnover of
Payment Entitlements: |
3,25 |
|
3,53 |
2,25 |
1,56 |
|
Stock rotation:
|
5,64 |
5,29 |
5,23 |
3,43 |
3,94 |
|
Assets turnover:
|
2,09 |
1,95 |
2,28 |
2,01 |
1,53 |
|
Borrowing Cost:
|
0,63 |
0,29 |
0,98 |
0,00 |
0,46 |
COMPARATIVE
SECTORIAL BALANCE
|
|
|
|
|
Sector-based Comparison under the rules of the New
General Accounting Plan.
|
|
Variación - |
|
|
|
Empresa |
Sector |
|
|
Variación - |
|
|
|
Empresa |
Sector |
|
|
Variación - |
|
|
|
Empresa |
Sector |
|
Public
Tenders and Works Won
|
|
|
|
|
No
Public Tenders assigned to the name of the company.
|
Research
Summary
|
|
It is a firm contitued in 1.992, engaged in the
manufacturing and sale of machinery for the glass industry. Its activity is engaged
nationally and internationally. Sources consulted do not appear anything
against it. In light of the above we believe that he can continue operations
relating to risk commensurate with its size. |
|
Answer
to additional question
|
|
The Street numbering has recently been changed
and now it have assigned the number 22, while it is at the same location |
FOREIGN EXCHANGE RATES
|
Currency |
Unit
|
Indian Rupees |
|
US Dollar |
1 |
Rs.63.82 |
|
|
1 |
Rs.101.26 |
|
Euro |
1 |
Rs.72.36 |
INFORMATION DETAILS
|
Analysis Done by
: |
RAS |
|
|
|
|
Report Prepared
by : |
ASH |
RATING EXPLANATIONS
|
RATING |
STATUS |
PROPOSED CREDIT LINE |
|
|
>86 |
Aaa |
Possesses an extremely sound financial base with the strongest capability
for timely payment of interest and principal sums |
Unlimited |
|
71-85 |
Aa |
Possesses adequate working capital. No caution needed for credit
transaction. It has above average (strong) capability for payment of interest
and principal sums |
Large |
|
56-70 |
A |
Financial & operational base are regarded healthy. General
unfavourable factors will not cause fatal effect. Satisfactory capability for
payment of interest and principal sums |
Fairly Large |
|
41-55 |
Ba |
Overall operation is considered normal. Capable to meet normal
commitments. |
Satisfactory |
|
26-40 |
B |
Capability to overcome financial difficulties seems comparatively
below average. |
Small |
|
11-25 |
Ca |
Adverse factors are apparent. Repayment of interest and principal sums
in default or expected to be in default upon maturity |
Limited with
full security |
|
<10 |
C |
Absolute credit risk exists. Caution needed to be exercised |
Credit not
recommended |
|
-- |
NB |
New Business |
-- |
This score serves as a reference to assess
SC’s credit risk and to set the amount of credit to be extended. It is calculated
from a composite of weighted scores obtained from each of the major sections of
this report. The assessed factors and their relative weights (as indicated
through %) are as follows:
Financial
condition (40%) Ownership
background (20%) Payment record
(10%)
Credit history
(10%) Market trend (10%) Operational size
(10%)
This report is issued at your request without any
risk and responsibility on the part of MIRA INFORM PRIVATE LIMITED (MIPL)
or its officials.