MIRA INFORM REPORT
|
Report No. : |
309978 |
|
Report Date : |
05.03.2015 |
IDENTIFICATION DETAILS
|
Name : |
PRYSMIAN SPAIN SA |
|
|
|
|
Registered Office : |
Crta. C-15, Km 2. Vilanova I La Geltru Barcelona 08800 |
|
|
|
|
Country : |
Spain |
|
|
|
|
Financials (as on) : |
31.12.2013 |
|
|
|
|
Date of Incorporation : |
14.07.10975 |
|
|
|
|
Legal Form : |
Public Company |
|
|
|
|
Line of Business : |
Subject is engaged in manufacture of low voltage (LV), medium voltage (MV),
high voltage (AT), special cables and accessories related to the world of
energy; fiber optic cables, cable systems for data transmission and image in
high voltage lines and installation services and technical advice to projects
"turnkey". |
|
|
|
|
No. of Employee : |
Not Available |
RATING & COMMENTS
|
MIRA’s Rating : |
B |
|
RATING |
STATUS |
PROPOSED CREDIT LINE |
|
|
26-40 |
B |
Capability to overcome financial difficulties seems comparatively
below average. |
Small |
|
Status : |
Moderate |
|
|
|
|
Payment Behaviour : |
Slow but correct |
|
|
|
|
Litigation : |
Clear |
NOTES :
Any query related to this report can be made
on e-mail : infodept@mirainform.com
while quoting report number, name and date.
ECGC Country Risk Classification List – December 31, 2014
|
Country Name |
Previous Rating (30.09.2014) |
Current Rating (31.12.2014) |
|
Spain |
A2 |
A1 |
|
Risk Category |
ECGC
Classification |
|
Insignificant |
A1 |
|
Low |
A2 |
|
Moderate |
B1 |
|
High |
B2 |
|
Very High |
C1 |
|
Restricted |
C2 |
|
Off-credit |
D |
SPAIN ECONOMIC OVERVIEW
Spain experienced a prolonged recession in the wake of the global financial crisis. GDP contracted by 3.7% in 2009, ending a 16-year growth trend, and continued contracting through most of 2013. Economic growth resumed in late 2013, albeit only modestly, as credit contraction in the private sector, fiscal austerity, and high unemployment continued to weigh on domestic consumption and investment. Exports, however, have been resilient throughout the economic downturn, partially offsetting declines in domestic consumption and helped to bring Spain's current account into surplus in 2013 for the first time since 1986. The unemployment rate rose from a low of about 8% in 2007 to more than 26% in 2013, straining Spain's public finances as spending on social benefits increased while tax revenues fell. Spain’s budget deficit peaked at 11.4% of GDP in 2009. Spain gradually reduced the deficit to just under 7% of GDP in 2013, slightly above the 6.5% target negotiated between Spain and the EU. Public debt has increased substantially – from 60.1% of GDP in 2010 to 93.4% in 2013. Rising labor productivity, moderating labor costs, and lower inflation have helped to improve foreign investor interest in the economy and to reduce government borrowing costs. The government's ongoing efforts to implement reforms - labor, pension, health, tax, and education - are aimed at supporting investor sentiment. The government also has shored up struggling banks exposed to Spain's depressed domestic construction and real estate sectors by successfully completing an EU-funded restructuring and recapitalization program in December 2013.
|
Source
: CIA |
EXECUTIVE
SUMMARY
|
|
Name: |
PRYSMIAN SPAIN SA |
|
NIF / Fiscal code: |
A08395162 |
|
Status: |
ACTIVE |
|
Incorporation Date: |
14/07/1975 |
|
Register Data |
Register Section 8 Sheet 7192 |
|
Last Publication
in BORME: |
25/02/2015 [Appointments] |
|
Last Published Account Deposit: |
2013 |
|
Share Capital: |
58.178.234,22 |
|
|
|
|
Localization: |
CRTA. C-15, KM 2. - VILANOVA I LA GELTRU - 08800 - BARCELONA |
|
Telephone - Fax - Email - Website: |
Ph.:. 935 748 383�� Email.
info@draka.es�� Website.
www.es.prysmiangroup.com |
|
|
|
|
Activity: |
|
|
NACE: |
2732 - Manufacture of other electronic and electric wires and cables |
|
Registered Trademarks: |
|
|
Audited / Opinion: |
Si / |
|
Tenders and Awards: |
0 for a total cost of 0 |
|
Subsidies: |
3 for a total cost of 312000 |
|
Quality Certificate: |
No |
|
|
|
|
Defaults, Legal
Claims and Insolvency Proceedings : |
|
|
|
|
|
|
|
Number |
Amount (€) |
Most Recent Entry |
|
Insolvency Proceedings, Bankruptcy and Suspension of Payments |
|
Unpublished |
--- |
--- |
|
Defaults on debt with Financial Institutions and Large Companies |
|
2 |
3.197,43 |
--- |
|
Judicial Claims (Notices, Executive Proceedings, Attachments,
Auctions, Bad Debt) |
|
None |
0 |
--- |
|
Proceedings heard by the Civil Court |
|
Unpublished |
0 |
--- |
|
Proceedings heard by the Labour Court |
|
Unpublished |
0 |
--- |
|
Partners: |
|
DRAKA HOLDING NV Y CIA SC |
100 % |
|
|
Shares: |
2 |
|
|
Other Links: |
25 |
|
|
No. of Active Corporate Bodies: |
|
|
|
Ratios |
2013 |
2012 |
Change |
|
|
Guarantees: |
|
|
Properties Registered: |
Company NO, Administrator NO |
|
Financing / Guarantee Sources : |
Sources YES, Guarantees YES |
|
|
|
|
INVESTIGATION
SUMMARY |
|
|
Company founded for many years now, with experience in its sector. Its
billing was increased considerably in 2013 in comparison with the previous
year. The company has a positive working capital, so it would be able to meet
the payment obligatinos in a short term. |
|
Identification
|
|
|
Social
Denomination: |
PRYSMIAN SPAIN SA |
|
NIF / Fiscal
code: |
A08395162 |
|
Corporate
Status: |
ACTIVE |
|
Start of
activity: |
1955 |
|
Registered
Office: |
CRTA. C-15, KM 2. |
|
Locality: |
VILANOVA I LA GELTRU |
|
Province: |
BARCELONA |
|
Postal Code: |
08800 |
|
Telephone: |
935 748 383 |
|
Fax: |
935 743 325 |
|
Website: |
|
|
Email: |
|
Activity
|
|
|
NACE: |
2732 |
|
Additional
Information: |
It is engaged in manufacture of low voltage (LV), medium voltage (MV),
high voltage (AT), special cables and accessories related to the world of
energy; fiber optic cables, cable systems for data transmission and image in
high voltage lines and installation services and technical advice to projects
"turnkey". Part pf GRUPO PRYSMIAN. Brands : PRYSMIAN / DRAKA.
Additional Address: CRTA. C-15, KM 2. 08800 VILANOVA I LA GELTRU ( BARCELONA
),registered office, offices, factory, storage, installations, in property. |
|
Import / export: |
IMPORTS / EXPORTS |
|
Future
Perspective: |
Consolidation |
|
Industry
situation: |
Maturity |
Chronological
Summary
|
|||
|
|
Year |
Act |
|
|
|
1990 |
Appointments/ Re-elections (1) Increase of Capital (1) |
|
|
|
1991 |
Accounts deposit (ejer. 1989) Adaptation to Law (1) Appointments/
Re-elections (8) Cessations/ Resignations/ Reversals (3) Change of Social Denomination
(1) Change of Social Purpose (1) Take-over Merger (1) |
|
|
|
1992 |
Accounts deposit (ejer. 1990, 1991) Appointments/ Re-elections (1)
Capital Reduction (1) Cessations/ Resignations/ Reversals (2) Change of Social
address (1) Increase of Capital (1) Statutory Modifications (1) Take-over
Merger (1) |
|
|
|
1993 |
Appointments/ Re-elections (3) Cessations/ Resignations/ Reversals (3)
Change of Social Denomination (1) Increase of Capital (1) Statutory Modifications
(1) Take-over Merger (1) |
|
|
|
1994 |
Accounts deposit (ejer. 1992, 1993) Appointments/ Re-elections (4)
Cessations/ Resignations/ Reversals (4) Change of Social Denomination (2) Change
of Social Purpose (1) Change of Social address (1) Increase of Capital (1)
Take-over Merger (2) |
|
|
|
1995 |
Accounts deposit (ejer. 1994) |
|
|
|
1996 |
Accounts deposit (ejer. 1995) Capital Reduction (1) |
|
|
|
1997 |
Appointments/ Re-elections (1) Board Meeting (1) Capital Reduction (1)
Cessations/ Resignations/ Reversals (1) Increase of Capital (1) Take-over
Merger (1) |
|
|
|
1998 |
Accounts deposit (ejer. 1996) Appointments/ Re-elections (4) Cessations/
Resignations/ Reversals (1) Increase of Capital (1) Statutory Modifications
(1) Take-over Merger (6) |
|
|
|
1999 |
Accounts deposit (ejer. 1997 consolidated, 1997) Appointments/
Re-elections (1) Cessations/ Resignations/ Reversals (3) |
|
|
|
2000 |
Accounts deposit (ejer. 1998, 1999) Appointments/ Re-elections (3) |
|
|
|
2001 |
Accounts deposit (ejer. 2000) Appointments/ Re-elections (2)
Cessations/ Resignations/ Reversals (1) Change of Social address (1) |
|
|
|
2002 |
Accounts deposit (ejer. 2001) Appointments/ Re-elections (2) |
|
|
|
2003 |
Accounts deposit (ejer. 2002) Appointments/ Re-elections (2) Increase
of Capital (1) |
|
|
|
2004 |
Accounts deposit (ejer. 2003) Appointments/ Re-elections (1)
Declaration of Sole Propietorship (1) Other Concepts/ Events (1) |
|
|
|
2005 |
Accounts deposit (ejer. 2004) Appointments/ Re-elections (3) Cessations/
Resignations/ Reversals (1) Company Transformation (1) Statutory
Modifications (2) |
|
|
|
2006 |
Appointments/ Re-elections (1) Cessations/ Resignations/ Reversals (1)
Increase of Capital (1) |
|
|
|
2007 |
Accounts deposit (ejer. 2005, 2006) Appointments/ Re-elections (2) |
|
|
|
2008 |
Accounts deposit (ejer. 2007) Appointments/ Re-elections (3) |
|
|
|
2009 |
Appointments/ Re-elections (3) Cessations/ Resignations/ Reversals (2)
Statutory Modifications (1) |
|
|
|
2010 |
Accounts deposit (ejer. 2008) Cessations/ Resignations/ Reversals (1) |
|
|
|
2011 |
Accounts deposit (ejer. 2009, 2010) Appointments/ Re-elections (8) Cessations/
Resignations/ Reversals (1) Statutory Modifications (1) Take-over Merger (1) |
|
|
|
2012 |
Accounts deposit (ejer. 2011) Appointments/ Re-elections (2)
Cessations/ Resignations/ Reversals (2) Company Transformation (1) Errata (1)
Statutory Modifications (2) Take-over Merger (3) |
|
|
|
2013 |
Accounts deposit (ejer. 2012) Appointments/ Re-elections (14)
Cessations/ Resignations/ Reversals (4) Change of Social Denomination (1) Change
of Social Purpose (1) Change of Social address (1) Other Concepts/ Events (1)
Statutory Modifications (1) Take-over Merger (2) |
|
|
|
2014 |
Appointments/ Re-elections (3) Cessations/ Resignations/ Reversals (1) |
|
|
|
2015 |
Accounts deposit (ejer. 2013) Appointments/ Re-elections (1) |
|
Main
Historic Changes
|
|||
|
Concept |
Publication |
Act |
Date |
|
Corporate Purpose Changes: |
COMPRA, VENTA, FABRICACION, DISTRIBUCION, COMERCIALIZACION EXPORTACION
E IMPORTACION DE CABLES Y CONDUCTORES ELECTRICOS Y TODA CLASE DE SOPORTES
PARA LA TRANSMISION DE LA CORRIENTE ELECTRICA, IMPULSOS ELECTRICOS
ELECTRONICOS |
Corporate Purpose Change |
02/12/1994 |
|
|
LA COMPRA, VENTA, FABRICACION, DISTRIBUCION, COMERCIALIZACION,
EXPORT-IMPORTACION DE CABLES CONDUCTORES ELECTRICOS ESPECIALES Y AFINES PARA
SU UTILIZACION EN EL CAMPO DE LA ELECTRONICA, TELECOMUNICACIONES Y
ELECTRICIDAD EN GENERAL. |
Corporate Purpose Change |
27/02/1991 |
Breakdown
of Owners' Equity
|
|
|
Registered
Capital: |
58.178.234,22 |
|
Paid up capital: |
58.178.234,22 |
Updated Evolution of the Subscribed and
Paid-in Capital
|
|
|
|
|
|
|
|
|
|
|
Publishing Date |
Registration Type |
Capital
Subscribed |
Paid up capital |
Underwritten
result |
Disbursed Result |
|
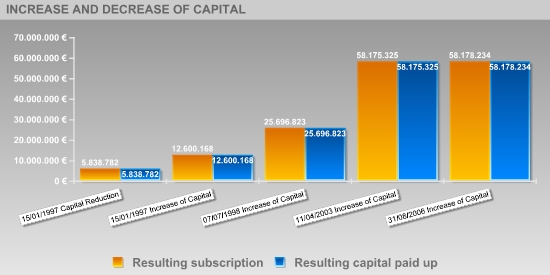
28/08/1990 |
Increase of
Capital |
5.410.311 |
5.410.311 |
5.936.197 |
5.936.197 |
|
17/07/1992 |
Capital Reduction |
-5.503.702 |
-5.503.702 |
432.494 |
432.494 |
|
17/07/1992 |
Increase of
Capital |
6.010.016 |
6.010.016 |
6.442.510 |
6.442.510 |
|
30/11/1993 |
Increase of
Capital |
4.721.159 |
4.721.159 |
11.163.669 |
11.163.669 |
|
17/11/1994 |
Increase of
Capital |
4.934.730 |
4.934.730 |
16.098.399 |
16.098.399 |
|
10/01/1996 |
Capital Reduction |
-4.860.420 |
-4.860.420 |
11.237.980 |
11.237.980 |
|
15/01/1997 |
Capital Reduction |
-5.399.198 |
-5.399.198 |
5.838.782 |
5.838.782 |
|
15/01/1997 |
Increase of
Capital |
6.761.386 |
6.761.386 |
12.600.168 |
12.600.168 |
|
07/07/1998 |
Increase of
Capital |
13.096.655 |
13.096.655 |
25.696.823 |
25.696.823 |
|
11/04/2003 |
Increase of
Capital |
32.479.002 |
32.479.002 |
58.175.325 |
58.175.325 |
|
31/08/2006 |
Increase of
Capital |
2.909 |
2.909 |
58.178.234 |
58.178.234 |
Active
Social Bodies
|
|
Post published |
Social Body's
Name |
Appointment Date |
Other Positions
in this Company |
|
SINGLE PARTNER |
DRAKA HOLDING NV
Y CIA SOCIEDAD COLECTIVA |
22/06/2004 |
1 |
|
PRESIDENT |
ACIN JOVER
FRANCESC XAVIER |
25/09/2012 |
5 |
|
MEMBER OF THE
BOARD |
TORRADEFLOT DIARS
JUAN |
13/03/2014 |
3 |
|
|
ALESSANDRO
BENUZZI |
07/06/2013 |
1 |
|
|
GIOVANNI ZANCAN |
07/06/2013 |
1 |
|
|
PIER FRANCESCO
FACCHINI |
07/06/2013 |
1 |
|
|
CALVO ROVIRA
JORDI |
07/06/2013 |
3 |
|
|
ACIN JOVER
FRANCESC XAVIER |
25/09/2012 |
5 |
|
JOINT ATTORNEY |
MACIA LOPEZ JOSEP
MARIA |
10/10/2014 |
1 |
|
|
TORNE REVERTER
LLUIS |
09/10/2013 |
2 |
|
|
PLA MARTINEZ
ERNESTO |
30/09/2013 |
2 |
|
|
NOLLA MAGRIÑA
FRANCESC |
30/09/2013 |
2 |
|
|
FERRANDIS MILLAN
MIGUEL ANGEL |
30/08/2013 |
5 |
|
|
BOSCH GUILAMANY
ANTONI |
30/08/2013 |
1 |
|
|
BATLLE FERRER
JOSEP MARIA |
30/08/2013 |
1 |
|
|
ORLANDO PENTEADO |
30/08/2013 |
1 |
|
|
JAVIER EDUARDO
ANTISTA MARCHETTI |
30/08/2013 |
1 |
|
|
PUERTAS OCHANDO
ALEJANDRO |
30/08/2013 |
1 |
|
|
CUNILLE SHAADI
FERNANDO |
05/08/2013 |
1 |
|
|
CALVO ROVIRA
JORDI |
05/08/2013 |
3 |
|
JOINT
ATTORNEY/COMBINED PROXY |
TORRADEFLOT DIARS
JUAN |
18/02/2014 |
3 |
|
PROXY |
ACIN JOVER
FRANCESC XAVIER |
01/09/2011 |
5 |
|
|
ARNAUS ARTES DE
ARCOS JOAQUIM |
16/10/2008 |
3 |
|
|
CANALS CABALLE
PEDRO |
03/08/1999 |
1 |
|
|
ARNAUS ARTES DE
ARCOS JOAQUIN |
03/08/1999 |
1 |
|
SECRETARY |
TORRADEFLOT DIARS
JUAN |
13/03/2014 |
3 |
|
ACCOUNTS' AUDITOR
/ HOLDER |
PRICEWATERHOUSECOOPERS
AUDITORES SL |
13/02/2015 |
1 |
Historical
Social Bodies
|
|
Social Body's
Name |
Post published |
End Date |
Other Positions
in this Company |
|
ACIN JOVER
FRANCESC XAVIER |
MEMBER OF THE
BOARD |
25/09/2012 |
5 |
|
|
PRESIDENT |
25/09/2012 |
|
|
ALOS CARRERA
RAMON |
MEMBER OF THE
BOARD |
26/06/1992 |
1 |
|
ALOS CARRERA
RAMOS |
SINGLE
ADMINISTRATOR |
22/01/1991 |
1 |
|
ALOS VIDAL ELENA |
MEMBER OF THE
BOARD |
26/06/1992 |
1 |
|
ALOS VIDAL RAMON |
PROXY |
30/01/1991 |
3 |
|
|
PRESIDENT |
24/12/1991 |
|
|
|
MEMBER OF THE
BOARD |
26/06/1992 |
|
|
ALOS Y CARRERA
RAMON |
SINGLE
ADMINISTRATOR |
22/01/1991 |
1 |
|
ARNAUS ARTES DE
ARCOS JOAQUIM |
JOINT
ADMINISTRATOR |
09/12/2005 |
3 |
|
|
JOINT ADMINISTRATOR |
09/11/2011 |
|
|
ARTES DE ARCOS
JOAQUIM ARNAUS |
PROXY |
09/11/2011 |
1 |
|
AVILES LOPEZ
PEDRO |
PROXY |
05/08/2013 |
1 |
|
BALAÑA DE EGUIA
JOSE MARIA |
NON CONSELLOR
SECRETARY |
22/06/1998 |
1 |
|
BATLLE FERRER
JOSE MARIA |
PROXY |
05/08/2013 |
1 |
|
BENNY OLSSON |
MEMBER OF THE
BOARD |
10/12/1993 |
3 |
|
|
CHIEF EXECUTIVE
OFFICER |
10/12/1993 |
|
|
|
VICE CHAIRMAN |
10/12/1993 |
|
|
BOTNEVIK FRODE |
MEMBER OF THE
BOARD |
13/10/1993 |
1 |
|
BROR ADOLF FREDRIK
CRONEBORG |
PROXY |
24/03/1993 |
2 |
|
|
PROXY |
08/02/1994 |
|
|
CABELLO MONJE
ANTONIO |
PROXY |
02/06/2010 |
1 |
|
CALVO ROVIRA
JORDI |
PROXY |
05/08/2013 |
3 |
|
CAMPANO DE RIVAS
MIGUEL |
PROXY |
25/01/1994 |
1 |
|
CANALS CABALLE PERE |
JOINT
ADMINISTRATOR |
09/11/2011 |
3 |
|
|
PROXY |
09/11/2011 |
|
|
|
JOINT
ADMINISTRATOR |
09/12/2005 |
|
|
COIRA SANCHEZ DE
TOCA JAIME |
PROXY |
25/01/1994 |
1 |
|
COOPERS AND
LYBRAND SA |
ACCOUNTS' AUDITOR
/ HOLDER |
26/02/1992 |
1 |
|
CRONEBORG ADOLF
FEDRIK |
CHIEF EXECUTIVE
OFFICER |
09/11/2011 |
1 |
|
CURTO CAPDEVILA
ENRIC |
PROXY |
26/08/2009 |
1 |
|
DELOITTE SL |
ACCOUNTS' AUDITOR
/ HOLDER |
07/10/2011 |
1 |
|
DEVOLD JOAKIM |
MEMBER OF THE
BOARD |
13/10/1993 |
1 |
|
DOMINGO PAGES
CARLOS |
MEMBER OF THE
BOARD |
10/12/1993 |
3 |
|
|
CHIEF EXECUTIVE
OFFICER |
10/12/1993 |
|
|
|
PRESIDENT |
10/12/1993 |
|
|
DRAKA CABLES SA |
ADMINISTRATOR |
22/06/1998 |
1 |
|
DRAKA EUROSUD SA |
SINGLE
ADMINISTRATOR |
19/04/2005 |
1 |
|
ERNST AND YOUNG
SA |
ACCOUNTS' AUDITOR
/ HOLDER |
23/03/1994 |
1 |
|
FALCO ALTET
ANTONI |
REPRESENTATIVE |
19/04/2005 |
1 |
|
FERNANDEZ PUGA
JOSE BENIGNO |
PROXY |
17/05/2001 |
1 |
|
FERNANDEZ PUGA
MARIA CONCEPCION |
PROXY |
18/05/2006 |
2 |
|
|
PROXY |
04/09/2009 |
|
|
FERRAN FONTS JOAN |
PROXY |
05/08/2013 |
1 |
|
FERRANDIS MILLAN
MIGUEL ANGEL |
PROXY |
03/08/1999 |
5 |
|
|
PROXY |
10/09/1999 |
|
|
|
PROXY |
05/08/2013 |
|
|
|
PROXY |
30/01/1991 |
|
|
FREDERIC GROSSE |
MEMBER OF THE
BOARD |
23/12/2013 |
2 |
|
|
MEMBER OF THE
BOARD |
25/09/2012 |
|
|
GARCIA PEREZ
MARIA FE |
PROXY |
09/11/2011 |
1 |
|
GARCIA Y GARCIA
JOSE MARIA |
PROXY |
30/01/1991 |
1 |
|
GONZALEZ MENENDEZ
ANTONIO |
PROXY |
10/09/1999 |
1 |
|
GONZALEZ SIEIRO
MARCOS |
PROXY |
18/05/2006 |
1 |
|
GUERRERO DE
CASTRO ANGEL |
MEMBER OF THE
BOARD |
11/06/1997 |
2 |
|
|
CHIEF EXECUTIVE
OFFICER |
11/06/1997 |
|
|
GUIL GARCIA
DOMINGO |
PROXY |
30/01/1991 |
1 |
|
GUIL GARCIA
DOMINGO BERNABE |
PROXY |
24/03/1993 |
1 |
|
GUNNAR LARSON |
MEMBER OF THE
BOARD |
10/12/1993 |
3 |
|
|
CHIEF EXECUTIVE
OFFICER |
10/12/1993 |
|
|
|
VICE CHAIRMAN |
10/12/1993 |
|
|
HENDRIK LEONARDUS
GORISSEN |
MEMBER OF THE
BOARD |
22/06/1998 |
2 |
|
|
PRESIDENT |
22/06/1998 |
|
|
HOLTE TORE EGIL |
MEMBER OF THE
BOARD |
10/12/1993 |
3 |
|
|
VICE CHAIRMAN |
13/10/1993 |
|
|
|
MEMBER OF THE
BOARD |
30/01/1991 |
|
|
JAOUAD BEN HAMMAN
AN NASERI |
PROXY |
05/08/2013 |
1 |
|
KPMG AUDITORES SL |
ACCOUNTS' AUDITOR
/ HOLDER |
28/05/2001 |
10 |
|
|
ACCOUNTS' AUDITOR
/ HOLDER |
28/01/2002 |
|
|
|
ACCOUNTS' AUDITOR
/ HOLDER |
30/10/2002 |
|
|
|
ACCOUNTS' AUDITOR
/ HOLDER |
12/01/2007 |
|
|
|
ACCOUNTS' AUDITOR
/ HOLDER |
07/01/2008 |
|
|
|
ACCOUNTS' AUDITOR
/ HOLDER |
05/11/2008 |
|
|
|
ACCOUNTS' AUDITOR
/ HOLDER |
28/10/2005 |
|
|
|
ACCOUNTS' AUDITOR
/ HOLDER |
04/01/2000 |
|
|
|
ACCOUNTS' AUDITOR
/ HOLDER |
11/11/2003 |
|
|
|
ACCOUNTS' AUDITOR
/ HOLDER |
14/10/2004 |
|
|
KPMG PEAT MARWICK
SA Y CIA AUDITORES SRC |
ACCOUNTS' AUDITOR
/ HOLDER |
22/06/1998 |
3 |
|
|
ACCOUNTS' AUDITOR
/ HOLDER |
07/07/1998 |
|
|
|
ACCOUNTS' AUDITOR
/ HOLDER |
04/01/2000 |
|
|
LAPLANA ARASANZ
JUAN LUIS |
PROXY |
05/08/2013 |
1 |
|
LENCINA SOLANAS
JOAQUIN |
PROXY |
03/08/1999 |
3 |
|
|
PROXY |
05/10/2012 |
|
|
|
PROXY |
10/09/1999 |
|
|
LOPEZ MUÑOZ
CARLOS |
PROXY |
05/10/2012 |
1 |
|
LORENZO LOPEZ
JOSE CARLOS |
PROXY |
04/09/2009 |
1 |
|
MALUQUER TREPAT
LUIS |
MEMBER OF THE
BOARD |
26/06/1992 |
1 |
|
MARTIN MARTIN
MANUEL JOSE |
NON CONSELLOR
SECRETARY |
13/10/1993 |
1 |
|
MENAC BELLOSTA
RAMON |
PROXY |
09/11/2011 |
1 |
|
MOLINARI MIGUEZ
PEDRO FELIX |
PROXY |
14/01/1999 |
1 |
|
MONTES HEREDIA
JOSE |
MEMBER OF THE
BOARD |
10/12/1993 |
2 |
|
|
CHIEF EXECUTIVE
OFFICER |
10/12/1993 |
|
|
MORA ALCANTARA
SANTIAGO |
PROXY |
10/09/1999 |
1 |
|
MORALES LITRAN
ANTONIO |
NON CONSELLOR
SECRETARY |
02/02/1994 |
1 |
|
NOLLA MAGRIÑA
FRANCESC |
PROXY |
30/09/2013 |
2 |
|
NUSTAD HAVARD
ANTON |
PROXY |
25/01/1994 |
1 |
|
PARADINAS
HERNANDEZ JOSE LUIS |
NON CONSELLOR
ASSISTANT SECRETARY |
02/02/1994 |
1 |
|
PIEDRA BERNARDEZ
ESTEBAN |
PROXY |
04/09/2009 |
1 |
|
PIJOAN NAVARRO JAIME |
PROXY |
10/09/1999 |
1 |
|
PIJOAN NAVARRO
JAUME |
PROXY |
09/11/2011 |
1 |
|
PLA MARTINEZ
ERNESTO |
PROXY |
05/08/2013 |
2 |
|
PRICE WATERHOUSE
COOPERS AUDITORES SL |
ACCOUNTS' AUDITOR
/ HOLDER |
13/02/2015 |
1 |
|
ROREN NILS OLE |
MEMBER OF THE
BOARD |
13/10/1993 |
1 |
|
SACHARIAS
JOHANNES VAN KESTEREN |
VICE CHAIRMAN |
20/03/2003 |
3 |
|
|
MEMBER OF THE
BOARD |
22/06/1998 |
|
|
|
VICE CHAIRMAN |
22/06/1998 |
|
|
SIDNEY PERERA |
MEMBER OF THE
BOARD |
22/06/1998 |
2 |
|
|
CHIEF EXECUTIVE
OFFICER |
22/06/1998 |
|
|
SOLANO HERNANDEZ
DONATO |
MEMBER OF THE
BOARD |
26/06/1992 |
1 |
|
SOLANO Y
HERNANDEZ DONATO |
PROXY |
30/01/1991 |
1 |
|
STEN JACOBSSON |
MEMBER OF THE
BOARD |
10/12/1993 |
2 |
|
|
CHIEF EXECUTIVE
OFFICER |
10/12/1993 |
|
|
TORE HEGIL HOLTE |
CHIEF EXECUTIVE
OFFICER |
10/12/1993 |
1 |
|
TORNE REVERTER
LLUIS |
PROXY |
09/10/2013 |
2 |
|
TRALLERO VILAR
ANTONIO |
PROXY |
11/06/1997 |
2 |
|
|
PROXY |
10/09/1999 |
|
|
VAZQUEZ MONTERO EVARISTO |
PROXY |
18/05/2006 |
1 |
|
VILA SOLVES
ELADIO |
PROXY |
10/09/1999 |
1 |
|
ZORRAQUINO
ASUNSOLO JAVIER |
MEMBER OF THE
BOARD |
25/09/2012 |
6 |
|
|
SECRETARY |
25/09/2012 |
|
|
|
PROXY |
05/08/2013 |
|
|
|
JOINT ATTORNEY |
13/03/2014 |
|
|
|
SECRETARY |
13/03/2014 |
|
|
|
MEMBER OF THE
BOARD |
13/03/2014 |
|
Defaults,
Legal Claims and Insolvency Proceedings
|
Section enabling
assessment of the degree of compliance of the company queried with its payment obligations.
It provides information on the existence and nature of all stages of Insolvency
and Legal Proceedings published with reference to the Company in the country's
various Official Bulletins and national newspapers, as well Defaults Registered
in the main national credit bureaus (ASNEF Industrial and RAI ).
> Summary
Chronological
summary
|
|
|
Number of
Publications |
Amount (_) |
Start date |
End date |
|
Insolvency
Proceedings, Bankruptcy and Suspension of Payments |
|
Unpublished |
--- |
--- |
--- |
|
Request/Declaration |
|
0 |
--- |
date |
|
|
Proceedings |
|
--- |
--- |
|
--- |
|
Resolution |
|
--- |
--- |
|
--- |
|
Defaults on debt
with Financial Institutions and Large Companies |
Bank and Commercial
Delinquency |
2 |
0 |
27/11/2013 |
25/02/2015 |
|
Status: Friendly |
|
2 |
3197.43 |
27/11/2013 |
27/11/2013 |
|
Status:
Pre-Litigation |
|
--- |
|
|
|
|
Status:
Litigation |
|
--- |
|
|
|
|
Status:
Non-performing |
|
--- |
|
|
|
|
Status:
insolvency proceedings, bankruptcy and suspension of payments |
|
--- |
|
|
|
|
Other status |
|
--- |
|
|
|
|
Legal and
Administrative Proceedings |
|
Unpublished |
--- |
|
|
|
Notices of
defaults and enforcement |
|
--- |
--- |
|
--- |
|
Seizures |
|
--- |
--- |
|
--- |
|
Auctions |
|
--- |
--- |
|
--- |
|
Declarations of
insolvency and bad debt |
|
--- |
--- |
|
--- |
|
Proceedings heard
by the Civil Court |
|
Unpublished |
--- |
|
|
|
Proceedings heard
by the Labour Court |
|
Unpublished |
--- |
|
|
> Details
IMPAGOS EN
ENTIDADES FINANCIERAS Y GRANDES EMPRESAS
Section comprising a
list of the instances of default recorded in the ASNEF Industrial file under
the name of .
List of
current instances of default for each of the transactions in progress
|
Type of creditor |
Product |
Value of
transactions (_) |
Status |
No. of defaults |
Default balance
(_) |
Date of first
default |
Date of last
default |
|
INDUSTRIA |
Otros |
3188.35 |
Amistoso |
--- |
3197.43 |
27/11/13 |
27/11/13 |
|
ENTIDADES
FINANCIERAS DE MARCA |
Leasing, factoring,
renting, confirming |
--- |
Amistoso |
--- |
.00 |
|
|
|
|
|
3.197,43 |
|
|
|
||
Legal Notice
This data has been
obtained from consultation of the ASNEF Industrial register. It may only be used
for the purposes of awarding credit, monitoring credit and managing loans. This
data may not be reused or included in any database, and may not be ceded
> Basis for
scoring
|
Positive Factors |
Adverse Factors |
|
It is one of the major
domestic companies in terms of sales volume. Significant level
of financial autonomy. The asset is financed mostly with equity and financing
with maturity exceeding one year, providing a solid financial structure. PRYSMIAN SPAIN SA
's borrowing cost is appropriate according to its volume of external
financing sources. The development
of the structure of the debt during the last two years indicates a decrease
of the debt with credit institutions and trade creditors in respect to all liabilities.
The lower the level of debt, the lower the dependence on suppliers capital
and the more guarantee will have its financial situation. Positive Working
CapitalThe Company's Working Capital quality is significant, i.e. much of the
Company financing comes from its equity. A structure is considered optimal if
its liquidity level is slightly above its debt volume as a result of low
idleness levels of its financial resources involved. |
It has been found
to have irregular payment performance at the credit bureaus, although it is
not relevant enough to change the rating. It has no return
from its main operating activity.This might deteriorate its financial
situation. Moreover, this productivity has decreased in comparison with the
previous financial year. It presents an
inefficient resources management. Resources and variable costs management
associated with the activity itself are not productive, since operating
expenses exceed income. Reduced level of
liquidity. The company shows not enough capacity to meet its obligations with
a maturity of less than one year with the available liquid assets. Solvency
decrease. Its capacity to bear the cost derived form debts incurred with
third parties has decreased significantly in its last fiscal year. |
Probability of default
|
> Estimated
Probability of Default for the next 12 months: 1.551 %
|
Sector in which
comparison is carried out: 273 Manufacture
of wiring and wiring devices |
|
|
Relative
Position:
|

The company's
comparative analysis with the rest of the companies that comprise the sector,
shows the company holds a better position with regard to the probability of
non-compliance.
The 76.00% of the
companies of the sector PRYSMIAN SPAIN SA belongs to show a higher probability
of non-compliance.
The probability of
the company's non-compliance with its payment obligations within deadlines
estimated by our qualifications models is 1.551%.
In the event they
fail to comply with the payment, the seriousness of the loss will depend on
factors such as the promptness of the commencement of the charging management,
the existence of executive documents which match the credit or the existence of
guarantees and free debt assets under the name of the debtor. Therefore, the
probability of non-compliance should not be solely interpreted as the total
loss of the owed amount.
LEGAL
CLAIMS
|
|
Summary of
Judicial Claims |
|
|
|
|
|
|
|
|
||
|
|
|
No se han
publicado |
|
|
|
|
No se han
publicado |
|
|
|
|
||
|
|
|
No se han
publicado |
|
|
|
|
No se han
publicado |
|
|
|
|
No se han
publicado |
|
|
|
|
No se han
publicado |
|
|
|
|
||
|
|
|
No se han
publicado |
|
|
|
|
No se han
publicado |
|
|
|
|
||
|
|
|
No se han
publicado |
|
Link
List
|
|
ABSORBS TO: |
7 Entities |
|
IS RELATED
WITH: |
18 Entities |
|
PARTICIPATES
IN: |
2 Entities |
|
SHAREHOLDERS: |
1 Entities |
> Shareholders
|
Relationship |
Entity |
Province |
Shareholding
stake |
|
SHAREHOLDERS |
DRAKA HOLDING NV
Y CIA SC |
BARCELONA |
100 |
|
PARTICIPATES IN |
CRECIENTE SA |
PONTEVEDRA |
100 |
|
|
CONDUCTORES
ELECTRICOS DE GALICIA SA |
PONTEVEDRA |
49.75 |
> Other
relationships
|
Relationship |
Entity |
Province |
Shareholding
stake |
|
IS RELATED WITH |
| | |
|
|
|
|
DRAKA CABLETEQ
USA |
|
|
|
|
PRYSMIAN METALS
UK |
|
|
|
|
PRYSMIAN CABLES Y
SISTEMAS SA |
BARCELONA |
|
|
|
DRAKA COMTEQ
TELECOM BV |
|
|
|
|
DRAKA KABEL BV |
|
|
|
|
DRAKA PARICABLE
SAS |
|
|
|
|
DRAKA TRANSPORT
USA LLC |
|
|
|
|
DRAKA TREASURY BV |
|
|
|
|
PRYSMIAN CABLES
ET SYSTEMES |
|
|
|
|
ARGENTINA
PRYSMIAN ENER CYS |
|
|
|
|
PRYSMIAN KABEL
& SYSTEME, S.A. |
|
|
|
|
PRYSMIAN METALS,
S.A. |
|
|
|
|
PRYSMIAN SPA
(ITALIA) |
|
|
|
|
DB LIFT DRAKA ELEVATOR
PRODUCTS, S.L. |
|
|
|
|
DRAKA CABLE
WUPPERTAL, S.A. |
|
|
|
|
DRAKA CABLETEQ
USA INC |
|
|
|
|
DRAKA COMTEQ
FIBRE BV |
|
|
|
IS RELATED WITH |
PRYSMIAN CABLES Y
SISTEMAS SA |
BARCELONA |
|
|
ABSORBS TO |
CONDUCTORES ELECTRICOS
DE GALICIA, S.A. |
PONTEVEDRA |
|
|
|
CRECIENTE, S.A. |
PONTEVEDRA |
|
|
|
DRAKA COMTEQ
SPAIN SL |
BARCELONA |
|
|
|
DRAKA ELEVATOR
PRODUCTS SPAIN SL |
MADRID |
|
|
|
DRAKA INDUSTRY
& SPECIALTY S.L |
NAVARRA |
|
|
|
PRYSMIAN CABLES Y
SISTEMAS SA |
BARCELONA |
|
|
|
FERCABLE SL |
BARCELONA |
|
Turnover
|
|
|
Total Sales 2014 |
295.000.000 |
Financial
Accounts and Balance Sheets
|
Financial Years Presented
|
Ejercicio |
Tipo de Cuentas
Anuales |
Fecha Presentacion |
|
2013 |
Normales |
January
2015 |
|
2012 |
Normales |
February
2013 |
|
2011 |
Normales |
June 2012 |
|
2010 |
Normales |
October
2011 |
|
2009 |
Normales |
May 2011 |
|
2008 |
Normales |
January
2010 |
|
2007 |
Normales |
November
2008 |
|
2006 |
Normales |
October
2007 |
|
2005 |
Normales |
December
2006 |
|
2004 |
Normales |
October
2005 |
|
2003 |
Normales |
October
2004 |
|
2002 |
Normales |
October
2003 |
|
2001 |
Normales |
September
2002 |
|
2000 |
Normales |
September
2001 |
|
1999 |
Normales |
September
2000 |
|
1998 |
Normales |
January
2000 |
|
1997 |
Consolidadas |
January
1999 |
|
1997 |
Normales |
January
1999 |
|
1996 |
Normales |
June 1998 |
|
1995 |
Normales |
November
1996 |
|
1994 |
Normales |
September
1995 |
|
1993 |
Normales |
October
1994 |
|
1992 |
Normales |
January
1994 |
|
1991 |
Normales |
July 1992 |
|
1990 |
Normales |
June 1992 |
|
1989 |
Normales |
October
1990 |
The data in the report regarding the last
Company Accounts submitted by the company is taken from the TRADE REGISTER
serving the region in which the company's address is located 31/12/2013
> Balance
en formato Normal de acuerdo al Nuevo Plan General Contable 2007
Information corresponding to the fiscal year
2013 2012 2011 2010 2009 is taken from information
submitted to the TRADE REGISTER. Data corresponding to fiscal years before
2013 2012 2011 2010 2009 has been compiled based on
the equivalence criteria stipulated in Act JUS/206/2009. To view details on the
methodology.
|
|
ORIGINAL |
ORIGINAL |
ORIGINAL |
ORIGINAL |
ORIGINAL |
|
|
Assets |
2013 |
2012 |
2011 |
2010 |
2009 |
|
|
A) NON-CURRENT
ASSETS: 11000 |
165.185.000,00 |
111.512.000,00 |
133.456.000,00 |
136.211.490,00 |
139.452.000,00 |
|
|
I. Intangible fixed assets : 11100 |
283.000,00 |
168.000,00 |
213.000,00 |
272.490,00 |
80.000,00 |
|
|
1. Development: 11110 |
176.000,00 |
0,00 |
195.000,00 |
244.110,00 |
0,00 |
|
|
2. Concessions: 11120 |
98.000,00 |
146.000,00 |
0,00 |
0,00 |
0,00 |
|
|
3. Patents, licencing, trade marks and similar:
11130 |
0,00 |
0,00 |
0,00 |
0,00 |
0,00 |
|
|
4. Goodwill: 11140 |
0,00 |
0,00 |
0,00 |
0,00 |
0,00 |
|
|
5. IT applications: 11150 |
9.000,00 |
22.000,00 |
18.000,00 |
28.380,00 |
80.000,00 |
|
|
6. Investigation: 11160 |
0,00 |
0,00 |
0,00 |
0,00 |
0,00 |
|
|
7. Intellectual property: 11180 |
0,00 |
0,00 |
0,00 |
0,00 |
0,00 |
|
|
8. Greenhouse gas emission allowance: 11190 |
0,00 |
0,00 |
0,00 |
0,00 |
0,00 |
|
|
9. Other intangible fixed assets. : 11170 |
0,00 |
0,00 |
0,00 |
0,00 |
0,00 |
|
|
II. Tangible fixed assets : 11200 |
58.851.000,00 |
14.310.000,00 |
13.859.000,00 |
16.104.450,00 |
19.158.000,00 |
|
|
1. Land and buildings: 11210 |
40.451.000,00 |
4.738.000,00 |
5.191.000,00 |
5.641.880,00 |
6.093.000,00 |
|
|
2. Technical installations and other tangible
fixed assets: 11220 |
16.231.000,00 |
9.572.000,00 |
8.668.000,00 |
10.462.570,00 |
13.065.000,00 |
|
|
3. Tangible asset in progress and advances:
11230 |
2.169.000,00 |
0,00 |
0,00 |
0,00 |
0,00 |
|
|
III. Real estate investment: 11300 |
3.134.000,00 |
0,00 |
0,00 |
0,00 |
0,00 |
|
|
1. Land: 11310 |
3.042.000,00 |
0,00 |
0,00 |
0,00 |
0,00 |
|
|
2. Buildings: 11320 |
92.000,00 |
0,00 |
0,00 |
0,00 |
0,00 |
|
|
IV. Long-term investments in Group companies and associates :
11400 |
89.119.000,00 |
89.119.000,00 |
111.001.000,00 |
110.999.450,00 |
110.999.000,00 |
|
|
1. Equity instruments: 11410 |
0,00 |
0,00 |
0,00 |
0,00 |
0,00 |
|
|
2. Credits to businesses: 11420 |
89.119.000,00 |
89.119.000,00 |
111.001.000,00 |
110.999.450,00 |
110.999.000,00 |
|
|
3. Debt securities: 11430 |
0,00 |
0,00 |
0,00 |
0,00 |
0,00 |
|
|
4. Derivatives : 11440 |
0,00 |
0,00 |
0,00 |
0,00 |
0,00 |
|
|
5. Other financial assets : 11450 |
0,00 |
0,00 |
0,00 |
0,00 |
0,00 |
|
|
6. Other investments: 11460 |
0,00 |
0,00 |
0,00 |
0,00 |
0,00 |
|
|
V. Long-term financial investments: 11500 |
7.425.000,00 |
7.773.000,00 |
8.137.000,00 |
8.529.990,00 |
8.908.000,00 |
|
|
1. Equity instruments: 11510 |
0,00 |
0,00 |
12.000,00 |
11.510,00 |
12.000,00 |
|
|
2. Credits to third parties : 11520 |
4.561.000,00 |
4.992.000,00 |
5.404.000,00 |
5.797.830,00 |
6.174.000,00 |
|
|
3. Debt securities: 11530 |
0,00 |
0,00 |
0,00 |
0,00 |
0,00 |
|
|
4. Derivatives : 11540 |
0,00 |
0,00 |
0,00 |
0,00 |
0,00 |
|
|
5. Other financial assets : 11550 |
2.864.000,00 |
2.781.000,00 |
2.721.000,00 |
2.720.650,00 |
2.722.000,00 |
|
|
6. Other investments: 11560 |
0,00 |
0,00 |
0,00 |
0,00 |
0,00 |
|
|
VI. Assets for deferred tax : 11600 |
6.373.000,00 |
142.000,00 |
246.000,00 |
305.110,00 |
307.000,00 |
|
|
VII. Non-current trade debts : 11700 |
0,00 |
0,00 |
0,00 |
0,00 |
0,00 |
|
|
B) CURRENT
ASSETS: 12000 |
111.339.000,00 |
67.438.000,00 |
113.831.000,00 |
118.672.900,00 |
108.752.000,00 |
|
|
I. Non-current assets held for sale : 12100 |
0,00 |
0,00 |
0,00 |
0,00 |
13.000,00 |
|
|
II. Stocks: 12200 |
36.619.000,00 |
103.000,00 |
11.351.000,00 |
16.162.570,00 |
14.531.000,00 |
|
|
1. Commercial: 12210 |
1.281.000,00 |
103.000,00 |
0,00 |
0,00 |
0,00 |
|
|
2. Primary material and other supplies:
12220 |
12.684.000,00 |
0,00 |
4.600.000,00 |
5.393.440,00 |
3.850.000,00 |
|
|
3. Work in progress: 12230 |
7.619.000,00 |
0,00 |
603.000,00 |
601.730,00 |
712.000,00 |
|
|
a) Of long-term production
cycle : 12231 |
0,00 |
0,00 |
0,00 |
0,00 |
0,00 |
|
|
b) Of short-term production cycle
: 12232 |
7.619.000,00 |
0,00 |
0,00 |
601.730,00 |
712.000,00 |
|
|
4. Finished goods: 12240 |
15.035.000,00 |
0,00 |
6.148.000,00 |
10.167.400,00 |
9.969.000,00 |
|
|
a) Of long-term production cycle
: 12241 |
0,00 |
0,00 |
0,00 |
0,00 |
0,00 |
|
|
b) Of short-term production
cycle : 12242 |
15.035.000,00 |
0,00 |
0,00 |
10.167.400,00 |
9.969.000,00 |
|
|
5. By-products, residues and recycled materials:
12250 |
0,00 |
0,00 |
0,00 |
0,00 |
0,00 |
|
|
6. Advances to suppliers: 12260 |
0,00 |
0,00 |
0,00 |
0,00 |
0,00 |
|
|
III. Trade debtors and others receivable accounts: 12300 |
68.046.000,00 |
4.129.000,00 |
70.751.000,00 |
74.530.740,00 |
64.570.000,00 |
|
|
1. Trade debtors / accounts receivable:
12310 |
56.561.000,00 |
994.000,00 |
9.575.000,00 |
21.797.780,00 |
12.990.000,00 |
|
|
a) Long-term receivables from
sales and services supplied : 12311 |
0,00 |
0,00 |
0,00 |
0,00 |
0,00 |
|
|
b) Customers for sales and
provisions of services : 12312 |
56.561.000,00 |
994.000,00 |
0,00 |
21.797.780,00 |
12.990.000,00 |
|
|
2. Customers, Group companies and associates :
12320 |
11.059.000,00 |
2.494.000,00 |
60.906.000,00 |
52.647.920,00 |
51.471.000,00 |
|
|
3. Other accounts receivable: 12330 |
27.000,00 |
9.000,00 |
0,00 |
0,00 |
0,00 |
|
|
4. Personnel: 12340 |
399.000,00 |
0,00 |
0,00 |
1.580,00 |
0,00 |
|
|
5. Assets for deferred tax: 12350 |
0,00 |
130.000,00 |
270.000,00 |
83.460,00 |
109.000,00 |
|
|
6. Other debtors, including tax and social
security: 12360 |
0,00 |
502.000,00 |
0,00 |
0,00 |
0,00 |
|
|
7. Called up share capital: 12370 |
0,00 |
0,00 |
0,00 |
0,00 |
0,00 |
|
|
IV. Short-term investments in Group companies and associates:
12400 |
2.328.000,00 |
62.289.000,00 |
1.879.000,00 |
1.502.190,00 |
1.006.000,00 |
|
|
1. Equity instruments: 12410 |
0,00 |
0,00 |
0,00 |
0,00 |
0,00 |
|
|
2. Credits to businesses: 12420 |
2.328.000,00 |
62.289.000,00 |
1.879.000,00 |
0,00 |
0,00 |
|
|
3. Debt securities: 12430 |
0,00 |
0,00 |
0,00 |
1.502.190,00 |
1.006.000,00 |
|
|
4. Derivatives : 12440 |
0,00 |
0,00 |
0,00 |
0,00 |
0,00 |
|
|
5. Other financial assets : 12450 |
0,00 |
0,00 |
0,00 |
0,00 |
0,00 |
|
|
6. Other investments: 12460 |
0,00 |
0,00 |
0,00 |
0,00 |
0,00 |
|
|
V. Short-term financial investments : 12500 |
2.431.000,00 |
412.000,00 |
394.000,00 |
376.590,00 |
360.000,00 |
|
|
1. Equity instruments: 12510 |
0,00 |
0,00 |
0,00 |
0,00 |
0,00 |
|
|
2. Credits to businesses: 12520 |
431.000,00 |
412.000,00 |
0,00 |
0,00 |
0,00 |
|
|
3. Debt securities: 12530 |
0,00 |
0,00 |
0,00 |
0,00 |
0,00 |
|
|
4. Derivatives : 12540 |
0,00 |
0,00 |
0,00 |
0,00 |
0,00 |
|
|
5. Other financial assets : 12550 |
0,00 |
0,00 |
394.000,00 |
376.590,00 |
360.000,00 |
|
|
6. Other investments: 12560 |
2.000.000,00 |
0,00 |
0,00 |
0,00 |
0,00 |
|
|
VI. Short-term accruals: 12600 |
90.000,00 |
83.000,00 |
11.000,00 |
12.390,00 |
26.000,00 |
|
|
VII. Cash and other equivalent liquid assets : 12700 |
1.825.000,00 |
422.000,00 |
29.445.000,00 |
26.088.420,00 |
28.246.000,00 |
|
|
1. Treasury: 12710 |
1.825.000,00 |
422.000,00 |
29.445.000,00 |
26.088.420,00 |
28.246.000,00 |
|
|
2. Other equivalent liquid assets: 12720 |
0,00 |
0,00 |
0,00 |
0,00 |
0,00 |
|
|
TOTAL ASSETS (A +
B) : 10000 |
276.524.000,00 |
178.950.000,00 |
247.287.000,00 |
254.884.390,00 |
248.204.000,00 |
|
|
|
ORIGINAL |
ORIGINAL |
ORIGINAL |
ORIGINAL |
ORIGINAL |
|
|
Liabilities and
Net Worth |
2013 |
2012 |
2011 |
2010 |
2009 |
|
|
A) NET WORTH:
20000 |
128.801.000,00 |
159.183.000,00 |
163.725.000,00 |
166.721.690,00 |
167.979.000,00 |
|
|
A-1) Shareholders' equity: 21000 |
128.566.000,00 |
159.180.000,00 |
163.725.000,00 |
166.721.690,00 |
167.979.000,00 |
|
|
I. Capital: 21100 |
58.178.000,00 |
58.178.000,00 |
58.178.000,00 |
58.178.230,00 |
58.178.000,00 |
|
|
1. Registered capital : 21110 |
58.178.000,00 |
58.178.000,00 |
58.178.000,00 |
58.178.230,00 |
58.178.000,00 |
|
|
2. (Uncalled capital): 21120 |
0,00 |
0,00 |
0,00 |
0,00 |
0,00 |
|
|
II. Share premium: 21200 |
22.610.000,00 |
0,00 |
74.701.000,00 |
74.701.370,00 |
75.701.000,00 |
|
|
III. Reserves: 21300 |
73.325.000,00 |
105.746.000,00 |
38.433.000,00 |
37.067.280,00 |
37.067.000,00 |
|
|
1. Legal y estatutarias: 21310 |
7.614.000,00 |
4.613.000,00 |
4.613.000,00 |
4.612.920,00 |
4.613.000,00 |
|
|
2. Other reserves: 21320 |
65.711.000,00 |
101.133.000,00 |
33.820.000,00 |
32.454.360,00 |
32.454.000,00 |
|
|
3. Revaluation reserves: 21330 |
0,00 |
0,00 |
0,00 |
0,00 |
0,00 |
|
|
IV. (Common stock equity): 21400 |
0,00 |
0,00 |
0,00 |
0,00 |
0,00 |
|
|
V. Results from previous periods: 21500 |
-4.744.000,00 |
-711.000,00 |
-3.225.000,00 |
-2.966.810,00 |
-976.000,00 |
|
|
1. Brought forward: 21510 |
0,00 |
0,00 |
0,00 |
0,00 |
0,00 |
|
|
2. (Negative results from previous periods):
21520 |
-4.744.000,00 |
-711.000,00 |
-3.225.000,00 |
-2.966.810,00 |
-976.000,00 |
|
|
VI. Other shareholders' contributions: 21600 |
0,00 |
0,00 |
0,00 |
0,00 |
0,00 |
|
|
VII. Result of the period: 21700 |
-20.803.000,00 |
-4.033.000,00 |
-4.362.000,00 |
-258.380,00 |
-1.991.000,00 |
|
|
VIII. (Interim dividend): 21800 |
0,00 |
0,00 |
0,00 |
0,00 |
0,00 |
|
|
IX. Other net worth instruments: 21900 |
0,00 |
0,00 |
0,00 |
0,00 |
0,00 |
|
|
A-2) Adjustments due to changes in value: 22000 |
235.000,00 |
0,00 |
0,00 |
0,00 |
0,00 |
|
|
I. Financial assets held for sale: 22100 |
0,00 |
0,00 |
0,00 |
0,00 |
0,00 |
|
|
II. Hedge operations: 22200 |
0,00 |
0,00 |
0,00 |
0,00 |
0,00 |
|
|
III. Linked non-current assets and liabilities held for sale :
22300 |
0,00 |
0,00 |
0,00 |
0,00 |
0,00 |
|
|
IV. Exchange rate difference: 22400 |
235.000,00 |
0,00 |
0,00 |
0,00 |
0,00 |
|
|
V. Other: 22500 |
0,00 |
0,00 |
0,00 |
0,00 |
0,00 |
|
|
A-3) Received subsidies, donations and legacies: 23000 |
0,00 |
3.000,00 |
0,00 |
0,00 |
0,00 |
|
|
B) NON-CURRENT
LIABILITIES: 31000 |
41.412.000,00 |
7.801.000,00 |
8.425.000,00 |
8.885.590,00 |
9.129.000,00 |
|
|
I. Long-term provisions: 31100 |
691.000,00 |
53.000,00 |
0,00 |
0,00 |
0,00 |
|
|
1. Long-term employee benefits liability:
31110 |
691.000,00 |
53.000,00 |
0,00 |
0,00 |
0,00 |
|
|
2. Environmental actions: 31120 |
0,00 |
0,00 |
0,00 |
0,00 |
0,00 |
|
|
3. Restructuring provisions: 31130 |
0,00 |
0,00 |
0,00 |
0,00 |
0,00 |
|
|
4. Other provisions: 31140 |
0,00 |
0,00 |
0,00 |
0,00 |
0,00 |
|
|
II Long-term creditors: 31200 |
6.398.000,00 |
6.922.000,00 |
7.396.000,00 |
7.673.860,00 |
7.928.000,00 |
|
|
1. Liabilities and other securities: 31210 |
0,00 |
0,00 |
0,00 |
0,00 |
0,00 |
|
|
2. Amounts owed to credit institutions:
31220 |
245.000,00 |
273.000,00 |
288.000,00 |
139.840,00 |
0,00 |
|
|
3. Creditors from financial leasing: 31230 |
6.153.000,00 |
6.649.000,00 |
7.108.000,00 |
7.534.020,00 |
7.928.000,00 |
|
|
4. Derivatives : 31240 |
0,00 |
0,00 |
0,00 |
0,00 |
0,00 |
|
|
5. Other financial liabilities : 31250 |
0,00 |
0,00 |
0,00 |
0,00 |
0,00 |
|
|
III. Long-term debts with Group companies and associates: 31300 |
30.000.000,00 |
0,00 |
0,00 |
0,00 |
0,00 |
|
|
IV. Liabilities for deferred tax: 31400 |
4.323.000,00 |
826.000,00 |
1.029.000,00 |
1.211.730,00 |
1.201.000,00 |
|
|
V. Long-term accruals: 31500 |
0,00 |
0,00 |
0,00 |
0,00 |
0,00 |
|
|
VI. Non-current trade creditors : 31600 |
0,00 |
0,00 |
0,00 |
0,00 |
0,00 |
|
|
VII. Special long-term debts : 31700 |
0,00 |
0,00 |
0,00 |
0,00 |
0,00 |
|
|
C) CURRENT
LIABILITIES : 32000 |
106.311.000,00 |
11.966.000,00 |
75.137.000,00 |
79.277.110,00 |
71.096.000,00 |
|
|
I. Liabilities linked to non-current assets held for sale: 32100 |
0,00 |
0,00 |
0,00 |
0,00 |
0,00 |
|
|
II. Short-term provisions: 32200 |
650.000,00 |
100.000,00 |
1.241.000,00 |
0,00 |
0,00 |
|
|
1. Provisions from greenhouse gas emission
allowance: 32210 |
0,00 |
0,00 |
0,00 |
0,00 |
0,00 |
|
|
2. Other provisions: 32220 |
650.000,00 |
0,00 |
0,00 |
0,00 |
0,00 |
|
|
III. Short-term creditors : 32300 |
496.000,00 |
1.532.000,00 |
441.000,00 |
458.240,00 |
592.000,00 |
|
|
1. Liabilities and other securities: 32310 |
0,00 |
0,00 |
0,00 |
0,00 |
0,00 |
|
|
2. Amounts owed to credit institutions:
32320 |
0,00 |
0,00 |
15.000,00 |
63.740,00 |
226.000,00 |
|
|
3. Creditors from financial leasing: 32330 |
496.000,00 |
459.000,00 |
426.000,00 |
394.500,00 |
366.000,00 |
|
|
4. Derivatives : 32340 |
0,00 |
0,00 |
0,00 |
0,00 |
0,00 |
|
|
5. Other financial liabilities : 32350 |
0,00 |
1.073.000,00 |
0,00 |
0,00 |
0,00 |
|
|
IV. Short-term debts with Group companies and associates: 32400 |
35.975.000,00 |
428.000,00 |
4.045.000,00 |
3.901.460,00 |
4.104.000,00 |
|
|
V. Trade creditors and other accounts payable: 32500 |
69.073.000,00 |
9.906.000,00 |
69.410.000,00 |
74.917.410,00 |
66.400.000,00 |
|
|
1. Suppliers: 32510 |
50.087.000,00 |
6.628.000,00 |
61.491.000,00 |
57.858.840,00 |
54.460.000,00 |
|
|
a) Long-term debts :
32511 |
0,00 |
0,00 |
0,00 |
0,00 |
0,00 |
|
|
b) Short-term debts :
32512 |
50.087.000,00 |
6.628.000,00 |
0,00 |
57.858.840,00 |
54.460.000,00 |
|
|
2. Suppliers, Group companies and associates:
32520 |
9.085.000,00 |
1.086.000,00 |
4.827.000,00 |
12.364.890,00 |
7.986.000,00 |
|
|
3. Other creditors: 32530 |
560.000,00 |
1.664.000,00 |
2.255.000,00 |
3.033.370,00 |
2.695.000,00 |
|
|
4. Personnel (remuneration due): 32540 |
4.584.000,00 |
189.000,00 |
179.000,00 |
310.730,00 |
363.000,00 |
|
|
5. Liabilities for current tax: 32550 |
0,00 |
0,00 |
0,00 |
0,00 |
0,00 |
|
|
6. Other accounts payable to Public
Administrations.: 32560 |
2.908.000,00 |
339.000,00 |
658.000,00 |
1.349.580,00 |
896.000,00 |
|
|
7. Advances from clients: 32570 |
1.849.000,00 |
0,00 |
0,00 |
0,00 |
0,00 |
|
|
VI. Short-term accruals: 32600 |
117.000,00 |
0,00 |
0,00 |
0,00 |
0,00 |
|
|
VII. Special short-term debts : 32700 |
0,00 |
0,00 |
0,00 |
0,00 |
0,00 |
|
|
TOTAL NET WORTH
AND LIABILITIES (A + B + C) : 30000 |
276.524.000,00 |
178.950.000,00 |
247.287.000,00 |
254.884.390,00 |
248.204.000,00 |
|
|
|
ORIGINAL |
ORIGINAL |
ORIGINAL |
ORIGINAL |
ORIGINAL |
|
|
Profit and
Loss |
2013 |
2012 |
2011 |
2010 |
2009 |
|
|
1. Net turnover:
40100 |
271.437.000,00 |
23.131.000,00 |
98.617.000,00 |
103.929.980,00 |
82.393.000,00 |
|
|
a) Sales: 40110 |
269.153.000,00 |
20.028.000,00 |
98.617.000,00 |
103.929.980,00 |
82.393.000,00 |
|
|
b) Rendering of services: 40120 |
2.284.000,00 |
3.103.000,00 |
0,00 |
0,00 |
0,00 |
|
|
c) Income of financial nature of holding companies: 40130 |
0,00 |
0,00 |
0,00 |
0,00 |
0,00 |
|
|
2. Changes in
stocks of finished goods and work in progress: 40200 |
-4.509.000,00 |
-8.143.000,00 |
-3.503.000,00 |
78.970,00 |
-7.165.000,00 |
|
|
3. Works carried
out by the company for its assets: 40300 |
0,00 |
0,00 |
0,00 |
244.110,00 |
0,00 |
|
|
4. Supplies :
40400 |
-190.944.000,00 |
-12.101.000,00 |
-81.053.000,00 |
-88.562.020,00 |
-59.504.000,00 |
|
|
a) Stock consumption: 40410 |
-26.574.000,00 |
-103.000,00 |
-5.083.000,00 |
-7.488.020,00 |
-6.512.000,00 |
|
|
b) Consumption of raw materials and miscellaneous consumable ones:
40420 |
-159.861.000,00 |
-12.017.000,00 |
-75.461.000,00 |
-81.081.360,00 |
-54.416.000,00 |
|
|
c) Works carried out by other companies: 40430 |
-550.000,00 |
0,00 |
0,00 |
0,00 |
0,00 |
|
|
d) Impairment of stock, primary material and other supplies:
40440 |
-3.959.000,00 |
19.000,00 |
-509.000,00 |
7.360,00 |
1.424.000,00 |
|
|
5. Other
operating income: 40500 |
1.980.000,00 |
60.000,00 |
115.000,00 |
327.200,00 |
512.000,00 |
|
|
a) Auxiliary income and other from current management: 40510 |
1.980.000,00 |
60.000,00 |
115.000,00 |
327.200,00 |
428.000,00 |
|
|
b) Operation subsidies included in the Period's result:
40520 |
0,00 |
0,00 |
0,00 |
0,00 |
84.000,00 |
|
|
6. Personnel
costs: 40600 |
-38.628.000,00 |
-4.857.000,00 |
-12.070.000,00 |
-9.631.070,00 |
-11.642.000,00 |
|
|
a) Wages, salaries et al.: 40610 |
-28.398.000,00 |
-3.938.000,00 |
-10.021.000,00 |
-7.729.130,00 |
-9.617.000,00 |
|
|
b) Social security costs: 40620 |
-7.576.000,00 |
-919.000,00 |
-2.049.000,00 |
-1.901.940,00 |
-2.025.000,00 |
|
|
c) Provisions : 40630 |
-2.654.000,00 |
0,00 |
0,00 |
0,00 |
0,00 |
|
|
7. Other
operating costs: 40700 |
-52.021.000,00 |
-4.078.000,00 |
-9.436.000,00 |
-9.497.920,00 |
-9.743.000,00 |
|
|
a) External services: 40710 |
-50.081.000,00 |
-3.920.000,00 |
-9.070.000,00 |
-9.106.710,00 |
-9.652.000,00 |
|
|
b) Taxes: 40720 |
-1.181.000,00 |
-158.000,00 |
-307.000,00 |
-297.050,00 |
-336.000,00 |
|
|
c) Losses, impairments and variation in provisions from trade
operations : 40730 |
-759.000,00 |
0,00 |
-59.000,00 |
-94.160,00 |
245.000,00 |
|
|
d) Other current management expenditure : 40740 |
0,00 |
0,00 |
0,00 |
0,00 |
0,00 |
|
|
e) Expenses due to greenhouse gas emissions: 40750 |
0,00 |
0,00 |
0,00 |
0,00 |
0,00 |
|
|
8. Amortisation
of fixed assets: 40800 |
-5.735.000,00 |
-948.000,00 |
-2.505.000,00 |
-3.442.230,00 |
-3.679.000,00 |
|
|
9. Allocation of subsidies
of non-financial fixed assets and other: 40900 |
0,00 |
0,00 |
0,00 |
0,00 |
0,00 |
|
|
10. Excess
provisions : 41000 |
0,00 |
0,00 |
0,00 |
0,00 |
0,00 |
|
|
11. Impairment
and result of transfers of fixed assets: 41100 |
-1.605.000,00 |
309.000,00 |
6.000,00 |
1.560,00 |
0,00 |
|
|
a) Impairment and losses : 41110 |
-2.500.000,00 |
0,00 |
0,00 |
0,00 |
0,00 |
|
|
b) Results for transfers and other : 41120 |
895.000,00 |
309.000,00 |
6.000,00 |
1.560,00 |
0,00 |
|
|
c) Impairment and profit due to disposals of assets of holding
companies: 41130 |
0,00 |
0,00 |
0,00 |
0,00 |
0,00 |
|
|
12. Negative
difference in combined businesses: 41200 |
0,00 |
0,00 |
0,00 |
0,00 |
0,00 |
|
|
13. Other results
: 41300 |
0,00 |
0,00 |
0,00 |
0,00 |
0,00 |
|
|
A.1) OPERATING
INCOME (1 + 2 + 3 + 4 + 5 + 6 + 7 + 8 + 9 + 10 + 11 + 12 + 13) : 49100 |
-20.025.000,00 |
-6.627.000,00 |
-9.829.000,00 |
-6.551.420,00 |
-8.828.000,00 |
|
|
14. Financial
income : 41400 |
4.905.000,00 |
2.872.000,00 |
6.579.000,00 |
7.330.980,00 |
7.508.000,00 |
|
|
a) Of shares in equity instruments : 41410 |
0,00 |
0,00 |
0,00 |
250,00 |
1.000,00 |
|
|
a 1) In Group companies and associates:
41411 |
0,00 |
0,00 |
0,00 |
0,00 |
0,00 |
|
|
a 2) In third parties: 41412 |
0,00 |
0,00 |
0,00 |
250,00 |
1.000,00 |
|
|
b) From negotiable securities and other financial instruments :
41420 |
4.905.000,00 |
2.872.000,00 |
6.579.000,00 |
7.330.730,00 |
7.507.000,00 |
|
|
b 1) From Group companies and associates :
41421 |
4.638.000,00 |
2.712.000,00 |
6.102.000,00 |
6.992.310,00 |
6.992.000,00 |
|
|
b 2) From third parties : 41422 |
267.000,00 |
160.000,00 |
477.000,00 |
338.420,00 |
515.000,00 |
|
|
c) Allocation of financial subsidies, donations and legacies :
41430 |
0,00 |
0,00 |
0,00 |
0,00 |
0,00 |
|
|
15. Financial
expenditure: 41500 |
-4.578.000,00 |
-305.000,00 |
-1.236.000,00 |
-1.148.680,00 |
-1.140.000,00 |
|
|
a) Amounts owed to Group companies and associates : 41510 |
-3.036.000,00 |
-219.000,00 |
0,00 |
0,00 |
0,00 |
|
|
b) For debts with third parties : 41520 |
-1.542.000,00 |
-86.000,00 |
-1.236.000,00 |
-1.148.680,00 |
-1.140.000,00 |
|
|
c) Stock renewal : 41530 |
0,00 |
0,00 |
0,00 |
0,00 |
0,00 |
|
|
16. Changes in
fair value of financial instruments : 41600 |
-570.000,00 |
0,00 |
0,00 |
0,00 |
0,00 |
|
|
a) Trading book and other : 41610 |
-570.000,00 |
0,00 |
0,00 |
0,00 |
0,00 |
|
|
b) Allocation of financial assets held for sale to the result for the
period: 41620 |
0,00 |
0,00 |
0,00 |
0,00 |
0,00 |
|
|
17. Exchange rate
differences : 41700 |
-2.003.000,00 |
-5.000,00 |
0,00 |
0,00 |
0,00 |
|
|
18. Impairment and
result for transfers of financial instruments: 41800 |
0,00 |
0,00 |
0,00 |
0,00 |
0,00 |
|
|
a) Impairment and losses : 41810 |
0,00 |
0,00 |
0,00 |
0,00 |
0,00 |
|
|
b) Results for transfers and other : 41820 |
0,00 |
0,00 |
0,00 |
0,00 |
0,00 |
|
|
19. Other
financial income and expenditure: 42100 |
0,00 |
0,00 |
0,00 |
0,00 |
0,00 |
|
|
a) Incorporation of financial expenditure to assets: 42110 |
0,00 |
0,00 |
0,00 |
0,00 |
0,00 |
|
|
b) Financial income from arrangement with creditors: 42120 |
0,00 |
0,00 |
0,00 |
0,00 |
0,00 |
|
|
c) Other income and expenditure: 42130 |
0,00 |
0,00 |
0,00 |
0,00 |
0,00 |
|
|
A.2) FINANCIAL
REVENUE (14+15+16+17+18+19) : 49200 |
-2.246.000,00 |
2.562.000,00 |
5.343.000,00 |
6.182.300,00 |
6.368.000,00 |
|
|
A.3) NET RESULT
BEFORE TAXES (A.1+A.2) : 49300 |
-22.271.000,00 |
-4.065.000,00 |
-4.486.000,00 |
-369.120,00 |
-2.460.000,00 |
|
|
20. Income taxes:
41900 |
1.468.000,00 |
32.000,00 |
124.000,00 |
110.740,00 |
738.000,00 |
|
|
A.4) PROFIT AFTER
TAXES (A.3+20) : 49400 |
-20.803.000,00 |
-4.033.000,00 |
-4.362.000,00 |
-258.380,00 |
-1.722.000,00 |
|
|
21. Result of the
year coming from interrupted operations : 42000 |
0,00 |
0,00 |
0,00 |
0,00 |
-269.000,00 |
|
|
A.5) RESULT OF
THE PERIOD (A.4+21) : 49500 |
-20.803.000,00 |
-4.033.000,00 |
-4.362.000,00 |
-258.380,00 |
-1.991.000,00 |
|
> Normal Balance
Sheet under the rules of the 1990 General Accounting Plan (repealed since 1st
January of 2008)
Information corresponding to the fiscal year
2013 2012 2011 2010 2009 has been compiled based on
the equivalence criteria stipulated in Act JUS/206/2009. Where the provisions
of the Act did not establish relevant equivalence criteria, Axesor created such
criteria using its own methodology. To view details on the methodology
2013 2012 2011 2010 2009 is taken from information
submitted to the TRADE REGISTER.
|
|
EQUIVALENCIA |
EQUIVALENCIA |
EQUIVALENCIA |
EQUIVALENCIA |
EQUIVALENCIA |
|
|
ASSETS |
2013 |
2012 |
2011 |
2010 |
2009 |
|
|
A) SHAREHOLDERS
(PARTNERS) BY UNCALLED SUSCRIBED CAPITAL: |
0,00 |
0,00 |
0,00 |
0,00 |
0,00 |
|
|
B) FIXED ASSETS:
|
158.812.000,00 |
111.370.000,00 |
133.210.000,00 |
135.906.380,00 |
139.158.000,00 |
|
|
I. Formation expenses: |
0,00 |
0,00 |
0,00 |
0,00 |
0,00 |
|
|
II. Intangible fixed assets: |
283.000,00 |
168.000,00 |
213.000,00 |
272.490,00 |
80.000,00 |
|
|
1. Research and development costs: |
176.000,00 |
0,00 |
195.000,00 |
244.110,00 |
0,00 |
|
|
2. Concessions, patents, licences, trademarks et
al.: |
98.000,00 |
146.000,00 |
0,00 |
0,00 |
0,00 |
|
|
3. Goodwill: |
0,00 |
0,00 |
0,00 |
0,00 |
0,00 |
|
|
4. Key money paid for premises: |
0,00 |
0,00 |
0,00 |
0,00 |
0,00 |
|
|
5. Software: |
9.000,00 |
22.000,00 |
18.000,00 |
28.380,00 |
80.000,00 |
|
|
6. Assets under capital leases: |
0,00 |
0,00 |
0,00 |
0,00 |
0,00 |
|
|
7. Payments on account: |
0,00 |
0,00 |
0,00 |
0,00 |
0,00 |
|
|
8. Provisions: |
0,00 |
0,00 |
0,00 |
0,00 |
0,00 |
|
|
9. Accumulated depreciation: |
0,00 |
0,00 |
0,00 |
0,00 |
0,00 |
|
|
III. Tangible fixed assets: |
61.985.000,00 |
14.310.000,00 |
13.859.000,00 |
16.104.450,00 |
19.171.000,00 |
|
|
1. Land and construction: |
43.585.000,00 |
4.738.000,00 |
5.191.000,00 |
5.641.880,00 |
6.106.000,00 |
|
|
2. Technical installations and machinery: |
11.763.475,00 |
6.937.341,00 |
6.282.164,00 |
7.582.785,00 |
9.468.905,00 |
|
|
3. Other installations, tools and furniture:
|
3.722.308,00 |
2.195.178,00 |
1.987.860,00 |
2.399.415,00 |
2.996.239,00 |
|
|
4. Payments on account and tangible fixed assets under
construction: |
2.169.000,00 |
0,00 |
0,00 |
0,00 |
0,00 |
|
|
5. Other tangible assets: |
745.217,00 |
439.481,00 |
397.976,00 |
480.370,00 |
599.856,00 |
|
|
6. Provisions: |
0,00 |
0,00 |
0,00 |
0,00 |
0,00 |
|
|
7. Accumulated depreciation: |
0,00 |
0,00 |
0,00 |
0,00 |
0,00 |
|
|
IV. Financial investments: |
96.544.000,00 |
96.892.000,00 |
119.138.000,00 |
119.529.440,00 |
119.907.000,00 |
|
|
1. Equity investments in group companies: |
0,00 |
0,00 |
0,00 |
0,00 |
0,00 |
|
|
2. Receivables from group companies: |
89.119.000,00 |
89.119.000,00 |
111.001.000,00 |
110.999.450,00 |
110.999.000,00 |
|
|
3. Equity investment in associated companies:
|
0,00 |
0,00 |
0,00 |
0,00 |
0,00 |
|
|
4. Credits to associated companies: |
0,00 |
0,00 |
0,00 |
0,00 |
0,00 |
|
|
5. Long-term securities portfolio: |
0,00 |
0,00 |
12.000,00 |
11.510,00 |
12.000,00 |
|
|
6. Other receivables: |
4.561.000,00 |
4.992.000,00 |
5.404.000,00 |
5.797.830,00 |
6.174.000,00 |
|
|
7. Long term guarantees and deposits: |
2.864.000,00 |
2.781.000,00 |
2.721.000,00 |
2.720.650,00 |
2.722.000,00 |
|
|
8. Provisions: |
0,00 |
0,00 |
0,00 |
0,00 |
0,00 |
|
|
9. Long-term receivables from public bodies:
|
0,00 |
0,00 |
0,00 |
0,00 |
0,00 |
|
|
V. Own shares: |
0,00 |
0,00 |
0,00 |
0,00 |
0,00 |
|
|
VI. Long-term trade receivables: |
0,00 |
0,00 |
0,00 |
0,00 |
0,00 |
|
|
C) Deferred
expenses: |
0,00 |
0,00 |
0,00 |
0,00 |
0,00 |
|
|
D) CURRENT
ASSETS: |
117.712.000,00 |
67.580.000,00 |
114.077.000,00 |
118.978.010,00 |
109.046.000,00 |
|
|
I. Called-up share capital (not paid): |
0,00 |
0,00 |
0,00 |
0,00 |
0,00 |
|
|
II. Stocks: |
36.619.000,00 |
103.000,00 |
11.351.000,00 |
16.162.570,00 |
14.531.000,00 |
|
|
1. Goods for resale: |
1.281.000,00 |
103.000,00 |
0,00 |
0,00 |
0,00 |
|
|
2. Raw materials and other consumables: |
12.684.000,00 |
0,00 |
4.600.000,00 |
5.393.440,00 |
3.850.000,00 |
|
|
3. Goods in process and semifinished ones: |
7.619.000,00 |
0,00 |
603.000,00 |
601.730,00 |
712.000,00 |
|
|
4. Finished products: |
15.035.000,00 |
0,00 |
6.148.000,00 |
10.167.400,00 |
9.969.000,00 |
|
|
5. Byproducts, scrap and recovered materials:
|
0,00 |
0,00 |
0,00 |
0,00 |
0,00 |
|
|
6. Payments on account: |
0,00 |
0,00 |
0,00 |
0,00 |
0,00 |
|
|
7. Provisions: |
0,00 |
0,00 |
0,00 |
0,00 |
0,00 |
|
|
III. Debtors: |
74.419.000,00 |
4.271.000,00 |
70.997.000,00 |
74.835.850,00 |
64.877.000,00 |
|
|
1. Trade debtors / accounts receivable: |
56.561.000,00 |
994.000,00 |
9.575.000,00 |
21.797.780,00 |
12.990.000,00 |
|
|
2. Accounts receivable, Group companies: |
11.059.000,00 |
2.494.000,00 |
60.906.000,00 |
52.647.920,00 |
51.471.000,00 |
|
|
3. Accounts receivable, associated companies:
|
0,00 |
0,00 |
0,00 |
0,00 |
0,00 |
|
|
4. Other debtors: |
27.000,00 |
9.000,00 |
0,00 |
0,00 |
0,00 |
|
|
5. Staff: |
399.000,00 |
0,00 |
0,00 |
1.580,00 |
0,00 |
|
|
6. Public bodies: |
6.373.000,00 |
774.000,00 |
516.000,00 |
388.570,00 |
416.000,00 |
|
|
7. Provisions: |
0,00 |
0,00 |
0,00 |
0,00 |
0,00 |
|
|
IV. Short-term investments: |
4.759.000,00 |
62.701.000,00 |
2.273.000,00 |
1.878.780,00 |
1.366.000,00 |
|
|
1. Equity investments in group companies: |
0,00 |
0,00 |
0,00 |
0,00 |
0,00 |
|
|
2. Receivables from group companies: |
2.328.000,00 |
62.289.000,00 |
1.879.000,00 |
1.502.190,00 |
1.006.000,00 |
|
|
3. Equity investment in associated companies:
|
0,00 |
0,00 |
0,00 |
0,00 |
0,00 |
|
|
4. Credits to associated companies: |
0,00 |
0,00 |
0,00 |
0,00 |
0,00 |
|
|
5. Short term securities portfolio: |
0,00 |
0,00 |
0,00 |
0,00 |
0,00 |
|
|
6. Other receivables: |
2.431.000,00 |
412.000,00 |
0,00 |
0,00 |
0,00 |
|
|
7. Shor term guarantees and deposits: |
0,00 |
0,00 |
394.000,00 |
376.590,00 |
360.000,00 |
|
|
8. Provisions: |
0,00 |
0,00 |
0,00 |
0,00 |
0,00 |
|
|
V. Short-term treasury shares: |
0,00 |
0,00 |
0,00 |
0,00 |
0,00 |
|
|
VI. Cash at bank and in hand: |
1.825.000,00 |
422.000,00 |
29.445.000,00 |
26.088.420,00 |
28.246.000,00 |
|
|
VII. Prepayments and accrued income: |
90.000,00 |
83.000,00 |
11.000,00 |
12.390,00 |
26.000,00 |
|
|
GENERAL TOTAL (A
+ B + C + D): |
276.524.000,00 |
178.950.000,00 |
247.287.000,00 |
254.884.390,00 |
248.204.000,00 |
|
MERCANTILE REGISTRY.
|
|
EQUIVALENCIA |
EQUIVALENCIA |
EQUIVALENCIA |
EQUIVALENCIA |
EQUIVALENCIA |
|
|
LIABILITIES |
2013 |
2012 |
2011 |
2010 |
2009 |
|
|
A) EQUITY: |
128.801.000,00 |
159.180.900,00 |
163.725.000,00 |
166.721.690,00 |
167.979.000,00 |
|
|
I. Subscribed capital: |
58.178.000,00 |
58.178.000,00 |
58.178.000,00 |
58.178.230,00 |
58.178.000,00 |
|
|
II. Share premium: |
22.610.000,00 |
0,00 |
74.701.000,00 |
74.701.370,00 |
75.701.000,00 |
|
|
III. Revaluation reserves: |
0,00 |
0,00 |
0,00 |
0,00 |
0,00 |
|
|
IV. Reserves: |
73.560.000,00 |
105.746.900,00 |
38.433.000,00 |
37.067.280,00 |
37.067.000,00 |
|
|
1. Legal reserve: |
7.614.000,00 |
4.613.000,00 |
4.613.000,00 |
4.612.920,00 |
4.613.000,00 |
|
|
2. Reserves for own shares: |
0,00 |
0,00 |
0,00 |
0,00 |
0,00 |
|
|
3. Reserves for shares of the controlling company:
|
0,00 |
0,00 |
0,00 |
0,00 |
0,00 |
|
|
4. Statutory reserves: |
0,00 |
0,00 |
0,00 |
0,00 |
0,00 |
|
|
5. Miscellaneous reserves: |
65.946.000,00 |
101.133.900,00 |
33.820.000,00 |
32.454.360,00 |
32.454.000,00 |
|
|
Differences due to capital adjustement to euros:
|
0,00 |
0,00 |
0,00 |
0,00 |
0,00 |
|
|
V. Profit or loss brought forward: |
-4.744.000,00 |
-711.000,00 |
-3.225.000,00 |
-2.966.810,00 |
-976.000,00 |
|
|
1. Retained earnings: |
0,00 |
0,00 |
0,00 |
0,00 |
0,00 |
|
|
2. Prior year losses: |
-4.744.000,00 |
-711.000,00 |
-3.225.000,00 |
-2.966.810,00 |
-976.000,00 |
|
|
3. Partners' contributions so as to
compensate losses: |
0,00 |
0,00 |
0,00 |
0,00 |
0,00 |
|
|
VI. Profit or loss for the financial year: |
-20.803.000,00 |
-4.033.000,00 |
-4.362.000,00 |
-258.380,00 |
-1.991.000,00 |
|
|
VII. Interim dividend paid: |
0,00 |
0,00 |
0,00 |
0,00 |
0,00 |
|
|
VIII. Own shares for capital reduction: |
0,00 |
0,00 |
0,00 |
0,00 |
0,00 |
|
|
B) Deferred
income: |
0,00 |
2.100,00 |
0,00 |
0,00 |
0,00 |
|
|
1. Capital grants: |
0,00 |
2.100,00 |
0,00 |
0,00 |
0,00 |
|
|
2. Unrealised exchange gains: |
0,00 |
0,00 |
0,00 |
0,00 |
0,00 |
|
|
3. Other deferred income: |
0,00 |
0,00 |
0,00 |
0,00 |
0,00 |
|
|
4. Public revenues to distribute in several
financial years: |
0,00 |
0,00 |
0,00 |
0,00 |
0,00 |
|
|
C) PROVISIONS FOR
LIABILITIES AND CHARGES: |
691.000,00 |
53.000,00 |
0,00 |
0,00 |
0,00 |
|
|
1. Provisions for pension fund and other similar
obligations: |
691.000,00 |
53.000,00 |
0,00 |
0,00 |
0,00 |
|
|
2. Provisions for taxes: |
0,00 |
0,00 |
0,00 |
0,00 |
0,00 |
|
|
3. Other provisions: |
0,00 |
0,00 |
0,00 |
0,00 |
0,00 |
|
|
4. Reversion fund: |
0,00 |
0,00 |
0,00 |
0,00 |
0,00 |
|
|
D) LONG TERM
LIABILITIES: |
40.721.000,00 |
7.748.000,00 |
8.425.000,00 |
8.885.590,00 |
9.129.000,00 |
|
|
I. Issued debentures and other marketable securities: |
0,00 |
0,00 |
0,00 |
0,00 |
0,00 |
|
|
1. Non-convertible debentures: |
0,00 |
0,00 |
0,00 |
0,00 |
0,00 |
|
|
2. Convertible debentures: |
0,00 |
0,00 |
0,00 |
0,00 |
0,00 |
|
|
3. Other debt securities: |
0,00 |
0,00 |
0,00 |
0,00 |
0,00 |
|
|
II. Amounts owed to credit institutions: |
6.398.000,00 |
6.922.000,00 |
7.396.000,00 |
7.673.860,00 |
7.928.000,00 |
|
|
1. Loans and other liabilities: |
245.000,00 |
273.000,00 |
288.000,00 |
139.840,00 |
0,00 |
|
|
2. Long-term liabilities from capital leases:
|
6.153.000,00 |
6.649.000,00 |
7.108.000,00 |
7.534.020,00 |
7.928.000,00 |
|
|
III. Debts with companies of the group and affiliated ones: |
30.000.000,00 |
0,00 |
0,00 |
0,00 |
0,00 |
|
|
1. Amounts owed to group companies: |
30.000.000,00 |
0,00 |
0,00 |
0,00 |
0,00 |
|
|
2. Amounts owed to associated companies: |
0,00 |
0,00 |
0,00 |
0,00 |
0,00 |
|
|
IV. Other creditors: |
4.323.000,00 |
826.000,00 |
1.029.000,00 |
1.211.730,00 |
1.201.000,00 |
|
|
1. Long-term bills of exchange payable: |
0,00 |
0,00 |
0,00 |
0,00 |
0,00 |
|
|
2. Other creditors: |
0,00 |
0,00 |
0,00 |
0,00 |
0,00 |
|
|
3. Long term guarantees and deposits received:
|
0,00 |
0,00 |
0,00 |
0,00 |
0,00 |
|
|
4. Long term payables to public bodies: |
4.323.000,00 |
826.000,00 |
1.029.000,00 |
1.211.730,00 |
1.201.000,00 |
|
|
V. Unpaid portion of equity investment: |
0,00 |
0,00 |
0,00 |
0,00 |
0,00 |
|
|
1. Group companies: |
0,00 |
0,00 |
0,00 |
0,00 |
0,00 |
|
|
2. Associated companies: |
0,00 |
0,00 |
0,00 |
0,00 |
0,00 |
|
|
3. Third parties: |
0,00 |
0,00 |
0,00 |
0,00 |
0,00 |
|
|
VI. Long term trade creditors: |
0,00 |
0,00 |
0,00 |
0,00 |
0,00 |
|
|
E) SHORT TERM
CREDITORS: |
105.661.000,00 |
11.866.000,00 |
73.896.000,00 |
79.277.110,00 |
71.096.000,00 |
|
|
I. Issued debentures and other marketable securities: |
0,00 |
0,00 |
0,00 |
0,00 |
0,00 |
|
|
1. Non-convertible debentures: |
0,00 |
0,00 |
0,00 |
0,00 |
0,00 |
|
|
2. Convertible debentures: |
0,00 |
0,00 |
0,00 |
0,00 |
0,00 |
|
|
3. Other debt securities: |
0,00 |
0,00 |
0,00 |
0,00 |
0,00 |
|
|
4. Accrued interest on debentures and other debt
securities: |
0,00 |
0,00 |
0,00 |
0,00 |
0,00 |
|
|
II. Amounts owed to credit institutions: |
496.000,00 |
459.000,00 |
441.000,00 |
458.240,00 |
592.000,00 |
|
|
1. Loans and other liabilities: |
0,00 |
0,00 |
15.000,00 |
63.740,00 |
226.000,00 |
|
|
2. Accrued interest on liabilities with credit
institutions: |
0,00 |
0,00 |
0,00 |
0,00 |
0,00 |
|
|
3. Short-term liabilities from capital leases:
|
496.000,00 |
459.000,00 |
426.000,00 |
394.500,00 |
366.000,00 |
|
|
III. Short-term amounts owed to group and associated companies: |
45.060.000,00 |
1.514.000,00 |
8.872.000,00 |
16.266.350,00 |
12.090.000,00 |
|
|
1. Amounts owed to group companies: |
45.060.000,00 |
1.514.000,00 |
8.872.000,00 |
16.266.350,00 |
12.090.000,00 |
|
|
2. Amounts owed to associated companies: |
0,00 |
0,00 |
0,00 |
0,00 |
0,00 |
|
|
IV. Trade creditors: |
52.496.000,00 |
8.292.000,00 |
63.746.000,00 |
60.892.210,00 |
57.155.000,00 |
|
|
1. Advanced payments from customers: |
1.849.000,00 |
0,00 |
0,00 |
0,00 |
0,00 |
|
|
2. Amounts owed for purchases of goods or
services: |
50.647.000,00 |
8.292.000,00 |
63.746.000,00 |
60.892.210,00 |
57.155.000,00 |
|
|
3. Debts represented by notes payable: |
0,00 |
0,00 |
0,00 |
0,00 |
0,00 |
|
|
V. Other creditors: |
7.492.000,00 |
1.601.000,00 |
837.000,00 |
1.660.310,00 |
1.259.000,00 |
|
|
1. Public bodies: |
2.908.000,00 |
339.000,00 |
658.000,00 |
1.349.580,00 |
896.000,00 |
|
|
2. Bills of exchange payable: |
0,00 |
0,00 |
0,00 |
0,00 |
0,00 |
|
|
3. Miscellaneous debts: |
0,00 |
1.073.000,00 |
0,00 |
0,00 |
0,00 |
|
|
4. Wages and salaries payable: |
4.584.000,00 |
189.000,00 |
179.000,00 |
310.730,00 |
363.000,00 |
|
|
5. Guarantees and deposits received at short
term: |
0,00 |
0,00 |
0,00 |
0,00 |
0,00 |
|
|
VI. Provisions: |
0,00 |
0,00 |
0,00 |
0,00 |
0,00 |
|
|
VII. Prepayments and accrued income: |
117.000,00 |
0,00 |
0,00 |
0,00 |
0,00 |
|
|
F) SHORT-TERM
PROVISIONS FOR LIABILITIES AND CHARGES: |
650.000,00 |
100.000,00 |
1.241.000,00 |
0,00 |
0,00 |
|
|
GENERAL TOTAL (A
+ B + C + D + E + F): |
276.524.000,00 |
178.950.000,00 |
247.287.000,00 |
254.884.390,00 |
248.204.000,00 |
|
MERCANTILE REGISTRY.
|
|
EQUIVALENCIA |
EQUIVALENCIA |
EQUIVALENCIA |
EQUIVALENCIA |
EQUIVALENCIA |
|
|
DEBIT |
2013 |
2012 |
2011 |
2010 |
2009 |
|
|
A) CHARGES (A.1
to A.15): |
300.020.000,00 |
30.405.000,00 |
109.679.000,00 |
112.171.180,00 |
92.404.000,00 |
|
|
A.1. Stock reduction of both manufactured goods
and the ones in process: |
4.509.000,00 |
8.143.000,00 |
3.503.000,00 |
0,00 |
7.165.000,00 |
|
|
A.2. Supplies: |
186.985.000,00 |
12.120.000,00 |
80.544.000,00 |
88.569.380,00 |
60.928.000,00 |
|
|
a) Stock consumption: |
26.574.000,00 |
103.000,00 |
5.083.000,00 |
7.488.020,00 |
6.512.000,00 |
|
|
b) Consumption of raw
materials and miscellaneous consumable ones: |
159.861.000,00 |
12.017.000,00 |
75.461.000,00 |
81.081.360,00 |
54.416.000,00 |
|
|
c) Miscellaneous external
expenditure: |
550.000,00 |
0,00 |
0,00 |
0,00 |
0,00 |
|
|
A.3. Staff costs: |
38.628.000,00 |
4.857.000,00 |
12.070.000,00 |
9.631.070,00 |
11.642.000,00 |
|
|
a) Wages, salaries et al.:
|
31.052.000,00 |
3.938.000,00 |
10.021.000,00 |
7.729.130,00 |
9.617.000,00 |
|
|
b) Social security costs:
|
7.576.000,00 |
919.000,00 |
2.049.000,00 |
1.901.940,00 |
2.025.000,00 |
|
|
A.4. Depreciation expense: |
5.735.000,00 |
948.000,00 |
2.505.000,00 |
3.442.230,00 |
3.679.000,00 |
|
|
A.5. Variation of trade provisions and losses of
unrecovered receivables: |
4.718.000,00 |
-19.000,00 |
568.000,00 |
86.800,00 |
-1.669.000,00 |
|
|
a) Stock provision
variation: |
3.959.000,00 |
-19.000,00 |
509.000,00 |
-7.360,00 |
-1.424.000,00 |
|
|
b) Variation in provision
and bad debt losses: |
0,00 |
0,00 |
59.000,00 |
94.160,00 |
-245.000,00 |
|
|
c) Variation of other trade
provisions: |
759.000,00 |
0,00 |
0,00 |
0,00 |
0,00 |
|
|
A.6. Other operating charges: |
51.262.000,00 |
4.078.000,00 |
9.377.000,00 |
9.403.760,00 |
9.988.000,00 |
|
|
a) External services: |
50.081.000,00 |
3.920.000,00 |
9.070.000,00 |
9.106.710,00 |
9.652.000,00 |
|
|
b) Taxes: |
1.181.000,00 |
158.000,00 |
307.000,00 |
297.050,00 |
336.000,00 |
|
|
c) Other operating expenses:
|
0,00 |
0,00 |
0,00 |
0,00 |
0,00 |
|
|
d) Allocation to revision
fund: |
0,00 |
0,00 |
0,00 |
0,00 |
0,00 |
|
|
A.I. OPERATING BENEFITS (B.1+B.2+B.3+B.4-A.1-A.2-A.3-A.4-A.5-A.6):
|
0,00 |
0,00 |
0,00 |
0,00 |
0,00 |
|
|
A.7. Financial and similar charges: |
4.578.000,00 |
305.000,00 |
1.236.000,00 |
1.148.680,00 |
1.140.000,00 |
|
|
a) Due to liabilities with
companies of the group: |
3.036.000,00 |
219.000,00 |
0,00 |
0,00 |
0,00 |
|
|
b) Due to liabilities with
associated companies: |
0,00 |
0,00 |
0,00 |
0,00 |
0,00 |
|
|
c) Due to other debts.:
|
1.542.000,00 |
86.000,00 |
1.236.000,00 |
1.148.680,00 |
1.140.000,00 |
|
|
d) Losses from financial
investments: |
0,00 |
0,00 |
0,00 |
0,00 |
0,00 |
|
|
A.8. Changes in financial investment provisions:
|
570.000,00 |
0,00 |
0,00 |
0,00 |
0,00 |
|
|
A.9. Exchange losses: |
2.003.000,00 |
5.000,00 |
0,00 |
0,00 |
0,00 |
|
|
A.II. NET FINANCIAL INCOME (B.5+B.6+B.7+B.8-A.7-A.8-A.9): |
0,00 |
2.562.000,00 |
5.343.000,00 |
6.182.300,00 |
6.368.000,00 |
|
|
A.III. PROFIT FROM ORDINARY ACTIVITIES (A.I+A.II-B.I-B.II): |
0,00 |
0,00 |
0,00 |
0,00 |
0,00 |
|
|
A.10. Changes in provisions for intangible,
tangible and securities portfolio: |
2.500.000,00 |
0,00 |
0,00 |
0,00 |
0,00 |
|
|
A.11. Losses from tangible and intangible fixed
assets and securities portfolio: |
0,00 |
0,00 |
0,00 |
0,00 |
0,00 |
|
|
A.12. Losses from transactions with own shares
and debentures: |
0,00 |
0,00 |
0,00 |
0,00 |
0,00 |
|
|
A.13. Extraordinary expenses: |
0,00 |
0,00 |
0,00 |
0,00 |
269.000,00 |
|
|
A.14. Expenses and losses of former financial
years: |
0,00 |
0,00 |
0,00 |
0,00 |
0,00 |
|
|
A.IV. EXTRAORDINARY PROFIT
(B.9+B.10+B.11+B.12+B.13-A.10-A.11-A.12-A.13-A.14): |
0,00 |
309.000,00 |
6.000,00 |
1.560,00 |
0,00 |
|
|
A.V. PROFIT BEFORE TAXES (A.III+A.IV-B.III-B.IV): |
0,00 |
0,00 |
0,00 |
0,00 |
0,00 |
|
|
A.15. Corporation tax: |
-1.468.000,00 |
-32.000,00 |
-124.000,00 |
-110.740,00 |
-738.000,00 |
|
|
A.16. Miscellaneous taxes: |
0,00 |
0,00 |
0,00 |
0,00 |
0,00 |
|
|
A.VI. FINANCIAL YEAR RESULTS (PROFIT) (A.V-A.15-A.16): |
0,00 |
0,00 |
0,00 |
0,00 |
0,00 |
|
MERCANTILE REGISTRY.
|
|
EQUIVALENCIA |
EQUIVALENCIA |
EQUIVALENCIA |
EQUIVALENCIA |
EQUIVALENCIA |
|
|
CREDIT |
2013 |
2012 |
2011 |
2010 |
2009 |
|
|
B) INCOME ( B.1
to B.13): |
279.217.000,00 |
26.372.000,00 |
105.317.000,00 |
111.912.800,00 |
90.413.000,00 |
|
|
B.1. Net total sales: |
271.437.000,00 |
23.131.000,00 |
98.617.000,00 |
103.929.980,00 |
82.393.000,00 |
|
|
a) Sales: |
296.037.837,00 |
22.028.533,00 |
108.467.538,00 |
114.311.215,00 |
90.622.975,00 |
|
|
b) Rendering of services:
|
2.284.000,00 |
3.103.000,00 |
0,00 |
0,00 |
0,00 |
|
|
Returns and Rappel on sales:
|
-26.884.837,00 |
-2.000.533,00 |
-9.850.538,00 |
-10.381.235,00 |
-8.229.975,00 |
|
|
B.2. Stock increase of manufactured goods and
products in process: |
0,00 |
0,00 |
0,00 |
78.970,00 |
0,00 |
|
|
B.3. Works performed by the company for fixed
assets: |
0,00 |
0,00 |
0,00 |
244.110,00 |
0,00 |
|
|
B.4. Miscellaneous operating income: |
1.980.000,00 |
60.000,00 |
115.000,00 |
327.200,00 |
512.000,00 |
|
|
a) Auxiliary income and
other from current management: |
1.980.000,00 |
60.000,00 |
115.000,00 |
327.200,00 |
428.000,00 |
|
|
b) Grants: |
0,00 |
0,00 |
0,00 |
0,00 |
84.000,00 |
|
|
c) Liabilities and charges
provisions surplus: |
0,00 |
0,00 |
0,00 |
0,00 |
0,00 |
|
|
B.I. PÉRDIDAS DE EXPLOTACIÓN (A.1+A.2+A.3+A.4+A.5-A.6-B.1-B.2-B.3-B.4):
|
18.420.000,00 |
6.936.000,00 |
9.835.000,00 |
6.552.980,00 |
8.828.000,00 |
|
|
B.5. Income from equity investment: |
0,00 |
0,00 |
0,00 |
250,00 |
1.000,00 |
|
|
a) In companies of the
group: |
0,00 |
0,00 |
0,00 |
0,00 |
0,00 |
|
|
b) In associated companies:
|
0,00 |
0,00 |
0,00 |
0,00 |
0,00 |
|
|
c) Third parties: |
0,00 |
0,00 |
0,00 |
250,00 |
1.000,00 |
|
|
B.6. Income from other marketable securities and
long-term receivables: |
0,00 |
0,00 |
0,00 |
0,00 |
0,00 |
|
|
a) From companies of the
group: |
0,00 |
0,00 |
0,00 |
0,00 |
0,00 |
|
|
b) From associated
companies: |
0,00 |
0,00 |
0,00 |
0,00 |
0,00 |
|
|
c) From companies out of the
group: |
0,00 |
0,00 |
0,00 |
0,00 |
0,00 |
|
|
B.7. Miscellaneous interests or similar income:
|
4.905.000,00 |
2.872.000,00 |
6.579.000,00 |
7.330.730,00 |
7.507.000,00 |
|
|
a) From companies of the
group: |
4.638.000,00 |
2.712.000,00 |
6.102.000,00 |
6.992.310,00 |
6.992.000,00 |
|
|
b) From associated
companies: |
0,00 |
0,00 |
0,00 |
0,00 |
0,00 |
|
|
c) Miscellaneous interests:
|
267.000,00 |
160.000,00 |
477.000,00 |
338.420,00 |
515.000,00 |
|
|
d) Profit on financial
investment: |
0,00 |
0,00 |
0,00 |
0,00 |
0,00 |
|
|
B.8. Exchange positive differences: |
0,00 |
0,00 |
0,00 |
0,00 |
0,00 |
|
|
B.II. NEGATIVE FINANCIAL RESULTS (A.7+A.8+A.9-B.5-B.6-B.7-B.8): |
2.246.000,00 |
0,00 |
0,00 |
0,00 |
0,00 |
|
|
B.III. LOSSES ON ORDINARY ACTIVITIES ( B.I + B.II - A.I - A.II ):
|
20.666.000,00 |
4.374.000,00 |
4.492.000,00 |
370.680,00 |
2.460.000,00 |
|
|
B.9.Profit on disposal of both tangible and intangible
fixed assets and securities portfolio: |
895.000,00 |
309.000,00 |
6.000,00 |
1.560,00 |
0,00 |
|
|
B.10. Profit on transactions with own shares and
debentures: |
0,00 |
0,00 |
0,00 |
0,00 |
0,00 |
|
|
B.11. Capital grants transferred to profit and
loss: |
0,00 |
0,00 |
0,00 |
0,00 |
0,00 |
|
|
B.12. Extraordinary income: |
0,00 |
0,00 |
0,00 |
0,00 |
0,00 |
|
|
B.13. Income and profit of former financial
years: |
0,00 |
0,00 |
0,00 |
0,00 |
0,00 |
|
|
B.IV. NEGATIVE EXTRAORDINARY RESULTS
(A.10+A.11+A.12+A.13+A.14-B.9-B.10-B.11-B.12-B.13): |
1.605.000,00 |
0,00 |
0,00 |
0,00 |
269.000,00 |
|
|
B.V. LOSSES BEFORE TAXES (B.III+B.IV-A.III-A.IV): |
22.271.000,00 |
4.065.000,00 |
4.486.000,00 |
369.120,00 |
2.729.000,00 |
|
|
B.VI. RESULT OF THE PERIOD (LOSSES) (B.V+A.15+A.16): |
20.803.000,00 |
4.033.000,00 |
4.362.000,00 |
258.380,00 |
1.991.000,00 |
|
MERCANTILE REGISTRY.
CASHFLOW
STATEMENT
|
Model: Normal
> Source of
information: Data contained in this section is taken from the information
declared in the Annual Accounts submitted to the Trade Register.
|
|
2013 |
2012 |
2011 |
2010 |
2009 |
|
|
1. Fiscal year
result before taxes.: 61100 |
-22.271.000,00 |
-4.065.000,00 |
-4.486.000,00 |
-369.130,00 |
-3.144.000,00 |
|
|
2. Results
adjustments.: 61200 |
14.849.000,00 |
-2.107.000,00 |
-1.023.000,00 |
-2.654.830,00 |
-6.098.000,00 |
|
|
a) Fixed Assets Amortization (+).: 61201 |
5.735.000,00 |
948.000,00 |
2.505.000,00 |
3.442.230,00 |
3.679.000,00 |
|
|
b) Obsolescence Allowances (+/-). : 61202 |
7.060.000,00 |
-232.000,00 |
509.000,00 |
-7.000,00 |
261.000,00 |
|
|
c) Variation in Provision (+/-). : 61203 |
706.000,00 |
53.000,00 |
1.300.000,00 |
90.000,00 |
-1.801.000,00 |
|
|
d) Allocation of grants (-).: 61204 |
-3.000,00 |
0,00 |
0,00 |
0,00 |
-197.000,00 |
|
|
e) Results on disposal of fixed assets (+/-). : 61205 |
-895.000,00 |
-309.000,00 |
6.000,00 |
2.000,00 |
-1.672.000,00 |
|
|
g) Financial income (-).: 61207 |
-4.905.000,00 |
-2.872.000,00 |
-6.579.000,00 |
-7.330.740,00 |
-7.508.000,00 |
|
|
h) Financial Expenses (+). : 61208 |
4.578.000,00 |
305.000,00 |
1.236.000,00 |
1.148.680,00 |
1.140.000,00 |
|
|
i) Exchange differences (+/-). : 61209 |
2.003.000,00 |
0,00 |
0,00 |
0,00 |
0,00 |
|
|
j) Reasonable Value Variation in Financial Instruments (+/-).:
61210 |
570.000,00 |
0,00 |
0,00 |
0,00 |
0,00 |
|
|
3. Changes in
current capital equity.: 61300 |
-981.000,00 |
8.086.000,00 |
2.262.000,00 |
-3.221.000,00 |
6.198.000,00 |
|
|
a) Stock (+/-).: 61301 |
5.846.000,00 |
14.931.000,00 |
4.302.000,00 |
-1.624.000,00 |
8.913.000,00 |
|
|
d) Debtors and other accounts receivable (+/-). : 61302 |
9.573.000,00 |
28.549.000,00 |
3.468.000,00 |
-10.036.000,00 |
-21.411.000,00 |
|
|
c) Other current assets (+/-). : 61303 |
183.000,00 |
14.000,00 |
0,00 |
0,00 |
0,00 |
|
|
d) Creditors and other accounts payable (+/-). : 61304 |
-16.410.000,00 |
-35.215.000,00 |
-5.508.000,00 |
8.439.000,00 |
20.372.000,00 |
|
|
e) Other current liabilities (+/-).: 61305 |
-173.000,00 |
-193.000,00 |
0,00 |
0,00 |
-1.676.000,00 |
|
|
4. Other cash
flows for operating activities.: 61400 |
-1.371.000,00 |
1.535.000,00 |
5.343.000,00 |
5.685.000,00 |
6.960.000,00 |
|
|
a) Interest payments (-). : 61401 |
-6.276.000,00 |
-305.000,00 |
-1.236.000,00 |
-1.150.000,00 |
-1.178.000,00 |
|
|
c) Interest collection (+). : 61403 |
4.905.000,00 |
1.840.000,00 |
6.579.000,00 |
6.835.000,00 |
8.138.000,00 |
|
|
5. Operating
activity cash flows (1 + 2 + 3 + 4) : 61500 |
-9.774.000,00 |
3.449.000,00 |
2.096.000,00 |
-559.960,00 |
3.916.000,00 |
|
|
6. Payments for
investment (-).: 62100 |
-4.107.000,00 |
-4.814.000,00 |
-222.000,00 |
-570.000,00 |
-588.000,00 |
|
|
a) Companies of the group and affiliates. : 62101 |
0,00 |
-3.502.000,00 |
0,00 |
0,00 |
0,00 |
|
|
c) Fixed assets. : 62103 |
-2.103.000,00 |
-1.312.000,00 |
-222.000,00 |
-570.000,00 |
-588.000,00 |
|
|
e) Other financial assets. : 62105 |
-2.004.000,00 |
0,00 |
0,00 |
0,00 |
0,00 |
|
|
7. Divestment payment
collection (+). : 62200 |
67.855.000,00 |
545.000,00 |
268.000,00 |
359.000,00 |
7.229.000,00 |
|
|
a) Companies of the group and affiliates. : 62201 |
63.808.000,00 |
0,00 |
0,00 |
0,00 |
0,00 |
|
|
c) Fixed assets. : 62203 |
1.305.000,00 |
346.000,00 |
0,00 |
0,00 |
6.877.000,00 |
|
|
e) Other financial assets. : 62205 |
412.000,00 |
199.000,00 |
268.000,00 |
0,00 |
352.000,00 |
|
|
h) Other assets. : 62208 |
2.330.000,00 |
0,00 |
0,00 |
359.000,00 |
0,00 |
|
|
8. Investment
activity cash flows (6 + 7) minus Amortization: 62300 |
63.748.000,00 |
-4.269.000,00 |
46.000,00 |
-211.000,00 |
6.641.000,00 |
|
|
9. Payment collection
and payments for equity instruments. : 63100 |
0,00 |
0,00 |
0,00 |
0,00 |
0,00 |
|
|
10. Payment
collection and payments for financial liabilities instruments.: 63200 |
-52.806.000,00 |
-48.000,00 |
-151.000,00 |
-387.000,00 |
-1.358.000,00 |
|
|
a) Issuance : 63201 |
1.860.000,00 |
191.000,00 |
127.000,00 |
140.000,00 |
0,00 |
|
|
2. Debts incurred with credit institutions (+). : 63203 |
0,00 |
0,00 |
127.000,00 |
140.000,00 |
0,00 |
|
|
3. Debts incurred with companies of the group and affiliates (+).:
63204 |
1.860.000,00 |
191.000,00 |
0,00 |
0,00 |
0,00 |
|
|
b) Repayment and amortization of : 63207 |
-54.666.000,00 |
-239.000,00 |
-278.000,00 |
-527.000,00 |
-1.358.000,00 |
|
|
2. Debts incurred with credit institutions (-).: 63209 |
-488.000,00 |
-239.000,00 |
0,00 |
-527.000,00 |
-1.358.000,00 |
|
|
3. Debts incurred with companies of the group and affiliates (-). :
63210 |
-53.105.000,00 |
0,00 |
-278.000,00 |
0,00 |
0,00 |
|
|
5. Other debts (-). : 63212 |
-1.073.000,00 |
0,00 |
0,00 |
0,00 |
0,00 |
|
|
11. Payments from
dividends and remunerations from other assets instruments. : 63300 |
0,00 |
0,00 |
1.366.000,00 |
-1.000.000,00 |
0,00 |
|
|
a) Dividends (-).: 63301 |
0,00 |
0,00 |
0,00 |
-1.000.000,00 |
0,00 |
|
|
b) Remuneration from other assets instruments (-).: 63302 |
0,00 |
0,00 |
1.366.000,00 |
0,00 |
0,00 |
|
|
12. Cash flows
for financing activities (9+10+11).: 63400 |
-52.806.000,00 |
-48.000,00 |
1.215.000,00 |
-1.387.000,00 |
-1.358.000,00 |
|
|
D) EFFECT OF
EXCHANGE RATE CHANGES: 64000 |
235.000,00 |
0,00 |
0,00 |
0,00 |
0,00 |
|
|
E) NET INCREASE/DECREASE
OF CASH OR EQUIVALENT ASSETS (+/-5+/-8+/12+/-D) : 65000 |
1.403.000,00 |
-868.000,00 |
3.357.000,00 |
-2.157.960,00 |
9.199.000,00 |
|
|
Cash or equivalent assets as of beginning of the fiscal year.:
65100 |
422.000,00 |
1.290.000,00 |
26.088.000,00 |
28.246.380,00 |
19.047.000,00 |
|
|
Cash or equivalent assets as of end of the fiscal year.: 65200 |
1.825.000,00 |
422.000,00 |
29.445.000,00 |
26.088.420,00 |
28.246.000,00 |
|
FINANCIAL
DIAGNOSIS
|
> Economic-Financial
Comparative Analysis
Data used in
the following ratios and indicators is taken from the Annual Accounts submitted
by the company to the TRADE REGISTER.
> Comparison
within the Sector
|
Cash Flow |
2013 |
2012 |
Variación 2013 -
2012 |
|
|||
|
|
Empresa |
Sector |
Empresa |
Sector |
Empresa |
Sector |
|
|
Cash Flow over
Sales: |
0,01 % |
0,02 % |
-1,25 % |
0,01 % |
100,41 % |
132,27 % |
|
|
EBITDA over
Sales: |
-4,67 % |
11,47 % |
-25,89 % |
9,23 % |
81,95 % |
24,30 % |
|
|
Cash Flow Yield:
|
0,01 % |
0,01 % |
-0,16 % |
0,00 % |
103,13 % |
|
|
|
Profitability |
2013 |
2012 |
Variación 2013 -
2012 |
|
|||
|
|
Empresa |
Sector |
Empresa |
Sector |
Empresa |
Sector |
|
|
Operating
economic profitability: |
-11,43 % |
7,13 % |
-34,24 % |
5,21 % |
66,62 % |
36,75 % |
|
|
Total economic
profitability: |
-6,40 % |
3,91 % |
-2,10 % |
2,49 % |
-204,52 % |
57,33 % |
|
|
Financial
profitability: |
-16,18 % |
4,61 % |
-2,53 % |
1,31 % |
-538,65 % |
252,45 % |
|
|
Margin: |
-7,32 % |
6,88 % |
-28,58 % |
4,85 % |
74,37 % |
41,82 % |
|
|
Mark-up: |
-8,15 % |
4,77 % |
-17,53 % |
1,58 % |
53,53 % |
201,23 % |
|
|
Solvency |
2013 |
2012 |
Variación 2013 -
2012 |
|
|||
|
|
Empresa |
Sector |
Empresa |
Sector |
Empresa |
Sector |
|
|
Liquidity: |
0,02 |
0,13 |
0,04 |
0,12 |
-51,43 |
15,42 |
|
|
Acid Test: |
0,71 |
0,86 |
5,67 |
0,85 |
-87,54 |
1,43 |
|
|
Working Capital /
Investment: |
0,02 |
0,05 |
0,31 |
0,03 |
-94,13 |
98,49 |
|
|
Solvency: |
1,11 |
1,18 |
5,70 |
1,17 |
-80,44 |
0,64 |
|
|
Indebtedness |
2013 |
2012 |
Variación 2013 -
2012 |
|
|||
|
|
Empresa |
Sector |
Empresa |
Sector |
Empresa |
Sector |
|
|
Indebtedness
level: |
1,13 |
1,35 |
0,12 |
1,63 |
819,41 |
-16,99 |
|
|
Borrowing
Composition: |
0,39 |
0,99 |
0,65 |
1,03 |
-40,98 |
-3,88 |
|
|
Repayment
Ability: |
104,33 |
77,23 |
-0,68 |
192,77 |
15.538,53 |
-59,94 |
|
|
Warranty: |
1,89 |
1,75 |
9,12 |
1,62 |
-79,29 |
7,93 |
|
|
Generated
resources / Total creditors: |
-0,08 |
0,09 |
-0,16 |
0,07 |
52,05 |
29,52 |
|
|
Efficiency |
2013 |
2012 |
Variación 2013 -
2012 |
|
|||
|
|
Empresa |
Sector |
Empresa |
Sector |
Empresa |
Sector |
|
|
Productivity:
|
0,67 |
1,88 |
-0,23 |
1,73 |
388,42 |
8,82 |
|
|
Turnover of
Collection Rights : |
4,02 |
5,10 |
5,62 |
4,79 |
-28,46 |
6,36 |
|
|
Turnover of
Payment Entitlements: |
3,45 |
3,68 |
0,81 |
3,52 |
325,56 |
4,79 |
|
|
Stock rotation:
|
7,97 |
7,40 |
292,50 |
6,49 |
-97,28 |
13,98 |
|
|
Assets turnover:
|
1,56 |
1,04 |
1,20 |
1,08 |
30,24 |
-3,58 |
|
|
Borrowing Cost:
|
3,13 |
2,83 |
1,56 |
2,95 |
101,12 |
-3,99 |
|
> Trend of
indicators under the General Accounting Plan of 2007 (2013, 2012, 2011, 2010,
2009)
|
Cash Flow |
2013 |
2012 |
2011 |
2010 |
2009 |
|
|
Cash Flow over Sales:
|
0,01 % |
-1,25 % |
0,03 % |
-0,02 % |
0,11 % |
|
|
EBITDA over
Sales: |
-4,67 % |
-25,89 % |
-7,43 % |
-2,99 % |
-6,25 % |
|
|
Cash Flow Yield:
|
0,01 % |
-0,16 % |
0,01 % |
-0,01 % |
0,04 % |
|
|
Profitability |
2013 |
2012 |
2011 |
2010 |
2009 |
|
|
Operating
economic profitability: |
-11,43 % |
-34,24 % |
-7,81 % |
-4,91 % |
-6,95 % |
|
|
Total economic
profitability: |
-6,40 % |
-2,10 % |
-1,31 % |
0,31 % |
-0,53 % |
|
|
Financial profitability:
|
-16,18 % |
-2,53 % |
-2,66 % |
-0,15 % |
-1,19 % |
|
|
Margin: |
-7,32 % |
-28,58 % |
-9,96 % |
-6,27 % |
-10,65 % |
|
|
Mark-up: |
-8,15 % |
-17,53 % |
-4,54 % |
-0,35 % |
-2,97 % |
|
|
Solvency |
2013 |
2012 |
2011 |
2010 |
2009 |
|
|
Liquidity: |
0,02 |
0,04 |
0,40 |
0,33 |
0,40 |
|
|
Acid Test: |
0,71 |
5,67 |
1,39 |
1,29 |
1,32 |
|
|
Working Capital /
Investment: |
0,02 |
0,31 |
0,16 |
0,15 |
0,15 |
|
|
Solvency: |
1,11 |
5,70 |
1,54 |
1,50 |
1,53 |
|
|
Indebtedness |
2013 |
2012 |
2011 |
2010 |
2009 |
|
|
Indebtedness
level: |
1,13 |
0,12 |
0,50 |
0,53 |
0,48 |
|
|
Borrowing
Composition: |
0,39 |
0,65 |
0,11 |
0,11 |
0,13 |
|
|
Repayment Ability:
|
104,33 |
-0,68 |
24,53 |
-40,86 |
8,72 |
|
|
Warranty: |
1,89 |
9,12 |
3,00 |
2,89 |
3,09 |
|
|
Generated
resources / Total creditors: |
-0,08 |
-0,16 |
-0,02 |
0,04 |
0,00 |
|
|
Efficiency |
2013 |
2012 |
2011 |
2010 |
2009 |
|
|
Productivity:
|
0,67 |
-0,23 |
0,39 |
0,68 |
0,56 |
|
|
Turnover of
Collection Rights : |
4,02 |
5,62 |
1,40 |
1,40 |
1,28 |
|
|
Turnover of
Payment Entitlements: |
3,45 |
0,81 |
1,25 |
1,31 |
0,93 |
|
|
Stock rotation:
|
7,97 |
292,50 |
9,56 |
6,87 |
6,31 |
|
|
Assets turnover:
|
1,56 |
1,20 |
0,78 |
0,78 |
0,65 |
|
|
Borrowing Cost:
|
3,13 |
1,56 |
1,50 |
1,30 |
1,42 |
|
COMPARATIVE SECTORIAL BALANCE
|
Sector-based Comparison under the rules of
the New General Accounting Plan.
|
|
Variación - |
|
|
|
Empresa |
Sector |
|
|
Variación - |
|
|
|
Empresa |
Sector |
|
|
Variación - |
|
|
|
Empresa |
Sector |
News
|
|
ABC |
08/02/2014 |
|
Acuerdo en Draka Cables para el despido de
22 empleados con 45 días por año |
|
|
Companies related |
|
|
|
|
|
Europa Press |
27/01/2014 |
|
Draka Cables presenta un ERE para despedir
a 30 empleados de Santa Perpètua (Barcelona) |
|
|
Companies related |
|
Public
Tenders and Works Won
|
No Public Tenders assigned to the name of
the company.
Detail of Subsidies appearing in Balances
Memories
|
|
Entity |
ORGANISMO NO
ESPECIFICADO |
|
Subsidy Concept |
Subvención de capital. |
|
Status |
CONCEDIDA |
|
Amount Granted |
115.000,00 |
|
Notes |
Dicho importe
corresponde al imputado a resultados del ejercicio, quedando un saldo al
cierre de 262.000,00 euros. Dicha subvención destinada a la financiación de maquinaria
y proyectos de I+D. |
|
Entity |
ORGANISMO NO
ESPECIFICADO |
|
Subsidy Concept |
Subvención de
capital. |
|
Status |
CONCEDIDA |
|
Amount Granted |
66.000,00 |
|
Notes |
Dicho importe
corresponde al imputado a resultados del ejercicio. |
|
Entity |
ORGANISMO NO
ESPECIFICADO |
|
Subsidy Concept |
Subvención de
capital. |
|
Status |
CONCEDIDA |
|
Amount Granted |
131.000,00 |
|
Notes |
El importe
reflejado corresponde al traspasado a resultados durante el ejercicio. Las subvenciones
han sido destinadas a la financiación de maquinaria y proyectos de I+D. Sin
embargo las recibidas durante el ejercicio fueron destinadas, exclusivamente,
a proyectos I+D. |
Research
Summary
|
|
Company founded for many years now, with experience
in its sector. Its billing was increased considerably in 2013 in comparison
with the previous year. The company has a positive working capital, so it
would be able to meet the payment obligatinos in a short term. |
Sources
|
|
Registry of Commerce's Official Gazette.
Own and external data bases Company References |
FOREIGN EXCHANGE RATES
|
Currency |
Unit
|
Indian Rupees |
|
US Dollar |
1 |
Rs.61.85 |
|
|
1 |
Rs.94.96 |
|
Euro |
1 |
Rs.69.10 |
INFORMATION DETAILS
|
Analysis Done by
: |
SUB |
|
|
|
|
Report Prepared
by : |
ANK |
RATING EXPLANATIONS
|
RATING |
STATUS |
PROPOSED CREDIT LINE |
|
|
>86 |
Aaa |
Possesses an extremely sound financial base with the strongest capability
for timely payment of interest and principal sums |
Unlimited |
|
71-85 |
Aa |
Possesses adequate working capital. No caution needed for credit
transaction. It has above average (strong) capability for payment of interest
and principal sums |
Large |
|
56-70 |
A |
Financial & operational base are regarded healthy. General
unfavourable factors will not cause fatal effect. Satisfactory capability for
payment of interest and principal sums |
Fairly Large |
|
41-55 |
Ba |
Overall operation is considered normal. Capable to meet normal
commitments. |
Satisfactory |
|
26-40 |
B |
Capability to overcome financial difficulties seems comparatively
below average. |
Small |
|
11-25 |
Ca |
Adverse factors are apparent. Repayment of interest and principal sums
in default or expected to be in default upon maturity |
Limited with
full security |
|
<10 |
C |
Absolute credit risk exists. Caution needed to be exercised |
Credit not
recommended |
|
-- |
NB |
New Business |
-- |
This score serves as a reference to assess
SC’s credit risk and to set the amount of credit to be extended. It is calculated
from a composite of weighted scores obtained from each of the major sections of
this report. The assessed factors and their relative weights (as indicated
through %) are as follows:
Financial
condition (40%) Ownership
background (20%) Payment record
(10%)
Credit history
(10%) Market trend (10%) Operational size
(10%)
This report is issued at your request without any
risk and responsibility on the part of MIRA INFORM PRIVATE LIMITED (MIPL)
or its officials.