MIRA INFORM REPORT
|
Report No. : |
309312 |
|
Report Date : |
10.03.2015 |
IDENTIFICATION DETAILS
|
Name : |
LABORATORIOS LESVI SL |
|
|
|
|
Registered Office : |
AV.Barcelona, 69, Sant Joan Despi, Barcelona-08970 |
|
|
|
|
Country : |
Spain |
|
|
|
|
Financials (as on) : |
201 |
|
|
|
|
Date of Incorporation : |
02.01.1967 |
|
|
|
|
Legal Form : |
Private Company |
|
|
|
|
Line of Business : |
Subject is manufacture of pharmaceutical preparations |
|
|
|
|
No. of Employee : |
250 |
RATING & COMMENTS
|
MIRA’s Rating : |
Ba |
|
RATING |
STATUS |
PROPOSED CREDIT LINE |
|
|
41-55 |
Ba |
Overall operation is considered normal. Capable to meet normal
commitments. |
Satisfactory |
|
Status : |
Satisfactory |
|
|
|
|
Payment Behaviour : |
Slow but correct |
|
|
|
|
Litigation : |
Clear |
NOTES :
Any query related to this report can be made
on e-mail : infodept@mirainform.com
while quoting report number, name and date.
ECGC Country Risk Classification List – December 31, 2014
|
Country Name |
Previous Rating (30.09.2014) |
Current Rating (31.12.2014) |
|
Spain |
A1 |
A1 |
|
Risk Category |
ECGC
Classification |
|
Insignificant |
A1 |
|
Low |
A2 |
|
Moderate |
B1 |
|
High |
B2 |
|
Very High |
C1 |
|
Restricted |
C2 |
|
Off-credit |
D |
SPAIN - ECONOMIC OVERVIEW
Spain experienced a prolonged recession in the wake of the global financial crisis. GDP contracted by 3.7% in 2009, ending a 16-year growth trend, and continued contracting through most of 2013. Economic growth resumed in late 2013, albeit only modestly, as credit contraction in the private sector, fiscal austerity, and high unemployment continued to weigh on domestic consumption and investment. Exports, however, have been resilient throughout the economic downturn, partially offsetting declines in domestic consumption and helped to bring Spain's current account into surplus in 2013 for the first time since 1986. The unemployment rate rose from a low of about 8% in 2007 to more than 26% in 2013, straining Spain's public finances as spending on social benefits increased while tax revenues fell. Spain’s budget deficit peaked at 11.4% of GDP in 2009. Spain gradually reduced the deficit to just under 7% of GDP in 2013, slightly above the 6.5% target negotiated between Spain and the EU. Public debt has increased substantially – from 60.1% of GDP in 2010 to 93.4% in 2013. Rising labor productivity, moderating labor costs, and lower inflation have helped to improve foreign investor interest in the economy and to reduce government borrowing costs. The government's ongoing efforts to implement reforms - labor, pension, health, tax, and education - are aimed at supporting investor sentiment. The government also has shored up struggling banks exposed to Spain's depressed domestic construction and real estate sectors by successfully completing an EU-funded restructuring and recapitalization program in December 2013.
|
Source
: CIA |
EXECUTIVE
SUMMARY
|
|
|
|
|
|
Name: |
LABORATORIOS LESVI SL |
|
NIF
/ Fiscal code: |
B08165789 |
|
Trade
Name |
LESVI |
|
Status: |
ACTIVE
WITH PARTIAL DIVISION OF CAPITAL |
|
Incorporation
Date: |
02/01/1967 |
|
Register Data |
Register
Section 8 Sheet 24474 |
|
Last Publication in BORME: |
15/10/2014
[Appointments] |
|
Last
Published Account Deposit: |
2013 |
|
Share
Capital: |
10.149.928,40 |
|
|
|
|
Localization: |
AV.BARCELONA,
69 - SANT JOAN DESPI - 08970 - BARCELONA |
|
Telephone
- Fax - Email - Website: |
Ph.:.
934 759 600 Email. info@invent-farma.com Website. www.lesvi.com |
|
|
|
|
Activity: |
|
|
NACE: |
2120
- Manufacture of pharmaceutical preparations |
|
Registered
Trademarks: |
|
|
Audited
/ Opinion: |
Si
/ |
|
Tenders
and Awards: |
5
for a total cost of 0 |
|
Subsidies: |
6
for a total cost of 190037 |
|
Main
products / services: |
Principios
activos farmacéuticos (API) Especialidades farmacéuticas |
|
Quality
Certificate: |
No |
|
|
|
|
|
|
|
|
|
|
|
|
|
|
|
Number |
Amount
(€) |
Most
Recent Entry |
|
Insolvency
Proceedings, Bankruptcy and Suspension of Payments |
|
Unpublished |
--- |
--- |
|
Defaults
on debt with Financial Institutions and Large Companies |
|
None |
--- |
--- |
|
Judicial
Claims (Notices, Executive Proceedings, Attachments, Auctions, Bad Debt) |
|
None |
0 |
--- |
|
Proceedings
heard by the Civil Court |
|
Unpublished |
0 |
--- |
|
Proceedings
heard by the Labour Court |
|
Unpublished |
0 |
--- |
|
|
|
Partners: |
|
|
|
INVENT
FARMA SL |
100
% |
|
|
Shares: |
2 |
|
|
Other
Links: |
6 |
|
|
No.
of Active Corporate Bodies: |
SINGLE
ADMINISTRATOR 1 |
|
|
Ratios |
2013 |
2012 |
Change |
|
|
Nº
of employees: |
250 |
|
|
|
|
|
|
|
Guarantees: |
|
|
Properties
Registered: |
Company
NO, Administrator NO |
|
Financing
/ Guarantee Sources : |
Sources
YES, Guarantees YES |
|
|
|
|
|
|
|
INVESTIGATION
SUMMARY |
|
|
Company
founded in 1967 engaged in the manufacture and commercialisation of active
pharmaceutical ingredients and pharmaceutical specialities. National and
international business scope. Nothing appears against it in the sources
consulted an although the latest figures presented in the trade register
(31-12-2013), we note that drags a loss carryforwards of 1,763,395 Euro / s,
we believe that the can follow normal operations relating to risk, although
it would be necessary to monitor their evolution |
|
|
Interviewed
Person: |
|
|
Identification
|
|
|
Social Denomination: |
LABORATORIOS LESVI SL |
|
Trade Name: |
LESVI |
|
NIF / Fiscal code: |
B08165789 |
|
Corporate Status: |
ACTIVE WITH PARTIAL
DIVISION OF CAPITAL |
|
Start of activity: |
1974 |
|
Registered Office: |
AV.BARCELONA, 69 |
|
Locality: |
SANT JOAN DESPI |
|
Province: |
BARCELONA |
|
Postal Code: |
08970 |
|
Telephone: |
934 759 600 |
|
Fax: |
933 733 020 |
|
Website: |
www.lesvi.com |
|
Email: |
info@invent-farma.com |
|
Interviewed Person: |
This information was
obtained through indirect sources, due to the refusal by the responsible
members of society to provide any collaboration for the preparation of this
document.. |
|
Activity
|
|
|
NACE: |
2120 |
|
Additional Information: |
Manufacture and
commercialisation of active pharmaceutical ingredients and pharmaceutical
specialities. Additional Address: The registered office, offices and branches
are indicated in the headline of this document. |
|
Franchise: |
No |
|
Import / export: |
EXPORTS |
|
Future Perspective: |
Consolidation |
|
Main
products / services
|
|
|
|
|
|
Product |
% Over Sales |
|
Principios activos farmacéuticos (API) |
|
|
Especialidades farmacéuticas |
|
|
Number
of Employees
|
|
|
|
|
|
|
Year |
No. of employees |
Established |
Incidentals |
|
|
|
2013 |
250 |
|
|
|
|
Chronological
Summary
|
|||
|
|
|
|
|
|
|
Year |
Act |
|
|
|
1990 |
Accounts deposit (ejer. 1989) Appointments/ Re-elections (1)
Cessations/ Resignations/ Reversals (1) |
|
|
|
1991 |
Accounts deposit (ejer. 1990) Appointments/ Re-elections (2) |
|
|
|
1992 |
Accounts deposit (ejer. 1991) Adaptation to Law (1) Change of Social
Purpose (1) |
|
|
|
1993 |
Appointments/ Re-elections (1) |
|
|
|
1994 |
Accounts deposit (ejer. 1992, 1993) |
|
|
|
1995 |
Accounts deposit (ejer. 1994) Appointments/ Re-elections (2)
Cessations/ Resignations/ Reversals (1) |
|
|
|
1996 |
Accounts deposit (ejer. 1995) Appointments/ Re-elections (3)
Cessations/ Resignations/ Reversals (1) Modification of Powers (1) |
|
|
|
1997 |
Accounts deposit (ejer. 1996) Appointments/ Re-elections (9)
Cessations/ Resignations/ Reversals (4) Statutory Modifications (1) |
|
|
|
1998 |
Accounts deposit (ejer. 1997) Appointments/ Re-elections (8) Cessations/
Resignations/ Reversals (3) |
|
|
|
1999 |
Accounts deposit (ejer. 1998) |
|
|
|
2000 |
Accounts deposit (ejer. 1999) Appointments/ Re-elections (5)
Cessations/ Resignations/ Reversals (3) |
|
|
|
2001 |
Accounts deposit (ejer. 2000) Appointments/ Re-elections (4)
Cessations/ Resignations/ Reversals (1) Modification of Powers (2) |
|
|
|
2002 |
Accounts deposit (ejer. 2001) Appointments/ Re-elections (4) Change of
Social address (1) Modification of Powers (1) |
|
|
|
2003 |
Accounts deposit (ejer. 2002) Appointments/ Re-elections (1)
Cessations/ Resignations/ Reversals (2) Company Transformation (1) Declaration
of Sole Propietorship (1) Other Concepts/ Events (1) |
|
|
|
2004 |
Accounts deposit (ejer. 2003) Appointments/ Re-elections (10)
Cessations/ Resignations/ Reversals (5) Declaration of Sole Propietorship (1)
Errata (1) Increase of Capital (1) Loss of the sole propietorship condition
(1) Other Concepts/ Events (1) |
|
|
|
2005 |
Accounts deposit (ejer. 2004) Appointments/ Re-elections (4) Cessations/
Resignations/ Reversals (4) Declaration of Sole Propietorship (1) Errata (1)
Increase of Capital (1) Loss of the sole propietorship condition (1) Other
Concepts/ Events (3) Statutory Modifications (2) |
|
|
|
2006 |
Accounts deposit (ejer. 2005) Appointments/ Re-elections (1) Capital
Reduction (3) Cessations/ Resignations/ Reversals (1) Increase of Capital (1)
Partial split (6) |
|
|
|
2007 |
Accounts deposit (ejer. 2006) Appointments/ Re-elections (1) Cessations/
Resignations/ Reversals (1) |
|
|
|
2008 |
Accounts deposit (ejer. 2007) Appointments/ Re-elections (1)
Cessations/ Resignations/ Reversals (1) |
|
|
|
2009 |
Appointments/ Re-elections (1) |
|
|
|
2010 |
Accounts deposit (ejer. 2008, 2009) |
|
|
|
2011 |
Accounts deposit (ejer. 2010) Appointments/ Re-elections (1) |
|
|
|
2012 |
Accounts deposit (ejer. 2011) |
|
|
|
2013 |
Accounts deposit (ejer. 2012) Appointments/ Re-elections (2) Cessations/
Resignations/ Reversals (2) |
|
|
|
2014 |
Accounts deposit (ejer. 2013) Appointments/ Re-elections (5)
Cessations/ Resignations/ Reversals (1) |
|
|
Breakdown
of Owners' Equity
|
|
|
Registered Capital: |
10.149.928,40 |
|
Paid up capital: |
10.149.928,40 |
|
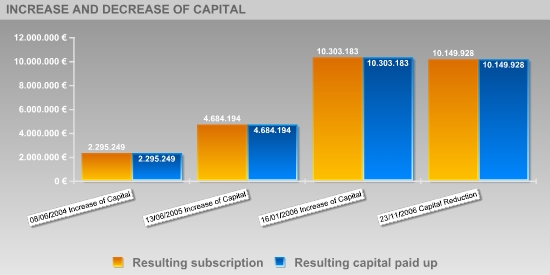
Updated
Evolution of the Subscribed and Paid-in Capital
|
|||||
|
|
|
|
|
|
|
|
|
|||||
|
|
|
|
|
|
|
|
Publishing Date |
Registration Type |
Capital Subscribed |
Paid up capital |
Underwritten result |
Disbursed Result |
|
08/06/2004 |
Increase of Capital |
2.218.321 |
2.218.321 |
2.295.249 |
2.295.249 |
|
13/06/2005 |
Increase of Capital |
2.388.945 |
2.388.945 |
4.684.194 |
4.684.194 |
|
16/01/2006 |
Increase of Capital |
5.618.989 |
5.618.989 |
10.303.183 |
10.303.183 |
|
23/11/2006 |
Capital Reduction |
-153.255 |
-153.255 |
10.149.928 |
10.149.928 |
|
Active
Social Bodies
|
|
|
|
|
|
Post published |
Social Body's Name |
Appointment Date |
Other Positions in this Company |
|
SINGLE PARTNER |
INVEST FARMA SL |
12/09/2005 |
1 |
|
SINGLE ADMINISTRATOR |
INVENT FARMA SL |
13/06/2005 |
1 |
|
JOINT ATTORNEY |
MARIN SERRET PABLO |
08/10/2014 |
1 |
|
JOINT ATTORNEY/COMBINED PROXY |
FERNANDEZ GONZALEZ JOSE RAMON |
08/10/2014 |
1 |
|
PROXY |
OLIVA SEGU JOAN |
09/06/2009 |
3 |
|
|
MARIMON PAGES ANTONIO |
05/07/2006 |
5 |
|
|
FUENTES MONTIEL MARIA JOSE |
31/05/2005 |
3 |
|
|
CABRE VACAS FRANCESC |
29/12/2004 |
1 |
|
|
THORSTEN JAURSCH |
29/12/2004 |
2 |
|
|
SAPERAS PLANA JOSEP |
29/12/2004 |
1 |
|
|
VEGA RODRIGUEZ CARMEN |
29/12/2004 |
1 |
|
|
VALLES RODOREDA ENRIC |
02/07/1996 |
6 |
|
REPRESENTATIVE |
FRIDRIK STEINN KRISTJANSSON |
27/12/2013 |
1 |
|
ACCOUNTS' AUDITOR / HOLDER |
PRICEWATERHOUSECOOPERS AUDITORES SL |
07/08/2014 |
2 |
|
Historical Social Bodies |
|
|
|
|
|
Social Body's Name |
Post published |
End Date |
Other Positions in this Company |
|
AZUARA DANIS PEDRO MANUEL |
NON CONSELLOR SECRETARY |
10/01/1998 |
1 |
|
BALLANO ALBERT EVA |
REPRESENTATIVE |
20/01/1997 |
3 |
|
|
MEMBER OF THE BOARD |
23/08/2002 |
|
|
|
MEMBER OF THE BOARD |
14/08/2003 |
|
|
BIEL ANDRES ALEJANDRO |
GENERAL MANAGER |
04/12/1997 |
3 |
|
|
PROXY |
04/12/1997 |
|
|
|
PROXY |
31/05/2005 |
|
|
BRACONS CLAPES JUAN MARIA |
PROXY |
29/12/2004 |
1 |
|
CANOVAS SOLER PEDRO |
PROXY |
29/12/2004 |
1 |
|
CC AUDITORES SA |
ACCOUNTS' AUDITOR / HOLDER |
16/08/1993 |
5 |
|
|
ACCOUNTS' AUDITOR / HOLDER |
08/10/1996 |
|
|
|
ACCOUNTS' AUDITOR / HOLDER |
13/09/1997 |
|
|
|
ACCOUNTS' AUDITOR / HOLDER |
31/07/1998 |
|
|
|
ACCOUNTS' AUDITOR / HOLDER |
15/03/2000 |
|
|
DELOITTE SL |
ACCOUNTS' AUDITOR / HOLDER |
17/12/2008 |
1 |
|
FUENTES MONTIEL MARIA JOSE |
PROXY |
31/05/2005 |
3 |
|
|
PROXY |
29/12/2004 |
|
|
GINER ARTIGAS ANTONIO |
PROXY |
21/02/2003 |
2 |
|
|
PROXY |
15/04/1998 |
|
|
LABORATORIOS VITA SA |
SINGLE ADMINISTRATOR |
11/08/2004 |
2 |
|
|
SINGLE PARTNER |
11/08/2004 |
|
|
MALAGARRIGA GUERRERO JOSE LUIS |
PROXY |
28/06/2002 |
7 |
|
|
REPRESENTATIVE |
11/08/2004 |
|
|
|
PROXY |
29/12/2004 |
|
|
|
SINGLE ADMINISTRATOR |
13/06/2005 |
|
|
|
SINGLE PARTNER |
13/06/2005 |
|
|
|
REPRESENTATIVE |
27/12/2013 |
|
|
|
PROXY |
27/12/2013 |
|
|
MARIMON PAGES ANTONIO |
PROXY |
29/12/2004 |
5 |
|
|
PROXY |
26/02/1998 |
|
|
|
PROXY |
31/05/2005 |
|
|
|
PROXY |
05/07/2006 |
|
|
MARTI GRAU ANTONIO |
MEMBER OF THE BOARD |
23/08/2002 |
6 |
|
|
MEMBER OF THE BOARD |
14/08/2003 |
|
|
|
VICE CHAIRMAN |
12/09/2000 |
|
|
|
MEMBER OF THE BOARD |
18/02/1998 |
|
|
|
GENERAL MANAGER |
18/02/1998 |
|
|
|
MEMBER OF THE BOARD |
02/07/1996 |
|
|
MAÑE NAVARRO JOSE MARIA |
PROXY |
02/02/2000 |
3 |
|
|
PROXY |
15/05/2000 |
|
|
|
PROXY |
15/05/2000 |
|
|
MERCADE MEROLA FRANCISCO JAVIER |
PROXY |
26/09/2001 |
4 |
|
|
PROXY |
26/09/2001 |
|
|
|
PROXY |
29/12/2004 |
|
|
|
PROXY |
31/05/2005 |
|
|
MIMBRERA DOMINGO MARIA CRUZ |
PROXY |
29/12/2004 |
2 |
|
|
PROXY |
15/05/2000 |
|
|
NIETO RODRIGUEZ PEDRO JOSE |
PROXY |
18/02/1998 |
2 |
|
|
PROXY |
03/09/2001 |
|
|
OLIVA SEGU JOAN |
PROXY |
29/12/2004 |
3 |
|
|
PROXY |
09/06/2009 |
|
|
ORIOL BOSCH JOSE |
PROXY |
29/12/2004 |
2 |
|
|
NON CONSELLOR SECRETARY |
14/08/2003 |
|
|
PLANELLA BORI SANTIAGO |
REPRESENTATIVE |
14/08/2003 |
4 |
|
|
GENERAL MANAGER |
29/12/2004 |
|
|
|
PROXY |
29/12/2004 |
|
|
|
REPRESENTATIVE |
23/08/2002 |
|
|
PLANELLA ROS SANTIAGO |
MEMBER OF THE BOARD |
12/11/1990 |
7 |
|
|
MEMBER OF THE BOARD |
12/09/2000 |
|
|
|
PRESIDENT |
12/09/2000 |
|
|
|
PRESIDENT |
14/08/2003 |
|
|
|
MEMBER OF THE BOARD |
14/08/2003 |
|
|
|
PRESIDENT |
07/09/1995 |
|
|
|
MEMBER OF THE BOARD |
07/09/1995 |
|
|
PRICE WATERHOUSE COOPERS AUDITORES SL |
ACCOUNTS' AUDITOR / HOLDER |
17/01/2007 |
4 |
|
|
ACCOUNTS' AUDITOR / HOLDER |
23/11/2011 |
|
|
|
ACCOUNTS' AUDITOR / HOLDER |
21/01/2013 |
|
|
|
ACCOUNTS' AUDITOR / HOLDER |
08/01/2014 |
|
|
PRICEWATERHOUSECOOPERS AUDITORES SL |
ACCOUNTS' AUDITOR / HOLDER |
07/08/2014 |
2 |
|
PROMOCIONES PB SL |
MEMBER OF THE BOARD |
14/08/2003 |
3 |
|
|
MEMBER OF THE BOARD |
13/09/2001 |
|
|
|
MEMBER OF THE BOARD |
23/08/2002 |
|
|
SEGOL SL |
VICE CHAIRMAN |
23/08/2002 |
10 |
|
|
MEMBER OF THE BOARD |
23/08/2002 |
|
|
|
MEMBER OF THE BOARD |
14/08/2003 |
|
|
|
VICE CHAIRMAN |
14/08/2003 |
|
|
|
GENERAL MANAGER |
29/12/2004 |
|
|
|
PROXY |
29/12/2004 |
|
|
|
VICE CHAIRMAN |
13/09/2001 |
|
|
|
VICE CHAIRMAN |
18/02/1998 |
|
|
|
MEMBER OF THE BOARD |
20/01/1997 |
|
|
|
PROXY |
20/01/1997 |
|
|
THORSTEN JAURSCH |
PROXY |
29/12/2004 |
2 |
|
VALLES RODOREDA ENRIC |
MEMBER OF THE BOARD |
20/01/1997 |
6 |
|
|
REPRESENTATIVE |
23/08/2002 |
|
|
|
REPRESENTATIVE |
14/08/2003 |
|
|
|
VICE CHAIRMAN |
20/01/1997 |
|
|
|
GENERAL MANAGER |
20/01/1997 |
|
|
VALLES SACASAS MARTIN |
MEMBER OF THE BOARD |
12/11/1990 |
5 |
|
|
MEMBER OF THE BOARD |
07/09/1995 |
|
|
|
MEMBER OF THE BOARD |
02/07/1996 |
|
|
|
VICE CHAIRMAN |
07/09/1995 |
|
|
|
VICE CHAIRMAN |
11/10/1995 |
|
|
WOLFGANG JOHANNES STORF |
JOINT ATTORNEY |
22/05/2014 |
1 |
Defaults,
Legal Claims and Insolvency Proceedings
|
|
|
|
|
Section enabling assessment of the degree of compliance of the company queried
with its payment obligations. It provides information on the existence and
nature of all stages of Insolvency and Legal Proceedings published with
reference to the Company in the country's various Official Bulletins and
national newspapers, as well Defaults Registered in the main national credit
bureaus (ASNEF Industrial and RAI ).
>
Summary
Chronological
summary
|
|
|
Number
of Publications |
Amount
(_) |
Start
date |
End
date |
|
Insolvency
Proceedings, Bankruptcy and Suspension of Payments |
|
Unpublished |
--- |
--- |
--- |
|
Request/Declaration |
|
0 |
--- |
date |
|
|
Proceedings |
|
--- |
--- |
|
--- |
|
Resolution |
|
--- |
--- |
|
--- |
|
Defaults
on debt with Financial Institutions and Large Companies |
Bank
and Commercial Delinquency |
None |
0 |
|
|
|
Status:
Friendly |
|
--- |
|
|
|
|
Status:
Pre-Litigation |
|
--- |
|
|
|
|
Status:
Litigation |
|
--- |
|
|
|
|
Status:
Non-performing |
|
--- |
|
|
|
|
Status:
insolvency proceedings, bankruptcy and suspension of payments |
|
--- |
|
|
|
|
Other
status |
|
--- |
|
|
|
|
Legal
and Administrative Proceedings |
|
Unpublished |
--- |
|
|
|
Notices
of defaults and enforcement |
|
--- |
--- |
|
--- |
|
Seizures |
|
--- |
--- |
|
--- |
|
Auctions |
|
--- |
--- |
|
--- |
|
Declarations
of insolvency and bad debt |
|
--- |
--- |
|
--- |
|
Proceedings
heard by the Civil Court |
|
Unpublished |
--- |
|
|
|
Proceedings
heard by the Labour Court |
|
Unpublished |
--- |
|
|
> Details
> Basis for scoring
|
Positive Factors |
Adverse Factors |
|
No judicial claims have been detected
in the Official Gazettes, regarding any Entity's outstanding debts with the
Tax Bureau or Social Security administrations, as submitted by Courts of the
various court jurisdictions. |
Possible difficulty accessing financing.
Uncertainties about economic recovery will hinder access to credit for new
projects or for obtaining the liquidity necessary for short-term needs. |
|
No irregular payment
performance has been detected based on information obtained from credit bureaus. |
Audit qualifications . The
company has submitted the audit with a qualified opinion, indicating that the
financial statements may not reflect the true picture because of the
existence of circumstances that may be significant. |
|
Adequate level of financial
autonomy. The financial autonomy of the entity represents the 34.39 %. In
principle, an increase in this ratio would indicate an improvement in the
corporate's balace sheets. |
Among the companies with
similar characteristics, LABORATORIOS LESVI SL is located in one of the
autonomous communities that have shown lesser business development in Spain.
In principle, this feature hinders the consolidation of companies. |
|
The current debt represents a
13.01of the financial structure. In principle, a decrease in this ratio would
indicate an improvement in the short-term financial situation. |
|
|
LABORATORIOS LESVI SL obtains
economic profitability from the necessary investments in the development of
its activity in comparison with its assets. |
|
Probability
of default
|
|
|
|
|
> Estimated Probability
of Default for the next 12 months: 0.917 %
|
Sector
in which comparison is carried out: 212 Manufacture
of pharmaceutical preparations |
|
|
Relative
Position:
|
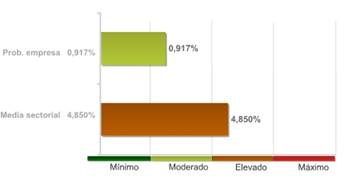
The
company's comparative analysis with the rest of the companies that comprise the
sector, shows the company holds a better position with regard to the
probability of non-compliance.
The
78.00% of the companies of the sector LABORATORIOS LESVI SL belongs to show a
higher probability of non-compliance.
The
probability of the company's non-compliance with its payment obligations within
deadlines estimated by our qualifications models is 0.917%.
In
the event they fail to comply with the payment, the seriousness of the loss
will depend on factors such as the promptness of the commencement of the
charging management, the existence of executive documents which match the
credit or the existence of guarantees and free debt assets under the name of
the debtor. Therefore, the probability of non-compliance should not be
solely interpreted as the total loss of the owed amount.
|
Result of query submitted to the
R.A.I. (Spanish Bad Debt Register) on |
LEGAL
CLAIMS
|
|
|
|
|
|
Summary
of Judicial Claims |
|
|
|
|
|
|
|
|
||
|
|
|
No
se han publicado |
|
|
|
|
No
se han publicado |
|
|
|
|
||
|
|
|
No
se han publicado |
|
|
|
|
No
se han publicado |
|
|
|
|
No
se han publicado |
|
|
|
|
No
se han publicado |
|
|
|
|
||
|
|
|
No
se han publicado |
|
|
|
|
No
se han publicado |
|
|
|
|
||
|
|
|
No
se han publicado |
|
|
Link
List
|
|
|
|
|
|
HAS IN ITS ADMINISTRATION
BOARD TO: |
1 Entities |
|
IS RELATED WITH: |
4 Entities |
|
PARTICIPATES IN: |
2 Entities |
|
SE ESCINDE PARCIALMENTE
EN: |
1 Entities |
|
SHAREHOLDERS: |
1 Entities |
> Shareholders
|
Relationship |
Entity |
Province |
Shareholding stake |
|
SHAREHOLDERS |
INVENT FARMA SL |
BARCELONA |
100 |
|
PARTICIPATES IN |
QUALIGEN SL |
BARCELONA |
91.46 |
|
|
LABORATORIOS DOMAC SL |
BARCELONA |
30.28 |
> Other relationships
|
Relationship |
Entity |
Province |
Shareholding stake |
|
IS RELATED WITH |
| | |
|
|
|
|
LESVI SL |
MADRID |
|
|
|
INVENT FARMA SL |
BARCELONA |
100 |
|
|
DOMAC, S.L. |
|
|
|
|
INVENT FARMA PVT |
|
|
|
SE ESCINDE PARCIALMENTE EN |
INVENT FARMA SL |
BARCELONA |
|
|
HAS IN ITS ADMINISTRATION
BOARD TO |
INVENT FARMA SL |
BARCELONA |
|
|
Turnover
|
|
|
Total Sales 2013 |
43.705.028 |
The last accounts deposit
which appears in the trade register corresponds to the close of its financial
year to date of 31-12-2013 and we state that in spite of its profit of
4.353.249 Euros, the company had loss of previous financial years of -1.763.395
Euros. Given the above, we can not include the usual figures, due to the fact
we do not know the commercial evaluaton indicator of its last financial year.
|
Financial
Accounts and Balance Sheets
|
|
|
|
|
Financial Years Presented
|
Ejercicio |
Tipo
de Cuentas Anuales |
Fecha
Presentacion |
|
2013 |
Normales |
August
2014 |
|
2012 |
Normales |
July
2013 |
|
2011 |
Normales |
September
2012 |
|
2010 |
Normales |
August
2011 |
|
2009 |
Normales |
July
2010 |
|
2008 |
Normales |
April
2010 |
|
2007 |
Normales |
August
2008 |
|
2006 |
Normales |
August
2007 |
|
2005 |
Normales |
July
2006 |
|
2004 |
Normales |
July
2005 |
|
2003 |
Normales |
July
2004 |
|
2002 |
Normales |
September
2003 |
|
2001 |
Normales |
July
2002 |
|
2000 |
Normales |
August
2001 |
|
1999 |
Normales |
August
2000 |
|
1998 |
Normales |
September
1999 |
|
1997 |
Normales |
August
1998 |
|
1996 |
Normales |
September
1997 |
|
1995 |
Normales |
September
1996 |
|
1994 |
Normales |
July
1995 |
|
1993 |
Normales |
November
1994 |
|
1992 |
Normales |
March
1994 |
|
1991 |
Normales |
July
1992 |
|
1990 |
Normales |
August
1991 |
|
1989 |
Normales |
July
1990 |
The data in the report regarding the last Company Accounts submitted by the company is taken from the TRADE REGISTER serving the region in which the company's address is located 31/12/2013
> Balance en formato Normal de acuerdo al Nuevo Plan General Contable 2007
Information corresponding to the fiscal year 2013 2012 2011 2010 2009 is taken from information submitted to the TRADE REGISTER. Data corresponding to fiscal years before 2013 2012 2011 2010 2009 has been compiled based on the equivalence criteria stipulated in Act JUS/206/2009. Where the provisions of the Act did not establish relevant equivalence criteria, created such criteria using its own methodology. To view details on the methodology.
|
|
ORIGINAL |
ORIGINAL |
ORIGINAL |
ORIGINAL |
ORIGINAL |
|
|
Assets |
2013 |
2012 |
2011 |
2010 |
2009 |
|
|
A)
NON-CURRENT ASSETS: 11000 |
50.414.625,00 |
46.822.431,00 |
37.537.192,00 |
41.702.327,00 |
46.292.541,00 |
|
|
I. Intangible fixed assets : 11100 |
10.841.075,00 |
9.460.315,00 |
16.097.409,00 |
19.339.661,00 |
20.669.546,00 |
|
|
1. Development: 11110 |
0,00 |
9.460.315,00 |
16.097.409,00 |
3.435.154,00 |
1.758.785,00 |
|
|
2. Concessions: 11120 |
0,00 |
0,00 |
0,00 |
0,00 |
0,00 |
|
|
3. Patents, licencing, trade marks and
similar: 11130 |
0,00 |
0,00 |
0,00 |
15.827.867,00 |
18.831.798,00 |
|
|
4. Goodwill: 11140 |
0,00 |
0,00 |
0,00 |
0,00 |
0,00 |
|
|
5. IT applications: 11150 |
0,00 |
0,00 |
0,00 |
76.640,00 |
78.963,00 |
|
|
6. Investigation: 11160 |
0,00 |
0,00 |
0,00 |
0,00 |
0,00 |
|
|
7. Intellectual property: 11180 |
0,00 |
0,00 |
0,00 |
0,00 |
0,00 |
|
|
8. Greenhouse gas emission allowance:
11190 |
0,00 |
0,00 |
0,00 |
0,00 |
0,00 |
|
|
9. Other intangible fixed assets. :
11170 |
0,00 |
0,00 |
0,00 |
0,00 |
0,00 |
|
|
II. Tangible fixed assets : 11200 |
5.519.374,00 |
5.118.514,00 |
4.615.437,00 |
5.100.490,00 |
4.369.736,00 |
|
|
1. Land and buildings: 11210 |
0,00 |
0,00 |
0,00 |
0,00 |
0,00 |
|
|
2. Technical installations and other
tangible fixed assets: 11220 |
0,00 |
5.118.514,00 |
4.615.437,00 |
3.380.327,00 |
4.211.864,00 |
|
|
3. Tangible asset in progress and
advances: 11230 |
0,00 |
0,00 |
0,00 |
1.720.163,00 |
157.872,00 |
|
|
III. Real estate investment: 11300 |
0,00 |
0,00 |
0,00 |
0,00 |
0,00 |
|
|
1. Land: 11310 |
0,00 |
0,00 |
0,00 |
0,00 |
0,00 |
|
|
2. Buildings: 11320 |
0,00 |
0,00 |
0,00 |
0,00 |
0,00 |
|
|
IV. Long-term investments in Group companies and associates :
11400 |
19.420.220,00 |
18.273.369,00 |
2.190.903,00 |
2.548.352,00 |
7.915.322,00 |
|
|
1. Equity instruments: 11410 |
1.220.220,00 |
2.976.297,00 |
2.190.903,00 |
2.548.352,00 |
4.132.131,00 |
|
|
2. Credits to businesses: 11420 |
18.200.000,00 |
15.297.072,00 |
0,00 |
0,00 |
3.783.191,00 |
|
|
3. Debt securities: 11430 |
0,00 |
0,00 |
0,00 |
0,00 |
0,00 |
|
|
4. Derivatives : 11440 |
0,00 |
0,00 |
0,00 |
0,00 |
0,00 |
|
|
5. Other financial assets : 11450 |
0,00 |
0,00 |
0,00 |
0,00 |
0,00 |
|
|
6. Other investments: 11460 |
0,00 |
0,00 |
0,00 |
0,00 |
0,00 |
|
|
V. Long-term financial investments: 11500 |
334.673,00 |
372.718,00 |
468.785,00 |
2.069.673,00 |
2.074.673,00 |
|
|
1. Equity instruments: 11510 |
0,00 |
0,00 |
0,00 |
0,00 |
0,00 |
|
|
2. Credits to third parties : 11520 |
0,00 |
0,00 |
0,00 |
0,00 |
0,00 |
|
|
3. Debt securities: 11530 |
0,00 |
0,00 |
0,00 |
0,00 |
0,00 |
|
|
4. Derivatives : 11540 |
0,00 |
0,00 |
0,00 |
0,00 |
0,00 |
|
|
5. Other financial assets : 11550 |
334.673,00 |
372.718,00 |
468.785,00 |
2.069.673,00 |
2.074.673,00 |
|
|
6. Other investments: 11560 |
0,00 |
0,00 |
0,00 |
0,00 |
0,00 |
|
|
VI. Assets for deferred tax : 11600 |
14.299.283,00 |
13.597.515,00 |
14.164.658,00 |
12.644.151,00 |
11.263.264,00 |
|
|
VII. Non-current trade debts : 11700 |
0,00 |
0,00 |
0,00 |
0,00 |
0,00 |
|
|
B)
CURRENT ASSETS: 12000 |
18.799.804,00 |
19.909.439,00 |
19.114.162,00 |
15.271.345,00 |
13.369.278,00 |
|
|
I. Non-current assets held for sale : 12100 |
0,00 |
0,00 |
0,00 |
0,00 |
0,00 |
|
|
II. Stocks: 12200 |
6.265.022,00 |
6.355.217,00 |
7.589.106,00 |
6.347.905,00 |
4.850.135,00 |
|
|
1. Commercial: 12210 |
0,00 |
0,00 |
0,00 |
0,00 |
0,00 |
|
|
2. Primary material and other supplies:
12220 |
3.718.631,00 |
6.355.217,00 |
7.589.106,00 |
2.690.015,00 |
2.170.896,00 |
|
|
3. Work in progress: 12230 |
2.100.566,00 |
0,00 |
0,00 |
1.865.401,00 |
1.127.532,00 |
|
|
a) Of long-term
production cycle : 12231 |
0,00 |
0,00 |
0,00 |
0,00 |
0,00 |
|
|
b) Of short-term
production cycle : 12232 |
2.100.566,00 |
0,00 |
0,00 |
0,00 |
0,00 |
|
|
4. Finished goods: 12240 |
403.645,00 |
0,00 |
0,00 |
1.646.043,00 |
1.545.320,00 |
|
|
a) Of long-term
production cycle : 12241 |
0,00 |
0,00 |
0,00 |
0,00 |
0,00 |
|
|
b) Of short-term
production cycle : 12242 |
403.645,00 |
0,00 |
0,00 |
0,00 |
0,00 |
|
|
5. By-products, residues and recycled
materials: 12250 |
0,00 |
0,00 |
0,00 |
0,00 |
0,00 |
|
|
6. Advances to suppliers: 12260 |
42.180,00 |
0,00 |
0,00 |
146.446,00 |
6.387,00 |
|
|
III. Trade debtors and others receivable accounts: 12300 |
9.813.185,00 |
11.940.781,00 |
11.317.288,00 |
7.937.500,00 |
8.386.070,00 |
|
|
1. Trade debtors / accounts receivable: 12310 |
7.968.770,00 |
7.739.146,00 |
8.292.367,00 |
701.945,00 |
643.558,00 |
|
|
a) Long-term
receivables from sales and services supplied : 12311 |
0,00 |
0,00 |
0,00 |
0,00 |
0,00 |
|
|
b) Customers for
sales and provisions of services : 12312 |
0,00 |
0,00 |
8.292.367,00 |
701.945,00 |
643.558,00 |
|
|
2. Customers, Group companies and
associates : 12320 |
660.922,00 |
2.548.497,00 |
1.851.624,00 |
371.872,00 |
847.996,00 |
|
|
3. Other accounts receivable: 12330 |
252.922,00 |
956.050,00 |
756.848,00 |
6.540.712,00 |
6.651.655,00 |
|
|
4. Personnel: 12340 |
0,00 |
0,00 |
0,00 |
0,00 |
0,00 |
|
|
5. Assets for deferred tax: 12350 |
0,00 |
0,00 |
0,00 |
0,00 |
0,00 |
|
|
6. Other debtors, including tax and social
security: 12360 |
930.571,00 |
697.088,00 |
416.449,00 |
322.971,00 |
242.861,00 |
|
|
7. Called up share capital: 12370 |
0,00 |
0,00 |
0,00 |
0,00 |
0,00 |
|
|
IV. Short-term investments in Group companies and associates:
12400 |
936.676,00 |
0,00 |
85.000,00 |
113.730,00 |
0,00 |
|
|
1. Equity instruments: 12410 |
0,00 |
0,00 |
0,00 |
0,00 |
0,00 |
|
|
2. Credits to businesses: 12420 |
936.676,00 |
0,00 |
85.000,00 |
113.730,00 |
0,00 |
|
|
3. Debt securities: 12430 |
0,00 |
0,00 |
0,00 |
0,00 |
0,00 |
|
|
4. Derivatives : 12440 |
0,00 |
0,00 |
0,00 |
0,00 |
0,00 |
|
|
5. Other financial assets : 12450 |
0,00 |
0,00 |
0,00 |
0,00 |
0,00 |
|
|
6. Other investments: 12460 |
0,00 |
0,00 |
0,00 |
0,00 |
0,00 |
|
|
V. Short-term financial investments : 12500 |
650,00 |
0,00 |
0,00 |
0,00 |
0,00 |
|
|
1. Equity instruments: 12510 |
0,00 |
0,00 |
0,00 |
0,00 |
0,00 |
|
|
2. Credits to businesses: 12520 |
0,00 |
0,00 |
0,00 |
0,00 |
0,00 |
|
|
3. Debt securities: 12530 |
0,00 |
0,00 |
0,00 |
0,00 |
0,00 |
|
|
4. Derivatives : 12540 |
0,00 |
0,00 |
0,00 |
0,00 |
0,00 |
|
|
5. Other financial assets : 12550 |
650,00 |
0,00 |
0,00 |
0,00 |
0,00 |
|
|
6. Other investments: 12560 |
0,00 |
0,00 |
0,00 |
0,00 |
0,00 |
|
|
VI. Short-term accruals: 12600 |
128.144,00 |
0,00 |
0,00 |
0,00 |
0,00 |
|
|
VII. Cash and other equivalent liquid assets : 12700 |
1.656.127,00 |
1.613.441,00 |
122.768,00 |
872.210,00 |
133.073,00 |
|
|
1. Treasury: 12710 |
0,00 |
0,00 |
0,00 |
872.210,00 |
133.073,00 |
|
|
2. Other equivalent liquid assets:
12720 |
0,00 |
1.613.441,00 |
122.768,00 |
0,00 |
0,00 |
|
|
TOTAL
ASSETS (A + B) : 10000 |
69.214.429,00 |
66.731.870,00 |
56.651.354,00 |
56.973.672,00 |
59.661.819,00 |
|
|
|
ORIGINAL |
ORIGINAL |
ORIGINAL |
ORIGINAL |
ORIGINAL |
|
|
Liabilities
and Net Worth |
2013 |
2012 |
2011 |
2010 |
2009 |
|
|
A)
NET WORTH: 20000 |
23.862.724,00 |
23.048.492,00 |
19.459.083,00 |
15.102.276,00 |
14.493.405,00 |
|
|
A-1) Shareholders' equity: 21000 |
23.804.663,00 |
22.981.414,00 |
19.382.986,00 |
14.793.223,00 |
14.120.857,00 |
|
|
I. Capital: 21100 |
10.149.928,00 |
10.149.928,00 |
10.149.928,00 |
10.149.928,00 |
10.149.928,00 |
|
|
1. Registered capital : 21110 |
10.149.928,00 |
0,00 |
10.149.928,00 |
10.149.928,00 |
10.149.928,00 |
|
|
2. (Uncalled capital): 21120 |
0,00 |
0,00 |
0,00 |
0,00 |
0,00 |
|
|
II. Share premium: 21200 |
5.371.306,00 |
8.871.306,00 |
8.871.306,00 |
8.871.306,00 |
8.871.306,00 |
|
|
III. Reserves: 21300 |
5.723.575,00 |
5.363.732,00 |
4.904.756,00 |
4.837.519,00 |
4.837.519,00 |
|
|
1. Legal y estatutarias: 21310 |
901.442,00 |
0,00 |
0,00 |
15.386,00 |
15.386,00 |
|
|
2. Other reserves: 21320 |
4.822.133,00 |
0,00 |
4.904.756,00 |
4.822.133,00 |
4.822.133,00 |
|
|
3. Revaluation reserves: 21330 |
0,00 |
0,00 |
0,00 |
0,00 |
0,00 |
|
|
IV. (Common stock equity): 21400 |
0,00 |
0,00 |
0,00 |
0,00 |
0,00 |
|
|
V. Results from previous periods: 21500 |
-1.763.395,00 |
-5.001.980,00 |
-9.132.767,00 |
-9.737.896,00 |
-9.020.389,00 |
|
|
1. Brought forward: 21510 |
0,00 |
0,00 |
0,00 |
0,00 |
0,00 |
|
|
2. (Negative results from previous
periods): 21520 |
0,00 |
-5.001.980,00 |
-9.132.767,00 |
-9.737.896,00 |
-9.020.389,00 |
|
|
VI. Other shareholders' contributions: 21600 |
0,00 |
0,00 |
0,00 |
0,00 |
0,00 |
|
|
VII. Result of the period: 21700 |
4.323.249,00 |
3.598.428,00 |
4.589.763,00 |
672.366,00 |
-717.507,00 |
|
|
VIII. (Interim dividend): 21800 |
0,00 |
0,00 |
0,00 |
0,00 |
0,00 |
|
|
IX. Other net worth instruments: 21900 |
0,00 |
0,00 |
0,00 |
0,00 |
0,00 |
|
|
A-2) Adjustments due to changes in value: 22000 |
0,00 |
0,00 |
0,00 |
0,00 |
0,00 |
|
|
I. Financial assets held for sale: 22100 |
0,00 |
0,00 |
0,00 |
0,00 |
0,00 |
|
|
II. Hedge operations: 22200 |
0,00 |
0,00 |
0,00 |
0,00 |
0,00 |
|
|
III. Linked non-current assets and liabilities held for sale :
22300 |
0,00 |
0,00 |
0,00 |
0,00 |
0,00 |
|
|
IV. Exchange rate difference: 22400 |
0,00 |
0,00 |
0,00 |
0,00 |
0,00 |
|
|
V. Other: 22500 |
0,00 |
0,00 |
0,00 |
0,00 |
0,00 |
|
|
A-3) Received subsidies, donations and legacies: 23000 |
58.061,00 |
67.078,00 |
76.097,00 |
309.053,00 |
372.548,00 |
|
|
B)
NON-CURRENT LIABILITIES: 31000 |
36.348.689,00 |
37.289.339,00 |
27.386.198,00 |
27.969.124,00 |
30.300.061,00 |
|
|
I. Long-term provisions: 31100 |
0,00 |
0,00 |
0,00 |
0,00 |
0,00 |
|
|
1. Long-term employee benefits liability:
31110 |
0,00 |
0,00 |
0,00 |
0,00 |
0,00 |
|
|
2. Environmental actions: 31120 |
0,00 |
0,00 |
0,00 |
0,00 |
0,00 |
|
|
3. Restructuring provisions: 31130 |
0,00 |
0,00 |
0,00 |
0,00 |
0,00 |
|
|
4. Other provisions: 31140 |
0,00 |
0,00 |
0,00 |
0,00 |
0,00 |
|
|
II Long-term creditors: 31200 |
34.425.925,00 |
34.756.972,00 |
19.580.882,00 |
22.813.138,00 |
28.579.039,00 |
|
|
1. Liabilities and other securities:
31210 |
0,00 |
0,00 |
0,00 |
0,00 |
0,00 |
|
|
2. Amounts owed to credit institutions:
31220 |
34.267.951,00 |
34.440.783,00 |
19.119.883,00 |
22.181.000,00 |
28.579.039,00 |
|
|
3. Creditors from financial leasing:
31230 |
0,00 |
0,00 |
0,00 |
0,00 |
0,00 |
|
|
4. Derivatives : 31240 |
0,00 |
0,00 |
0,00 |
0,00 |
0,00 |
|
|
5. Other financial liabilities :
31250 |
157.974,00 |
316.189,00 |
460.999,00 |
632.138,00 |
0,00 |
|
|
III. Long-term debts with Group companies and associates:
31300 |
0,00 |
0,00 |
4.956.716,00 |
3.300.000,00 |
0,00 |
|
|
IV. Liabilities for deferred tax: 31400 |
597.207,00 |
740.868,00 |
742.183,00 |
0,00 |
0,00 |
|
|
V. Long-term accruals: 31500 |
0,00 |
0,00 |
0,00 |
0,00 |
0,00 |
|
|
VI. Non-current trade creditors : 31600 |
0,00 |
1.791.499,00 |
2.106.417,00 |
1.855.986,00 |
1.721.022,00 |
|
|
VII. Special long-term debts : 31700 |
1.325.557,00 |
0,00 |
0,00 |
0,00 |
0,00 |
|
|
C)
CURRENT LIABILITIES : 32000 |
9.003.016,00 |
6.394.039,00 |
9.806.073,00 |
13.902.272,00 |
14.868.353,00 |
|
|
I. Liabilities linked to non-current assets held for sale:
32100 |
0,00 |
0,00 |
0,00 |
0,00 |
0,00 |
|
|
II. Short-term provisions: 32200 |
6.333,00 |
52.266,00 |
73.895,00 |
103.965,00 |
415.039,00 |
|
|
1. Provisions from greenhouse gas emission
allowance: 32210 |
0,00 |
0,00 |
0,00 |
0,00 |
0,00 |
|
|
2. Other provisions: 32220 |
6.333,00 |
0,00 |
0,00 |
0,00 |
0,00 |
|
|
III. Short-term creditors : 32300 |
388.842,00 |
388.470,00 |
2.133.070,00 |
6.836.220,00 |
5.028.774,00 |
|
|
1. Liabilities and other securities:
32310 |
0,00 |
0,00 |
0,00 |
0,00 |
0,00 |
|
|
2. Amounts owed to credit institutions:
32320 |
230.868,00 |
230.735,00 |
1.962.170,00 |
6.678.485,00 |
5.028.774,00 |
|
|
3. Creditors from financial leasing:
32330 |
0,00 |
0,00 |
0,00 |
0,00 |
0,00 |
|
|
4. Derivatives : 32340 |
0,00 |
0,00 |
0,00 |
0,00 |
0,00 |
|
|
5. Other financial liabilities :
32350 |
157.974,00 |
157.735,00 |
170.900,00 |
157.735,00 |
0,00 |
|
|
IV. Short-term debts with Group companies and associates:
32400 |
0,00 |
0,00 |
0,00 |
0,00 |
0,00 |
|
|
V. Trade creditors and other accounts payable: 32500 |
8.607.841,00 |
5.953.303,00 |
7.599.108,00 |
6.962.087,00 |
9.424.540,00 |
|
|
1. Suppliers: 32510 |
2.911.753,00 |
2.276.914,00 |
3.174.825,00 |
2.539.090,00 |
1.322.635,00 |
|
|
a) Long-term debts :
32511 |
0,00 |
0,00 |
0,00 |
0,00 |
0,00 |
|
|
b) Short-term debts :
32512 |
2.911.753,00 |
0,00 |
3.174.825,00 |
2.539.090,00 |
1.322.635,00 |
|
|
2. Suppliers, Group companies and
associates: 32520 |
1.917.629,00 |
625.132,00 |
1.834.861,00 |
1.279.674,00 |
6.106.750,00 |
|
|
3. Other creditors: 32530 |
2.556.217,00 |
1.806.164,00 |
1.070.660,00 |
1.639.127,00 |
826.175,00 |
|
|
4. Personnel (remuneration due):
32540 |
713.540,00 |
767.909,00 |
1.073.776,00 |
1.044.214,00 |
771.028,00 |
|
|
5. Liabilities for current tax:
32550 |
0,00 |
0,00 |
0,00 |
0,00 |
0,00 |
|
|
6. Other accounts payable to Public
Administrations.: 32560 |
508.702,00 |
477.184,00 |
444.986,00 |
459.982,00 |
397.952,00 |
|
|
7. Advances from clients: 32570 |
0,00 |
0,00 |
0,00 |
0,00 |
0,00 |
|
|
VI. Short-term accruals: 32600 |
0,00 |
0,00 |
0,00 |
0,00 |
0,00 |
|
|
VII. Special short-term debts : 32700 |
0,00 |
0,00 |
0,00 |
0,00 |
0,00 |
|
|
TOTAL
NET WORTH AND LIABILITIES (A + B + C) : 30000 |
69.214.429,00 |
66.731.870,00 |
56.651.354,00 |
56.973.672,00 |
59.661.819,00 |
|
|
|
ORIGINAL |
ORIGINAL |
ORIGINAL |
ORIGINAL |
ORIGINAL |
|
|
Profit
and Loss |
2013 |
2012 |
2011 |
2010 |
2009 |
|
|
1.
Net turnover: 40100 |
43.705.028,00 |
42.325.977,00 |
47.887.453,00 |
35.929.656,00 |
35.135.604,00 |
|
|
a) Sales: 40110 |
43.705.028,00 |
42.325.977,00 |
47.887.453,00 |
35.929.656,00 |
35.135.604,00 |
|
|
b) Rendering of services: 40120 |
0,00 |
0,00 |
0,00 |
0,00 |
0,00 |
|
|
c) Income of financial nature of holding companies: 40130 |
0,00 |
0,00 |
0,00 |
0,00 |
0,00 |
|
|
2.
Changes in stocks of finished goods and work in progress: 40200 |
-983.224,00 |
148.662,00 |
217.370,00 |
740.610,00 |
-946.031,00 |
|
|
3.
Works carried out by the company for its assets: 40300 |
3.263.701,00 |
1.906.187,00 |
2.288.235,00 |
1.915.663,00 |
842.806,00 |
|
|
4.
Supplies : 40400 |
-14.211.280,00 |
-13.371.251,00 |
-15.909.190,00 |
-10.941.220,00 |
-8.946.188,00 |
|
|
a) Stock consumption: 40410 |
0,00 |
0,00 |
0,00 |
0,00 |
0,00 |
|
|
b) Consumption of raw materials and miscellaneous consumable
ones: 40420 |
-14.175.296,00 |
-13.380.903,00 |
-15.899.852,00 |
-10.935.720,00 |
-8.946.188,00 |
|
|
c) Works carried out by other companies: 40430 |
1.119,00 |
-8.252,00 |
0,00 |
-539,00 |
0,00 |
|
|
d) Impairment of stock, primary material and other supplies:
40440 |
-37.103,00 |
17.904,00 |
-9.338,00 |
-4.961,00 |
0,00 |
|
|
5.
Other operating income: 40500 |
2.060.245,00 |
2.667.654,00 |
2.155.735,00 |
1.800.581,00 |
2.360.885,00 |
|
|
a) Auxiliary income and other from current management:
40510 |
2.031.733,00 |
2.654.770,00 |
2.115.964,00 |
1.740.186,00 |
2.217.313,00 |
|
|
b) Operation subsidies included in the Period's result:
40520 |
28.512,00 |
12.884,00 |
39.771,00 |
60.395,00 |
143.572,00 |
|
|
6.
Personnel costs: 40600 |
-12.328.605,00 |
-11.844.478,00 |
-12.054.416,00 |
-11.152.806,00 |
-10.693.139,00 |
|
|
a) Wages, salaries et al.: 40610 |
-9.316.991,00 |
-9.075.573,00 |
-9.283.150,00 |
-8.666.670,00 |
-8.223.639,00 |
|
|
b) Social security costs: 40620 |
-3.011.614,00 |
-2.768.905,00 |
-2.771.266,00 |
-2.486.136,00 |
-2.469.500,00 |
|
|
c) Provisions : 40630 |
0,00 |
0,00 |
0,00 |
0,00 |
0,00 |
|
|
7.
Other operating costs: 40700 |
-11.171.385,00 |
-12.114.816,00 |
-13.214.498,00 |
-12.164.597,00 |
-9.952.108,00 |
|
|
a) External services: 40710 |
-10.314.442,00 |
-11.197.848,00 |
-12.707.710,00 |
-11.272.631,00 |
-9.395.588,00 |
|
|
b) Taxes: 40720 |
-333.939,00 |
-493.536,00 |
-310.237,00 |
-427.171,00 |
-336.752,00 |
|
|
c) Losses, impairments and variation in provisions from trade
operations : 40730 |
-126.880,00 |
-64.891,00 |
-90.658,00 |
-8.220,00 |
38.093,00 |
|
|
d) Other current management expenditure : 40740 |
-396.124,00 |
-358.541,00 |
-105.893,00 |
-456.575,00 |
-257.861,00 |
|
|
e) Expenses due to greenhouse gas emissions: 40750 |
0,00 |
0,00 |
0,00 |
0,00 |
0,00 |
|
|
8.
Amortisation of fixed assets: 40800 |
-2.423.852,00 |
-4.562.593,00 |
-5.478.869,00 |
-5.477.471,00 |
-5.771.878,00 |
|
|
9.
Allocation of subsidies of non-financial fixed assets and other: 40900 |
12.881,00 |
40.400,00 |
43.687,00 |
63.495,00 |
0,00 |
|
|
10.
Excess provisions : 41000 |
0,00 |
336.696,00 |
252.702,00 |
236.017,00 |
507.943,00 |
|
|
11.
Impairment and result of transfers of fixed assets: 41100 |
-1.093.264,00 |
-16.570,00 |
-511.008,00 |
1.375.843,00 |
141.549,00 |
|
|
a) Impairment and losses : 41110 |
-423.243,00 |
281.338,00 |
-466.186,00 |
1.375.203,00 |
139.860,00 |
|
|
b) Results for transfers and other : 41120 |
-670.021,00 |
-297.908,00 |
-44.822,00 |
640,00 |
1.689,00 |
|
|
c) Impairment and profit due to disposals of assets of holding
companies: 41130 |
0,00 |
0,00 |
0,00 |
0,00 |
0,00 |
|
|
12.
Negative difference in combined businesses: 41200 |
0,00 |
0,00 |
0,00 |
0,00 |
0,00 |
|
|
13.
Other results : 41300 |
0,00 |
0,00 |
0,00 |
0,00 |
0,00 |
|
|
A.1)
OPERATING INCOME (1 + 2 + 3 + 4 + 5 + 6 + 7 + 8 + 9 + 10 + 11 + 12 + 13) :
49100 |
6.830.245,00 |
5.515.868,00 |
5.677.201,00 |
2.325.771,00 |
2.679.443,00 |
|
|
14.
Financial income : 41400 |
811.296,00 |
248.708,00 |
27.122,00 |
33.318,00 |
233.255,00 |
|
|
a) Of shares in equity instruments : 41410 |
0,00 |
0,00 |
0,00 |
33.318,00 |
233.255,00 |
|
|
a 1) In Group companies and associates:
41411 |
0,00 |
0,00 |
0,00 |
732,00 |
153.206,00 |
|
|
a 2) In third parties: 41412 |
0,00 |
0,00 |
0,00 |
32.586,00 |
80.049,00 |
|
|
b) From negotiable securities and other financial instruments :
41420 |
811.296,00 |
0,00 |
0,00 |
0,00 |
0,00 |
|
|
b 1) From Group companies and associates :
41421 |
709.466,00 |
0,00 |
0,00 |
0,00 |
0,00 |
|
|
b 2) From third parties : 41422 |
101.830,00 |
0,00 |
0,00 |
0,00 |
0,00 |
|
|
c) Allocation of financial subsidies, donations and legacies :
41430 |
0,00 |
248.708,00 |
27.122,00 |
0,00 |
0,00 |
|
|
15.
Financial expenditure: 41500 |
-1.540.752,00 |
-1.733.125,00 |
-1.446.849,00 |
-1.319.140,00 |
-1.938.224,00 |
|
|
a) Amounts owed to Group companies and associates : 41510 |
0,00 |
0,00 |
0,00 |
-72.663,00 |
0,00 |
|
|
b) For debts with third parties : 41520 |
-1.540.752,00 |
-1.733.125,00 |
-1.446.849,00 |
-1.246.477,00 |
-1.938.224,00 |
|
|
c) Stock renewal : 41530 |
0,00 |
0,00 |
0,00 |
0,00 |
0,00 |
|
|
16.
Changes in fair value of financial instruments : 41600 |
0,00 |
0,00 |
0,00 |
0,00 |
0,00 |
|
|
a) Trading book and other : 41610 |
0,00 |
0,00 |
0,00 |
0,00 |
0,00 |
|
|
b) Allocation of financial assets held for sale to the result
for the period: 41620 |
0,00 |
0,00 |
0,00 |
0,00 |
0,00 |
|
|
17.
Exchange rate differences : 41700 |
8.280,00 |
44.853,00 |
4.894,00 |
-29.174,00 |
-4.017,00 |
|
|
18.
Impairment and result for transfers of financial instruments: 41800 |
-1.756.077,00 |
-1.214.606,00 |
-357.449,00 |
-1.835.529,00 |
-3.058.972,00 |
|
|
a) Impairment and losses : 41810 |
-1.756.077,00 |
0,00 |
0,00 |
-1.835.529,00 |
-3.058.972,00 |
|
|
b) Results for transfers and other : 41820 |
0,00 |
-1.214.606,00 |
-357.449,00 |
0,00 |
0,00 |
|
|
19.
Other financial income and expenditure: 42100 |
0,00 |
0,00 |
0,00 |
0,00 |
0,00 |
|
|
a) Incorporation of financial expenditure to assets:
42110 |
0,00 |
0,00 |
0,00 |
0,00 |
0,00 |
|
|
b) Financial income from arrangement with creditors:
42120 |
0,00 |
0,00 |
0,00 |
0,00 |
0,00 |
|
|
c) Other income and expenditure: 42130 |
0,00 |
0,00 |
0,00 |
0,00 |
0,00 |
|
|
A.2)
FINANCIAL REVENUE (14+15+16+17+18+19) : 49200 |
-2.477.253,00 |
-2.654.170,00 |
-1.772.282,00 |
-3.150.525,00 |
-4.767.958,00 |
|
|
A.3)
NET RESULT BEFORE TAXES (A.1+A.2) : 49300 |
4.352.992,00 |
2.861.698,00 |
3.904.919,00 |
-824.754,00 |
-2.088.515,00 |
|
|
20.
Income taxes: 41900 |
-29.743,00 |
736.730,00 |
684.844,00 |
1.497.120,00 |
1.371.008,00 |
|
|
A.4)
PROFIT AFTER TAXES (A.3+20) : 49400 |
4.323.249,00 |
3.598.428,00 |
4.589.763,00 |
672.366,00 |
-717.507,00 |
|
|
21.
Result of the year coming from interrupted operations : 42000 |
0,00 |
0,00 |
0,00 |
0,00 |
0,00 |
|
|
A.5)
RESULT OF THE PERIOD (A.4+21) : 49500 |
4.323.249,00 |
3.598.428,00 |
4.589.763,00 |
672.366,00 |
-717.507,00 |
|
> Normal Balance Sheet under the rules of the 1990 General Accounting Plan (repealed since 1st January of 2008)
Information corresponding to the fiscal year 2013 2012 2011 2010 2009 has been compiled based on the equivalence criteria stipulated in Act JUS/206/2009. Where the provisions of the Act did not establish relevant equivalence criteria, created such criteria using its own methodology. To view details on the methodology 2013 2012 2011 2010 2009 is taken from information submitted to the TRADE REGISTER.
|
|
EQUIVALENCIA |
EQUIVALENCIA |
EQUIVALENCIA |
EQUIVALENCIA |
EQUIVALENCIA |
|
|
ASSETS |
2013 |
2012 |
2011 |
2010 |
2009 |
|
|
A)
SHAREHOLDERS (PARTNERS) BY UNCALLED SUSCRIBED CAPITAL: |
0,00 |
0,00 |
0,00 |
0,00 |
0,00 |
|
|
B)
FIXED ASSETS: |
36.115.342,00 |
33.224.916,00 |
23.372.534,00 |
29.058.176,00 |
35.029.277,00 |
|
|
I. Formation expenses: |
0,00 |
0,00 |
0,00 |
0,00 |
0,00 |
|
|
II. Intangible fixed assets: |
10.841.075,00 |
9.460.315,00 |
16.097.409,00 |
19.339.661,00 |
20.669.546,00 |
|
|
1. Research and development costs: |
0,00 |
9.460.315,00 |
16.097.409,00 |
3.435.154,00 |
1.758.785,00 |
|
|
2. Concessions, patents, licences, trademarks
et al.: |
0,00 |
0,00 |
0,00 |
15.827.867,00 |
18.831.798,00 |
|
|
3. Goodwill: |
0,00 |
0,00 |
0,00 |
0,00 |
0,00 |
|
|
4. Key money paid for premises: |
0,00 |
0,00 |
0,00 |
0,00 |
0,00 |
|
|
5. Software: |
10.841.075,00 |
0,00 |
0,00 |
76.640,00 |
78.963,00 |
|
|
6. Assets under capital leases: |
0,00 |
0,00 |
0,00 |
0,00 |
0,00 |
|
|
7. Payments on account: |
0,00 |
0,00 |
0,00 |
0,00 |
0,00 |
|
|
8. Provisions: |
0,00 |
0,00 |
0,00 |
0,00 |
0,00 |
|
|
9. Accumulated depreciation: |
0,00 |
0,00 |
0,00 |
0,00 |
0,00 |
|
|
III. Tangible fixed assets: |
5.519.374,00 |
5.118.514,00 |
4.615.437,00 |
5.100.490,00 |
4.369.736,00 |
|
|
1. Land and construction: |
0,00 |
0,00 |
0,00 |
0,00 |
0,00 |
|
|
2. Technical installations and machinery:
|
0,00 |
4.375.647,00 |
3.945.583,00 |
2.889.729,00 |
3.600.582,00 |
|
|
3. Other installations, tools and
furniture: |
0,00 |
536.470,00 |
483.743,00 |
354.291,00 |
441.445,00 |
|
|
4. Payments on account and tangible fixed
assets under construction: |
0,00 |
0,00 |
0,00 |
1.720.163,00 |
157.872,00 |
|
|
5. Other tangible assets: |
5.519.374,00 |
206.397,00 |
186.111,00 |
136.307,00 |
169.837,00 |
|
|
6. Provisions: |
0,00 |
0,00 |
0,00 |
0,00 |
0,00 |
|
|
7. Accumulated depreciation: |
0,00 |
0,00 |
0,00 |
0,00 |
0,00 |
|
|
IV. Financial investments: |
19.754.893,00 |
18.646.087,00 |
2.659.688,00 |
4.618.025,00 |
9.989.995,00 |
|
|
1. Equity investments in group companies: |
1.220.220,00 |
2.976.297,00 |
2.190.903,00 |
2.548.352,00 |
4.132.131,00 |
|
|
2. Receivables from group companies:
|
18.200.000,00 |
15.297.072,00 |
0,00 |
0,00 |
3.783.191,00 |
|
|
3. Equity investment in associated
companies: |
0,00 |
0,00 |
0,00 |
0,00 |
0,00 |
|
|
4. Credits to associated companies: |
0,00 |
0,00 |
0,00 |
0,00 |
0,00 |
|
|
5. Long-term securities portfolio: |
0,00 |
0,00 |
0,00 |
0,00 |
0,00 |
|
|
6. Other receivables: |
0,00 |
0,00 |
0,00 |
0,00 |
0,00 |
|
|
7. Long term guarantees and deposits:
|
334.673,00 |
372.718,00 |
468.785,00 |
2.069.673,00 |
2.074.673,00 |
|
|
8. Provisions: |
0,00 |
0,00 |
0,00 |
0,00 |
0,00 |
|
|
9. Long-term receivables from public
bodies: |
0,00 |
0,00 |
0,00 |
0,00 |
0,00 |
|
|
V. Own shares: |
0,00 |
0,00 |
0,00 |
0,00 |
0,00 |
|
|
VI. Long-term trade receivables: |
0,00 |
0,00 |
0,00 |
0,00 |
0,00 |
|
|
C)
Deferred expenses: |
0,00 |
0,00 |
0,00 |
0,00 |
0,00 |
|
|
D)
CURRENT ASSETS: |
33.099.087,00 |
33.506.954,00 |
33.278.820,00 |
27.915.496,00 |
24.632.542,00 |
|
|
I. Called-up share capital (not paid): |
0,00 |
0,00 |
0,00 |
0,00 |
0,00 |
|
|
II. Stocks: |
6.265.022,00 |
6.355.217,00 |
7.589.106,00 |
6.347.905,00 |
4.850.135,00 |
|
|
1. Goods for resale: |
0,00 |
0,00 |
0,00 |
0,00 |
0,00 |
|
|
2. Raw materials and other consumables:
|
3.718.631,00 |
6.355.217,00 |
7.589.106,00 |
2.690.015,00 |
2.170.896,00 |
|
|
3. Goods in process and semifinished ones:
|
2.100.566,00 |
0,00 |
0,00 |
1.865.401,00 |
1.127.532,00 |
|
|
4. Finished products: |
403.645,00 |
0,00 |
0,00 |
1.646.043,00 |
1.545.320,00 |
|
|
5. Byproducts, scrap and recovered
materials: |
0,00 |
0,00 |
0,00 |
0,00 |
0,00 |
|
|
6. Payments on account: |
42.180,00 |
0,00 |
0,00 |
146.446,00 |
6.387,00 |
|
|
7. Provisions: |
0,00 |
0,00 |
0,00 |
0,00 |
0,00 |
|
|
III. Debtors: |
24.112.468,00 |
25.538.296,00 |
25.481.946,00 |
20.581.651,00 |
19.649.334,00 |
|
|
1. Trade debtors / accounts receivable:
|
7.968.770,00 |
7.739.146,00 |
8.292.367,00 |
701.945,00 |
643.558,00 |
|
|
2. Accounts receivable, Group companies:
|
660.922,00 |
2.548.497,00 |
1.851.624,00 |
371.872,00 |
847.996,00 |
|
|
3. Accounts receivable, associated
companies: |
0,00 |
0,00 |
0,00 |
0,00 |
0,00 |
|
|
4. Other debtors: |
252.922,00 |
956.050,00 |
756.848,00 |
6.540.712,00 |
6.651.655,00 |
|
|
5. Staff: |
0,00 |
0,00 |
0,00 |
0,00 |
0,00 |
|
|
6. Public bodies: |
15.229.854,00 |
14.294.603,00 |
14.581.107,00 |
12.967.122,00 |
11.506.125,00 |
|
|
7. Provisions: |
0,00 |
0,00 |
0,00 |
0,00 |
0,00 |
|
|
IV. Short-term investments: |
937.326,00 |
1.613.441,00 |
207.768,00 |
113.730,00 |
0,00 |
|
|
1. Equity investments in group companies:
|
0,00 |
0,00 |
0,00 |
0,00 |
0,00 |
|
|
2. Receivables from group companies:
|
936.676,00 |
0,00 |
85.000,00 |
113.730,00 |
0,00 |
|
|
3. Equity investment in associated
companies: |
0,00 |
0,00 |
0,00 |
0,00 |
0,00 |
|
|
4. Credits to associated companies: |
0,00 |
0,00 |
0,00 |
0,00 |
0,00 |
|
|
5. Short term securities portfolio: |
0,00 |
1.613.441,00 |
122.768,00 |
0,00 |
0,00 |
|
|
6. Other receivables: |
0,00 |
0,00 |
0,00 |
0,00 |
0,00 |
|
|
7. Shor term guarantees and deposits:
|
650,00 |
0,00 |
0,00 |
0,00 |
0,00 |
|
|
8. Provisions: |
0,00 |
0,00 |
0,00 |
0,00 |
0,00 |
|
|
V. Short-term treasury shares: |
0,00 |
0,00 |
0,00 |
0,00 |
0,00 |
|
|
VI. Cash at bank and in hand: |
1.656.127,00 |
0,00 |
0,00 |
872.210,00 |
133.073,00 |
|
|
VII. Prepayments and accrued income: |
128.144,00 |
0,00 |
0,00 |
0,00 |
0,00 |
|
|
GENERAL
TOTAL (A + B + C + D): |
69.214.429,00 |
66.731.870,00 |
56.651.354,00 |
56.973.672,00 |
59.661.819,00 |
|
MERCANTILE REGISTRY.
|
|
EQUIVALENCIA |
EQUIVALENCIA |
EQUIVALENCIA |
EQUIVALENCIA |
EQUIVALENCIA |
|
|
LIABILITIES |
2013 |
2012 |
2011 |
2010 |
2009 |
|
|
A)
EQUITY: |
23.822.081,00 |
23.001.537,00 |
19.405.815,00 |
14.885.939,00 |
14.232.621,00 |
|
|
I. Subscribed capital: |
10.149.928,00 |
10.149.928,00 |
10.149.928,00 |
10.149.928,00 |
10.149.928,00 |
|
|
II. Share premium: |
5.371.306,00 |
8.871.306,00 |
8.871.306,00 |
8.871.306,00 |
8.871.306,00 |
|
|
III. Revaluation reserves: |
0,00 |
0,00 |
0,00 |
0,00 |
0,00 |
|
|
IV. Reserves: |
5.740.993,00 |
5.383.855,00 |
4.927.585,00 |
4.930.235,00 |
4.949.283,00 |
|
|
1. Legal reserve: |
901.442,00 |
5.363.732,00 |
0,00 |
15.386,00 |
15.386,00 |
|
|
2. Reserves for own shares: |
0,00 |
0,00 |
0,00 |
0,00 |
0,00 |
|
|
3. Reserves for shares of the controlling
company: |
0,00 |
0,00 |
0,00 |
0,00 |
0,00 |
|
|
4. Statutory reserves: |
0,00 |
0,00 |
0,00 |
0,00 |
0,00 |
|
|
5. Miscellaneous reserves: |
4.839.551,00 |
20.123,00 |
4.927.585,00 |
4.914.849,00 |
4.933.897,00 |
|
|
Differences due to capital adjustement to
euros: |
0,00 |
0,00 |
0,00 |
0,00 |
0,00 |
|
|
V. Profit or loss brought forward: |
-1.763.395,00 |
-5.001.980,00 |
-9.132.767,00 |
-9.737.896,00 |
-9.020.389,00 |
|
|
1. Retained earnings: |
0,00 |
0,00 |
0,00 |
0,00 |
0,00 |
|
|
2. Prior year losses: |
-1.763.395,00 |
-5.001.980,00 |
-9.132.767,00 |
-9.737.896,00 |
-9.020.389,00 |
|
|
3. Partners' contributions so as
to compensate losses: |
0,00 |
0,00 |
0,00 |
0,00 |
0,00 |
|
|
VI. Profit or loss for the financial year: |
4.323.249,00 |
3.598.428,00 |
4.589.763,00 |
672.366,00 |
-717.507,00 |
|
|
VII. Interim dividend paid: |
0,00 |
0,00 |
0,00 |
0,00 |
0,00 |
|
|
VIII. Own shares for capital reduction: |
0,00 |
0,00 |
0,00 |
0,00 |
0,00 |
|
|
B)
Deferred income: |
40.643,00 |
46.955,00 |
53.268,00 |
216.337,00 |
260.784,00 |
|
|
1. Capital grants: |
40.643,00 |
46.955,00 |
53.268,00 |
216.337,00 |
260.784,00 |
|
|
2. Unrealised exchange gains: |
0,00 |
0,00 |
0,00 |
0,00 |
0,00 |
|
|
3. Other deferred income: |
0,00 |
0,00 |
0,00 |
0,00 |
0,00 |
|
|
4. Public revenues to distribute in
several financial years: |
0,00 |
0,00 |
0,00 |
0,00 |
0,00 |
|
|
C)
PROVISIONS FOR LIABILITIES AND CHARGES: |
0,00 |
0,00 |
0,00 |
0,00 |
0,00 |
|
|
1. Provisions for pension fund and other
similar obligations: |
0,00 |
0,00 |
0,00 |
0,00 |
0,00 |
|
|
2. Provisions for taxes: |
0,00 |
0,00 |
0,00 |
0,00 |
0,00 |
|
|
3. Other provisions: |
0,00 |
0,00 |
0,00 |
0,00 |
0,00 |
|
|
4. Reversion fund: |
0,00 |
0,00 |
0,00 |
0,00 |
0,00 |
|
|
D)
LONG TERM LIABILITIES: |
36.348.689,00 |
37.289.339,00 |
27.386.198,00 |
27.969.124,00 |
30.300.061,00 |
|
|
I. Issued debentures and other marketable securities: |
0,00 |
0,00 |
0,00 |
0,00 |
0,00 |
|
|
1. Non-convertible debentures: |
0,00 |
0,00 |
0,00 |
0,00 |
0,00 |
|
|
2. Convertible debentures: |
0,00 |
0,00 |
0,00 |
0,00 |
0,00 |
|
|
3. Other debt securities: |
0,00 |
0,00 |
0,00 |
0,00 |
0,00 |
|
|
II. Amounts owed to credit institutions: |
34.267.951,00 |
34.440.783,00 |
19.119.883,00 |
22.181.000,00 |
28.579.039,00 |
|
|
1. Loans and other liabilities: |
34.267.951,00 |
34.440.783,00 |
19.119.883,00 |
22.181.000,00 |
28.579.039,00 |
|
|
2. Long-term liabilities from capital
leases: |
0,00 |
0,00 |
0,00 |
0,00 |
0,00 |
|
|
III. Debts with companies of the group and affiliated ones:
|
0,00 |
0,00 |
4.956.716,00 |
3.300.000,00 |
0,00 |
|
|
1. Amounts owed to group companies: |
0,00 |
0,00 |
4.956.716,00 |
3.300.000,00 |
0,00 |
|
|
2. Amounts owed to associated companies:
|
0,00 |
0,00 |
0,00 |
0,00 |
0,00 |
|
|
IV. Other creditors: |
2.080.738,00 |
1.057.057,00 |
1.203.182,00 |
632.138,00 |
0,00 |
|
|
1. Long-term bills of exchange payable:
|
0,00 |
0,00 |
0,00 |
0,00 |
0,00 |
|
|
2. Other creditors: |
1.483.531,00 |
316.189,00 |
460.999,00 |
632.138,00 |
0,00 |
|
|
3. Long term guarantees and deposits
received: |
0,00 |
0,00 |
0,00 |
0,00 |
0,00 |
|
|
4. Long term payables to public bodies:
|
597.207,00 |
740.868,00 |
742.183,00 |
0,00 |
0,00 |
|
|
V. Unpaid portion of equity investment: |
0,00 |
0,00 |
0,00 |
0,00 |
0,00 |
|
|
1. Group companies: |
0,00 |
0,00 |
0,00 |
0,00 |
0,00 |
|
|
2. Associated companies: |
0,00 |
0,00 |
0,00 |
0,00 |
0,00 |
|
|
3. Third parties: |
0,00 |
0,00 |
0,00 |
0,00 |
0,00 |
|
|
VI. Long term trade creditors: |
0,00 |
1.791.499,00 |
2.106.417,00 |
1.855.986,00 |
1.721.022,00 |
|
|
E)
SHORT TERM CREDITORS: |
8.996.683,00 |
6.341.773,00 |
9.732.178,00 |
13.798.307,00 |
14.453.314,00 |
|
|
I. Issued debentures and other marketable securities: |
0,00 |
0,00 |
0,00 |
0,00 |
0,00 |
|
|
1. Non-convertible debentures: |
0,00 |
0,00 |
0,00 |
0,00 |
0,00 |
|
|
2. Convertible debentures: |
0,00 |
0,00 |
0,00 |
0,00 |
0,00 |
|
|
3. Other debt securities: |
0,00 |
0,00 |
0,00 |
0,00 |
0,00 |
|
|
4. Accrued interest on debentures and
other debt securities: |
0,00 |
0,00 |
0,00 |
0,00 |
0,00 |
|
|
II. Amounts owed to credit institutions: |
230.868,00 |
230.735,00 |
1.962.170,00 |
6.678.485,00 |
5.028.774,00 |
|
|
1. Loans and other liabilities: |
230.868,00 |
230.735,00 |
1.962.170,00 |
6.678.485,00 |
5.028.774,00 |
|
|
2. Accrued interest on liabilities with
credit institutions: |
0,00 |
0,00 |
0,00 |
0,00 |
0,00 |
|
|
3. Short-term liabilities from capital
leases: |
0,00 |
0,00 |
0,00 |
0,00 |
0,00 |
|
|
III. Short-term amounts owed to group and associated companies:
|
1.917.629,00 |
625.132,00 |
1.834.861,00 |
1.279.674,00 |
6.106.750,00 |
|
|
1. Amounts owed to group companies: |
1.917.629,00 |
625.132,00 |
1.834.861,00 |
1.279.674,00 |
6.106.750,00 |
|
|
2. Amounts owed to associated companies:
|
0,00 |
0,00 |
0,00 |
0,00 |
0,00 |
|
|
IV. Trade creditors: |
5.467.970,00 |
4.083.078,00 |
4.245.485,00 |
4.178.217,00 |
2.148.810,00 |
|
|
1. Advanced payments from customers:
|
0,00 |
0,00 |
0,00 |
0,00 |
0,00 |
|
|
2. Amounts owed for purchases of goods or
services: |
5.467.970,00 |
4.083.078,00 |
4.245.485,00 |
4.178.217,00 |
2.148.810,00 |
|
|
3. Debts represented by notes payable:
|
0,00 |
0,00 |
0,00 |
0,00 |
0,00 |
|
|
V. Other creditors: |
1.380.216,00 |
1.402.828,00 |
1.689.662,00 |
1.661.931,00 |
1.168.980,00 |
|
|
1. Public bodies: |
508.702,00 |
477.184,00 |
444.986,00 |
459.982,00 |
397.952,00 |
|
|
2. Bills of exchange payable: |
0,00 |
0,00 |
0,00 |
0,00 |
0,00 |
|
|
3. Miscellaneous debts: |
157.974,00 |
157.735,00 |
170.900,00 |
157.735,00 |
0,00 |
|
|
4. Wages and salaries payable: |
713.540,00 |
767.909,00 |
1.073.776,00 |
1.044.214,00 |
771.028,00 |
|
|
5. Guarantees and deposits received at
short term: |
0,00 |
0,00 |
0,00 |
0,00 |
0,00 |
|
|
VI. Provisions: |
0,00 |
0,00 |
0,00 |
0,00 |
0,00 |
|
|
VII. Prepayments and accrued income: |
0,00 |
0,00 |
0,00 |
0,00 |
0,00 |
|
|
F)
SHORT-TERM PROVISIONS FOR LIABILITIES AND CHARGES: |
6.333,00 |
52.266,00 |
73.895,00 |
103.965,00 |
415.039,00 |
|
|
GENERAL
TOTAL (A + B + C + D + E + F): |
69.214.429,00 |
66.731.870,00 |
56.651.354,00 |
56.973.672,00 |
59.661.819,00 |
|
MERCANTILE REGISTRY.
|
|
EQUIVALENCIA |
EQUIVALENCIA |
EQUIVALENCIA |
EQUIVALENCIA |
EQUIVALENCIA |
|
|
DEBIT |
2013 |
2012 |
2011 |
2010 |
2009 |
|
|
A)
CHARGES (A.1 to A.15): |
45.538.182,00 |
44.120.709,00 |
48.287.435,00 |
40.047.614,00 |
39.799.689,00 |
|
|
A.1. Stock reduction of both manufactured
goods and the ones in process: |
983.224,00 |
0,00 |
0,00 |
0,00 |
946.031,00 |
|
|
A.2. Supplies: |
14.174.177,00 |
13.389.155,00 |
15.899.852,00 |
10.936.259,00 |
8.946.188,00 |
|
|
a) Stock consumption:
|
0,00 |
0,00 |
0,00 |
0,00 |
0,00 |
|
|
b) Consumption of raw
materials and miscellaneous consumable ones: |
14.175.296,00 |
13.380.903,00 |
15.899.852,00 |
10.935.720,00 |
8.946.188,00 |
|
|
c) Miscellaneous
external expenditure: |
-1.119,00 |
8.252,00 |
0,00 |
539,00 |
0,00 |
|
|
A.3. Staff costs: |
12.328.605,00 |
11.844.478,00 |
12.054.416,00 |
11.152.806,00 |
10.693.139,00 |
|
|
a) Wages, salaries et
al.: |
9.316.991,00 |
9.075.573,00 |
9.283.150,00 |
8.666.670,00 |
8.223.639,00 |
|
|
b) Social security
costs: |
3.011.614,00 |
2.768.905,00 |
2.771.266,00 |
2.486.136,00 |
2.469.500,00 |
|
|
A.4. Depreciation expense: |
2.423.852,00 |
4.562.593,00 |
5.478.869,00 |
5.477.471,00 |
5.771.878,00 |
|
|
A.5. Variation of trade provisions and
losses of unrecovered receivables: |
163.983,00 |
46.987,00 |
99.996,00 |
13.181,00 |
-38.093,00 |
|
|
a) Stock provision
variation: |
37.103,00 |
-17.904,00 |
9.338,00 |
4.961,00 |
0,00 |
|
|
b) Variation in
provision and bad debt losses: |
-43.613,00 |
-22.305,00 |
-31.162,00 |
-2.825,00 |
13.094,00 |
|
|
c) Variation of other
trade provisions: |
170.493,00 |
87.196,00 |
121.820,00 |
11.045,00 |
-51.187,00 |
|
|
A.6. Other operating charges: |
11.044.505,00 |
12.049.925,00 |
13.123.840,00 |
12.156.377,00 |
9.990.201,00 |
|
|
a) External services:
|
10.314.442,00 |
11.197.848,00 |
12.707.710,00 |
11.272.631,00 |
9.395.588,00 |
|
|
b) Taxes: |
333.939,00 |
493.536,00 |
310.237,00 |
427.171,00 |
336.752,00 |
|
|
c) Other operating
expenses: |
396.124,00 |
358.541,00 |
105.893,00 |
456.575,00 |
257.861,00 |
|
|
d) Allocation to
revision fund: |
0,00 |
0,00 |
0,00 |
0,00 |
0,00 |
|
|
A.I. OPERATING BENEFITS
(B.1+B.2+B.3+B.4-A.1-A.2-A.3-A.4-A.5-A.6): |
7.910.628,00 |
5.492.038,00 |
6.144.522,00 |
886.433,00 |
2.537.894,00 |
|
|
A.7. Financial and similar charges: |
3.826.207,00 |
2.947.731,00 |
1.804.298,00 |
10.436.538,00 |
16.437.970,00 |
|
|
a) Due to liabilities
with companies of the group: |
0,00 |
0,00 |
0,00 |
72.663,00 |
0,00 |
|
|
b) Due to liabilities
with associated companies: |
0,00 |
0,00 |
0,00 |
0,00 |
0,00 |
|
|
c) Due to other
debts.: |
1.540.752,00 |
1.733.125,00 |
1.446.849,00 |
1.246.477,00 |
1.938.224,00 |
|
|
d) Losses from financial
investments: |
2.285.455,00 |
1.214.606,00 |
357.449,00 |
9.117.398,00 |
14.499.746,00 |
|
|
A.8. Changes in financial investment
provisions: |
0,00 |
0,00 |
0,00 |
0,00 |
0,00 |
|
|
A.9. Exchange losses: |
0,00 |
0,00 |
0,00 |
29.174,00 |
4.017,00 |
|
|
A.II. NET FINANCIAL INCOME (B.5+B.6+B.7+B.8-A.7-A.8-A.9):
|
0,00 |
0,00 |
0,00 |
0,00 |
0,00 |
|
|
A.III. PROFIT FROM ORDINARY ACTIVITIES (A.I+A.II-B.I-B.II):
|
4.903.997,00 |
2.589.160,00 |
4.345.118,00 |
0,00 |
0,00 |
|
|
A.10. Changes in provisions for
intangible, tangible and securities portfolio: |
-106.135,00 |
-281.338,00 |
466.186,00 |
-8.657.072,00 |
-11.580.634,00 |
|
|
A.11. Losses from tangible and intangible
fixed assets and securities portfolio: |
670.021,00 |
297.908,00 |
44.822,00 |
0,00 |
0,00 |
|
|
A.12. Losses from transactions with own
shares and debentures: |
0,00 |
0,00 |
0,00 |
0,00 |
0,00 |
|
|
A.13. Extraordinary expenses: |
0,00 |
0,00 |
0,00 |
0,00 |
0,00 |
|
|
A.14. Expenses and losses of former
financial years: |
0,00 |
0,00 |
0,00 |
0,00 |
0,00 |
|
|
A.IV. EXTRAORDINARY PROFIT (B.9+B.10+B.11+B.12+B.13-A.10-A.11-A.12-A.13-A.14):
|
0,00 |
272.538,00 |
0,00 |
8.721.207,00 |
11.582.323,00 |
|
|
A.V. PROFIT BEFORE TAXES (A.III+A.IV-B.III-B.IV): |
4.352.992,00 |
2.861.698,00 |
3.904.919,00 |
0,00 |
0,00 |
|
|
A.15. Corporation tax: |
29.743,00 |
-736.730,00 |
-684.844,00 |
-1.497.120,00 |
-1.371.008,00 |
|
|
A.16. Miscellaneous taxes: |
0,00 |
0,00 |
0,00 |
0,00 |
0,00 |
|
|
A.VI. FINANCIAL YEAR RESULTS (PROFIT) (A.V-A.15-A.16): |
4.323.249,00 |
3.598.428,00 |
4.589.763,00 |
672.366,00 |
0,00 |
|
MERCANTILE REGISTRY.
|
|
EQUIVALENCIA |
EQUIVALENCIA |
EQUIVALENCIA |
EQUIVALENCIA |
EQUIVALENCIA |
|
|
CREDIT |
2013 |
2012 |
2011 |
2010 |
2009 |
|
|
B)
INCOME ( B.1 to B.13): |
49.861.431,00 |
47.719.137,00 |
52.877.198,00 |
40.719.980,00 |
39.082.182,00 |
|
|
B.1. Net total sales: |
43.705.028,00 |
42.325.977,00 |
47.887.453,00 |
35.929.656,00 |
35.135.604,00 |
|
|
a) Sales: |
43.705.028,00 |
42.325.977,00 |
47.887.453,00 |
35.929.656,00 |
35.135.604,00 |
|
|
b) Rendering of
services: |
0,00 |
0,00 |
0,00 |
0,00 |
0,00 |
|
|
Returns and Rappel on
sales: |
0,00 |
0,00 |
0,00 |
0,00 |
0,00 |
|
|
B.2. Stock increase of manufactured goods
and products in process: |
0,00 |
148.662,00 |
217.370,00 |
740.610,00 |
0,00 |
|
|
B.3. Works performed by the company for
fixed assets: |
3.263.701,00 |
1.906.187,00 |
2.288.235,00 |
1.915.663,00 |
842.806,00 |
|
|
B.4. Miscellaneous operating income:
|
2.060.245,00 |
3.004.350,00 |
2.408.437,00 |
2.036.598,00 |
2.868.828,00 |
|
|
a) Auxiliary income
and other from current management: |
2.031.733,00 |
2.654.770,00 |
2.115.964,00 |
1.740.186,00 |
2.217.313,00 |
|
|
b) Grants: |
28.512,00 |
12.884,00 |
39.771,00 |
60.395,00 |
143.572,00 |
|
|
c) Liabilities and
charges provisions surplus: |
0,00 |
336.696,00 |
252.702,00 |
236.017,00 |
507.943,00 |
|
|
B.I. PÉRDIDAS DE EXPLOTACIÓN
(A.1+A.2+A.3+A.4+A.5-A.6-B.1-B.2-B.3-B.4): |
0,00 |
0,00 |
0,00 |
0,00 |
0,00 |
|
|
B.5. Income from equity investment: |
0,00 |
0,00 |
0,00 |
33.318,00 |
233.255,00 |
|
|
a) In companies of
the group: |
0,00 |
0,00 |
0,00 |
732,00 |
153.206,00 |
|
|
b) In associated
companies: |
0,00 |
0,00 |
0,00 |
0,00 |
0,00 |
|
|
c) Third parties:
|
0,00 |
0,00 |
0,00 |
32.586,00 |
80.049,00 |
|
|
B.6. Income from other marketable securities
and long-term receivables: |
0,00 |
0,00 |
0,00 |
0,00 |
0,00 |
|
|
a) From companies of
the group: |
0,00 |
0,00 |
0,00 |
0,00 |
0,00 |
|
|
b) From associated
companies: |
0,00 |
0,00 |
0,00 |
0,00 |
0,00 |
|
|
c) From companies out
of the group: |
0,00 |
0,00 |
0,00 |
0,00 |
0,00 |
|
|
B.7. Miscellaneous interests or similar
income: |
811.296,00 |
0,00 |
0,00 |
0,00 |
0,00 |
|
|
a) From companies of
the group: |
709.466,00 |
0,00 |
0,00 |
0,00 |
0,00 |
|
|
b) From associated
companies: |
0,00 |
0,00 |
0,00 |
0,00 |
0,00 |
|
|
c) Miscellaneous
interests: |
101.830,00 |
0,00 |
0,00 |
0,00 |
0,00 |
|
|
d) Profit on
financial investment: |
0,00 |
0,00 |
0,00 |
0,00 |
0,00 |
|
|
B.8. Exchange positive differences: |
8.280,00 |
44.853,00 |
4.894,00 |
0,00 |
0,00 |
|
|
B.II. NEGATIVE FINANCIAL RESULTS (A.7+A.8+A.9-B.5-B.6-B.7-B.8):
|
3.006.631,00 |
2.902.878,00 |
1.799.404,00 |
10.432.394,00 |
16.208.732,00 |
|
|
B.III. LOSSES ON ORDINARY ACTIVITIES ( B.I + B.II - A.I - A.II
): |
0,00 |
0,00 |
0,00 |
9.545.961,00 |
13.670.838,00 |
|
|
B.9.Profit on disposal of both tangible
and intangible fixed assets and securities portfolio: |
0,00 |
0,00 |
0,00 |
640,00 |
1.689,00 |
|
|
B.10. Profit on transactions with own shares
and debentures: |
0,00 |
0,00 |
0,00 |
0,00 |
0,00 |
|
|
B.11. Capital grants transferred to profit
and loss: |
12.881,00 |
289.108,00 |
70.809,00 |
63.495,00 |
0,00 |
|
|
B.12. Extraordinary income: |
0,00 |
0,00 |
0,00 |
0,00 |
0,00 |
|
|
B.13. Income and profit of former
financial years: |
0,00 |
0,00 |
0,00 |
0,00 |
0,00 |
|
|
B.IV. NEGATIVE EXTRAORDINARY RESULTS
(A.10+A.11+A.12+A.13+A.14-B.9-B.10-B.11-B.12-B.13): |
551.005,00 |
0,00 |
440.199,00 |
0,00 |
0,00 |
|
|
B.V. LOSSES BEFORE TAXES (B.III+B.IV-A.III-A.IV): |
0,00 |
0,00 |
0,00 |
824.754,00 |
2.088.515,00 |
|
|
B.VI. RESULT OF THE PERIOD (LOSSES) (B.V+A.15+A.16): |
0,00 |
0,00 |
0,00 |
0,00 |
717.507,00 |
|
MERCANTILE REGISTRY.
|
CASHFLOW
STATEMENT
|
|
|
|
|
Model: Normal
>
Source of information: Data contained in this section is taken from the
information declared in the Annual Accounts submitted to the Trade Register.
|
|
2013 |
2012 |
2011 |
2010 |
2009 |
|
|
1.
Fiscal year result before taxes.: 61100 |
4.352.992,00 |
2.861.698,00 |
3.904.919,00 |
-824.754,00 |
-2.088.515,00 |
|
|
2.
Results adjustments.: 61200 |
6.192.706,00 |
7.536.237,00 |
7.823.362,00 |
7.099.629,00 |
10.566.470,00 |
|
|
a) Fixed Assets Amortization (+).: 61201 |
2.423.852,00 |
4.562.593,00 |
5.478.869,00 |
5.477.471,00 |
5.771.878,00 |
|
|
b) Obsolescence Allowances (+/-). : 61202 |
240.591,00 |
-238.076,00 |
566.182,00 |
400.471,00 |
2.919.113,00 |
|
|
c) Variation in Provision (+/-). : 61203 |
-45.993,00 |
0,00 |
0,00 |
0,00 |
0,00 |
|
|
d) Allocation of grants (-).: 61204 |
-12.881,00 |
-12.884,00 |
-43.687,00 |
-63.495,00 |
-61.056,00 |
|
|
e) Results on disposal of fixed assets (+/-). : 61205 |
1.093.264,00 |
298.369,00 |
44.822,00 |
-640,00 |
-1.689,00 |
|
|
f) Results on disposal of financial instruments (+/-).:
61206 |
1.756.077,00 |
1.214.606,00 |
357.449,00 |
0,00 |
0,00 |
|
|
g) Financial income (-).: 61207 |
-811.296,00 |
-21.496,00 |
-27.122,00 |
-33.318,00 |
0,00 |
|
|
h) Financial Expenses (+). : 61208 |
1.540.752,00 |
1.733.125,00 |
1.446.849,00 |
1.319.140,00 |
0,00 |
|
|
i) Exchange differences (+/-). : 61209 |
8.280,00 |
0,00 |
0,00 |
0,00 |
0,00 |
|
|
k) Other income and expense (-/+). : 61211 |
0,00 |
0,00 |
0,00 |
0,00 |
1.938.224,00 |
|
|
3.
Changes in current capital equity.: 61300 |
2.930.203,00 |
680.372,00 |
-3.857.244,00 |
-3.607.361,00 |
6.076.222,00 |
|
|
a) Stock (+/-).: 61301 |
-23.516,00 |
1.255.518,00 |
-1.250.539,00 |
-1.429.695,00 |
910.733,00 |
|
|
d) Debtors and other accounts receivable (+/-). : 61302 |
1.773.505,00 |
1.060.917,00 |
-3.464.087,00 |
440.350,00 |
630.599,00 |
|
|
c) Other current assets (+/-). : 61303 |
0,00 |
0,00 |
0,00 |
0,00 |
543.349,00 |
|
|
d) Creditors and other accounts payable (+/-). : 61304 |
1.774.950,00 |
-1.904.049,00 |
637.021,00 |
-2.441.906,00 |
3.033.058,00 |
|
|
e) Other current liabilities (+/-).: 61305 |
-128.794,00 |
86.848,00 |
-30.070,00 |
-311.074,00 |
138.787,00 |
|
|
f) Other non-current assets and liabilities (+/-).: 61306 |
-465.942,00 |
181.138,00 |
250.431,00 |
134.964,00 |
819.696,00 |
|
|
4.
Other cash flows for operating activities.: 61400 |
-1.438.788,00 |
-1.740.814,00 |
-1.535.260,00 |
-1.243.194,00 |
-1.872.860,00 |
|
|
a) Interest payments (-). : 61401 |
-1.540.619,00 |
-1.762.310,00 |
-1.562.382,00 |
-1.276.512,00 |
-1.718.448,00 |
|
|
c) Interest collection (+). : 61403 |
101.831,00 |
21.496,00 |
27.122,00 |
33.318,00 |
-154.412,00 |
|
|
5.
Operating activity cash flows (1 + 2 + 3 + 4) : 61500 |
12.037.113,00 |
9.337.493,00 |
6.335.777,00 |
1.424.320,00 |
12.681.317,00 |
|
|
6.
Payments for investment (-).: 62100 |
-9.064.241,00 |
-12.810.982,00 |
-3.841.487,00 |
-3.623.368,00 |
-6.024.185,00 |
|
|
a) Companies of the group and affiliates. : 62101 |
-2.902.928,00 |
-8.360.000,00 |
-85.000,00 |
0,00 |
-4.108.191,00 |
|
|
b) Intangible fixed assets. : 62102 |
-4.267.240,00 |
-2.689.359,00 |
-2.669.278,00 |
-2.189.836,00 |
-1.578.439,00 |
|
|
c) Fixed assets. : 62103 |
-1.894.073,00 |
-1.761.623,00 |
-1.087.209,00 |
-1.433.532,00 |
-337.555,00 |
|
|
7.
Divestment payment collection (+). : 62200 |
742.651,00 |
181.067,00 |
3.208.533,00 |
4.447.185,00 |
1.173.924,00 |
|
|
a) Companies of the group and affiliates. : 62201 |
0,00 |
85.000,00 |
113.730,00 |
3.531.441,00 |
100.000,00 |
|
|
b) Intangible fixed assets. : 62202 |
696.894,00 |
0,00 |
1.493.915,00 |
910.744,00 |
1.070.240,00 |
|
|
c) Fixed assets. : 62203 |
7.712,00 |
0,00 |
0,00 |
0,00 |
3.684,00 |
|
|
e) Other financial assets. : 62205 |
38.045,00 |
96.067,00 |
1.600.888,00 |
5.000,00 |
0,00 |
|
|
8.
Investment activity cash flows (6 + 7) minus Amortization: 62300 |
-8.321.590,00 |
-12.629.915,00 |
-632.954,00 |
823.817,00 |
-4.850.261,00 |
|
|
9.
Payment collection and payments for equity instruments. : 63100 |
0,00 |
0,00 |
0,00 |
0,00 |
0,00 |
|
|
10.
Payment collection and payments for financial liabilities instruments.:
63200 |
-172.837,00 |
4.783.095,00 |
-6.452.265,00 |
-1.509.000,00 |
-8.113.396,00 |
|
|
a) Issuance : 63201 |
0,00 |
10.000.000,00 |
1.656.716,00 |
3.300.000,00 |
0,00 |
|
|
2. Debts incurred with credit institutions (+). : 63203 |
0,00 |
10.000.000,00 |
0,00 |
0,00 |
0,00 |
|
|
3. Debts incurred with companies of the group and affiliates
(+).: 63204 |
0,00 |
0,00 |
1.656.716,00 |
3.300.000,00 |
0,00 |
|
|
b) Repayment and amortization of : 63207 |
-172.837,00 |
-5.216.905,00 |
-8.108.981,00 |
-4.809.000,00 |
-8.113.396,00 |
|
|
2. Debts incurred with credit institutions (-).: 63209 |
-172.837,00 |
-2.119.905,00 |
-8.108.981,00 |
-4.809.000,00 |
-8.113.396,00 |
|
|
3. Debts incurred with companies of the group and affiliates (-).
: 63210 |
0,00 |
-3.097.000,00 |
0,00 |
0,00 |
0,00 |
|
|
11.
Payments from dividends and remunerations from other assets instruments. :
63300 |
-3.500.000,00 |
0,00 |
0,00 |
0,00 |
0,00 |
|
|
a) Dividends (-).: 63301 |
-3.500.000,00 |
0,00 |
0,00 |
0,00 |
0,00 |
|
|
12.
Cash flows for financing activities (9+10+11).: 63400 |
-3.672.837,00 |
4.783.095,00 |
-6.452.265,00 |
-1.509.000,00 |
-8.113.396,00 |
|
|
D)
EFFECT OF EXCHANGE RATE CHANGES: 64000 |
0,00 |
0,00 |
0,00 |
0,00 |
0,00 |
|
|
E)
NET INCREASE/DECREASE OF CASH OR EQUIVALENT ASSETS (+/-5+/-8+/12+/-D) :
65000 |
42.686,00 |
1.490.673,00 |
-749.442,00 |
739.137,00 |
-282.340,00 |
|
|
Cash or equivalent assets as of beginning of the fiscal year.:
65100 |
1.613.441,00 |
122.768,00 |
872.210,00 |
133.073,00 |
415.413,00 |
|
|
Cash or equivalent assets as of end of the fiscal year.:
65200 |
1.656.127,00 |
1.613.441,00 |
122.768,00 |
872.210,00 |
133.073,00 |
|
|
FINANCIAL
DIAGNOSIS
|
|
|
|
|
> Economic-Financial Comparative Analysis
Data used in the following ratios and indicators is taken
from the Annual Accounts submitted by the company to the TRADE REGISTER.
>
Comparison within the Sector
|
Cash
Flow |
2013 |
2012 |
Variación 2013 - 2012 |
|
|||
|
|
Empresa |
Sector |
Empresa |
Sector |
Empresa |
Sector |
|
|
Cash
Flow over Sales: |
0,00 % |
0,02 % |
0,04 % |
0,01 % |
-97,23 % |
132,27 % |
|
|
EBITDA
over Sales: |
23,65 % |
11,48 % |
22,96 % |
9,23 % |
2,99 % |
24,40 % |
|
|
Cash
Flow Yield: |
0,00 % |
0,01 % |
0,02 % |
0,00 % |
-97,24 % |
|
|
|
Profitability |
2013 |
2012 |
Variación 2013 - 2012 |
|
|||
|
|
Empresa |
Sector |
Empresa |
Sector |
Empresa |
Sector |
|
|
Operating
economic profitability: |
14,08 % |
7,14 % |
11,47 % |
5,22 % |
22,72 % |
36,87 % |
|
|
Total
economic profitability: |
8,52 % |
3,93 % |
6,89 % |
2,49 % |
23,67 % |
57,87 % |
|
|
Financial
profitability: |
18,16 % |
4,65 % |
15,66 % |
1,31 % |
15,99 % |
254,49 % |
|
|
Margin:
|
13,93 % |
6,88 % |
11,76 % |
4,85 % |
18,45 % |
41,95 % |
|
|
Mark-up:
|
8,88 % |
4,79 % |
6,10 % |
1,58 % |
45,51 % |
202,88 % |
|
|
Solvency |
2013 |
2012 |
Variación 2013 - 2012 |
|
|||
|
|
Empresa |
Sector |
Empresa |
Sector |
Empresa |
Sector |
|
|
Liquidity:
|
0,18 |
0,13 |
0,25 |
0,12 |
-27,65 |
15,71 |
|
|
Acid
Test: |
1,38 |
0,86 |
2,14 |
0,85 |
-35,48 |
1,64 |
|
|
Working
Capital / Investment: |
0,14 |
0,05 |
0,20 |
0,03 |
-30,11 |
100,02 |
|
|
Solvency:
|
3,68 |
1,18 |
5,28 |
1,17 |
-30,37 |
0,76 |
|
|
Indebtedness |
2013 |
2012 |
Variación 2013 - 2012 |
|
|||
|
|
Empresa |
Sector |
Empresa |
Sector |
Empresa |
Sector |
|
|
Indebtedness
level: |
1,90 |
1,35 |
1,89 |
1,63 |
0,38 |
-17,16 |
|
|
Borrowing
Composition: |
4,04 |
0,99 |
5,88 |
1,02 |
-31,29 |
-3,79 |
|
|
Repayment
Ability: |
1.062,30 |
76,56 |
29,27 |
191,23 |
3.529,39 |
-59,97 |
|
|
Warranty:
|
1,53 |
1,75 |
1,53 |
1,62 |
-0,20 |
8,02 |
|
|
Generated
resources / Total creditors: |
0,19 |
0,09 |
0,21 |
0,07 |
-12,19 |
29,71 |
|
|
Efficiency |
2013 |
2012 |
Variación 2013 - 2012 |
|
|||
|
|
Empresa |
Sector |
Empresa |
Sector |
Empresa |
Sector |
|
|
Productivity:
|
1,84 |
1,88 |
1,82 |
1,73 |
0,98 |
8,81 |
|
|
Turnover
of Collection Rights : |
5,00 |
5,10 |
3,93 |
4,79 |
27,21 |
6,37 |
|
|
Turnover
of Payment Entitlements: |
2,83 |
3,69 |
4,31 |
3,52 |
-34,17 |
4,91 |
|
|
Stock
rotation: |
6,56 |
7,43 |
6,57 |
6,49 |
-0,08 |
14,43 |
|
|
Assets
turnover: |
1,01 |
1,04 |
0,98 |
1,08 |
3,60 |
-3,58 |
|
|
Borrowing
Cost: |
3,40 |
2,84 |
3,97 |
2,95 |
-14,46 |
-3,95 |
|
>
Trend of indicators under the General Accounting Plan of 2007 (2013, 2012,
2011, 2010, 2009)
|
Cash
Flow |
2013 |
2012 |
2011 |
2010 |
2009 |
|
|
Cash
Flow over Sales: |
0,00 % |
0,04 % |
-0,02 % |
0,02 % |
-0,01 % |
|
|
EBITDA
over Sales: |
23,65 % |
22,96 % |
23,74 % |
17,06 % |
22,20 % |
|
|
Cash
Flow Yield: |
0,00 % |
0,02 % |
-0,01 % |
0,01 % |
0,00 % |
|
|
Profitability |
2013 |
2012 |
2011 |
2010 |
2009 |
|
|
Operating
economic profitability: |
14,08 % |
11,47 % |
10,53 % |
4,45 % |
5,39 % |
|
|
Total
economic profitability: |
8,52 % |
6,89 % |
9,45 % |
0,87 % |
-0,25 % |
|
|
Financial
profitability: |
18,16 % |
15,66 % |
23,68 % |
4,55 % |
-5,08 % |
|
|
Margin:
|
13,93 % |
11,76 % |
10,85 % |
5,87 % |
6,99 % |
|
|
Mark-up:
|
8,88 % |
6,10 % |
7,46 % |
-2,08 % |
-5,45 % |
|
|
Solvency |
2013 |
2012 |
2011 |
2010 |
2009 |
|
|
Liquidity:
|
0,18 |
0,25 |
0,01 |
0,06 |
0,01 |
|
|
Acid
Test: |
1,38 |
2,14 |
1,18 |
0,65 |
0,59 |
|
|
Working
Capital / Investment: |
0,14 |
0,20 |
0,16 |
0,02 |
-0,03 |
|
|
Solvency:
|
3,68 |
5,28 |
3,42 |
2,02 |
1,70 |
|
|
Indebtedness |
2013 |
2012 |
2011 |
2010 |
2009 |
|
|
Indebtedness
level: |
1,90 |
1,89 |
1,91 |
2,77 |
3,09 |
|
|
Borrowing
Composition: |
4,04 |
5,88 |
2,81 |
2,03 |
2,10 |
|
|
Repayment
Ability: |
1.062,30 |
29,27 |
-49,53 |
56,51 |
-158,51 |
|
|
Warranty:
|
1,53 |
1,53 |
1,53 |
1,36 |
1,33 |
|
|
Generated
resources / Total creditors: |
0,19 |
0,21 |
0,28 |
0,19 |
0,18 |
|
|
Efficiency |
2013 |
2012 |
2011 |
2010 |
2009 |
|
|
Productivity:
|
1,84 |
1,82 |
1,94 |
1,55 |
1,73 |
|
|
Turnover
of Collection Rights : |
5,00 |
3,93 |
4,62 |
4,99 |
4,57 |
|
|
Turnover
of Payment Entitlements: |
2,83 |
4,31 |
3,86 |
3,43 |
1,90 |
|
|
Stock
rotation: |
6,56 |
6,57 |
6,12 |
6,14 |
7,49 |
|
|
Assets
turnover: |
1,01 |
0,98 |
0,97 |
0,76 |
0,77 |
|
|
Borrowing
Cost: |
3,40 |
3,97 |
3,90 |
3,16 |
4,33 |
|
COMPARATIVE
SECTORIAL BALANCE
|
|
|
|
|
Sector-based Comparison
under the rules of the New General Accounting Plan.
|
|
Variación - |
|
|
|
Empresa |
Sector |
|
|
Variación - |
|
|
|
Empresa |
Sector |
|
|
Variación - |
|
|
|
Empresa |
Sector |
|
Public
Tenders and Works Won
|
|
|
|
|
|
|
|
Organisation
that calls the tender: |
|
CONSEJERIA DE SANIDAD DE LA COMUNIDAD AUTONOMA DE
VALENCIA |
|
Objective
of Tender: |
|
Adopción del tipo de producto y selección de proveedores
para el suministro de principios activos, formas farmacéuticas y dosis,
medicamentos |
|
Date
Awarded: |
|
06/02/2006 |
|
Cost: |
|
indeterminado |
|
|
|
Organisation
that calls the tender: |
|
CONSEJERIA DE SANIDAD DE LA COMUNIDAD AUTONOMA DE
VALENCIA |
|
Objective
of Tender: |
|
suministro de principios activos, formas
farmacéuticas y dosis - medicamentos II. |
|
Date
Awarded: |
|
06/02/2006 |
|
Cost: |
|
Indeterminado |
|
|
|
Organisation
that calls the tender: |
|
CLINICA PUERTA DE HIERRO-HOSPITAL UNIVERSITARIO
DE MADRID |
|
Objective
of Tender: |
|
Suministro de medicamentos para el Hospital
Universitario Puerta de Hierro |
|
Date
Awarded: |
|
21/10/2005 |
|
Cost: |
|
2.169.343,42 euros, IMPORTE COMPARTIDO POR VARIOS
CONTRATISTAS |
|
|
|
Organisation
that calls the tender: |
|
HOSPITAL COMARCAL DEL NOROESTE DE LA REGION DE
MURCIA |
|
Objective
of Tender: |
|
Contratación suministro medicamentos uso
hospitalario |
|
Date
Awarded: |
|
14/10/2005 |
|
Cost: |
|
ver importe de adjudicacion segun lote en la
imagen. |
|
|
|
Organisation
that calls the tender: |
|
INSTITUTO MADRILEÑO DE SALUD |
|
Objective
of Tender: |
|
Adquisición de medicamentos |
|
Date
Awarded: |
|
28/02/2005 |
|
Cost: |
|
SEGUN CONTRATISTA, VER IMAGEN |
|
Detail
of Subsidies appearing in Balances Memories
|
|
|
|
|
|
Entity |
MINISTERIO DE INDUSTRIA, TURIMO Y COMERCIO |
|
Subsidy Concept |
subvencion de capital |
|
Status |
CONCEDIDA |
|
Amount Granted |
9.017,00 |
|
Notes |
El saldo reflejado se corresponde al imputado a
resultados |
|
Entity |
MINISTERIO DE INDUSTRIA, TURIMOS Y COMERCIO |
|
Status |
CONCEDIDA |
|
Amount Granted |
9.019,00 |
|
Notes |
El saldo reflejado se corresponde al imputado a
resultados durante el ejercicio y existe un saldo al cierre del ejercicio de
67.078 euros. |
|
Entity |
MINISTERIO DE INDUSTRIA, TURIMOS Y COMERCIO |
|
Subsidy Concept |
Subvención del tipo de interés derivada de los
préstamos concedidos a tipo de interés cero. |
|
Status |
CONCEDIDA |
|
Amount Granted |
30.581,00 |
|
Notes |
El saldo reflejado se corresponde al imputado a resultados
durante el ejercicio y existe un saldo al cierre del ejercicio de 76097
euros. |
|
Entity |
MINISTERIO DE INDUSTRIA, TURIMOS Y COMERCIO |
|
Subsidy Concept |
Subvención de capital. |
|
Status |
CONCEDIDA |
|
Amount Granted |
63.495,00 |
|
Notes |
El saldo reflejado se corresponde al imputado a
resultados durante el ejercicio y existe un saldo al cierre del ejercicio de
309.053 euros. |
|
Entity |
PROGRAMA DE FOMENTO DE INVESTIGACION TECNICA |
|
Subsidy Concept |
Subvención de explotación. |
|
Status |
CONCEDIDA |
|
Amount Granted |
50.000,00 |
|
Notes |
Para la ayuda en la investigación y desarrollo. |
|
Entity |
MINISTERIO DE INDUSTRIA, TURIMOS Y COMERCIO |
|
Subsidy Concept |
Subvención de capital. |
|
Status |
CONCEDIDA |
|
Amount Granted |
27.925,00 |
|
Notes |
El saldo reflejado se corresponde al imputado a
resultados durante el ejercicio. |
|
Research
Summary
|
|
Company founded in 1967 engaged in the manufacture and commercialisation of active pharmaceutical ingredients and pharmaceutical specialities. National and international business scope. Nothing appears against it in the sources consulted an although the latest figures presented in the trade register (31-12-2013), we note that drags a loss carryforwards of 1,763,395 Euro / s, we believe that the can follow normal operations relating to risk, although it would be necessary to monitor their evolution |
FOREIGN EXCHANGE RATES
|
Currency |
Unit
|
Indian Rupees |
|
US Dollar |
1 |
Rs.62.61 |
|
|
1 |
Rs.94.39 |
|
Euro |
1 |
Rs.67.96 |
INFORMATION DETAILS
|
Analysis Done by
: |
DIV |
|
|
|
|
Report Prepared
by : |
ASH |
RATING EXPLANATIONS
|
RATING |
STATUS |
PROPOSED CREDIT LINE |
|
|
>86 |
Aaa |
Possesses an extremely sound financial base with the strongest
capability for timely payment of interest and principal sums |
Unlimited |
|
71-85 |
Aa |
Possesses adequate working capital. No caution needed for credit transaction.
It has above average (strong) capability for payment of interest and
principal sums |
Large |
|
56-70 |
A |
Financial & operational base are regarded healthy. General unfavourable
factors will not cause fatal effect. Satisfactory capability for payment of
interest and principal sums |
Fairly Large |
|
41-55 |
Ba |
Overall operation is considered normal. Capable to meet normal
commitments. |
Satisfactory |
|
26-40 |
B |
Capability to overcome financial difficulties seems comparatively
below average. |
Small |
|
11-25 |
Ca |
Adverse factors are apparent. Repayment of interest and principal sums
in default or expected to be in default upon maturity |
Limited with full
security |
|
<10 |
C |
Absolute credit risk exists. Caution needed to be exercised |
Credit not
recommended |
|
-- |
NB |
New Business |
-- |
This score serves as a reference to assess SC’s
credit risk and to set the amount of credit to be extended. It is calculated
from a composite of weighted scores obtained from each of the major sections of
this report. The assessed factors and their relative weights (as indicated
through %) are as follows:
Financial
condition (40%) Ownership
background (20%) Payment
record (10%)
Credit history
(10%) Market trend (10%) Operational size
(10%)
This report is issued at your request without any
risk and responsibility on the part of MIRA INFORM PRIVATE LIMITED (MIPL)
or its officials.