MIRA INFORM REPORT
|
Report No. : |
320861 |
|
Report Date : |
09.05.2015 |
IDENTIFICATION DETAILS
|
Name : |
POLYPLEX
[THAILAND] PUBLIC COMPANY LIMITED |
|
|
|
|
Formerly Known As : |
POLYPLEX [THAILAND] LTD. |
|
|
|
|
Registered Office : |
18th Floor, Ocean Tower II,
75/26 Sukhumvit 19 Road, Klongtoeynua, Wattana, Bangkok 10110 |
|
|
|
|
Country : |
Thailand |
|
|
|
|
Financials (as on) : |
31.03.2014 |
|
|
|
|
Date of Incorporation : |
26.03.2002 |
|
|
|
|
Com. Reg. No.: |
0107547000729 |
|
|
|
|
Legal Form : |
Public Limited Company |
|
|
|
|
Line of Business : |
Manufacturer, Exporter & Distributor
of Polyester Film, Polyester Chips, Thermal Lamination Film and Cast
Polypropylene Film. |
|
|
|
|
No. of Employees : |
650 |
RATING & COMMENTS
|
MIRA’s Rating : |
B |
|
RATING |
STATUS |
PROPOSED CREDIT LINE |
|
|
26-40 |
B |
Capability to overcome financial difficulties seems comparatively
below average. |
Small |
|
Status : |
Moderate |
|
Payment Behaviour : |
Slow but correct |
|
Litigation : |
Clear |
NOTES:
Any query related to this report can be made
on e-mail: infodept@mirainform.com
while quoting report number, name and date.
ECGC Country Risk Classification List – December 31, 2014
|
Country Name |
Previous Rating (30.09.2014) |
Current Rating (31.12.2014) |
|
Thailand |
B1 |
B1 |
|
Risk Category |
ECGC
Classification |
|
Insignificant |
A1 |
|
Low |
A2 |
|
Moderate |
B1 |
|
High |
B2 |
|
Very High |
C1 |
|
Restricted |
C2 |
|
Off-credit |
D |
THAILAND - ECONOMIC OVERVIEW
With a well-developed infrastructure, a free-enterprise
economy, generally pro-investment policies, and strong export industries,
Thailand has had a strong economy due in part to industrial and agriculture exports
- mostly electronics, agricultural commodities, automobiles and parts, and
processed foods. Thailand attracts nearly 2.5 million migrant workers from
neighboring countries. The Thai government in 2013 implemented a nation-wide
300 baht ($10) per day minimum wage policy and deployed new tax reforms
designed to lower rates on middle-income earners. The Thai economy has
weathered both internal and external economic shocks in recent years. The
global economic recession severely cut Thailand's exports, with most sectors
experiencing double-digit drops. In late 2011 Thailand's recovery was
interrupted by historic flooding in the industrial areas in Bangkok and its
five surrounding provinces, crippling the manufacturing sector. Government
approved flood mitigation projects, worth $11.7 billion, were started in 2012
to prevent a repeat. Thai growth slowed in 2013 and has remained low since, as
the country faced political uncertainty and a coup in May 2014. The interim
government is implementing a special $11 billion short-term stimulus package
and has approved a budget of more than $80 billion to aid an economic rebound.
|
Source
: CIA |
Company
name
POLYPLEX [THAILAND] PUBLIC COMPANY LIMITED
SUMMARY
BUSINESS ADDRESS : 18th FLOOR,
OCEAN TOWER II,
75/26 SUKHUMVIT
19 ROAD, KLONGTOEYNUA,
WATTANA, BANGKOK
10110, THAILAND
TELEPHONE : [66] 2665-2706-8
FAX : [66] 2665-2705
E-MAIL ADDRESS : marketing@polyplex.com
WEBSITE : http://www.polyplexthailand.com
REGISTRATION ADDRESS : SAME AS
BUSINESS ADDRESS
ESTABLISHED : 2002
REGISTRATION NO. : 0107547000729 [Former
: 0107574700729]
TAX ID NO. : 3030526342
CAPITAL REGISTERED : BHT. 960,000,000
CAPITAL PAID-UP : BHT. 800,000,000
FISCAL YEAR CLOSING DATE : MARCH 31
LEGAL STATUS : PUBLIC LIMITED
COMPANY
EXECUTIVE : MR. AMIT
PRAKASH, INDIAN
MANAGING DIRECTOR
NO. OF STAFF : 650
LINES OF BUSINESS : POLYESTER FILM,
POLYESTER CHIPS,
THERMAL LAMINATION
FILM AND
CAST POLYPROPYLENE FILM
MANUFACTURER, EXPORTER
& DISTRIBUTOR
CORPORATE
PROFILE
OPERATING TREND : STABLE
PRESENT SITUATION : OPERATING NORMALLY
REPUTATION : GOOD WITH
NORMAL BUSINESS ENGAGEMENT
MANAGEMENT STANDARD : MANAGEMENT WITH
LOW PERFORMANCE
HISTORY
The subject
was established on March
26, 2002 as
a private limited
company under the
registered name “Polyplex [Thailand]
Ltd.” by Thai
and Indian groups.
It is mainly
engaged in producing
polyester film [plain and
metallized], polyester chips,
extrusion coated film
and cast polypropylene
film [plain and
metallized], and silicone
coated film products,
with BOI promoted. The
products are distributed to
both local and
overseas markets. Subject
currently employs approximately
650 staff.
On August
11, 2004, the
subject’s status was converted to
a public limited
company, namely POLYPLEX
[THAILAND] PUBLIC COMPANY
LIMITED, and was
listed on the
Stock Exchange of
Thailand [SET] under
symbolic name “PTL” on
December 15, 2004.
It achieved
various certifications as
follows:
- ISO
14001 : 2004 certification on
Environmental Management system
- ISO 9001
: 2008 certification on Quality
Mmanagement system
- OHSAS
18001 : 2007 certification on Occupational
Health and Safety
Management system
- ISO
22000 : 2005 certification on
Food Safety standards
- TPM Excellence Award [Category A]
The major
shareholder is Polyplex
[Asia] Pte. Ltd., which
is holding around
34.50% of the
subject’s shares, and
is a wholly
owned subsidiary of
Polyplex Corporation Limited,
in India, which
is also a
parent company of
the Polyplex Group
of companies.
The subject
has been granted
BOI promotion certificates
as the followings:
|
Privileges |
Type
of Business |
Date
Granted |
|
Certificate no. |
|
|
|
1321(2)/2545 |
PET film |
May 20,
2002 |
|
1287(2)/2546 |
PET film
and PET resin |
June 11,
2003 |
|
1159(2)/2548 |
Metallized Films |
February 22,
2005 |
|
1261(2)/2550 |
Extrusion Coated
Films |
March 14,
2007 |
|
(2)/2551 |
Metallized Films |
January 10,
2008 |
|
1110[2]2552 |
CPP Film
[Plain and Metallized
CPP] |
February 4,
2009 |
|
1719[2]2553 |
Silicone Coated
Film/Brown PP |
July 4,
2010 |
|
1705[2]2555 |
Thermal Lamination
Film [Line 2] |
May 12,
2012 |
|
1827[2]2555 |
PET Thick
Film and PET
resin |
May 21,
2012 |
|
1357/2557 |
Metallized Films |
March 20,
2014 |
The subject’s
registered address was
initially at 989 Siam Tower
Building, Rama 1 Rd., Pathumwan,
Bangkok 10330.
On July 12,
2002 the registered
address was relocated
to 18th Floor,
Ocean Tower II,
75/26 Sukhumvit 19 Road,
Klongtoeynua, Wattana, Bangkok
10110, and this
is the subject’s
current operation address.
THE
BOARD OF DIRECTORS
|
Name |
|
Nationality |
Age |
|
|
|
|
|
|
Mr. Sanjiv
Saraf |
[x] |
Indian |
57 |
|
Mr. Pranay
Kothari |
[x] |
Indian |
56 |
|
Mr. Manish
Gupta |
|
Indian |
47 |
|
Mr. Manu Leopairote |
|
Thai |
72 |
|
Dr.
Virabongsa Ramangkura |
|
Thai |
72 |
|
Mr. Shiraz Erach
Poonevala |
|
Indian |
51 |
|
Mr. Praphad Phodhivorakhun |
|
Thai |
69 |
|
Mr. Amit
Prakash |
[x] |
Indian |
- |
AUTHORIZED
PERSON
Anyone of
the mentioned directors
[x] can sign
on behalf of
the subject with
company’s affixed.
MANAGEMENT
Mr. Amit
Prakash is
the Managing Director.
He is
Indian nationality.
Mr. Vinod Sureka is the
Chief Financial Officer.
He is
Indian nationality.
Mr. Ramesh
Gupta is the Head - Business.
He is
Indian nationality.
Mr. Ashish
Glosh is
the Head - Sales &
Marketing.
He is
Indian nationality.
Mr. Suresh Sundaraman is the
Head - Operations.
He is
Indian nationality.
Mr. Manoj Sinha is the Head
- Sales & Marketing [Thick PET
Film].
He is
Indian nationality.
BUSINESS
OPERATIONS
The subject’s
activity is a
manufacturer, distributor and
exporter wide range
of polyester films
including PET Thin
Plain Film, PET
Thick Film, PET
Resin, Metallized Film,
CPP Plain Film,
CPP Metallized Film,
Brown PP Film,
Thermal Lamination Film,
and Silicone Coated Film.
Its products are
raw material for
packaging, industrial and
electrical products, such as coffee
bag, tea bag,
snack bag, softener
bag, detergent bag,
wire and cable
wrap and hot
stamping foil.
Ranges of
products are as
follows:
1. Transparent thin
PET films which can be divided
into 5 sub-categories
- Plain
- Corona or
chemically treated
- High adhesion
films
- Ultra clear
films
- Co-extruded films
2. Metallized PET
films
- Semi metallized film
[low optical density]
- High barrier
films
3. Specialty films
- Twist films
- Anti static
films
- Heat sealable
films
- Isotropic films,
high friction films
and etc.
- Matte films
- Thick films
4. Cast Polypropylene
film-product range:
- Lamination
& conversion grade film [transparent film
for lamination &
surface printing and
high hot tack
film for candy
packing]
- Metallizable grade
film [transparent heat
sealable film for
vacuum metallization]
- Twist grade
film
- Retort grade
film
5. Siliconized films [under
the brand name “SARACOTE” in
PET and PP
films are
used
in various applications
such as
- Shingle roofing
taps
- Release liner
in pressure sensitive labels
- Release liner
in pressure sensitive adhesive
tapes
- Release liner
in medical and
hygiene products
6. Thick PET
film-main sub categories
are as under:
- Milky white
- Clear/Ultra clear
- Transparent
- Hazy film
PRODUCTION
CAPACITY
Product Production Capacity [in
2013]
·
PET Thin
Plain Film 42,000 MT
per annum
·
PET Thick
Film 28,800 MT
per annum
·
PET Resin 80,500 MT per
annum
·
PET Metallized
Film 11,000 MT
per annum
·
CPP Plain
Film 10,000 MT
per annum
·
CPP Metallized
Film 4,200
MT per annum
·
Blown PP
Film 4,645
MT per annum
·
Coated Film 865
Mn Sqm per
annum
·
Thermal
Lamination Film
365 Mn Sqm
per annum
·
Silicone Coated
Film/Brown PP -
Thin PET
film products can be used
in the following
3 key segments:
- Packaging
Clear and Metallized
Thin PET Film
can be used
as part of
the outer layer
and middle layer
of the flexible
packaging such as
coffee bag, snack
bag, softener bag
and detergent bag.
- Industrial
Products
Comprising Hot Stamping
Foils, Flexible Air-conditioning Ducts,
Labels/ID cards, Lamination
Products and many
more.
- Electrical
Comprising Wire and Cable Wrap,
Membrane Switches, Flexible
Printed Circuits, Capacitors
and Motor Insulation.
Thermal Lamination
Films mainly cater
to the following
applications:
1.
Thermal Lamination
of documents or
printed media
2.
Reflective Insulation
3.
Flexible Packaging
4.
Rigid Packing
using in printing
corrugated carton board
CPP films
can be used
in the following
key segments:
1.
Packaging- textile
packaging, packaging of
health care products,
consumer products
and etc.
2.
Industrial-hot fill
bags & liners,
industrial adhesive tapes,
interior automotive
trim panels
and etc.
MAJOR BRANDS
“SARAFIL”,
“SARALAM”, “SARA CPP” and “SARACOAT”
PURCHASE
Raw materials, such
as PET, LDPE,
EVA are purchased
from both domestic
and overseas suppliers
in India, Germany,
France, Turkey, Singapore,
Korea, Malaysia,
United States of
America and the
countries in Middle
East.
MAJOR SUPPLIERS
Polyplex Corporation
Ltd. : India
Indo Rama
Group : Thailand
IRPC Public
Company Limited : Thailand
Polyplex Resins
Sanayi Ve Ticaret
A.S. : Turkey
Polyplex [Asia]
Pte. Ltd. :
Singapore
EXPORT
[COUNTRIES]
80%
of the products
is exported to United
States of America,
India, Canada, Singapore, Republic
of China, Taiwan
and Europe.
SALES [LOCAL]
20% of
the products is
sold locally to
manufacturers, wholesalers and
end-users.
MAJOR CUSTOMERS
Polyplex [Americas]
Inc. : U.S.A.
Polyplex Trading
[Shenzhen] Co., Ltd. : Republic
of China
REVENUE
STRUCTURE OF THE COMPANY
[domestic and
oversea sales]
|
|
2012-2013 |
2013-2014 |
||
|
|
Million
baht |
% |
Million
baht |
% |
|
Oversea Sales |
|
|
|
|
|
- Asia |
1,743.78 |
35.91 |
2,335.31 |
48.09 |
|
- North America |
977.46 |
20.13 |
739.90 |
15.24 |
|
- Europe |
202.01 |
4.16 |
203.60 |
4.19 |
|
- Other |
119.30 |
2.46 |
118.11 |
2.43 |
|
|
|
|
|
|
|
Total Oversea
Sales |
3,042.55 |
62.66 |
3,396.92 |
69.95 |
|
|
|
|
|
|
|
Domestic Sales |
975.67 |
21.98 |
906.45 |
19.80 |
|
Sales of
Chips/ Other |
187.21 |
4.22 |
214.14 |
4.68 |
|
|
|
|
|
|
|
Total Sales |
4,205.44 |
94.76 |
4,517.51 |
98.69 |
|
Other Income |
232.72 |
5.24 |
60.02 |
1.31 |
|
|
|
|
|
|
|
Total Revenue |
4,438.16 |
100.00 |
4,577.53 |
100.00 |
SUBSIDAIRY
COMPANIES
Polyplex Americas
Holding Inc.
Address :
12200 Ford Suite
A-210 Farmers Branch, Dallas, Texas-75234,
USA.
Business Type :
Distribution Company
Investment :
The subject holds 100%
of the company’s
shares.
Polyplex [Singapore]
Pte. Ltd.
Address :
61, Club Street,
Singapore-069436
Business Type :
Investment Holding Company
Investment :
The subject holds 100%
of the company’s
shares.
Polyplex Europe
B.V.
Address :
Netherlands
Business Type :
Investment Holding Company
Investment :
The subject holds 100%
of the company’s
shares.
Polyplex Trading
[Shenzhen] Co., Ltd.
Address :
Republic of China
Business Type :
Distribution Company
Investment :
The subject holds 100%
of the company’s
shares.
EcoBlue Limited
Address :
Thailand
Business Type : -
Investment :
The subject holds 80%
of the company’s
shares.
Polyplex Europa
Polester Film Sanayi
Ve Ticaret A.S.
Address :
Turkey
Business Type :
Manufacturer of polyester
films and ships
Investment :
The subject holds 100%
of the company’s
shares.
LITIGATION
Bankruptcy and
Receivership
There are no
litigation on bankruptcy
and receivership cases
filed against the
subject found at
Legal Execution Department
for the past
five years.
Others
There are
no legal suits
filed against the
subject according the
past two years.
CREDIT
Sales are by
cash or on
the credits term
of 30-60 days.
Local bills are
paid by cash
or on the
credits term of
30-60 days.
Imports are by
L/C at sight
or T/T.
Exports are against
T/T.
BANKING
Bangkok Bank Public Co.,
Ltd.
[Head Office : 333
Silom Rd., Silom,
Bangrak, Bangkok 10500]
Kaikornbank Public
Co., Ltd.
EMPLOYMENT
The subject
employs approximately 650 staff.
[office, sales staff
and factory workers]
LOCATION
DETAILS
The premise
is rented for
administrative office at
the heading address.
It is located
in commercial/residential area.
Factory I : 60/24 Moo 3,
Siam Eastern Industrial
Park, T. Mapyangporn,
A. Pluakdaeng, Rayong
21140, located on
44,800 square meters
of land.
Tel : [66] 38
891-352-4 Fax: [66] 38 891-358.
Factory II :
60/91 Moo 3,
Siam Eastern Industrial
Park, T. Mapyangporn,
A. Pluakdaeng,
Rayong 21140, located
on 56,000 square
meters of land.
Tel. [66]
38 891-352-4, Fax.
[66] 38 891-358.
COMMENT
The company is a
related company of
Polyplex Corporation Ltd., a
leading producer and exporter of polyester films from India.
It placed a great emphasis
on continuous improvement of
its quality and environmental
standards. Backed by its skillful workforce,
the company has gone from
strength to strength and today is one
of the
leading manufacturers and
exporters of polyester
films in Thailand.
The company’s
business remains solid.
FINANCIAL
INFORMATION
The capital
was initially registered
at Bht. 400,000 divided
into 40,000 shares
of Bht. 10 each.
The capital
was increased later
as follows:
Bht. 400,000,000
on May 7,
2002
Bht. 660,000,000
on May 16,
2003
The latest
registered capital was
increased to Bht. 960,000,000 divided
into 960,000,000 shares of
Bht. 1 each.
THE SHAREHOLDERS
LISTED WERE
[as
at July 2,
2014] at Bht.
800,000,000 of capitalization
|
NAME |
HOLDING |
% |
|
|
|
|
|
Polyplex [Asia]
Pte. Ltd. |
276,000,000 |
34.50 |
|
Polyplex Corporation
Limited |
132,000,000 |
16.50 |
|
Mr. Paiwan Chartpitak |
39,950,000 |
4.99 |
|
The Hong
Kong and Shanghai
banking Corporation Limited-Fund Services
Department |
28,000,000 |
3.50 |
|
Mr. Paisal Chartpitak |
18,750,000 |
2.34 |
|
Mrs. Yuwares Chusakul |
15,215,000 |
1.90 |
|
Thai NVDR
Co., Ltd. |
12,916,401 |
1.61 |
|
Mr.
Jaswinder Singh Pichitsing |
8,484,300 |
1.06 |
|
Ms. Varanya Chatpiriyaphan |
6,550,000 |
0.82 |
|
Mr. Chanyuth Chatpiriyaphan |
6,050,000 |
0.76 |
|
Other shareholders |
256,084,299 |
32.02 |
Total Shareholders
: 9,680
NAME OF AUDITOR & CERTIFIED PUBLIC
ACCOUNTANT NO.
Mr. Narong
Puntawong No. 3315
Ernst &
Young Office Limited
BALANCE
SHEET [BAHT]
The financial figures
published for March
31, 2014, 2013 & 2012 were:
ASSETS
|
Current Assets |
2014 |
2013 |
2012 |
|
|
|
|
|
|
Cash and cash equivalents |
22,313,575 |
75,923,455 |
29,641,023 |
|
Current investment |
- |
78,000,000 |
- |
|
Trade and
other receivable |
867,841,043 |
760,557,602 |
805,875,522 |
|
Inventories |
670,102,860 |
672,036,481 |
564,604,348 |
|
Advance payments
for purchase
of goods |
6,046,783 |
6,063,441 |
6,962,067 |
|
Input tax refundable |
39,038,195 |
63,346,522 |
- |
|
Other Current
Assets |
32,140,286 |
50,767,931 |
74,275,686 |
|
|
|
|
|
|
Total Current
Assets |
1,637,482,742 |
1,706,695,432 |
1,481,358,646 |
|
Investment in subsidiaries |
1,368,767,829 |
1,355,546,732 |
1,313,491,892 |
|
Property, plant
and equipment |
5,206,739,842 |
4,997,594,675 |
3,118,710,965 |
|
Deferred tax
assets |
141,339,118 |
55,620,643 |
- |
|
Advance payment
for purchase of
assets |
25,363,333 |
37,503,914 |
344,484,861 |
|
Others non-current
assets |
14,262,028 |
14,646,635 |
8,604,003 |
|
Total Assets |
8,393,954,892 |
8,167,608,031 |
6,266,650,367 |
LIABILITIES & SHAREHOLDERS' EQUITY [BAHT]
|
Current Liabilities |
2014 |
2013 |
2012 |
|
|
|
|
|
|
Short-term loan from financial
institutions |
984,923,812 |
385,000,000 |
80,000,000 |
|
Trade and
other payable |
629,651,617 |
665,078,137 |
602,326,785 |
|
Current portion of
long-term loan |
578,183,865 |
371,427,309 |
271,996,222 |
|
Other current
liabilities |
121,791,827 |
107,545,810 |
79,215,427 |
|
|
|
|
|
|
Total Current
Liabilities |
2,314,551,121 |
1,529,051,256 |
1,033,538,434 |
|
Long-term loan
from financial institutions - net
current portion |
2,791,777,802 |
2,562,418,211 |
1,156,339,503 |
|
Provision for
long-term employee benefits |
8,657,175 |
7,441,312 |
6,051,667 |
|
Total Liabilities
|
5,114,986,098 |
4,098,910,779 |
2,195,929,604 |
|
|
|
|
|
|
Shareholders'
Equity |
|
|
|
|
|
|
|
|
|
Share
capital : Baht 1 par
value Authorized
& issued share capital
960,000,000 shares |
960,000,000 |
960,000,000 |
960,000,000 |
|
|
|
|
|
|
Capital Paid |
800,000,000 |
800,000,000 |
800,000,000 |
|
Surplus on
share capital |
1,370,460,000 |
1,370,460,000 |
1,370,460,000 |
|
Retained Earning Appropriated - statutory
reserve |
96,000,000 |
96,000,000 |
96,000,000 |
|
Unappropriated |
1,012,508,794 |
1,802,237,252 |
1,804,260,763 |
|
Total Shareholders' Equity |
3,278,968,794 |
4,068,697,252 |
4,070,720,763 |
|
Total Liabilities
& Shareholders' Equity |
8,393,954,892 |
8,167,608,031 |
6,266,650,367 |
PROFIT
& LOSS ACCOUNT
|
Revenue |
2014 |
2013 |
2012 |
|
|
|
|
|
|
Sales income |
4,517,512,645 |
4,205,439,768 |
4,560,646,524 |
|
Exchange rate |
- |
173,836,044 |
- |
|
Dividend income |
- |
9,483,705 |
217,596,131 |
|
Others income |
60,015,110 |
49,402,782 |
77,719,578 |
|
Total Revenues |
4,577,527,755 |
4,438,162,299 |
4,855,962,233 |
|
Expenses |
|
|
|
|
|
|
|
|
|
Cost of
sales |
4,543,188,851 |
3,941,029,982 |
3,831,384,958 |
|
Selling expenses |
293,454,492 |
297,878,785 |
263,126,493 |
|
Administrative expenses |
82,177,067 |
74,924,889 |
70,479,707 |
|
Exchange losses |
336,790,865 |
- |
221,775,751 |
|
Total Expenses
|
5,255,611,275 |
4,313,833,656 |
4,386,766,909 |
|
|
|
|
|
|
Profit/[Loss] before
financial cost and Income
tax expenses |
[678,083,520] |
124,328,643 |
469,195,324 |
|
Financial cost |
[85,363,413] |
[45,972,797] |
[34,053,722] |
|
Profit/[Loss]
before income tax
expenses |
[763,446,933] |
78,355,846 |
435,141,602 |
|
Income tax
benefit |
85,718,475 |
36,516,021 |
- |
|
|
|
|
|
|
Net Profit / [Loss] |
[677,728,458] |
114,871,867 |
435,141,602 |
BALANCE
SHEET [BAHT]
The financial figures
published for December
31, 2014 was : ( Unaudited )
ASSETS
(Thousand
Baht]
|
Current Assets |
2014 |
|
|
|
|
Cash and cash
equivalents |
33,087 |
|
Trade and
other receivable |
977,759 |
|
Inventories |
701,590 |
|
Advance payments
for purchase of
goods |
4,029 |
|
Input tax refundable |
67,477 |
|
Other Current
Assets |
42,934 |
|
|
|
|
Total Current
Assets |
1,826,876 |
|
Investment in subsidiaries |
1,368,768 |
|
Property, plant
and equipment |
5,136,316 |
|
Deferred tax
assets |
156,645 |
|
Advance payment
for purchase of assets |
5,268 |
|
Others non-current
assets |
14,399 |
|
Total Assets |
8,508,272 |
LIABILITIES & SHAREHOLDERS' EQUITY [BAHT]
(Thousand
Baht]
|
Current Liabilities |
2014 |
|
|
|
|
Short-term loan from financial institutions |
1,536,000 |
|
Trade and
other payable |
675,962 |
|
Short-term loans
from related party |
17,500 |
|
Current portion of
long-term loan |
797,779 |
|
Other current
liabilities |
118,786 |
|
|
|
|
Total Current
Liabilities |
3,146,027 |
|
Long-term loan
from financial institutions - net
current portion |
2,237,179 |
|
Provision for
long-term employee benefits |
11,311 |
|
Total Liabilities
|
5,394,517 |
|
|
|
|
Shareholders'
Equity |
|
|
|
|
|
Share
capital : Baht 1 par
value Authorized
& issued share capital
960,000,000 shares |
960,000 |
|
|
|
|
Capital Paid |
800,000 |
|
Surplus on
share capital |
1,370,460 |
|
Retained Earning Appropriated - statutory
reserve |
96,000 |
|
Unappropriated |
847,295 |
|
Total Shareholders' Equity |
3,113,755 |
|
Total Liabilities
& Shareholders' Equity |
8,508,272 |
PROFIT
& LOSS ACCOUNT
For the
nine-month period ended 31, December 2014.
(Thousand
Baht]
|
Revenue |
2014 |
|
|
|
|
Sales income |
3,934,194 |
|
Exchange rate |
95,495 |
|
Others income |
53,180 |
|
Total Revenues |
4,082,869 |
|
Expenses |
|
|
|
|
|
Cost of sales |
3,846,676 |
|
Selling expenses |
247,977 |
|
Administrative expenses |
74,390 |
|
Total Expenses
|
4,169,043 |
|
|
|
|
Profit/[Loss] before
financial cost and
Income tax expenses |
[86,174] |
|
Financial cost |
[94,346] |
|
Profit/[Loss]
before income tax
expenses |
[180,520] |
|
Income tax
benefit |
15,306 |
|
|
|
|
Net Profit / [Loss] |
[165,214] |
FINANCIAL
ANALYSIS
|
ITEM |
UNIT |
2014 |
2013 |
2012 |
|
|
|
|
|
|
|
LIQUIDITY RATIO |
|
|
|
|
|
CURRENT RATIO |
TIMES |
0.71 |
1.12 |
1.43 |
|
QUICK RATIO |
TIMES |
0.38 |
0.60 |
0.81 |
|
|
|
|
|
|
|
ACTIVITY RATIO |
|
|
|
|
|
FIXED ASSETS
TURNOVER |
TIMES |
0.87 |
0.84 |
1.46 |
|
TOTAL ASSETS
TURNOVER |
TIMES |
0.54 |
0.51 |
0.73 |
|
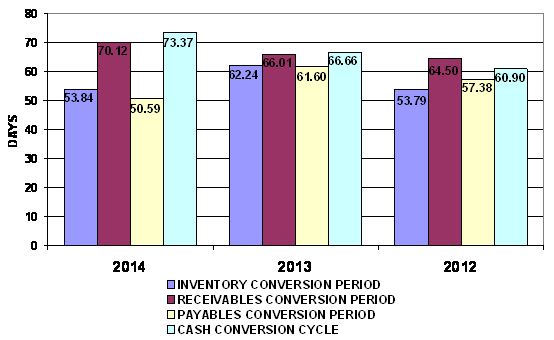
INVENTORY
CONVERSION PERIOD |
DAYS |
53.84 |
62.24 |
53.79 |
|
INVENTORY
TURNOVER |
TIMES |
6.78 |
5.86 |
6.79 |
|
RECEIVABLES
CONVERSION PERIOD |
DAYS |
70.12 |
66.01 |
64.50 |
|
RECEIVABLES
TURNOVER |
TIMES |
5.21 |
5.53 |
5.66 |
|
PAYABLES CONVERSION
PERIOD |
DAYS |
50.59 |
61.60 |
57.38 |
|
CASH CONVERSION
CYCLE |
DAYS |
73.37 |
66.66 |
60.90 |
|
|
|
|
|
|
|
PROFITABILITY RATIO |
|
|
|
|
|
COST OF GOODS
SOLD |
% |
100.57 |
93.71 |
84.01 |
|
SELLING &
ADMINISTRATION |
% |
8.32 |
8.86 |
7.31 |
|
INTEREST |
% |
1.89 |
1.09 |
0.75 |
|
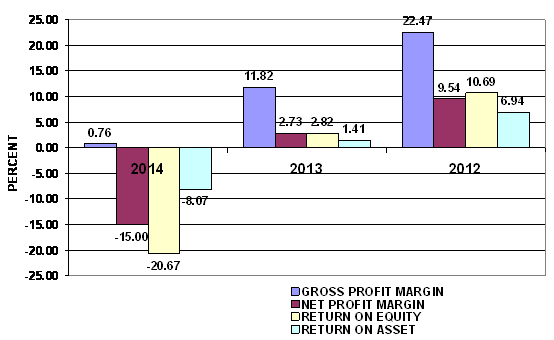
GROSS PROFIT
MARGIN |
% |
0.76 |
11.82 |
22.47 |
|
NET PROFIT MARGIN
BEFORE EX. ITEM |
% |
(15.01) |
2.96 |
10.29 |
|
NET PROFIT MARGIN |
% |
(15.00) |
2.73 |
9.54 |
|
RETURN ON EQUITY |
% |
(20.67) |
2.82 |
10.69 |
|
RETURN ON ASSET |
% |
(8.07) |
1.41 |
6.94 |
|
EARNING PER SHARE |
BAHT |
(0.85) |
0.14 |
0.54 |
|
|
|
|
|
|
|
LEVERAGE RATIO |
|
|
|
|
|
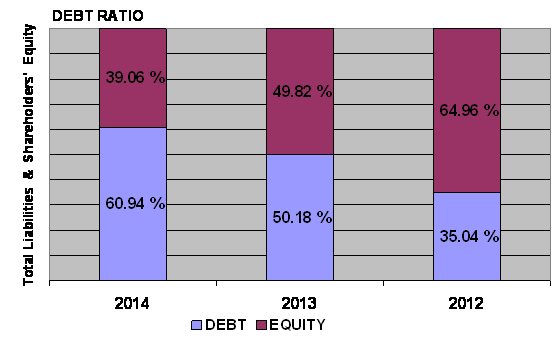
DEBT RATIO |
TIMES |
0.61 |
0.50 |
0.35 |
|
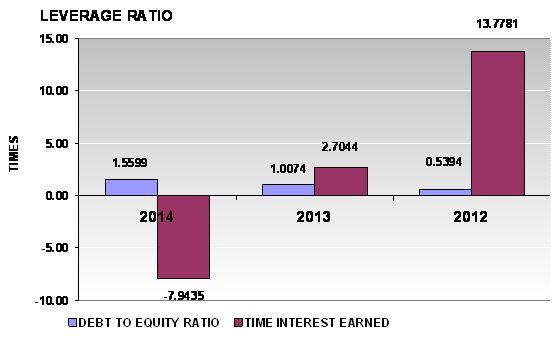
DEBT TO EQUITY
RATIO |
TIMES |
1.56 |
1.01 |
0.54 |
|
TIME INTEREST
EARNED |
TIMES |
(7.94) |
2.70 |
13.78 |
|
|
|
|
|
|
|
ANNUAL GROWTH |
|
|
|
|
|
SALES GROWTH |
% |
7.42 |
(7.79) |
|
|
OPERATING PROFIT |
% |
(645.40) |
(73.50) |
|
|
NET PROFIT |
% |
(689.99) |
(73.60) |
|
|
FIXED ASSETS |
% |
4.18 |
60.25 |
|
|
TOTAL ASSETS |
% |
2.77 |
30.33 |
|
ANNUAL
GROWTH: SATISFACTORY
An annual sales
growth is 7.42%. Turnover has increased from THB
PROFITABILITY : RISKY
PROFITABILITY RATIO
|
Gross Profit
Margin |
0.76 |
Deteriorated |
Industrial Average |
6.40 |
|
Net Profit Margin |
(15.00) |
Deteriorated |
Industrial Average |
6.13 |
|
Return on Assets |
(8.07) |
Deteriorated |
Industrial Average |
6.34 |
|
Return on Equity |
(20.67) |
Deteriorated |
Industrial Average |
11.02 |
Gross Profit Margin
used to assess a firm's financial health by revealing the proportion of money left
over from revenues after accounting for the cost of goods sold. Gross profit
margin serves as the source for paying additional expenses and future savings.
The company's figure is 0.76%. When compared with the industry average, the
ratio of the company was lower. This indicated that company may have problems
with control over its costs.
Net Profit Margin
is the indicator of the company's efficiency in that net profit takes into
consideration all expenses of the company. A low profit margin indicates a low
margin of safety, higher risk that a decline in sales will erase profits and
result in a net loss. The company's figure is -15%. When compared with the
industry average, the ratio of the company was lower.
Return on Assets
measures how efficiently profits are being generated from the assets employed
in the business when compared with the ratios of firms in a similar business. A
low ratio in comparison with industry averages indicates an inefficient use of
business assets. When compared with the industry average, it was lower, the company's figure is -8.07%.
Return on Equity
indicates how profitable a company is by comparing its net income to its
average shareholders' equity, ROE measures how much the shareholders earned for
their investment in the company. When compared with the industry average, it
was lower, the company's figure is -20.67%.
Trend of the average competitors in the same
industry for last 5 years
Return on Assets Uptrend
Return on Equity Uptrend
LIQUIDITY : RISKY
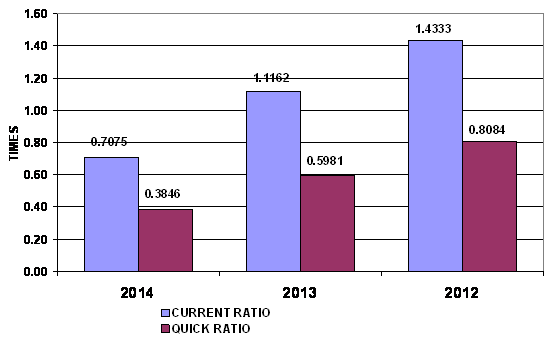
LIQUIDITY RATIO
|
Current Ratio |
0.71 |
Risky |
Industrial
Average |
2.17 |
|
Quick Ratio |
0.38 |
|
|
|
|
Cash Conversion
Cycle |
73.37 |
|
|
|
The Current Ratio is
to ascertain whether a company's short-term assets are readily available to pay
off its short-term liabilities. The company's figure is 0.71 times in 2014,
decreased from 1.12 times, then the company may not be efficiently using its
current assets. When compared with the industry average, the ratio of the
company was lower.
The Quick Ratio is
a liquidity indicator that further refines the current ratio by measuring the
amount of the most liquid current assets there are to cover current
liabilities. The company's figure is 0.38 times in 2014, decreased from 0.6
times, then the company has not enough current assets that presumably can be
quickly converted to cash for pay financial obligations.
The Cash Conversion
Cycle measures the number of days a company's cash is tied up in the production
and sales process of its operations and the benefit from payment terms from its
creditors. It meant the company could survive when no cash inflow was received
from sale for 74 days.
Trend of the average competitors in the same
industry for last 5 years
Current Ratio Uptrend
LEVERAGE : RISKY
LEVERAGE RATIO
|
Debt Ratio |
0.61 |
Acceptable |
Industrial Average |
0.61 |
|
Debt to Equity
Ratio |
1.56 |
Risky |
Industrial Average |
1.03 |
|
Times Interest
Earned |
(7.94) |
Risky |
Industrial Average |
- |
Debt to Equity Ratio
a measurement of how much suppliers, lenders, creditors and obligors have
committed to the company versus what the shareholders have committed. A higher
the percentage means that the company is using less equity and has stronger
leverage position.
Times Interest
Earned measuring a company's ability to meet its debt obligations. Ratio is
-7.95 lower than 1, so the company is not generating enough cash from EBIT to meet its interest obligations.
Debt Ratio shows
the proportion of a company's assets which are financed through debt. The
company's figure is 0.61 greater than 0.5, most of the company's assets are
financed through debt.
Trend of the average competitors in the same
industry for last 5 years
Debt Ratio Uptrend
Times Interest
Earned Stable
ACTIVITY : SATISFACTORY
ACTIVITY RATIO
|
Fixed Assets
Turnover |
0.87 |
Impressive |
Industrial Average |
- |
|
Total Assets
Turnover |
0.54 |
Deteriorated |
Industrial Average |
1.55 |
|
Inventory Conversion
Period |
53.84 |
|
|
|
|
Inventory
Turnover |
6.78 |
Satisfactory |
Industrial Average |
8.61 |
|
Receivables
Conversion Period |
70.12 |
|
|
|
|
Receivables
Turnover |
5.21 |
Acceptable |
Industrial Average |
8.60 |
|
Payables Conversion
Period |
50.59 |
|
|
|
The company's
Account Receivable Ratio is calculated as 5.21 and
Inventory Turnover
in Days Ratio indicates the liquidity of inventory. It estimates the number of
days that it will take to sell the current inventory. Inventory is particularly
sensitive to change in business activities. The inventory turnover in days has
decreased from 62 days at the end of 2013 to 54 days at the end of 2014. This
represents a positive trend. And Inventory turnover has increased from 5.86
times in year 2013 to 6.78 times in year 2014.
The company's Total
Asset Turnover is calculated as 0.54 times and 0.51 times in 2014 and 2013
respectively. This ratio is determined by dividing total assets into total
sales turnover. The ratio measures the activity of the assets and the ability
of the firm to generate sales through the use of the assets.
Trend of the average competitors in the same
industry for last 5 years
Fixed Assets
Turnover Stable
Total Assets
Turnover Uptrend
Inventory Turnover Uptrend
Receivables
Turnover Uptrend
FOREIGN EXCHANGE RATES
|
Currency |
Unit
|
Indian Rupees |
|
US Dollar |
1 |
Rs.64.05 |
|
|
1 |
Rs.99.04 |
|
Euro |
1 |
Rs.71.76 |
INFORMATION DETAILS
|
Analysis Done by
: |
KAR |
|
|
|
|
Report Prepared
by : |
NIT |
RATING EXPLANATIONS
|
RATING |
STATUS |
PROPOSED CREDIT LINE |
|
|
|
>86 |
Aaa |
Possesses an extremely sound financial base with the strongest
capability for timely payment of interest and principal sums |
Unlimited |
|
|
71-85 |
Aa |
Possesses adequate working capital. No caution needed for credit
transaction. It has above average (strong) capability for payment of interest
and principal sums |
Large |
|
|
56-70 |
A |
Financial & operational base are regarded healthy. General unfavourable
factors will not cause fatal effect. Satisfactory capability for payment of
interest and principal sums |
Fairly Large |
|
|
41-55 |
Ba |
Overall operation is considered normal. Capable to meet normal
commitments. |
Satisfactory |
|
|
26-40 |
B |
Capability to overcome financial difficulties seems comparatively
below average. |
Small |
|
|
11-25 |
Ca |
Adverse factors are apparent. Repayment of interest and principal sums
in default or expected to be in default upon maturity |
Limited with
full security |
|
|
<10 |
C |
Absolute credit risk exists. Caution needed to be exercised |
Credit not
recommended |
|
|
-- |
NB |
New Business |
-- |
|
This score serves as a reference to assess SC’s
credit risk and to set the amount of credit to be extended. It is calculated
from a composite of weighted scores obtained from each of the major sections of
this report. The assessed factors and their relative weights (as indicated
through %) are as follows:
Financial
condition (40%) Ownership
background (20%) Payment
record (10%)
Credit history
(10%) Market trend (10%) Operational size
(10%)
This report is issued at your request without any
risk and responsibility on the part of MIRA INFORM PRIVATE LIMITED (MIPL) or
its officials.