MIRA INFORM REPORT
|
Report No. : |
321501 |
|
Report Date : |
09.05.2015 |
IDENTIFICATION DETAILS
|
Name : |
SONATA SOFTWARE LIMITED |
|
|
|
|
Registered
Office : |
208, T V Industrial Estate, 2nd Floor, S. K. Ahire Marg, Worli, Mumbai – 400030, Maharashtra |
|
Tel. No.: |
91-22-24943055 |
|
|
|
|
Country : |
India |
|
|
|
|
Financials (as
on) : |
31.03.2014 |
|
|
|
|
Date of
Incorporation : |
18.10.1994 |
|
|
|
|
Com. Reg. No.: |
082110 |
|
|
|
|
Capital Investment
/ Paid-up Capital : |
Rs.105.159 Million |
|
|
|
|
CIN No.: [Company Identification
No.] |
L72200MH1994PLC082110 |
|
|
|
|
TAN No.: [Tax Deduction &
Collection Account No.] |
MUMS31130B |
|
|
|
|
PAN No.: [Permanent Account No.] |
Not Available |
|
|
|
|
Legal Form : |
A Public Limited Liability Company. The Company’s Shares are Listed on
the Stock Exchanges |
|
|
|
|
Line of Business
: |
The Company is primarily engaged in the business of providing IT Services and Solutions. |
|
|
|
|
No. of Employees
: |
2,565
(Approximately) |
RATING & COMMENTS
|
MIRA’s Rating : |
A (65) |
|
RATING |
STATUS |
PROPOSED CREDIT LINE |
|
|
56-70 |
A |
Financial & operational base are regarded healthy. General
unfavourable factors will not cause fatal effect. Satisfactory capability for
payment of interest and principal sums |
Fairly Large |
|
Maximum Credit Limit : |
USD 9120000 |
|
|
|
|
Status : |
Good |
|
|
|
|
Payment Behaviour : |
Regular |
|
|
|
|
Litigation : |
Clear |
|
|
|
|
Comments : |
Subject is an established company having fine track. Fundamentals of the company are decent. Financial position of the
company is strong and healthy. Rating also takes into consideration low debt
level. However, trade relations are reported to be fair. Business is active.
Payment terms are reported to be regular and as per commitment. The company can be considered for business dealings at usual trade
terms and conditions. |
NOTES :
Any query related to this report can be made
on e-mail : infodept@mirainform.com
while quoting report number, name and date.
ECGC Country Risk Classification List – December 31, 2014
|
Country Name |
Previous Rating (30.09.2014) |
Current Rating (31.12.2014) |
|
India |
A1 |
A1 |
|
Risk Category |
ECGC
Classification |
|
Insignificant |
A1 |
|
Low |
A2 |
|
Moderate |
B1 |
|
High |
B2 |
|
Very High |
C1 |
|
Restricted |
C2 |
|
Off-credit |
D |
EXTERNAL AGENCY RATING
|
Rating Agency Name |
CRISIL |
|
Rating |
Long term rating : A/Positive |
|
Rating Explanation |
Adequate degree of safety and low credit risk. |
|
Date |
13.03.2015 |
RBI DEFAULTERS’ LIST STATUS
Subject’s name is not enlisted as a defaulter in
the publicly available RBI Defaulters’ list.
EPF (Employee Provident Fund) DEFAULTERS’ LIST STATUS
Subject’s name is not enlisted as a defaulter
in the publicly available EPF (Employee Provident Fund) Defaulters’ list as of
31-03-2014.
INFORMATION DENIED BY
|
Name : |
Mr. Pradeep |
|
Designation : |
Assistant Manager |
|
Contact No.: |
91-80-67782409 |
|
Date : |
06.5.2015 |
LOCATIONS
|
Registered Office : |
208, T V Industrial Estate, 2nd Floor, S. K. Ahire Marg, Worli, Mumbai – 400030, Maharashtra, India |
|
Tel. No.: |
91-22-24943055 |
|
Fax No.: |
91-22-24936973 |
|
E-Mail : |
|
|
Website : |
|
|
|
|
|
Corporate Office : |
APS Trust Building Bull Temple Road, N. R. Colony, Bangalore - 560 019, Karnataka, India |
|
Tel. No.: |
91-80-6778 1999 |
|
Fax No.: |
91-80-2661 0972 |
|
|
|
|
Branch Office : |
Located At :
|
|
|
|
|
International Office : |
Located At :
|
DIRECTORS
As on 31.03.2014
|
Name : |
Pradip P Shah |
|
Designation : |
Chairman |
|
|
|
|
Name : |
S B Ghia |
|
Designation : |
Director |
|
|
|
|
Name : |
M D Dalal |
|
Designation : |
Executive Vice Chairman |
|
|
|
|
Name : |
Viren Raheja |
|
Designation : |
Director |
|
|
|
|
Name : |
P Srikar Reddy |
|
Designation : |
Managing Director & CEO |
|
|
|
|
Name : |
S N Talwar |
|
Designation : |
Director |
|
|
|
|
Name : |
B K Syngal |
|
Designation : |
Director |
KEY EXECUTIVES
|
Name : |
Mr. Pradeep |
|
Designation : |
Assistant Manager |
|
|
|
|
AUDIT COMMITTEE |
|
|
Name : |
B K Syngal |
|
Designation : |
Chairman |
|
|
|
|
Name : |
S B Ghia |
|
Designation : |
Director |
|
|
|
|
Name : |
Pradip P Shah |
|
Designation : |
Director |
|
|
|
|
STAKEHOLDERS RELATIONSHIP COMMITTEE |
|
|
|
|
|
Name : |
S B Ghia |
|
Designation : |
Chairman |
|
|
|
|
Name : |
P Srikar Reddy |
|
Designation : |
M D Dalal |
|
|
|
|
NOMINATION & REMUNERATION COMMITTEE |
|
|
|
|
|
Name : |
S N Talwar |
|
Designation : |
Chairman |
|
|
|
|
Name : |
S B Ghia |
|
Designation : |
Director |
|
|
|
|
Name : |
B K Syngal |
|
Designation : |
Director |
|
|
|
|
Name : |
Viren Raheja |
|
Designation : |
Director |
|
|
|
|
CSR COMMITTEE |
|
|
|
|
|
Name : |
S B Ghia |
|
Designation : |
Chairman |
|
|
|
|
Name : |
S N Talwar |
|
Designation : |
Director |
|
|
|
|
Name : |
P Srikar Reddy |
|
Designation : |
Director |
|
|
|
|
Name : |
Priya Manoj Jaswani |
|
Designation : |
Company Secretary |
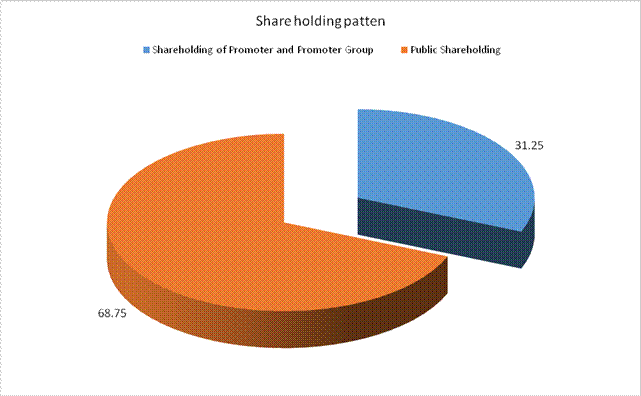
MAJOR SHAREHOLDERS / SHAREHOLDING PATTERN
As on 31.03.2015
|
Category of Shareholder |
Total No. of Shares |
Total Shareholding as a % of Total No. of Shares |
|
|
||
|
(A) Shareholding of
Promoter and Promoter Group |
||
|
|
|
|
|
|
29442210 |
28.00 |
|
|
3423457 |
3.26 |
|
|
32865667 |
31.25 |
|
|
|
|
|
Total shareholding of
Promoter and Promoter Group (A) |
32865667 |
31.25 |
|
|
|
|
|
(B) Public Shareholding |
||
|
|
|
|
|
|
214522 |
0.20 |
|
|
61861 |
0.06 |
|
|
8625024 |
8.20 |
|
|
8901407 |
8.46 |
|
|
|
|
|
|
9976200 |
9.49 |
|
|
|
|
|
Individual shareholders
holding nominal share capital up to Rs. 0.100 Million |
27262466 |
25.92 |
|
Individual shareholders
holding nominal share capital in excess of Rs. 0.100 Million |
21799649 |
20.73 |
|
|
4353917 |
4.14 |
|
|
1655675 |
1.57 |
|
|
800644 |
0.76 |
|
|
332594 |
0.32 |
|
|
1565004 |
1.49 |
|
|
63392232 |
60.28 |
|
Total Public shareholding
(B) |
72293639 |
68.75 |
|
|
|
|
|
Total (A)+(B) |
105159306 |
100.00 |
|
|
|
|
|
(C) Shares held by
Custodians and against which Depository Receipts have been issued |
|
|
|
|
0 |
0.00 |
|
|
0 |
0.00 |
|
|
0 |
0.00 |
|
|
|
|
|
Total (A)+(B)+(C) |
105159306 |
100.00 |
BUSINESS DETAILS
|
Line of Business : |
The Company is primarily engaged in the business of providing IT Services and Solutions. |
|
|
|
|
Products : |
Not Available |
|
|
|
|
Brand Names : |
Not Available |
|
|
|
|
Agencies Held : |
Not Available |
|
|
|
|
Exports : |
Not Available |
|
|
|
|
Imports : |
Not Available |
|
|
|
|
Terms : |
Not Available |
PRODUCTION STATUS : NOT AVAILABLE
GENERAL INFORMATION
|
Suppliers : |
|
||||||||||||||||||||||
|
|
|
||||||||||||||||||||||
|
Customers : |
|
||||||||||||||||||||||
|
|
|
||||||||||||||||||||||
|
No. of Employees : |
2,565 (Approximately) |
||||||||||||||||||||||
|
|
|
||||||||||||||||||||||
|
Bankers : |
|
||||||||||||||||||||||
|
|
|
||||||||||||||||||||||
|
Facilities : |
|
|
Auditors : |
|
|
Name : |
Deloitte Haskins and Sells Chartered Accountants |
|
|
|
|
Solicitors : |
|
|
Name : |
Talwar, Thakore and Associates Chartered Accountants |
|
|
|
|
Name : |
Dua and Associates Chartered Accountants |
|
|
|
|
Name : |
William E Horwich Chartered Accountants |
|
|
|
|
Name : |
Fladgate Fielder Chartered Accountants |
|
|
|
|
Memberships : |
-- |
|
|
|
|
Collaborators : |
-- |
|
|
|
|
Wholly owned
Subsidiaries Companies: |
|
CAPITAL STRUCTURE
As on 31.03.2014
Authorised Capital :
|
No. of Shares |
Type |
Value |
Amount |
|
|
|
|
|
|
150,000,000 |
Equity Shares |
Rs.1/- each |
Rs.150.000 Million |
|
|
|
|
|
Issued, Subscribed & Paid-up Capital :
|
No. of Shares |
Type |
Value |
Amount |
|
|
|
|
|
|
105,159,306 |
Equity Shares |
Rs.1/- each |
Rs.105.159
Million |
|
|
|
|
|
Reconciliation of number of
shares and amount outstanding at the beginning and at the end of the reporting
year
|
PARTICULARS |
Opening
balance |
Fresh issue
/ Other Changes |
Closing
balance |
|
Equity
shares with voting rights |
|
|
|
|
Year
ended 31st March 2014 |
|
|
|
|
Number
of shares |
105,159,306 |
-- |
105,159,306 |
|
Amount
[Rs. In Million] |
105.159 |
-- |
105.159 |
|
Equity
shares with voting rights |
|
|
|
|
Year
ended 31st March 2013 |
|
|
|
|
Number
of shares |
105,159,306 |
-- |
105,159,306 |
|
Amount
[Rs. In Million] |
105.159 |
-- |
105.159 |
Details of rights, preferences
and restrictions attached to each class of shares
The Company has equity shares having a par value of Rs. 1. Each shareholder is entitled for one vote per share. The shareholders have the right to receive interim dividends declared by the Board of directors and final dividends proposed by the Board and approved by the shareholders.
In the event of liquidation by the Company, the holders of the equity shares will be entitled to receive in proportion to the number of equity shares held by them, the remaining assets of the Company.
The shareholders have all other rights as available to equity shareholders as per the provisions of the Companies Act, 1956, read together with the Memorandum of Association and Articles of Association of the Company, as applicable.
Details
of shares held by each shareholder holding more than 5% shares
|
PARTICULARS |
As at 31.03.2014 |
|
|
|
No. of shares |
% of
holding |
|
Akshay
Raheja |
8,250,000 |
7.85 |
|
Viren
Raheja |
8,250,000 |
7.85 |
|
Suman
Raheja |
6,900,000 |
6.56 |
|
Hemendra
M Kothari |
9,050,000 |
8.61 |
FINANCIAL DATA
[all figures are
in Rupees Million]
ABRIDGED BALANCE
SHEET
|
SOURCES OF FUNDS |
31.03.2014 |
31.03.2013 |
31.03.2012 |
|
|
|
|
|
|
I.
EQUITY AND LIABILITIES |
|
|
|
|
(1)Shareholders' Funds |
|
|
|
|
(a) Share Capital |
105.159 |
105.159 |
105.159 |
|
(b) Reserves &
Surplus |
3087.994 |
2992.008 |
2881.860 |
|
(c) Money received
against share warrants |
0.000 |
0.000 |
0.000 |
|
|
|
|
|
|
(2) Share Application
money pending allotment |
0.000 |
0.000 |
0.000 |
|
Total Shareholders’ Funds
(1) + (2) |
3193.153 |
3097.167 |
2987.019 |
|
|
|
|
|
|
(3) Non-Current
Liabilities |
|
|
|
|
(a) long-term borrowings |
0.000 |
0.000 |
0.000 |
|
(b) Deferred tax
liabilities (Net) |
0.000 |
0.000 |
0.000 |
|
(c) Other long term
liabilities |
0.000 |
0.000 |
17.534 |
|
(d) long-term provisions |
6.958 |
0.000 |
55.274 |
|
Total Non-current
Liabilities (3) |
6.958 |
0.000 |
72.808 |
|
|
|
|
|
|
(4) Current Liabilities |
|
|
|
|
(a) Short term borrowings |
56.948 |
167.822 |
0.000 |
|
(b) Trade payables |
318.807 |
136.676 |
165.813 |
|
(c) Other current
liabilities |
59.812 |
60.432 |
199.849 |
|
(d) Short-term provisions |
437.419 |
223.616 |
36.443 |
|
Total Current Liabilities
(4) |
872.986 |
588.546 |
402.105 |
|
|
|
|
|
|
TOTAL |
4073.097 |
3685.713 |
3461.932 |
|
|
|
|
|
|
II.
ASSETS |
|
|
|
|
(1) Non-current assets |
|
|
|
|
(a) Fixed Assets |
|
|
|
|
(i) Tangible assets |
147.329 |
206.225 |
285.088 |
|
(ii) Intangible Assets |
0.033 |
0.165 |
4.937 |
|
(iii) Capital
work-in-progress |
0.189 |
0.000 |
5.176 |
|
(iv) Intangible assets
under development |
0.000 |
0.000 |
0.000 |
|
(b) Non-current
Investments |
510.001 |
842.637 |
908.203 |
|
(c) Deferred tax assets
(net) |
96.950 |
28.303 |
62.790 |
|
(d) Long-term Loan and Advances |
585.658 |
645.716 |
590.142 |
|
(e) Other Non-current
assets |
0.000 |
0.000 |
0.000 |
|
Total Non-Current Assets |
1340.160 |
1723.046 |
1856.336 |
|
|
|
|
|
|
(2) Current assets |
|
|
|
|
(a) Current investments |
576.609 |
217.693 |
220.075 |
|
(b) Inventories |
0.000 |
0.000 |
0.000 |
|
(c) Trade receivables |
641.891 |
586.225 |
624.536 |
|
(d) Cash and cash
equivalents |
1375.020 |
791.452 |
443.118 |
|
(e) Short-term loans and
advances |
83.171 |
332.054 |
305.288 |
|
(f) Other current assets |
56.246 |
35.243 |
12.579 |
|
Total Current Assets |
2732.937 |
1962.667 |
1605.596 |
|
|
|
|
|
|
TOTAL |
4073.097 |
3685.713 |
3461.932 |
PROFIT & LOSS
ACCOUNT
|
|
PARTICULARS |
31.03.2014 |
31.03.2013 |
31.03.2012 |
|
|
SALES |
|
|
|
|
|
Income |
3337.045 |
2327.598 |
2253.738 |
|
|
Other Income |
173.906 |
107.186 |
119.281 |
|
|
TOTAL (A) |
3510.951 |
2434.784 |
2373.019 |
|
|
|
|
|
|
|
Less |
EXPENSES |
|
|
|
|
|
Employees benefits
expense |
1862.721 |
1361.108 |
1461.156 |
|
|
Other expenses |
884.199 |
738.991 |
601.223 |
|
|
TOTAL (B) |
2746.920 |
2100.099 |
2062.379 |
|
|
|
|
|
|
|
|
PROFIT/ (LOSS) BEFORE INTEREST, TAX, DEPRECIATION AND
AMORTISATION (C) |
764.031 |
334.685 |
310.640 |
|
|
|
|
|
|
|
Less |
FINANCIAL EXPENSES (D) |
1.664 |
0.530 |
0.158 |
|
|
|
|
|
|
|
|
PROFIT / (LOSS) BEFORE
TAX, DEPRECIATION AND AMORTISATION (C-D) (E) |
762.367 |
334.155 |
310.482 |
|
|
|
|
|
|
|
Less/ Add |
DEPRECIATION/
AMORTISATION (F) |
73.922 |
97.216 |
107.710 |
|
|
|
|
|
|
|
|
PROFIT/ (LOSS) BEFORE TAX (E-F) (G) |
688.445 |
236.939 |
202.772 |
|
|
|
|
|
|
|
Less |
TAX (H) |
150.025 |
79.340 |
53.714 |
|
|
|
|
|
|
|
|
PROFIT/ (LOSS) AFTER TAX
(G-H) (I) |
538.420 |
157.599 |
149.058 |
|
|
|
|
|
|
|
Add |
PREVIOUS YEARS’ BALANCE BROUGHT
FORWARD |
1903.204 |
1976.504 |
1934.109 |
|
|
|
|
|
|
|
Less |
APPROPRIATIONS |
|
|
|
|
|
Transfer to General
Reserve |
60.000 |
16.000 |
15.000 |
|
|
Interim Dividend |
105.159 |
52.580 |
52.580 |
|
|
Proposed Dividend |
289.188 |
131.449 |
26.289 |
|
|
Tax on Dividend |
62.718 |
30.870 |
12.794 |
|
|
Total |
517.065 |
230.899 |
106.663 |
|
|
|
|
|
|
|
|
BALANCE CARRIED TO THE
B/S |
1924.559 |
1903.204 |
1976.504 |
|
|
|
|
|
|
|
|
EARNINGS IN FOREIGN CURRENCY |
|
|
|
|
|
F.O.B. Value of Exports |
3156.904 |
2306.785 |
2234.017 |
|
|
Other operating revenues |
7.679 |
6.064 |
5.279 |
|
|
TOTAL EARNINGS |
3164.583 |
2312.849 |
2239.296 |
|
|
|
|
|
|
|
|
IMPORTS |
|
|
|
|
|
Capital Goods |
0.000 |
2.996 |
2.617 |
|
|
TOTAL IMPORTS |
0.000 |
2.996 |
2.617 |
|
|
|
|
|
|
|
|
Earnings / (Loss) Per
Share (Rs.) |
5.12 |
1.50 |
1.42 |
KEY RATIOS
|
PARTICULARS |
|
31.03.2014 |
31.03.2013 |
31.03.2012 |
|
Net Profit Margin (PAT / Sales) |
(%) |
16.13 |
6.77 |
6.61 |
|
|
|
|
|
|
|
Operating Profit Margin (PBIDT/Sales) |
(%) |
22.90 |
14.38 |
13.78 |
|
|
|
|
|
|
|
Return on Total Assets (PBT/Total Assets} |
(%) |
19.86 |
8.42 |
8.16 |
|
|
|
|
|
|
|
Return on Investment (ROI) (PBT/Networth) |
|
0.22 |
0.08 |
0.07 |
|
|
|
|
|
|
|
Debt Equity Ratio (Total Debt /Networth) |
|
0.02 |
0.05 |
0.00 |
|
|
|
|
|
|
|
Current Ratio (Current Asset/Current Liability) |
|
3.13 |
3.33 |
3.99 |
FINANCIAL ANALYSIS
[all figures are
in Rupees Million]
DEBT EQUITY RATIO
|
Particular |
31.03.2012 |
31.03.2013 |
31.03.2014 |
|
|
(Rs. In Million) |
(Rs. In Million) |
(Rs. In Million) |
|
Share Capital |
105.159 |
105.159 |
105.159 |
|
Reserves & Surplus |
2881.860 |
2992.008 |
3087.994 |
|
Share Application money
pending allotment |
0.000 |
0.000 |
0.000 |
|
Net worth |
2987.019 |
3097.167 |
3193.153 |
|
|
|
|
|
|
long-term borrowings |
0.000 |
0.000 |
0.000 |
|
Short term borrowings |
0.000 |
167.822 |
56.948 |
|
Total borrowings |
0.000 |
167.822 |
56.948 |
|
Debt/Equity ratio |
0.000 |
0.054 |
0.018 |
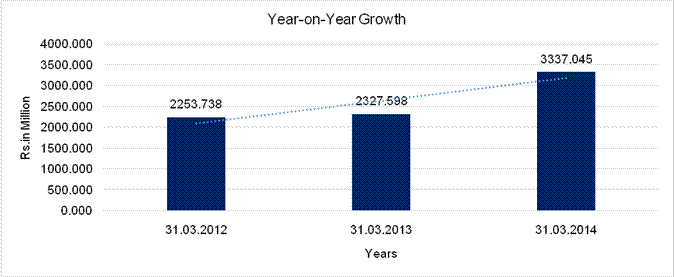
YEAR-ON-YEAR GROWTH
|
Year on Year Growth |
31.03.2012 |
31.03.2013 |
31.03.2014 |
|
|
(Rs. In Million) |
(Rs. In Million) |
(Rs. In Million) |
|
Sales |
2253.738 |
2327.598 |
3337.045 |
|
|
|
3.277 |
43.369 |
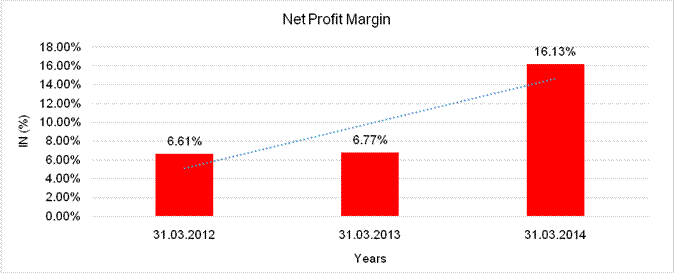
NET PROFIT MARGIN
|
Net Profit Margin |
31.03.2012 |
31.03.2013 |
31.03.2014 |
|
|
(Rs. In Million) |
(Rs. In Million) |
(Rs. In Million) |
|
Sales |
2253.738 |
2327.598 |
3337.045 |
|
Profit |
149.058 |
157.599 |
538.420 |
|
|
6.61% |
6.77% |
16.13% |
LOCAL AGENCY FURTHER INFORMATION
|
Sr. No. |
Check List by Info Agents |
Available in
Report (Yes / No) |
|
1] |
Year of Establishment |
Yes |
|
2] |
Locality of the firm |
Yes |
|
3] |
Constitutions of the firm |
Yes |
|
4] |
Premises details |
No |
|
5] |
Type of Business |
Yes |
|
6] |
Line of Business |
Yes |
|
7] |
Promoter's background |
Yes |
|
8] |
No. of employees |
No |
|
9] |
Name of person contacted |
Yes |
|
10] |
Designation of contact
person |
Yes |
|
11] |
Turnover of firm for last
three years |
Yes |
|
12] |
Profitability for last
three years |
Yes |
|
13] |
Reasons for variation
<> 20% |
-- |
|
14] |
Estimation for coming
financial year |
No |
|
15] |
Capital in the business |
Yes |
|
16] |
Details of sister
concerns |
Yes |
|
17] |
Major suppliers |
No |
|
18] |
Major customers |
No |
|
19] |
Payments terms |
No |
|
20] |
Export / Import details
(if applicable) |
No |
|
21] |
Market information |
-- |
|
22] |
Litigations that the firm
/ promoter involved in |
-- |
|
23] |
Banking Details |
Yes |
|
24] |
Banking facility details |
Yes |
|
25] |
Conduct of the banking
account |
-- |
|
26] |
Buyer visit details |
-- |
|
27] |
Financials, if provided |
Yes |
|
28] |
Incorporation details, if
applicable |
Yes |
|
29] |
Last accounts filed at
ROC |
No |
|
30] |
Major Shareholders, if
available |
Yes |
|
31] |
Date of Birth of
Proprietor/Partner/Director, if available |
Yes |
|
32] |
PAN of Proprietor/Partner/Director,
if available |
No |
|
33] |
Voter ID No of
Proprietor/Partner/Director, if available |
No |
|
34] |
External Agency Rating,
if available |
Yes |
CONTINGENT
LIABILITIES:
|
PARTICULARS |
31.03.2014 (Rs.
in Million) |
31.03.2013 (Rs.
in Million) |
|
Guarantees [The Company has given corporate guarantee to IBM Limited on behalf of Sonata Information Technology Limited, amount drawn down as at year-end by IBM Limited of this facility is Rs. Nil (Previous year – Rs. Nil).] |
50.000 |
50.000 |
|
Claims against the Company not acknowledged as debt [The Company has received a legal notice from its Ex-employee towards compensation arising on account of terms of appointment. Based on legal opinion received by the Company, the maximum amount payable in the event the proceeding goes against the Company is Rs. 22.863 Million] |
22.863 |
22.863 |
|
Disputed demand of Service tax [The Company renders Information Technology related services to some of its clients in India. The Service Tax department has classified these services as ‘Manpower Recruitment or Supply Agency Services’. The Company has contested this re classification and has preferred an appeal before the Central Excise and Service Tax Appellate Tribunal (CESTAT). One of the clients of the Company has indemnified the Company for any demands that may arise on account of service tax liability up to an amount of Rs. 23.700 Million. The amount included as disputed demand is excluding the amount indemnified by the client.] |
67.653 |
67.653 |
|
Disputed demands of Income-tax |
1410.577 |
687.173 |
|
Total |
1551.093 |
827.689 |
INDEX OF CHARGES
|
S.NO. |
CHARGE ID |
DATE OF CHARGE CREATION/MODIFICATION |
CHARGE AMOUNT
SECURED |
CHARGE HOLDER |
ADDRESS |
SERVICE REQUEST
NUMBER (SRN) |
|
1 |
10026461 |
15/09/2014 * |
240,000,000.00 |
STANDARD CHARTERED BANK |
NO. 112, SERENITY, KORAMANGALA INDUSTRIAL AREA, 5 |
C21527965 |
* Date of charge modification
BUSINESS PERFORMANCE
The Company is primarily engaged in the business of providing IT Services and Solutions to its customers in the US, Europe, Middle East and Asia Pacific and distribution of software products in India. The consolidated results of the Company include operations of its Indian and overseas subsidiaries and are best explained and analyzed under the two distinct segments of:
a) International IT Services and
b) Domestic Products and Services.
On an overall basis, for the year that ended on 31st March, 2014, they are very pleased to report that the Company has declared a record financial performance both on a consolidated basis and also in each of the individual business segments it operates in.
This remarkable growth coupled with a strong balance sheet has been the result of our continued efforts to engage with their customers as a transformational IT Services provider, deeper knowledge, client commitment, and bringing to bear their expertise on technologies like omni-channel commerce, mobile, big data analytics, social and cloud to their business processes. The above focused approach was invigorated by adopting the value statement of “Go Deeper”, essentially meaning go deeper into a customer to emerge higher in what we do for them. The Company continues to build on its traditional vertical of strength - Travel and Outsourced Product Development (OPD) while entering new verticals like Retail and CPG (Consumer Products & Goods). During the year, the Company was fittingly named Hybris’ Most Innovative Partner and Microsoft named it the Azure Cloud Partner of the year. While strengthening existing partnerships with large firms such as Microsoft and IBM, the Company forged new partnerships with leading technology firms and solution providers such as StorSimple, Moovweb etc. As a part of expanding near shore service delivery capabilities the Company opened a Development Centre facility at Redmond, USA and has also opened operations in Australia.
Notable steps taken by the Company during the year which supported its solid financial performance and which they believe will have a continued positive effect on the Company were:
• Establishment of an advisory board consisting of eminent technocrats and academicians to guide the CEO;
• Strengthening the Sales, Account Management, Alliances and Product Management processes and teams; and
• Further strengthening the Senior Management capabilities through additions in key positions such as - Head of Sales for USA, UK, Australia.
Their people are our greatest asset. They build lasting relationships with our customers and are key to the continued success and growth of their business. They continue to enhance our employee capability with continued investments in hiring the best, imparting training in areas of improvement of soft skills, management, technology and their domains of focus.
Coming to the results, both on a Standalone and Consolidated basis the Company has shown growth in all its financial metrics.
STANDALONE FINANCIALS
Total income has shown a growth of 44%, Earnings before Interest, Depreciation and Taxes (EBIDTA) a growth of 128% and Net Profit growth of 242%. Earnings per share at 5.12 showed a growth of 242%.
MANAGEMENT DISCUSSION
AND ANALYSIS
ECONOMIC OVERVIEW
Global activities recorded gradual recovery in 2013. Strengthening of activities was recorded in the second half of the year, a trend likely to continue through much of 2014. Global output growth, though, moderated slightly to 3 percent for 2013 from 3.2 percent recorded in 2012. GDP growth in Advanced Economies dropped marginally to 1.3 percent from 1.4 percent achieved in 2012 whereas Emerging Markets and Developing Economies posted a GDP growth of 4.7 percent in 2013, down from 5 percent recorded in 2012. Global economy is projected to maintain its growth momentum to post a GDP growth of 3.6 percent in 2014 and 3.9 percent in 2015.
Indian economy too witnessed some improvements in the second half of the fiscal year 2013-14 (FY14). Hovering inflation, high cost of capital, subdued demand and investment sentiments, policy inaction – Indian economy confronted multitude of intertwined problems. Deprecating rupee coupled with drying up of foreign capital pushed the government into damage control mode, pressing ahead with few policy reforms and fast tracking of infrastructure and industrial projects. All this did not prove enough, as the economy posted its second consecutive sub 5 percent growth. At 4.7 percent, the provisional estimated GDP growth for FY14, though, was marginally higher than 4.5 percent achieved in FY13.
Return of a stable government with revival of economic growth its stated priority, Indian economy is likely to accelerate its growth momentum, going forward. Gradually stabilizing growth in advanced economies bode well for country’s exports sector and Foreign Exchange Reserves. These factors shall put the economy back on higher growth trajectory; the recovery though would be gradual-but-sustainable. A trend that gets reflected in IMF’s growth projection of 5.4 percent and 6.4 percent respectively for calendar years 2014 and 2015.
GLOBAL IT SCENARIO
Incongruent to the contemporary economic and socio-political upheavals, the world around us continues to change rapidly. On the one hand, inflation including the food price one is challenging monthly budgets of average household. Yet at the other hand, spread of smartphones and tablets coupled with e-commerce and m-commerce continues at a rapid pace.
As global boundaries blur fast, the competition for acquiring the same set of customers is fast intensifying. Winning enterprises of tomorrow are going to be defined by their ability to go digital and thereby leverage data to the fullest. Winners of tomorrow’s hyper competitive world would be those who can transform themselves into agile and responsive organizations with added edge of innovation and customer centricity.
Technology, thus, will fuel business transformation and determine the way businesses engage with customers, their speed at which they deliver services. It will also impact the resilience and reliability of their operations and also their innovation capabilities.
Their ability to help create digital enterprises for the customers is fast becoming the critical differentiator for providers of technology. Having undergone the fast churn from hardware to enterprise software to SMAC and artificial intelligence, information technology has become an integral part of every industry. As they fast usher into an increasingly multi-device connected world; smart machines, cognitive computing and ‘internet of things’ are narrowing the divide between humans and machines.
Growth in IT spends bears a very direct and close reflection of the momentum of overall economic growth. Global IT spends stood at USD 3.7 trillion in 2013, near flat growth of 0.4 percent over the previous year. With global GDP growth picking momentum, IT spends are estimated to grow by 3.2 percent to reach USD 3.8 trillion in 2014.
Indian IT-BPM
Industry is estimated to have grown by 8.8 percent to reach USD 118 billion in
FY14.
• Exports are estimated to have grown by 13 percent to cross USD 86 billion in FY14. The growth was fueled by return of discretionary spending and increased demand from US and Europe. US continues to be the largest geographic market for India, accounting for about 62 percent. An encouraging demand growth of about 14 percent was recorded from Europe. Accounting for over 41 percent of overall exports, BFSI continues to be the largest vertical segment. Emerging verticals such as retail, healthcare, utilities are estimated to grow faster. IT services continues to be the fastest growing segment, generating exports of USD 52 billion.
• In domestic market, IT-BPM industry is estimated to have recorded its lowest growth of last 12 years in FY14. At an estimated Rs. 1,910 billion, the domestic market is likely to grow by 9.7 percent. IT services is estimated to have grown at 9.7 percent whereas software products growth of 9.5 percent was aided by increased demand for vertical-specific and SMAC-based solutions.
OUTLOOK
Looking forward, they are positive that investments made during the past year in MACS, new geography expansion in Australia, Singapore, Qatar, a stronger sales team, establishing large bid pursuit team, focused alliances, strategic account management, and focus on a few verticals will yield us the results and more strongly establish us as a specialized services organization focusing on deep customer relationships and transformation. Our plan during the year is to stay on course as earlier and make further investments in areas such as human capital, development of customer centers of excellence, alliances with firms which are in line with the IT strategy of their customers to ensure they grow deeper into them while building reference and replicable capabilities to help build their new customer base and prospects. As regards the Domestic products business, the strategy of creating more value to their customers and principals and looking for more opportunities to bring advanced technology products to the Indian market and also to expand overseas market, we expect the business to grow at a higher pace.
CORPORATE INFORMATION
Subject is a Company registered in India with its registered office at Mumbai and operationally headquartered at Bangalore. The Company is listed on the National Stock Exchange Limited and the Bombay Stock Exchange Limited. The Company is primarily engaged in the business of providing IT Services and Solutions to its customers in the US, Europe, Middle East and India.
FIXED ASSETS
Tangible assets
Leasehold land
Buildings
Leasehold Improvements
Plant and equipment
Furniture and fixtures
Vehicles
Office equipments
Intangible assets
Computer software
UNAUDITED FINANCIAL RESULTS FOR THE QUARTER ENDED AND NINE MONTHS
ON 31.12.2014
[RS.
IN MILLIONS]
|
PARTICULARS |
3 Months Ended |
9 Months Ended |
|
|
31.12.2014 [Unaudited] |
30.09.2014 [Unaudited] |
31.12.2014 [Unaudited] |
|
|
1. Income
from operations |
|
|
|
|
a) Net sales/ Income from operation (net of excise duty) |
1243.329 |
1145.969 |
3401.020 |
|
b) Other operating income |
2.664 |
1.047 |
5.823 |
|
Total
Income from Operations (net) |
1245.993 |
1147.016 |
3406.843 |
|
|
|
|
|
|
2.Expenditure |
|
|
|
|
Employees benefits expense |
693.047 |
625.785 |
1900.431 |
|
Depreciation |
12.337 |
10.580 |
41.176 |
|
Exchange Gain/Loss |
(20.266) |
(11.675) |
(71.053) |
|
Other expenses |
195.416 |
199.464 |
598.087 |
|
Total expenses |
880.534 |
824.154 |
2468.641 |
|
|
|
|
|
|
3. Profit from operations before other income, and
financial costs and Exceptional Items |
365.459 |
322.862 |
938.202 |
|
4. Other income |
65.153 |
45.865 |
154.155 |
|
5. Profit from ordinary activities before finance costs |
430.612 |
368.727 |
1092.357 |
|
6. Finance costs |
4.995 |
3.707 |
9.009 |
|
7. Net profit/(loss) from
ordinary activities after finance costs but before exceptional items |
425.617 |
365.020 |
1083.348 |
|
8. Exceptional item |
-- |
-- |
-- |
|
9. Profit from ordinary
activities before tax Expense: |
425.617 |
365.020 |
1083.348 |
|
10.Tax expenses |
104.234 |
80.092 |
252.810 |
|
11.Net Profit / (Loss) from ordinary
activities after tax |
321.383 |
284.928 |
830.538 |
|
12.Extraordinary
Items (net of tax expense) |
-- |
-- |
-- |
|
13.Net
Profit / (Loss) for the period |
321.383 |
284.928 |
830.538 |
|
14.Paid-up equity share capital (Nominal value Rs.1 per
share) |
105.159 |
105.159 |
105.159 |
|
15. Reserve excluding Revaluation Reserves as per
balance sheet of previous accounting year |
|
|
|
|
16.i)
Earnings per share (before extraordinary items) of Rs.1/- each) (not
annualised): |
|
|
|
|
(a) Basic and diluted |
3.06 |
2.71 |
7.90 |
|
|
|
|
|
|
A.
PARTICULARS OF SHAREHOLDING |
|
|
|
|
1.
Public Shareholding |
|
|
|
|
- Number of shares |
70919145 |
70674145 |
70919145 |
|
- Percentage of shareholding |
67.44 |
67.21 |
67.44 |
|
2. Promoters
and Promoters group Shareholding |
|
|
|
|
a) Pledged /Encumbered |
|
|
|
|
Number of shares |
1875000 |
1875000 |
1875000 |
|
Percentage of shares (as a % of total shareholding of the
promoter and promoter group) |
5.48 |
5.44 |
5.48 |
|
Percentage of shares (as a % of total share capital of the
company) |
1.78 |
1.78 |
1.78 |
|
|
|
|
|
|
b) Non Encumbered |
|
|
|
|
Number of shares |
32365161 |
32610161 |
32365161 |
|
Percentage of shares (as a % of total shareholding of the promoter
and promoter group) |
94.52 |
94.56 |
94.52 |
|
Percentage of shares (as a % of total share capital of the
company) |
30.78 |
31.01 |
30.78 |
|
|
PARTICULARS |
3
Months Ended 31.12.2014 |
|
B |
Investor
complaints (Nos.) |
|
|
|
Pending at the beginning of the quarter |
-- |
|
|
Received during the Quarter |
11 |
|
|
Disposed of during the quarter |
11 |
|
|
Remaining unresolved at the end of the quarter |
-- |
NOTE :
1. The above unaudited financial result of the Company has been reviewed by the Audit Committee and approved by the Board of Director at their meeting held on February 06, 2015.
2. In accordance with Clause 41 of the Listing Agreement the Statutory Auditors have carried out a 'Limited Review' of the Standalone financial results for the quarter and nine months ended December 31, 2014.
3. Consequent to the applicability of the Companies Act, 2013 with effect from April 01, 2014, depreciation for the quarter and nine months ended December 31, 2014 has been calculated based on the useful life as specified under Schedule II of the said Act.
On account of the above, the depreciation for the quarter and nine months ended December 31, 2014 debited to the statement of profit and loss is higher by Rs. 1.443 Million and Rs. 10.865 Million respectively.
In terms of Schedule II of the Companies Act, 2013 an amount of Rs.11.353 Million {net of tax) has been debited to the opening retained earnings as at April 01, 2014 towards the carrying amount of assets, where the remaining useful life of the asset is Nil
4. Segment results have not been disclosed in the Standalone results since the Company operates in only one Segment viz International (Software Service exports}.
6. Interim dividend of Rs. 1/- per share (100% on par value of Rs.1/-) has been declared at the Board Meeting held today. This along with the interim dividend of Rs.1.75/- per share declared on September 08, 2014 raises the total interim dividend for the year to Rs. 2.75/- per share.
7. Previous period figures have been regrouped/reclassified wherever necessary to confirm to current period's classification.
CMT REPORT (Corruption, Money Laundering & Terrorism]
The Public Notice information has been collected from various sources
including but not limited to: The Courts,
1] INFORMATION ON
DESIGNATED PARTY
No exist designating subject or any of its beneficial owners,
controlling shareholders or senior officers as terrorist or terrorist
organization or whom notice had been received that all financial transactions
involving their assets have been blocked or convicted, found guilty or against
whom a judgement or order had been entered in a proceedings for violating
money-laundering, anti-corruption or bribery or international economic or
anti-terrorism sanction laws or whose assets were seized, blocked, frozen or
ordered forfeited for violation of money laundering or international
anti-terrorism laws.
2] Court Declaration :
No records exist to suggest that subject is
or was the subject of any formal or informal allegations, prosecutions or other
official proceeding for making any prohibited payments or other improper
payments to government officials for engaging in prohibited transactions or
with designated parties.
3] Asset Declaration :
No records exist to suggest that the property or assets of the subject
are derived from criminal conduct or a prohibited transaction.
4] Record on Financial
Crime :
Charges or conviction
registered against subject: None
5] Records on Violation of
Anti-Corruption Laws :
Charges or
investigation registered against subject: None
6] Records on Int’l
Anti-Money Laundering Laws/Standards :
Charges or
investigation registered against subject: None
7] Criminal Records
No available
information exist that suggest that subject or any of its principals have been
formally charged or convicted by a competent governmental authority for any
financial crime or under any formal investigation by a competent government
authority for any violation of anti-corruption laws or international anti-money
laundering laws or standard.
8] Affiliation with
Government :
No record
exists to suggest that any director or indirect owners, controlling
shareholders, director, officer or employee of the company is a government
official or a family member or close business associate of a Government
official.
9] Compensation Package :
Our market
survey revealed that the amount of compensation sought by the subject is fair
and reasonable and comparable to compensation paid to others for similar
services.
10] Press Report :
No press reports / filings exists on
the subject.
CORPORATE GOVERNANCE
MIRA INFORM as part of its Due Diligence do provide comments on
Corporate Governance to identify management and governance. These factors often
have been predictive and in some cases have created vulnerabilities to credit
deterioration.
Our Governance Assessment focuses principally on the interactions
between a company’s management, its Board of Directors, Shareholders and other
financial stakeholders.
CONTRAVENTION
Subject is not known to have contravened any existing local laws,
regulations or policies that prohibit, restrict or otherwise affect the terms
and conditions that could be included in the agreement with the subject.
FOREIGN EXCHANGE RATES
|
Currency |
Unit
|
Indian Rupees |
|
US Dollar |
1 |
Rs.64.05 |
|
|
1 |
Rs.99.04 |
|
Euro |
1 |
Rs.71.76 |
INFORMATION DETAILS
|
Information
Gathered by : |
MNJ |
|
|
|
|
Analysis Done by
: |
SAN |
|
|
|
|
Report Prepared
by : |
SNT |
SCORE & RATING EXPLANATIONS
|
SCORE FACTORS |
RANGE |
POINTS |
|
HISTORY |
1~10 |
8 |
|
PAID-UP CAPITAL |
1~10 |
8 |
|
OPERATING SCALE |
1~10 |
7 |
|
FINANCIAL
CONDITION |
|
0 |
|
--BUSINESS SCALE |
1~10 |
7 |
|
--PROFITABILITY |
1~10 |
8 |
|
--LIQUIDITY |
1~10 |
8 |
|
--LEVERAGE |
1~10 |
5 |
|
--RESERVES |
1~10 |
7 |
|
--CREDIT LINES |
1~10 |
7 |
|
--MARGINS |
-5~5 |
---- |
|
DEMERIT POINTS |
|
|
|
--BANK CHARGES |
YES/NO |
YES |
|
--LITIGATION |
YES/NO |
NO |
|
--OTHER ADVERSE INFORMATION |
YES/NO |
NO |
|
MERIT POINTS |
|
|
|
--SOLE DISTRIBUTORSHIP |
YES/NO |
NO |
|
--EXPORT ACTIVITIES |
YES/NO |
NO |
|
--AFFILIATION |
YES/NO |
YES |
|
--LISTED |
YES/NO |
NO |
|
--OTHER MERIT FACTORS |
YES/NO |
YES |
|
DEFAULTER |
|
|
|
--RBI |
YES/NO |
NO |
|
--EPF |
YES/NO |
NO |
|
TOTAL |
|
65 |
This score serves as a reference to assess
SC’s credit risk and to set the amount of credit to be extended. It is
calculated from a composite of weighted scores obtained from each of the major
sections of this report. The assessed factors and their relative weights (as
indicated through %) are as follows:
Financial
condition (40%) Ownership
background (20%) Payment
record (10%)
Credit history
(10%) Market trend (10%) Operational size
(10%)
RATING EXPLANATIONS
|
RATING |
STATUS |
PROPOSED CREDIT LINE |
|
|
>86 |
Aaa |
Possesses an extremely sound financial base with the strongest
capability for timely payment of interest and principal sums |
Unlimited |
|
71-85 |
Aa |
Possesses adequate working capital. No caution needed for credit
transaction. It has above average (strong) capability for payment of interest
and principal sums |
Large |
|
56-70 |
A |
Financial & operational base are regarded healthy. General unfavourable
factors will not cause fatal effect. Satisfactory capability for payment of
interest and principal sums |
Fairly Large |
|
41-55 |
Ba |
Overall operation is considered normal. Capable to meet normal
commitments. |
Satisfactory |
|
26-40 |
B |
Capability to overcome financial difficulties seems comparatively
below average. |
Small |
|
11-25 |
Ca |
Adverse factors are apparent. Repayment of interest and principal sums
in default or expected to be in default upon maturity |
Limited with full
security |
|
<10 |
C |
Absolute credit risk exists. Caution needed to be exercised |
Credit not
recommended |
|
-- |
NB |
New Business |
-- |
This report is issued at your request without any
risk and responsibility on the part of MIRA INFORM PRIVATE LIMITED (MIPL) or
its officials.