MIRA INFORM REPORT
|
Report No. : |
321722 |
|
Report Date : |
13.05.2015 |
IDENTIFICATION DETAILS
|
Name : |
STOMANA-INDUSTRY JSC |
|
|
|
|
Registered Office : |
ul. Vladaysko vastanie Nr. 1 2304 Pernik |
|
|
|
|
Country : |
Bulgaria |
|
|
|
|
Financials (as on) : |
31.12.2013 |
|
|
|
|
Date of Incorporation : |
26.04.2000 |
|
|
|
|
Legal Form : |
Limited Liability Company |
|
|
|
|
Line of Business : |
Production of reinforcing steel, heavy plate,
merchant bars, special steels, special profiles and sections. |
|
|
|
|
No. of Employee : |
997 |
RATING & COMMENTS
|
MIRA’s Rating : |
Ba |
|
RATING |
STATUS |
PROPOSED CREDIT LINE |
|
|
41-55 |
Ba |
Overall operation is considered normal. Capable to meet normal
commitments. |
Satisfactory |
|
Status : |
Satisfactory |
|
|
|
|
Payment Behaviour : |
No complaints |
|
|
|
|
Litigation : |
Clear |
NOTES :
Any query related to this report can be made on
e-mail : infodept@mirainform.com
while quoting report number, name and date.
ECGC Country Risk Classification List – December 31, 2014
|
Country Name |
Previous Rating (30.09.2014) |
Current Rating (31.12.2014) |
|
Bulgaria |
A2 |
A2 |
|
Risk Category |
ECGC
Classification |
|
Insignificant |
A1 |
|
Low |
A2 |
|
Moderate |
B1 |
|
High |
B2 |
|
Very High |
C1 |
|
Restricted |
C2 |
|
Off-credit |
D |
BULGARIA ECONOMIC OVERVIEW
Bulgaria, a former Communist country that entered the EU on 1 January 2007, averaged more than 6% annual growth from 2004 to 2008, driven by significant amounts of bank lending, consumption, and foreign direct investment. Successive governments have demonstrated a commitment to economic reforms and responsible fiscal planning, but the global downturn sharply reduced domestic demand, exports, capital inflows, and industrial production. GDP contracted by 5.5% in 2009, and has been slow to recover in the years since. Despite having a favorable investment regime, including low, flat corporate income taxes, significant challenges remain. Corruption in public administration, a weak judiciary, and the presence of organized crime continue to hamper the country's investment climate and economic prospects.
|
Source
: CIA |
COMPANY DETAILS
Local name:
STOMANA-INDASTRI AD
International
name: STOMANA-INDUSTRY JSC
Registered address:
ul. Vladaysko
vastanie Nr. 1
2304 Pernik
Bulgaria
Telephone: +359-76-681023, +359-76-681111, +359-76-681013
Fax: +359-76-681951, +359-76-681950
E-Mail: markt@stomana.bg
Internet: http://www.stomana.bg
ESTABLISHMENT & REGISTRATION:
Established: 2000
Registered at Pernik district court
Court number 127/2001
Bulstat/VAT number: 113509219
Status of the company:
Active
HISTORY:
The subject is
established in April 26, 2000 as a Limited Liability company. 100% owner of the
company was EUROMETAL OOD.
In February 13, 2001 STOMANA INDUSTRY EOOD is reregistered as a Joint Stock
Company. Soon after that SIDENOR, Greece, which is a part of VIOHALCO HOLDING,
Greece, acquired 75% of the capital of STOMANA INDUSTRY AD.
On June 15, 2001 STOMANA INDUSTRY AD acquired 50% from STOMANA AD (the second
biggest steel producer in Bulgaria which was in insolvency at that time) for
16.5 million.
LEGAL FORM:
Joint Stock
Company (AD)
REGISTERED
CAPITAL:
BGN 63 318 900.00
SHAREHOLDERS/MANAGEMENT
SHAREHOLDERS:
|
SIDENOR STEEL PRODUCTS MANUFACTURING COMPANY S.A., Greece |
99.999% |
|
SIDENOR STEEL INDUSTRY S.A. Greece |
0.001% |
MANAGEMENT:
|
VASILIOS PAPANTONIU |
- Representative |
|
|
EFSTRATIOS TOMADAKIS |
- Representative |
|
|
NIKOLAOS MARIU |
- Representative |
|
|
ANTON KIRILOV PETROV |
- Member of the board |
|
|
ATANASIOS ATANASOPULOS |
- Member of the board |
|
|
EFSTRATIOS TOMADAKIS |
- Member of the board |
|
|
NIKOLAOS MARIU |
- Member of the board |
|
|
VASILIOS PAPANTONIU |
- Member of the board |
|
|
STAVROS TEODOROPULOS |
- Member of the board |
RELATED COMPANIES:
The company belongs to the Greek group
VIOHALCO.
BUSINESS ACTIVITY
BUSINESS
OPERATION:
NACE 1.1: 27.52 Casting of steel
Activity:
Production of reinforcing steel, heavy
plate, merchant bars, special steels, special profiles and sections.
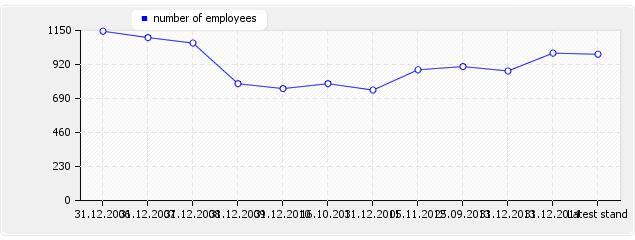
NUMBER OF
EMPLOYEES:
|
As at date |
Value |
|
31.12.2006 |
1145 |
|
31.12.2007 |
1102 |
|
31.12.2008 |
1065 |
|
31.12.2009 |
790 |
|
31.12.2010 |
757 |
|
16.10.2011 |
790 |
|
31.12.2011 |
747 |
|
05.11.2012 |
884 |
|
25.09.2013 |
906 |
|
31.12.2013 |
876 |
|
31.12.2014 |
997 |
|
Latest stand |
989 |
EXPORT:
Albania, Belgium, Bulgaria-free zone, Cuba,
Cyprus, England, Fed.Rep. of Yugoslavia, France, Germany, Greece, Italy,
Lebanon, Portugal, Rep. of Macedonia, Spain, Turkey, USA
IMPORT:
Austria, Belgium, Brazil, Bulgaria-free
zone, China, Czech Republic, Fed.Rep. of Yugoslavia, France, Germany, Greece,
Iran, Israel, Italy, Japan, Poland, Portugal, Romania, Russian Federation,
Slovak Republic, Slovenia, Spain, Taiwan, Turkey, Ukraine, USA
REAL ESTATE:
Own premises.
FINANCIAL DATA
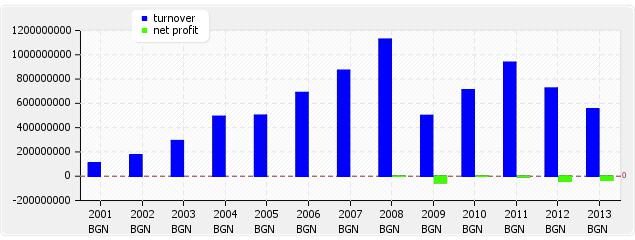
TURNOVER:
|
Year |
Currency |
Value |
|
2001 |
BGN |
111 153 000.00 |
|
2002 |
BGN |
174 937 000.00 |
|
2003 |
BGN |
293 428 000.00 |
|
2004 |
BGN |
493 823 000.00 |
|
2005 |
BGN |
502 596 217.00 |
|
2006 |
BGN |
689 922 000.00 |
|
2007 |
BGN |
872 933 000.00 |
|
2008 |
BGN |
1 128 934 000.00 |
|
2009 |
BGN |
501 015 000.00 |
|
2010 |
BGN |
712 205 000.00 |
|
2011 |
BGN |
938 791 000.00 |
|
2012 |
BGN |
726 140 000.00 |
|
2013 |
BGN |
553 883 000.00 |
MODES OF PAYMENT:
Payments are made within agreed terms.
DEBT COLLECTION:
No debt collection cases are registered
against the company.
BANK DISTRAINTS:
No shares of the company are under bank
distraint.
UNPAID TAXES/
CONTRIBUTIONS TO GOVERNMENT:
There is no publication about overdue unpaid
taxes.
INVOLVEMENT IN
LEGAL DISPUTES:
There is no publication about legal claims
or disputes against the company.
OTHER PAYMENT
INFORMATION:
No adverse payment information is available.
BRANCH INDICATOR:
The company's payment behaviour is average
for the branch.
FINANCIAL OPINION:
Loss for 2011, 2012, 2013
Exchange rate since 1998 is 1 BGN
(denominated lev) = 0.51 EUR
|
Ratio |
2010 |
2011 |
2012 |
2013 |
|
Accounting
period: |
1.1.2010 - |
1.1.2011 - |
1.1.2012 - |
1.1.2013 - |
|
Debt ratio |
0.59 |
0.60 |
0.62 |
0.65 |
|
Quick ratio |
0.47 |
0.50 |
0.33 |
0.28 |
|
Current ratio |
1.11 |
1.34 |
1.08 |
0.84 |
|
Days purchase in payables |
136.00 |
93.59 |
123.85 |
185.72 |
|
Operating margin in % |
0.35 |
0.00 |
0.00 |
0.00 |
|
Cash ratio (acid ratio) |
0.07 |
0.09 |
0.02 |
0.02 |
|
Return on sales ROS in % |
0.39 |
0.00 |
0.00 |
0.00 |
|
Return on assets ROA in % |
0.38 |
0.00 |
0.00 |
0.00 |
|
Return on equity ROE in % |
0.93 |
0.00 |
0.00 |
0.00 |
|
Days supply in inventory |
86.80 |
78.03 |
91.92 |
103.48 |
|
Days sales in receivables |
53.55 |
39.05 |
38.28 |
48.80 |
|
BALANCE SHEET in BGN'000 |
2010 |
2011 |
2012 |
2013 |
|
Accounting
period: |
1.1.2010 - |
1.1.2011 - |
1.1.2012 - |
1.1.2013 - |
|
A.UNPAID CAPITAL |
|
|
|
|
|
B. FIXED ASSETS |
|
|
|
|
|
I Fixed Intangible Assets: |
|
|
|
|
|
R&D Products |
|
|
|
|
|
Concessions, patents, trade-marks etc |
|
|
24 |
46 |
|
Goodwill |
|
|
|
|
|
Intangible fixed assets under construction |
|
|
|
|
|
thereof advances |
|
|
|
|
|
Total I: |
37 |
9 |
24 |
46 |
|
II Fixed Tangible Assets |
|
|
|
|
|
Land and Buildings |
|
|
122309 |
119187 |
|
thereof Land |
|
|
46810 |
46810 |
|
thereof Buildings |
|
|
75499 |
72377 |
|
Machines, Vehicles |
|
|
248042 |
253382 |
|
Equipment |
|
|
1540 |
1286 |
|
Tangible fixed assets under construction |
|
|
17577 |
8288 |
|
thereof advances |
|
|
|
|
|
Total II |
426487 |
409669 |
389469 |
382143 |
|
III. Fixed Financial Assets |
|
|
|
|
|
Shares in group companies |
|
|
|
|
|
Loans granted to group companies |
|
|
|
|
|
Shares in joint ventures |
|
|
|
|
|
Long term investments |
|
|
5365 |
5365 |
|
Other loans |
|
|
|
|
|
Bought back own shares |
|
|
|
|
|
Total III |
5365 |
5365 |
5365 |
5365 |
|
IV. Deferred Taxes |
0 |
|
|
0 |
|
B. FIXED ASSETS TOTAL |
431889 |
415043 |
394858 |
387554 |
|
C. CURRENT ASSETS |
|
|
|
|
|
I. Inventories |
|
|
|
|
|
Raw Materials |
|
|
69898 |
55020 |
|
Work in progress |
|
|
|
|
|
thereof young animals |
|
|
|
|
|
Trading goods |
|
|
115520 |
104184 |
|
thereof production |
|
|
107918 |
98920 |
|
thereof goods for sale |
|
|
7602 |
5264 |
|
Advances |
|
|
299 |
206 |
|
Total I |
171719 |
203477 |
185417 |
159204 |
|
II. Receivables |
|
|
|
|
|
Receivables from customers |
|
|
39949 |
43040 |
|
thereof more than 1 year |
|
|
|
|
|
Receivables from group companies |
|
|
33086 |
29388 |
|
thereof more than 1 year |
|
|
|
|
|
Receivables from joint ventures |
|
|
|
|
|
thereof more than 1 year |
|
|
|
|
|
Other receivables |
|
|
3879 |
2455 |
|
thereof more than 1 year |
|
|
|
|
|
Total II |
105949 |
101821 |
77213 |
75089 |
|
III. Current Financial Assets |
|
|
|
|
|
Current investments in related companies |
|
|
|
|
|
Bought back own shares |
|
|
|
|
|
Other current financial assets |
|
|
|
|
|
Total III |
0 |
|
|
0 |
|
IV. Cash equivalents |
|
|
|
|
|
Cash and accounts in the country |
|
|
6078 |
6101 |
|
thereof cash |
|
|
|
1 |
|
Thereof cash in foreign currency (equivalent) |
|
|
3 |
2 |
|
thereof current accounts |
|
|
6075 |
6098 |
|
thereof blocked accounts |
|
|
|
|
|
thereof cash equivalents |
|
|
|
|
|
Cash and accounts abroad |
|
|
|
|
|
thereof cash |
|
|
|
|
|
Thereof cash in foreign currency (equivalent) |
|
|
|
|
|
thereof current accounts |
|
|
|
|
|
thereof blocked accounts |
|
|
|
|
|
Total IV |
20144 |
20841 |
6078 |
6101 |
|
C. CURRENT ASSETS TOTAL |
297812 |
326139 |
268708 |
240394 |
|
D. Deferred expenses |
0 |
|
|
|
|
TOTAL ASSETS |
729701 |
741182 |
663566 |
627948 |
|
A. OWNERS EQUITY |
|
|
|
|
|
I. Share capital |
63319 |
63319 |
63319 |
63319 |
|
II. Issue premium |
|
|
|
|
|
III. Revaluation reserves |
|
|
|
|
|
thereof revaluation reserves of financial instruments |
|
|
|
|
|
IV. Reserves |
|
|
|
|
|
legal reserves |
|
|
|
|
|
reserve related to bought back own shares |
|
|
|
|
|
reserve from company foundation |
|
|
|
|
|
other reserves |
|
|
6332 |
6332 |
|
Total IV |
6332 |
6332 |
6332 |
6332 |
|
V. Result from previous period |
|
|
|
|
|
Undistributed profit |
|
|
223406 |
182400 |
|
Uncovered loss |
|
|
|
|
|
Total V |
228185 |
228185 |
182400 |
148810 |
|
VI. Current result profit (loss) |
0 |
-4779 |
-41092 |
-33590 |
|
A. OWNERS EQUITY TOTAL |
297836 |
293057 |
252051 |
218461 |
|
B. PROVISIONS |
|
|
|
|
|
Provisions for pensions |
|
|
1746 |
1774 |
|
Provisions for taxes |
|
|
15637 |
13701 |
|
thereof deferred taxes |
|
|
15637 |
13701 |
|
Other provisions |
|
|
1659 |
1514 |
|
B. PROVISIONS TOTAL |
|
|
19042 |
16989 |
|
C. LIABILITIES |
|
|
|
|
|
Bond-backed loans |
|
|
|
|
|
less than 1 year |
|
|
|
|
|
more than 1 year |
|
|
|
|
|
Bank loans |
|
|
317873 |
317894 |
|
less than 1 year |
|
|
175127 |
211132 |
|
more than 1 year |
|
|
142746 |
106762 |
|
Advances received |
|
|
1183 |
1187 |
|
less than 1 year |
|
|
1183 |
1187 |
|
more than 1 year |
|
|
|
|
|
Payables to suppliers |
|
|
74685 |
74605 |
|
less than 1 year |
|
|
74685 |
74605 |
|
more than 1 year |
|
|
|
|
|
Liabilities on policies |
|
|
|
|
|
less than 1 year |
|
|
|
|
|
more than 1 year |
|
|
|
|
|
Liabilities to group companies |
|
|
23629 |
45016 |
|
less than 1 year |
|
|
23629 |
45016 |
|
more than 1 year |
|
|
|
|
|
Liabilities to joint-venture companies |
|
|
|
|
|
less than 1 year |
|
|
|
|
|
more than 1 year |
|
|
|
|
|
Other liabilities |
|
|
18957 |
16988 |
|
less than 1 year |
|
|
4518 |
4851 |
|
more than 1 year |
|
|
18957 |
16988 |
|
thereof to personnel |
|
|
521 |
485 |
|
less than 1 year |
|
|
521 |
485 |
|
more than 1 year |
|
|
|
|
|
thereof to social insurance |
|
|
238 |
310 |
|
less than 1 year |
|
|
238 |
310 |
|
more than 1 year |
|
|
|
|
|
thereof for taxes |
|
|
115 |
366 |
|
less than 1 year |
|
|
115 |
366 |
|
more than 1 year |
|
|
|
|
|
C. LIABILITIES TOTAL |
431865 |
448125 |
411515 |
409487 |
|
less than 1 year |
269057 |
244070 |
249812 |
285737 |
|
more than 1 year |
162808 |
204055 |
161703 |
123750 |
|
D. FINANCING AND DEFERRED INCOME |
|
|
|
|
|
thereof |
|
|
|
|
|
Financing |
|
|
|
|
|
Deferred income |
|
|
|
|
|
TOTAL EQUITY AND LIABILITIES |
729701 |
741182 |
663566 |
627948 |
|
P&L ACCOUNT in BGN'000 |
2010 |
2011 |
2012 |
2013 |
|
Accounting
period: |
1.1.2010 - |
1.1.2011 - |
1.1.2012 - |
1.1.2013 - |
|
A. EXPENSES |
|
|
|
|
|
I. OPERATION EXPENSES |
|
|
|
|
|
Decrease of inventories |
|
|
19367 |
8997 |
|
thereof for materials |
|
|
534566 |
400060 |
|
thereof for services |
|
|
74479 |
60307 |
|
Personnel expenses |
|
|
12406 |
12687 |
|
thereof wages |
|
|
9743 |
9882 |
|
thereof social insurance |
|
|
2663 |
2805 |
|
thereof pensions |
|
|
1715 |
1771 |
|
Depreciation |
|
|
39804 |
23127 |
|
thereof Depreciation of fixed assets |
|
|
39804 |
23127 |
|
Other expenses |
|
|
70735 |
70541 |
|
thereof Book value of sold assets (without production) |
|
|
65770 |
64207 |
|
I. OPERATION EXPENSES TOTAL |
700050 |
925591 |
749617 |
568850 |
|
II. Financial expenditures |
|
|
|
|
|
Depreciation of financial assets |
|
|
|
|
|
thereof exchange rate losses |
|
|
|
|
|
Paid interest |
|
|
22552 |
19257 |
|
thereof interest to group companies |
|
|
|
|
|
Thereof expenditures for securities operations |
|
|
|
|
|
II. Financial expenditures Total |
9691 |
21301 |
21321 |
18602 |
|
B. Profit on ordinary activity |
2464 |
|
|
|
|
III. Extraordinary expenses |
0 |
|
|
|
|
thereof expenses on disasters and emergency expenses |
|
|
|
|
|
C. Total expenses (I+II+III) |
709741 |
946892 |
770938 |
587452 |
|
D. Accounting profit |
2464 |
|
|
|
|
IV. Taxation on profit |
-301 |
-3322 |
-3706 |
-1938 |
|
V. Other taxes |
|
|
|
|
|
E. Net profit |
2765 |
|
|
|
|
Total expenses |
712205 |
943570 |
767232 |
587452 |
|
A. REVENUES |
|
|
|
|
|
I . OPERATING REVENUES |
|
|
|
|
|
Net sales |
712205 |
938791 |
726140 |
553883 |
|
Production |
|
|
648118 |
479051 |
|
Goods |
|
|
51088 |
50603 |
|
Services |
|
|
10783 |
11594 |
|
Increase of production and work in progress |
|
|
|
|
|
Expenses on acquisition of assets |
|
|
78 |
72 |
|
Other revenues |
|
|
17948 |
17673 |
|
thereof financing |
|
|
|
|
|
I. TOTAL OPERATING REVENUES |
712205 |
938791 |
726140 |
553883 |
|
II FINANCIAL REVENUES |
|
|
|
|
|
Income from shares |
|
|
|
|
|
thereof income from shares in group companies |
|
|
|
|
|
Income from investments and loans |
|
|
|
|
|
thereof from investments in group companies |
|
|
|
|
|
Income from interest |
|
|
1097 |
527 |
|
thereof from interest from group companies |
|
|
|
|
|
II FINANCIAL REVENUES TOTAL |
0 |
|
1097 |
51 |
|
TOTAL REVENUES FROM ORDINARY ACTIVITIES |
712205 |
938791 |
726140 |
553934 |
|
LOSS |
|
8101 |
44798 |
35456 |
|
Extraordinary revenues |
0 |
|
|
|
|
AFTER TAX LOSS |
0 |
4779 |
41092 |
33518 |
|
TOTAL REVENUES |
712205 |
943570 |
767232 |
587452 |
FOREIGN EXCHANGE RATES
|
Currency |
Unit
|
Indian Rupees |
|
US Dollar |
1 |
Rs.64.20 |
|
|
1 |
Rs.100.03 |
|
Euro |
1 |
Rs.71.91 |
INFORMATION DETAILS
|
Analysis Done by
: |
SUB |
|
|
|
|
Report Prepared
by : |
ANK |
RATING EXPLANATIONS
|
RATING |
STATUS |
PROPOSED CREDIT LINE |
|
|
>86 |
Aaa |
Possesses an extremely sound financial base with the strongest
capability for timely payment of interest and principal sums |
Unlimited |
|
71-85 |
Aa |
Possesses adequate working capital. No caution needed for credit transaction.
It has above average (strong) capability for payment of interest and
principal sums |
Large |
|
56-70 |
A |
Financial & operational base are regarded healthy. General
unfavourable factors will not cause fatal effect. Satisfactory capability for
payment of interest and principal sums |
Fairly Large |
|
41-55 |
Ba |
Overall operation is considered normal. Capable to meet normal
commitments. |
Satisfactory |
|
26-40 |
B |
Capability to overcome financial difficulties seems comparatively below
average. |
Small |
|
11-25 |
Ca |
Adverse factors are apparent. Repayment of interest and principal sums
in default or expected to be in default upon maturity |
Limited with
full security |
|
<10 |
C |
Absolute credit risk exists. Caution needed to be exercised |
Credit not
recommended |
|
-- |
NB |
New Business |
-- |
This score serves as a reference to assess SC’s
credit risk and to set the amount of credit to be extended. It is calculated
from a composite of weighted scores obtained from each of the major sections of
this report. The assessed factors and their relative weights (as indicated
through %) are as follows:
Financial
condition (40%) Ownership
background (20%) Payment
record (10%)
Credit history
(10%) Market trend (10%) Operational size
(10%)
This report is issued at your request without any
risk and responsibility on the part of MIRA INFORM PRIVATE LIMITED (MIPL)
or its officials.