MIRA INFORM REPORT
|
Report No. : |
322341 |
|
Report Date : |
16.05.2015 |
IDENTIFICATION DETAILS
|
Name : |
IRPC POLYOL COMPANY LIMITED |
|
|
|
|
Formerly Known As : |
TPI POLYOL COMPANY
LIMITED |
|
|
|
|
Registered Office : |
7th Floor, Energy Complex Tower B, 555/2 Vibhavadi Rangsit Road, Chatuchak, Bangkok 10900 |
|
|
|
|
Country : |
Thailand |
|
|
|
|
Financials (as on) : |
31.12.2014 |
|
|
|
|
Date of Incorporation : |
24.09.1987 |
|
|
|
|
Com. Reg. No.: |
0105530048659 |
|
|
|
|
Legal Form : |
Private Limited Company |
|
|
|
|
Line of Business : |
Manufacturer Distributor and
Exporter Polyester and
Polyester Polyol Products |
|
|
|
|
No. of Employees : |
200 |
RATING & COMMENTS
|
MIRA’s Rating : |
B |
|
RATING |
STATUS |
PROPOSED CREDIT LINE |
|
|
26-40 |
B |
Capability to overcome financial difficulties seems comparatively
below average. |
Small |
|
Status : |
Moderate |
|
Payment Behaviour : |
Slow |
|
Litigation : |
- |
NOTES:
Any query related to this report can be made
on e-mail: infodept@mirainform.com
while quoting report number, name and date.
ECGC Country Risk Classification List – December 31, 2014
|
Country Name |
Previous Rating (30.09.2014) |
Current Rating (31.12.2014) |
|
Thailand |
B1 |
B1 |
|
Risk Category |
ECGC
Classification |
|
Insignificant |
A1 |
|
Low |
A2 |
|
Moderate |
B1 |
|
High |
B2 |
|
Very High |
C1 |
|
Restricted |
C2 |
|
Off-credit |
D |
THAILAND - ECONOMIC OVERVIEW
With a well-developed infrastructure, a free-enterprise
economy, generally pro-investment policies, and strong export industries,
Thailand has had a strong economy due in part to industrial and agriculture exports
- mostly electronics, agricultural commodities, automobiles and parts, and
processed foods. Thailand attracts nearly 2.5 million migrant workers from
neighboring countries. The Thai government in 2013 implemented a nation-wide
300 baht ($10) per day minimum wage policy and deployed new tax reforms
designed to lower rates on middle-income earners. The Thai economy has
weathered both internal and external economic shocks in recent years. The
global economic recession severely cut Thailand's exports, with most sectors
experiencing double-digit drops. In late 2011 Thailand's recovery was
interrupted by historic flooding in the industrial areas in Bangkok and its
five surrounding provinces, crippling the manufacturing sector. Government
approved flood mitigation projects, worth $11.7 billion, were started in 2012
to prevent a repeat. Thai growth slowed in 2013 and has remained low since, as
the country faced political uncertainty and a coup in May 2014. The interim
government is implementing a special $11 billion short-term stimulus package
and has approved a budget of more than $80 billion to aid an economic rebound.
|
Source
: CIA |
Company
name
IRPC POLYOL COMPANY LIMITED
[FORMER : TPI
POLYOL COMPANY LIMITED]
SUMMARY
BUSINESS ADDRESS : 7th
FLOOR, ENERGY COMPLEX
TOWER B,
555/2 VIBHAVADI
RANGSIT ROAD,
CHATUCHAK, BANGKOK
10900, THAILAND
TELEPHONE : [66] 2649-7000,
2646-6700
FAX : [66] 2649-7001,
2646-6702
E-MAIL ADDRESS : polyol@irpc.co.th
REGISTRATION ADDRESS : SAME AS BUSINESS
ADDRESS
ESTABLISHED : 1987
REGISTRATION NO. : 0105530048659 [Former : 4860/2530]
TAX ID NO. : 3101491159
CAPITAL REGISTERED : BHT.
300,000,000
CAPITAL PAID-UP : BHT.
300,000,000
SHAREHOLDER’S PROPORTION : THAI 100%
FISCAL YEAR CLOSING DATE : DECEMBER 31
LEGAL STATUS : PRIVATE LIMITED
COMPANY
EXECUTIVE : MR.
BOONDEJ PHURIYAKORN, THAI
GENERAL MANAGER
NO. OF STAFF : 200
LINES OF BUSINESS : POLYESTER &
POLYESTER POLYOL PRODUCTS
MANUFACTURER DISTRIBUTOR
& EXPORTER
CORPORATE
PROFILE
OPERATING TREND : STABLE
PRESENT SITUATION : OPERATING NORMALLY
REPUTATION : GOOD
WITH NORMAL BUSINESS
ENGAGEMENT
MANAGEMENT STANDARD : MANAGEMENT
WITH FAIR PERFORMANCE
HISTORY
The subject was
established on September
24, 1987 as a
private limited company under the registered name “ABS Plastic Co., Ltd.” by
Thai groups, a
wholly owned polyurethane
business of Thai Petrochemcial
Industry Public Company
Limited. On May
11, 1992, the subject’s
name was changed to “TPI
Polyol Company Limited”. On
February 28, 2007,
its name was
finally changed to
IRPC POLYOL COMPANY
LIMITED. Its business
objective is to
manufacture, distribute and
export polyester and
polyester polyol products,
the based raw
material for polyurethane foam production.
It currently employs
approximately 200 staff.
Subject is a
wholly owned subsidiary
of IRPC Public
Company Limited
[Former: Thai Petrochemical
Industry Public Company
Limited].
It also achieved
the international standard
ISO 9001 and ISO 9002
certifications for
products quality system.
The subject’s registered
address was initially
located at 26/56
Chan Tadmai Rd.,
Thungmahamek, Sathorn, Bangkok
10120.
On December 1,
2006, it was
relocated to 30th Flr.,
Lao Peng Nguan
1 Bldg.,
333 Vibhavadi Rangsit
Rd., Chompol, Chatuchak,
Bangkok 10900.
On March 31,
2010, it was
moved to 7th Flr., Energy
Complex Tower B,
555/2 Vibhavadi Rangsit
Rd., Chatuchak, Bangkok
10900, and is
also the
subject’s current operation
address.
THE
BOARD OF DIRECTOR
|
Name |
|
Nationality |
Age |
|
|
|
|
|
|
Mr. Boondej Phuriyakorn |
|
Thai |
59 |
|
Mr. Sommai Kowkachaporn |
|
Thai |
69 |
|
Mr. Vichit Nitayanond |
|
Thai |
56 |
|
Ms. Duangkamol Setthanang |
|
Thai |
55 |
|
Mr. Pravet Asavadakorn |
|
Thai |
55 |
AUTHORIZED
PERSON
Any two of
the above directors
can jointly sign
on behalf of
the subject with
company’s affixed.
MANAGEMENT
Mr. Boondej Phuriyakorn
is the General
Manager.
He is Thai
nationality with the
age of 59
years old.
Mr. Boonsong Sophitvutthiwong is
the Plant Manager.
He is Thai
nationality.
BUSINESS
OPERATIONS
The subject is
engaged in manufacturing, distributing
and exporting polyester
and polyester polyol
products, the based
raw materials for
the production of
Polyurethane foam which
is used to
adapt into thermal
insulating foam, bedding
and furniture components,
footwear and flexible
packaging production.
Its products include
polyester, polyester polyols,
unsaturated polyester, pre-polymer,
polyurethane systems and
case products coatings,
adhesives, sealants and
elastomer.
The subject is
also engaged in
co-producing of Unsaturated Polyester
Resin.
PRODUCTION
CAPACITY
25,000 metric tons per
annum
MAJOR
BRANDS
“RAYPOL”, “RAYCORE”, “RAYELAST”
IMPORT
[COUNTRIES]
80% of raw
materials such as
propylene oxide and
related feed stock
chemicals are imported
from Singapore, Korea, United States of America, Japan, India, Republic of China,
Taiwan, Malaysia, Poland
and Germany.
MAJOR
SUPPLIERS
|
PCC Rokita SA. |
: Poland |
|
IRPC Public Company
Limited |
: Thailand |
LOCAL
SALES
80% of its
products is sold
locally to manufacturers, wholesalers
and end-users.
EXPORT
[COUNTRIES]
20% of the
products is exported
to Malaysia, Taiwan,
Indonesia, Australia, Singapore, Vietnam,
Republic of China,
India, Argentina, Hong Kong,
Philippines, United Arab
Emirates and other
Middle East countries.
MAJOR
CUSTOMERS
|
Vianova Resins Ltd. |
: Thailand |
|
Pan Asia Footwear Public Co., Ltd. |
: Thailand |
|
Editorial Mediterraneo Argentina
S.r.L. |
: Argentina |
PARENT
COMPANY
IRPC Public Company
Limited
[Former : Thai Petrochemical Industry
Public Company Limited]
Business Type: Manufacturer
of Petrochemicals
LITIGATION
On December 15,
2000, the Central
Bankruptcy Court has
ordered the company
in accordance with
a decided court
case no. 534/2543
to rehabilitate its
organization and has
initially appointed Effective
Planers Co., Ltd. as the
plan administer.
On May 13,
2003, the Central
Bankruptcy Court has
ordered Effective Planers Co.,
Ltd., to retire
from the plan
administration then it has appointed
The Ministry of
Finance as the
new plan administer
on July 28, 2003.
The Company’s previous
management has filed
litigation to the
Central Bankruptcy Court to
dismiss the Resolutions
of the Extraordinary
General Meeting of
Shareholders for the year
2006 and 2009 of
IRPC Polyol Company Limited and
claimed for the damage amount at Bht. 80 million from the Company's board of
directors.
In July 2011, the Central Bankruptcy Court has decided to dismiss the
Resolutions of the Extraordinary General Meeting of Shareholders of both years.
In October 2011, the Company has filed the petition to the Supreme
Court, and begged for the ease of the execution in November 2011.
Later the Office of the Business Development Department has issued the
letter dated February 7, 2012 informing about the petition result to the
Company's board of directors.
The result is to dismiss the Company's petition and an order to revoke
the registration of the change of the directors and Company's power, by merging the list of the
Company’s previous management with the directors representing the Company’s major shareholders. But most power
shall be vested in the Company’s previous management effectively on February 7,
2012 onwards.
CREDIT
Sales are by
cash or on
the credits term
of 30-60 days.
Local bills are
paid by cash
or on the
credits term of
30-60 days.
Imports are by
L/C at or
T/T.
Exports are against
T/T.
BUSINESS
TRANSACTION
Most of the
products are sold
by credit, with the maximum credit given at 60 days. The
subject is not
found to have
problem on its
account receivable.
BANKING
Bangkok Bank Public
Co., Ltd.
[Head Office : 333
Silom Rd., Silom,
Bangrak, Bangkok 10500]
The Siam Commercial
Bank Public Co.,
Ltd.
EMPLOYMENT
The subject employs
approximately 200 office
staff and factory
workers.
LOCATION
DETAILS
The premise is
rented for administrative office on
the 7th floor
in a multi-storey
building at the
heading address. It
is located in
commercial/residential area.
Factory is located
at 299 Moo 5, Sukhumvit Rd.,
T. Choengnone, A. Muang,
Rayong 21000 Tel:
[66] 38 942-488-9,
Fax: [66] 38
613-988.
COMMENT
The company is the
manufacturer a wide
range of polyol
products used as raw
materials in the
production of thermal insulation,
bedding and furniture, footwear and
flexible packaging. It
recognized as the
largest manufacturer of
polyurethane based raw
material in Thailand.
Its business has
grown successfully over
the past several
years, generating a
revenue of more than one
billion baht. It
continued to enjoy
a strong domestic market position
until 2013. In
2014, the subject’s
operating performance was
slowdown with a
slightly decrease in
sales revenue, and net
loss at the
end of year
mainly due to
sluggish economy and
slowdown of related
industries.
Nevertheless, the subject’s business
is still promising
in line with
an improvement and
recovery of related
industries both local
and overseas.
FINANCIAL
INFORMATION
The capital was
registered at Bht.
100,000 divided into
1,000 shares of Bht.
100 each.
The capital was
increased later as
followings:
Bht. 72,600,000
on November 17, 1987
Bht. 150,000,000
on February 15,
1990
Bht. 177,000,000
on August 10,
1995
Bht. 300,000,000
on February 10,
1997
The latest registered
capital was increased
to Bht. 300,000,000 divided into
3,000,000 shares of
Bht. 100 each with
fully paid.
MAIN
SHAREHOLDERS
[as at March
24, 2015]
|
NAME |
HOLDING |
% |
|
|
|
|
|
IRPC Public Company
Limited Nationality: Thai Address : 299 Moo 5, Sukhumvit
Rd.,
Choengnone, Muang, Rayong |
2,999,983 |
100.00 |
|
Other shareholders |
17 |
- |
Total Shareholders : 16
Share Structure [as
at March 24,
2015]
|
Nationality |
Shareholders |
No. of Share |
% Shares |
|
|
|
|
|
|
Thai |
16 |
3,000,000 |
100.00 |
|
Foreign |
- |
- |
- |
|
Total |
16 |
3,000,000 |
100.00 |
NAME OF AUDITOR & CERTIFIED PUBLIC
ACCOUNTANT NO.
Mr. Vichien Kingmontree No.
3977
BALANCE
SHEET [BAHT]
The latest financial
figures published for
December 31, 2014,
2013 & 2012 were:
ASSETS
|
Current Assets |
2014 |
2013 |
2012 |
|
|
|
|
|
|
Cash and Cash Equivalents |
24,491,556 |
104,455,797 |
61,525,784 |
|
Trade Account & Other
Receivable |
128,279,661 |
192,934,118 |
137,770,469 |
|
Inventories |
336,984,070 |
192,765,749 |
240,493,982 |
|
Other Current Assets
|
28,812,443 |
4,926,316 |
6,172,995 |
|
Total Current Assets
|
518,567,730 |
495,081,980 |
445,963,230 |
|
|
|
|
|
|
Long-term Lending to Related Company |
484,237 |
484,237 |
484,237 |
|
Fixed Assets |
202,038,813 |
205,759,684 |
199,001,290 |
|
Deferred Income Tax |
9,869,601 |
6,625,896 |
- |
|
Other Non-current Assets |
221,853 |
221,853 |
194,493 |
|
Total Assets |
731,182,234 |
708,173,650 |
645,643,250 |
LIABILITIES & SHAREHOLDERS'
EQUITY [BAHT]
|
Current Liabilities |
2014 |
2013 |
2012 |
|
|
|
|
|
|
Short-term Loan from
Financial Institution |
30,460,451 |
115,092,472 |
30,777,500 |
|
Trade Account &
Other Payable |
151,282,349 |
31,899,444 |
36,979,694 |
|
Accrued Bonus |
13,005,742 |
16,399,776 |
13,665,463 |
|
Other Current Liabilities |
3,987,612 |
2,236,091 |
7,840,063 |
|
Total Current Liabilities |
198,736,154 |
165,627,783 |
89,262,720 |
|
|
|
|
|
|
Obligation for Employee
Benefits |
25,034,925 |
27,691,851 |
23,739,235 |
|
Other Liabilities |
- |
77,452 |
77,452 |
|
Total Liabilities |
223,771,079 |
193,397,086 |
113,079,407 |
|
|
|
|
|
|
Shareholders' Equity |
|
|
|
|
|
|
|
|
|
Share capital : Baht 100
par value authorized, issued
and fully paid share
capital 3,000,000 shares |
300,000,000 |
300,000,000 |
300,000,000 |
|
|
|
|
|
|
Capital Paid |
300,000,000 |
300,000,000 |
300,000,000 |
|
Retained Earning |
|
|
|
|
Appropriated for
statutory reserve |
30,000,000 |
30,000,000 |
30,000,000 |
|
Unappropriated |
177,411,155 |
184,776,564 |
202,563,843 |
|
Total Shareholders' Equity |
507,411,155 |
514,776,564 |
532,563,843 |
|
Total Liabilities &
Shareholders' Equity |
731,182,234 |
708,173,650 |
645,643,250 |
PROFIT
& LOSS ACCOUNT
|
Revenue |
2014 |
2013 |
2012 |
|
|
|
|
|
|
Sales |
843,138,524 |
871,576,377 |
901,752,021 |
|
Other Income |
4,985,654 |
5,732,290 |
7,943,564 |
|
Gain on Exchange Rate |
6,881,375 |
- |
12,227,412 |
|
Total Revenues |
855,005,553 |
877,308,667 |
921,922,997 |
|
Expenses |
|
|
|
|
|
|
|
|
|
Cost of Goods
Sold |
830,654,122 |
815,835,331 |
824,469,090 |
|
Selling Expenses |
18,644,714 |
21,174,301 |
22,770,666 |
|
Administrative Expenses |
9,536,720 |
30,207,151 |
39,299,672 |
|
Loss on Exchange Rate |
- |
1,360,567 |
- |
|
Total Expenses |
858,835,556 |
868,577,350 |
886,539,428 |
|
Profit/ [Loss] before
Financial Cost & Income Tax |
[3,830,003] |
8,731,317 |
35,383,569 |
|
Financial Cost |
[779,111] |
[498,504] |
[760,375] |
|
Profit / [Loss] before Income
Tax |
[4,609,114] |
8,232,813 |
34,623,194 |
|
Income Tax [benefit] |
3,243,705 |
[1,940,740] |
[7,221,396] |
|
Net Profit |
[1,365,409] |
6,292,073 |
27,401,798 |
FINANCIAL
ANALYSIS
|
ITEM |
UNIT |
2014 |
2013 |
2012 |
|
|
|
|
|
|
|
LIQUIDITY RATIO |
|
|
|
|
|
CURRENT RATIO |
TIMES |
2.61 |
2.99 |
5.00 |
|
QUICK RATIO |
TIMES |
0.77 |
1.80 |
2.23 |
|
|
|
|
|
|
|
ACTIVITY RATIO |
|
|
|
|
|
FIXED ASSETS TURNOVER |
TIMES |
4.17 |
4.24 |
4.53 |
|
TOTAL ASSETS TURNOVER |
TIMES |
1.15 |
1.23 |
1.40 |
|
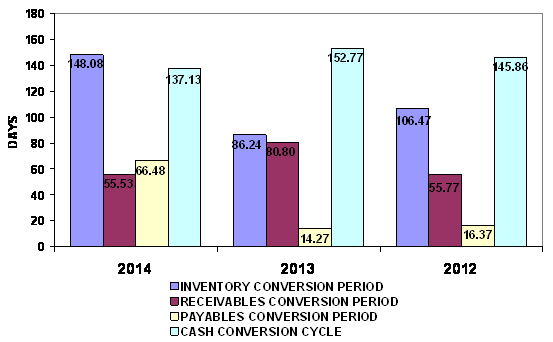
INVENTORY CONVERSION PERIOD |
DAYS |
148.08 |
86.24 |
106.47 |
|
INVENTORY TURNOVER |
TIMES |
2.46 |
4.23 |
3.43 |
|
RECEIVABLES CONVERSION PERIOD |
DAYS |
55.53 |
80.80 |
55.77 |
|
RECEIVABLES TURNOVER |
TIMES |
6.57 |
4.52 |
6.55 |
|
PAYABLES CONVERSION PERIOD |
DAYS |
66.48 |
14.27 |
16.37 |
|
CASH CONVERSION CYCLE |
DAYS |
137.13 |
152.77 |
145.86 |
|
|
|
|
|
|
|
PROFITABILITY RATIO |
|
|
|
|
|
COST OF GOODS SOLD |
% |
98.52 |
93.60 |
91.43 |
|
SELLING & ADMINISTRATION |
% |
3.34 |
5.90 |
6.88 |
|
INTEREST |
% |
0.09 |
0.06 |
0.08 |
|
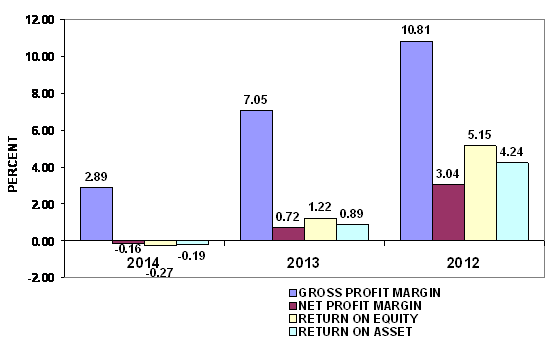
GROSS PROFIT MARGIN |
% |
2.89 |
7.05 |
10.81 |
|
NET PROFIT MARGIN BEFORE EX. ITEM |
% |
(0.45) |
1.00 |
3.92 |
|
NET PROFIT MARGIN |
% |
(0.16) |
0.72 |
3.04 |
|
RETURN ON EQUITY |
% |
(0.27) |
1.22 |
5.15 |
|
RETURN ON ASSET |
% |
(0.19) |
0.89 |
4.24 |
|
EARNING PER SHARE |
BAHT |
(0.46) |
2.10 |
9.13 |
|
|
|
|
|
|
|
LEVERAGE RATIO |
|
|
|
|
|
DEBT RATIO |
TIMES |
0.31 |
0.27 |
0.18 |
|
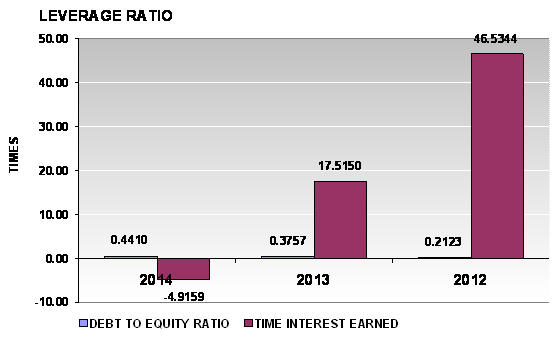
DEBT TO EQUITY RATIO |
TIMES |
0.44 |
0.38 |
0.21 |
|
TIME INTEREST EARNED |
TIMES |
(4.92) |
17.52 |
46.53 |
|
|
|
|
|
|
|
ANNUAL GROWTH |
|
|
|
|
|
SALES GROWTH |
% |
(3.26) |
(3.35) |
|
|
OPERATING PROFIT |
% |
(143.87) |
(75.32) |
|
|
NET PROFIT |
% |
(121.70) |
(77.04) |
|
|
FIXED ASSETS |
% |
(1.81) |
3.40 |
|
|
TOTAL ASSETS |
% |
3.25 |
9.68 |
|
ANNUAL GROWTH :
RISKY
An annual sales growth is -3.26%. Turnover has decreased from THB
PROFITABILITY :
RISKY
PROFITABILITY
RATIO
|
Gross Profit Margin |
2.89 |
Deteriorated |
Industrial Average |
30.90 |
|
Net Profit Margin |
(0.16) |
Deteriorated |
Industrial Average |
1.80 |
|
Return on Assets |
(0.19) |
Deteriorated |
Industrial Average |
2.88 |
|
Return on Equity |
(0.27) |
Deteriorated |
Industrial Average |
5.64 |
Gross Profit Margin used to assess a firm's financial health by revealing
the proportion of money left over from revenues after accounting for the cost
of goods sold. Gross profit margin serves as the source for paying additional
expenses and future savings. The company's figure is 2.89%. When compared with
the industry average, the ratio of the company was lower. This indicated that
company may have problems with control over its costs.
Net Profit Margin is the indicator of the company's efficiency in that net
profit takes into consideration all expenses of the company. A low profit
margin indicates a low margin of safety, higher risk that a decline in sales
will erase profits and result in a net loss. The company's figure is -0.16%.
When compared with the industry average, the ratio of the company was lower.
Return on Assets measures how efficiently profits are being generated
from the assets employed in the business when compared with the ratios of firms
in a similar business. A low ratio in comparison with industry averages
indicates an inefficient use of business assets. When compared with the
industry average, it was lower, the company's figure is -0.19%.
Return on Equity indicates how profitable a company is by comparing its
net income to its average shareholders' equity, ROE measures how much the
shareholders earned for their investment in the company. When compared with the
industry average, it was lower, the company's figure is -0.27%.
Trend of the average competitors in the same industry for last 5 years
Return on Assets Downtrend
Return on Equity Uptrend
LIQUIDITY :
ACCEPTABLE
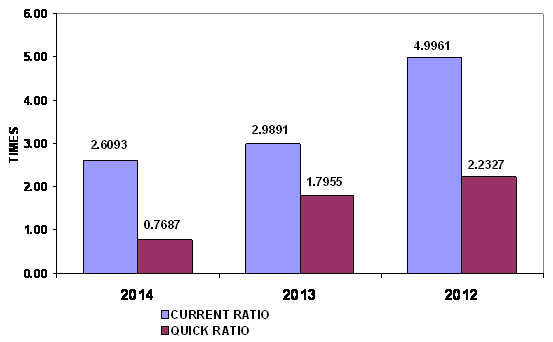
LIQUIDITY
RATIO
|
Current Ratio |
2.61 |
Impressive |
Industrial Average |
1.71 |
|
Quick Ratio |
0.77 |
|
|
|
|
Cash Conversion Cycle |
137.13 |
|
|
|
The Current Ratio is to ascertain whether a company's short-term assets
are readily available to pay off its short-term liabilities. The company's figure
is 2.61 times in 2014, decrease from 2.99 times, then it is generally
considered to have good short-term financial strength. When compared with the
industry average, the ratio of the company was higher, indicated that company
was an efficient operator in a dominant position within its industry.
The Quick Ratio is a liquidity indicator that further refines the
current ratio by measuring the amount of the most liquid current assets there
are to cover current liabilities. The company's figure is 0.77 times in 2014,
decrease from 1.8 times, then the company has not enough current assets that
presumably can be quickly converted to cash for pay financial obligations.
The Cash Conversion Cycle measures the number of days a company's cash is
tied up in the production and sales process of its operations and the benefit
from payment terms from its creditors. It meant the company could survive when
no cash inflow was received from sale for 138 days.
Trend of the average competitors in the same industry for last 5 years
Current Ratio Downtrend
LEVERAGE :
SATISFACTORY
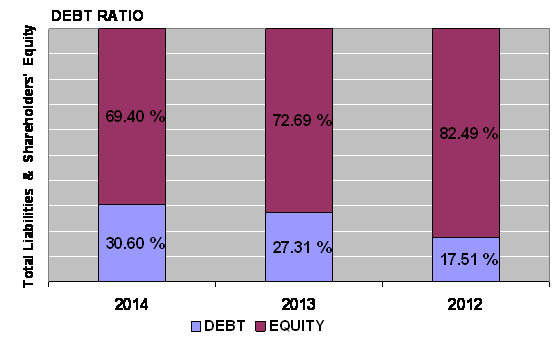
LEVERAGE
RATIO
|
Debt Ratio |
0.31 |
Impressive |
Industrial Average |
0.48 |
|
Debt to Equity Ratio |
0.44 |
Impressive |
Industrial Average |
0.94 |
|
Times Interest Earned |
(4.92) |
Risky |
Industrial Average |
- |
Debt to Equity Ratio a measurement of how much suppliers, lenders,
creditors and obligors have committed to the company versus what the shareholders
have committed. A lower the percentage means that the company is using less
leverage and has a stronger equity position.
Times Interest Earned measuring a company's ability to meet its debt
obligations. Ratio is -4.92 lower than 1, so the company is not generating
enough cash from EBIT to meet its interest obligations.
Debt Ratio shows the proportion of a company's assets which are financed
through debt. The company's figure is 0.31 less than 0.5, most of the company's
assets are financed through equity.
Trend of the average competitors in the same industry for last 5 years
Debt Ratio Uptrend
Times Interest Earned Stable
ACTIVITY :
SATISFACTORY
ACTIVITY
RATIO
|
Fixed Assets Turnover |
4.17 |
Impressive |
Industrial Average |
- |
|
Total Assets Turnover |
1.15 |
Acceptable |
Industrial Average |
1.55 |
|
Inventory Conversion Period |
148.08 |
|
|
|
|
Inventory Turnover |
2.46 |
Deteriorated |
Industrial Average |
7.02 |
|
Receivables Conversion Period |
55.53 |
|
|
|
|
Receivables Turnover |
6.57 |
Impressive |
Industrial Average |
5.42 |
|
Payables Conversion Period |
66.48 |
|
|
|
The company's Account Receivable Ratio is calculated as 6.57 and
Inventory Turnover in Days Ratio indicates the liquidity of inventory.
It estimates the number of days that it will take to sell the current
inventory. Inventory is particularly sensitive to change in business
activities. The inventory turnover in days has increased from 86 days at the
end of 2013 to 148 days at the end of 2014. This represents a negative trend.
And Inventory turnover has decreased from 4.23 times in year 2013 to 2.46 times
in year 2014.
The company's Total Asset Turnover is calculated as 1.15 times and 1.23
times in 2014 and 2013 respectively. This ratio is determined by dividing total
assets into total sales turnover. The ratio measures the activity of the assets
and the ability of the firm to generate sales through the use of the assets.
Trend of the average competitors in the same industry for last 5 years
Fixed Assets Turnover Stable
Total Assets Turnover Uptrend
Inventory Turnover Uptrend
Receivables Turnover Uptrend
FOREIGN EXCHANGE RATES
|
Currency |
Unit
|
Indian Rupees |
|
US Dollar |
1 |
Rs.63.57 |
|
|
1 |
Rs.100.30 |
|
Euro |
1 |
Rs.72.37 |
INFORMATION DETAILS
|
Analysis Done by
: |
KAR |
|
|
|
|
Report Prepared
by : |
SHG |
RATING EXPLANATIONS
|
RATING |
STATUS |
PROPOSED CREDIT LINE |
|
|
|
>86 |
Aaa |
Possesses an extremely sound financial base with the strongest
capability for timely payment of interest and principal sums |
Unlimited |
|
|
71-85 |
Aa |
Possesses adequate working capital. No caution needed for credit
transaction. It has above average (strong) capability for payment of interest
and principal sums |
Large |
|
|
56-70 |
A |
Financial & operational base are regarded healthy. General unfavourable
factors will not cause fatal effect. Satisfactory capability for payment of
interest and principal sums |
Fairly Large |
|
|
41-55 |
Ba |
Overall operation is considered normal. Capable to meet normal
commitments. |
Satisfactory |
|
|
26-40 |
B |
Capability to overcome financial difficulties seems comparatively
below average. |
Small |
|
|
11-25 |
Ca |
Adverse factors are apparent. Repayment of interest and principal sums
in default or expected to be in default upon maturity |
Limited with
full security |
|
|
<10 |
C |
Absolute credit risk exists. Caution needed to be exercised |
Credit not
recommended |
|
|
-- |
NB |
New Business |
-- |
|
This score serves as a reference to assess SC’s
credit risk and to set the amount of credit to be extended. It is calculated
from a composite of weighted scores obtained from each of the major sections of
this report. The assessed factors and their relative weights (as indicated
through %) are as follows:
Financial
condition (40%) Ownership
background (20%) Payment
record (10%)
Credit history
(10%) Market trend (10%) Operational size
(10%)
This report is issued at your request without any
risk and responsibility on the part of MIRA INFORM PRIVATE LIMITED (MIPL) or
its officials.