MIRA INFORM REPORT
|
Report No. : |
323479 |
|
Report Date : |
21.05.2015 |
IDENTIFICATION DETAILS
|
Name : |
JUMBO BAG LIMITED |
|
|
|
|
Registered
Office : |
S.K Enclave, New No. 4 [Old No. 47], Nowroji Road, Chetpet, Chennai – 600031, Tamilnadu |
|
Tel. No.: |
91-44-26461415 / 26451722 |
|
|
|
|
Country : |
India |
|
|
|
|
Financials (as
on) : |
31.03.2014 |
|
|
|
|
Date of
Incorporation : |
29.11.1990 |
|
|
|
|
Com. Reg. No.: |
18-019944 |
|
|
|
|
Capital
Investment / Paid-up Capital : |
Rs. 87.817 Million |
|
|
|
|
CIN No.: [Company Identification
No.] |
L36991TN1990PLC019944 |
|
|
|
|
IEC No.: |
0492023212 |
|
|
|
|
TAN No.: [Tax Deduction &
Collection Account No.] |
CHEJ00416D |
|
|
|
|
PAN No.: [Permanent Account No.] |
AAACJ1784D |
|
|
|
|
Legal Form : |
A Public Limited Liability Company. The Company’s Shares are Listed on
the Stock Exchanges. |
|
|
|
|
Line of Business
: |
Manufacturer of Flexible Intermediate Bulk Container Packaging
Material used for Industrial Purposes and also Trader of Polymers. |
|
|
|
|
No. of Employees
: |
Not Divulged |
RATING & COMMENTS
|
MIRA’s Rating : |
B (28) |
|
RATING |
STATUS |
PROPOSED CREDIT LINE |
|
|
26-40 |
B |
Capability to overcome financial difficulties seems comparatively
below average. |
Small |
|
Status : |
Moderate |
|
|
|
|
Payment Behaviour : |
Slow but correct |
|
|
|
|
Litigation : |
Clear |
|
|
|
|
Comments : |
Subject is an established company having moderate track record. The rating is constrained on account of a loss incurred by the company
during FY2014 and huge borrowings recorded by the company. However, trade relations are reported as fair. Business is active.
Payment terms are reported to be slow but correct. The company can be considered for business dealings with some caution.
|
NOTES:
Any query related to this report can be made
on e-mail: infodept@mirainform.com
while quoting report number, name and date.
ECGC Country Risk Classification List – March 31, 2015
|
Country Name |
Previous Rating (31.12.2014) |
Current Rating (31.03.2015) |
|
India |
A1 |
A1 |
|
Risk Category |
ECGC
Classification |
|
Insignificant |
A1 |
|
Low |
A2 |
|
Moderate |
B1 |
|
High |
B2 |
|
Very High |
C1 |
|
Restricted |
C2 |
|
Off-credit |
D |
EXTERNAL AGENCY RATING
|
Rating Agency Name |
CRISIL |
|
Rating |
Long Term Rating = B+ |
|
Rating Explanation |
High risk of default. |
|
Date |
March 17, 2015 |
|
Rating Agency Name |
CRISIL |
|
Rating |
Short Term Rating = A4 |
|
Rating Explanation |
Minimal degree of safety and carry very high credit risk. |
|
Date |
March 17, 2015 |
RBI DEFAULTERS’ LIST STATUS
Subject’s name is not enlisted as a defaulter
in the publicly available RBI Defaulters’ list.
EPF (Employee Provident Fund) DEFAULTERS’ LIST STATUS
Subject’s name is not enlisted as a defaulter
in the publicly available EPF (Employee Provident Fund) Defaulters’ list as of
31-03-2014.
INFORMATION PARTED BY
|
Name : |
Ms. Shanti Priya |
|
Designation : |
Office Executive |
|
Contact No.: |
91-44-26461415 |
|
Date : |
19.05.2015 |
LOCATIONS
|
Registered/ Corporate Office : |
S.K Enclave, New No. 4 [Old No. 47], Nowroji Road, Chetpet, Chennai – 600031, Tamilnadu, India |
|
Tel. No.: |
91-44-26461415/ 26451722 |
|
Fax No.: |
91-44-26451720 |
|
E-Mail : |
|
|
Website : |
|
|
|
|
|
Branch Office : |
TA2, 3rd Floor, Lake City Mall, Kapurbawdi Junction, Thane – 400607, Maharashtra, India |
|
Tel. No.: |
91-22-25412210/ 11/ 12 |
|
Fax No.: |
91-22-25412213 |
|
|
|
|
Marketing Office/
Factory 1 : |
75, Thatchur Kootu Road, Panjetty Village, Ponneri Taluk, Tiruvellore Dist -601204, Tamilnadu, India |
|
Tel. No.: |
91-44-27984336/ 37/ 38 |
|
Fax No.: |
91-44-27984245 |
|
|
|
|
Factory 2 : |
No.106, G.N.T. Road, Alingivakkam P.O., Athipedu Village, Chennai – 600067, Tamilnadu, India |
|
|
|
|
US Office : |
Jumbo Bag LLC 2150-A, Northmont Parkway, Duluth, GA 30096, USA |
|
Tel. No.: |
+1 770 295 0031 |
DIRECTORS
As on 31.03.2014
|
Name : |
Mr. K.J.M. Shetty |
|
Designation : |
Chairman |
|
Address : |
F-88, Anna Nagar East, Chennai – 600102, Tamilnadu, India |
|
Qualification : |
I.A.S. (Retd.) |
|
|
|
|
Name : |
Mr. G.P.N. Gupta |
|
Designation : |
Managing Director |
|
Address : |
No.46, Halls Road, Kilpauk, Chennai – 600010, Tamilnadu, India |
|
|
|
|
Name : |
Mr. G. Radhakrishna |
|
Designation : |
Director |
|
Address : |
No.46, Halls Road, Kilpauk, Chennai – 600010, Tamilnadu, India |
|
|
|
|
Name : |
Mr. M. Rama Rao |
|
Designation : |
Director |
|
Address : |
11-5-5, Gopala Krishna Road, Ramaraopet, Kakinada, Andhra Pradesh,
India |
|
|
|
|
Name : |
Mr. M.V. Ananthakrishna |
|
Designation : |
Director |
|
Address : |
No.16, South Mada, Street, Srinagar Colony, Chennai – 600015,
Tamilnadu, India |
|
|
|
|
Name : |
Dr. Gaddam Kumar Reddy |
|
Designation : |
Director |
|
Address : |
Pound Paddock Church Hill, Kingsnorth, Ashford, Kent, TN23 3EG -
111111 |
|
|
|
|
Name : |
Mr. G.S. Anil Kumar |
|
Designation : |
Whole-time Director |
|
Address : |
1491, J Block No.63, 13th Main Road, Anna Nagar, Chennai –
600040, Tamilnadu, India |
|
|
|
|
Name : |
Mr. G.P. Ramraj |
|
Designation : |
Whole-time Director |
|
Address : |
Plot No. 1568, 16th Main Road, J Block, Anna Nagar, Chennai
– 600040, Tamilnadu, India |
KEY EXECUTIVES
|
Name : |
Ms. Prema Sona Bharathi |
|
Designation : |
Company Secretary and Compliance Officer |
|
|
|
|
Audit Committee : |
· K.J.M. Shetty Chairman · G.P.N. Gupta Member · M.V. Ananthakrishna Member |
SHAREHOLDING PATTERN
As on 31.03.2015
|
Category of Shareholder |
Total No. of Shares |
Total Shareholding as a % of Total No. of
Shares |
|
(A) Shareholding of
Promoter and Promoter Group |
||
|
|
|
|
|
|
1005597 |
12.01 |
|
|
2632200 |
31.43 |
|
|
3637797 |
43.44 |
|
|
|
|
|
Total shareholding
of Promoter and Promoter Group (A) |
3637797 |
43.44 |
|
(B) Public
Shareholding |
||
|
|
|
|
|
|
15600 |
0.19 |
|
|
100 |
0.00 |
|
|
15700 |
0.19 |
|
|
|
|
|
|
189510 |
2.26 |
|
|
|
|
|
Individual shareholders holding nominal share capital up to Rs. 0.100 Million |
2689216 |
32.12 |
|
Individual shareholders holding nominal share capital in excess of Rs. 0.100 Million |
1679387 |
20.06 |
|
|
162090 |
1.94 |
|
|
138546 |
1.65 |
|
|
23494 |
0.28 |
|
|
50 |
0.00 |
|
|
4720203 |
56.37 |
|
Total Public
shareholding (B) |
4735903 |
56.56 |
|
Total (A)+(B) |
8373700 |
100.00 |
|
(C) Shares held by Custodians
and against which Depository Receipts have been issued |
0 |
0.00 |
|
|
0 |
0.00 |
|
|
0 |
0.00 |
|
|
0 |
0.00 |
|
Total (A)+(B)+(C) |
8373700 |
100.00 |

BUSINESS DETAILS
|
Line of Business : |
Manufacturer of Flexible Intermediate Bulk Container
Packaging Material used for Industrial Purposes and also Trader of Polymers. |
|
|
|
|
Products : |
|
|
|
|
|
Brand Names : |
Not Available |
|
|
|
|
Agencies Held : |
Not Available |
|
|
|
|
Exports : |
Not Divulged |
|
|
|
|
Imports : |
Not Divulged |
|
|
|
|
Terms : |
|
|
Selling : |
Not Divulged |
|
|
|
|
Purchasing : |
Not Divulged |
PRODUCTION STATUS (AS ON 31.03.2014)
|
Capacity and Production |
013-14 |
|
Class of Goods : Intermediate Flexible Containers, Fabric,
Components of Jumbo Bags, Liner & Small Bags |
|
|
Licensed Capacity (in MT) |
8870.000 |
|
Installed Capacity (in MT) |
6497.000 |
|
Actual Production (in MT) |
3657.927 |
Note: The Installed capacity is technically evaluated as certified by the management and accepted by auditors (per year on a continuous shift basis)
GENERAL INFORMATION
|
Suppliers : |
|
||||||||||||||||||||||||
|
|
|
||||||||||||||||||||||||
|
Customers : |
|
||||||||||||||||||||||||
|
|
|
||||||||||||||||||||||||
|
No. of Employees : |
Not Divulged |
||||||||||||||||||||||||
|
|
|
||||||||||||||||||||||||
|
Bankers : |
· State Bank of India ·
State Bank of Hyderabad |
||||||||||||||||||||||||
|
|
|
||||||||||||||||||||||||
|
Facilities : |
|
|
|
|
|
Statutory Auditors : |
|
|
Name : |
M. Srinivasan and Associates Chartered Accountants |
|
Address : |
No.5, 9th Floor, B Wing, Parsn Manere, 602, Anna Salai, Chennai
– 600006, Tamilnadu, India |
|
|
|
|
Associate Company : |
· Stanpacks (India) Limited · JBL Saks Private Limited · Jumbo Bag LLC · Balaji Trading Enterprises Private Limited · Dinesh Polyfab Private Limited ·
G.F. Impex |
CAPITAL STRUCTURE
As on 31.03.2014
Authorised Capital:
|
No. of Shares |
Type |
Value |
Amount |
|
|
|
|
|
|
14000000 |
Equity Shares |
Rs. 10/- each |
Rs. 140.000 Million |
|
600000 |
Cumulative, Redeemable Preference Shares |
Rs. 100/- each |
Rs. 60.000 Million |
|
|
Total |
|
Rs. 200.000
Million |
Issued Capital:
|
No. of Shares |
Type |
Value |
Amount |
|
|
|
|
|
|
8373700 |
Equity Shares |
Rs. 10/- each |
Rs. 83.737 Million |
Subscribed & Paid-up Capital:
|
No. of Shares |
Type |
Value |
Amount |
|
|
|
|
|
|
8373700 |
Equity Shares |
Rs. 10/- each |
Rs. 83.737 Million |
|
408000 |
Add: Forfeited Shares [Equity Shares] |
Rs. 10/- each |
Rs. 4.080 Million |
|
|
Total |
|
Rs. 87.817
Million |
Clause (a) (b) (c)
–
The Authorised Capital comprises of equity shares and non-convertible
redeemable preference shares. The Issued and Fully Paid-up Capital comprise of
equity shares having a par value of Rs.10 each.
|
PARTICULARS |
31.03.2014 |
|
Authorised: (i) 14000000 Equity shares of Rs.10 Each |
140.000 |
|
(ii) 600000
Non-convertible Redeemable Cumulative Preference Shares of Rs.100 Each |
60.000 |
|
Total |
200.000 |
|
Issued,
Subscribed and Fully paid up: 8373700 Equity Shares of Rs.10 Each |
83.737 |
|
Total |
83.737 |
Clause (d) – Reconciliation of number of shares
|
PARTICULARS |
31.03.2014 |
|
|
Number of shares |
Amount |
|
|
Equity Shares |
|
|
|
Opening Balance |
8373700 |
83.737 |
|
Changes during the year |
-- |
-- |
|
Closing Balance |
8373700 |
83.737 |
Clause (e) –
Rights, preference and restrictions attached to shares
Equity Shares:
The Company has
one class of equity shares having a par value of Rs.10 each. Each shareholder is
eligible for one vote per share held. The dividend proposed by the Board of
Directors is subject to the approval of the shareholders in the ensuing annual
general meeting.
Clause (f) –
Shares held by holding company and its subsidiaries – Not Applicable
Clause (g) –
Particulars of shares held by shareholders holding more than 5% of the
aggregate shares in the company:
|
PARTICULARS |
31st March 2014 |
|
EQUITY SHARES Balaji Trading
Enterprises Private Limited (No. of shares) |
2632200 |
|
% of holding |
31.43 |
Clause (h) –
Shares reserved for issue under options and contracts/ commitments for the sale
of shares – Not applicable
Clause (i) –
Shares allotted in the preceding five years without payment being received in
cash / by way of bonus shares / shares bought back – Not Applicable
Clause (j) – Terms
of any securities convertible into issued along with the earliest date of
conversion – Not Applicable
Clause (k) – Calls unpaid – Not Applicable
Clause (l) – Forfeited shares
|
PARTICULARS |
31st March 2014 |
|
|
|
|
EQUITY SHARES 4,08,000 (previous year 4,08,000) shares of Rs.10 par value |
4.080 |
The reconciliation of the number of equity shares outstanding is set out
below:
|
PARTICULARS |
31st March 2014 |
|
Shares outstanding at the beginning of the year |
8373700 |
|
Shares issued during the year |
-- |
|
Shares bought back during the year |
-- |
|
Shares outstanding at the end of the year |
8373700 |
FINANCIAL DATA
[all figures are
in Rupees Million]
ABRIDGED BALANCE
SHEET
|
SOURCES OF FUNDS |
31.03.2014 |
31.03.2013 |
31.03.2012 |
|
I.
EQUITY AND LIABILITIES |
|
|
|
|
(1)Shareholders' Funds |
|
|
|
|
(a) Share Capital |
87.817 |
87.817 |
87.817 |
|
(b) Reserves & Surplus |
88.423 |
110.555 |
109.627 |
|
(c) Money received against share warrants |
0.000 |
0.000 |
0.000 |
|
|
|
|
|
|
(2) Share
Application money pending allotment |
0.000 |
0.000 |
0.000 |
|
Total
Shareholders’ Funds (1) + (2) |
176.240 |
198.372 |
197.444 |
|
|
|
|
|
|
(3)
Non-Current Liabilities |
|
|
|
|
(a) Long-term borrowings |
21.838 |
29.101 |
28.601 |
|
(b) Deferred tax liabilities (Net) |
38.985 |
41.404 |
41.572 |
|
(c)
Other long term liabilities |
2.287 |
3.484 |
5.001 |
|
(d)
long-term provisions |
2.856 |
0.101 |
0.421 |
|
Total
Non-current Liabilities (3) |
65.966 |
74.090 |
75.595 |
|
|
|
|
|
|
(4) Current Liabilities |
|
|
|
|
(a)
Short term borrowings |
441.838 |
439.889 |
372.370 |
|
(b)
Trade payables |
247.903 |
92.432 |
88.796 |
|
(c)
Other current liabilities |
16.182 |
13.095 |
24.911 |
|
(d)
Short-term provisions |
34.381 |
25.895 |
27.805 |
|
Total
Current Liabilities (4) |
740.304 |
571.311 |
513.882 |
|
|
|
|
|
|
TOTAL |
982.510 |
843.773 |
786.921 |
|
|
|
|
|
|
II.
ASSETS |
|
|
|
|
(1) Non-current assets |
|
|
|
|
(a)
Fixed Assets |
|
|
|
|
(i)
Tangible assets |
194.935 |
236.840 |
241.938 |
|
(ii)
Intangible Assets |
0.000 |
0.000 |
0.000 |
|
(iii)
Capital work-in-progress |
0.331 |
0.000 |
0.014 |
|
(iv) Intangible assets under development |
0.000 |
0.000 |
0.000 |
|
(b) Non-current
Investments |
0.280 |
0.261 |
0.227 |
|
(c) Deferred tax assets
(net) |
0.000 |
0.000 |
0.000 |
|
(d) Long-term Loan
and Advances |
10.658 |
17.338 |
16.020 |
|
(e)
Other Non-current assets |
5.405 |
4.820 |
1.781 |
|
Total
Non-Current Assets |
211.609 |
259.259 |
259.980 |
|
|
|
|
|
|
(2) Current assets |
|
|
|
|
(a)
Current investments |
0.000 |
0.000 |
0.000 |
|
(b)
Inventories |
186.880 |
183.829 |
225.228 |
|
(c)
Trade receivables |
401.518 |
325.110 |
243.587 |
|
(d)
Cash and cash equivalents |
21.204 |
20.597 |
16.955 |
|
(e)
Short-term loans and advances |
50.788 |
54.425 |
40.608 |
|
(f)
Other current assets |
110.511 |
0.553 |
0.563 |
|
Total
Current Assets |
770.901 |
584.514 |
526.941 |
|
|
|
|
|
|
TOTAL |
982.510 |
843.773 |
786.921 |
PROFIT & LOSS
ACCOUNT
|
|
PARTICULARS |
31.03.2014 |
31.03.2013 |
31.03.2012 |
|
|
SALES |
|
|
|
|
|
Revenue from Operations |
832.747 |
868.813 |
830.290 |
|
|
Other Income |
2.526 |
8.766 |
2.714 |
|
|
TOTAL |
835.273 |
877.579 |
833.004 |
|
|
|
|
|
|
|
Less |
EXPENSES |
|
|
|
|
|
Cost of Materials Consumed |
524.470 |
447.130 |
531.817 |
|
|
Purchases of Stock-in-Trade |
83.668 |
65.178 |
33.088 |
|
|
Changes in inventories of finished goods, work-in-progress
and Stock-in-Trade |
13.994 |
23.339 |
-61.848 |
|
|
Employees benefits expense |
70.530 |
69.239 |
63.780 |
|
|
Other expenses |
190.890 |
207.040 |
197.802 |
|
|
Exceptional Items-Insurance Claims Receivable |
(84.143) |
0.000 |
(0.472) |
|
|
TOTAL |
799.409 |
811.926 |
764.167 |
|
|
|
|
|
|
|
Less |
PROFIT/
(LOSS) BEFORE INTEREST, TAX, DEPRECIATION AND AMORTISATION |
35.864 |
65.653 |
68.837 |
|
|
|
|
|
|
|
Less |
FINANCIAL
EXPENSES |
41.097 |
44.370 |
39.813 |
|
|
|
|
|
|
|
|
PROFIT/
(LOSS) BEFORE TAX, DEPRECIATION AND AMORTISATION |
(5.233) |
21.283 |
29.024 |
|
|
|
|
|
|
|
Less/ Add |
DEPRECIATION/
AMORTISATION |
19.318 |
20.230 |
19.326 |
|
|
|
|
|
|
|
|
PROFIT/ (LOSS)
BEFORE TAX |
(24.551) |
1.053 |
9.698 |
|
|
|
|
|
|
|
Less |
TAX |
(2.419) |
0.125 |
2.883 |
|
|
|
|
|
|
|
|
PROFIT/ (LOSS)
AFTER TAX |
(22.132) |
0.928 |
6.815 |
|
|
|
|
|
|
|
|
EARNINGS IN
FOREIGN CURRENCY |
|
|
|
|
|
FOB Value of Exports |
359.219 |
406.889 |
375.704 |
|
|
|
|
|
|
|
|
IMPORTS |
|
|
|
|
|
C.I.F Value of Imports |
143.467 |
296.446 |
218.034 |
|
|
Travel |
2.270 |
4.037 |
4.967 |
|
|
Commission (paid for previous yrs. liability) |
1.990 |
0.611 |
1.307 |
|
|
Testing charges |
0.000 |
0.049 |
0.177 |
|
|
TOTAL IMPORTS |
147.727 |
301.143 |
224.485 |
|
|
|
|
|
|
|
|
Earnings/ (Loss)
Per Share (Rs.) |
(2.64) |
0.11 |
0.83 |
CURRENT MATURITIES
OF LONG TERM DEBT DETAILS
|
Particulars |
31.03.2014 |
31.03.2013 |
31.03.2012 |
|
Current Maturities of Long term debt |
9.636 |
9.745 |
9.636 |
|
Cash generated from operations |
19.413 |
(49.132) |
(30.846) |
QUARTERLY RESULTS
|
PARTICULARS |
30.06.2014 1st Quarter |
30.09.2014 2nd Quarter |
31.12.2014 3rd Quarter |
|
Unaudited |
Unaudited |
Unaudited |
Unaudited |
|
Net Sales |
216.800 |
247.700 |
220.840 |
|
Total Expenditure |
202.500 |
229.100 |
219.550 |
|
PBIDT (Excl OI) |
14.300 |
18.600 |
1.290 |
|
Other Income |
3.500 |
3.000 |
1.920 |
|
Operating Profit |
17.800 |
21.600 |
3.210 |
|
Interest |
13.200 |
16.900 |
16.220 |
|
Exceptional Items |
0.000 |
0.000 |
0.000 |
|
PBDT |
4.500 |
4.700 |
(13.010) |
|
Depreciation |
4.000 |
4.000 |
4.520 |
|
Profit Before Tax |
0.500 |
0.700 |
(17.530) |
|
Tax |
0.200 |
0.300 |
(0.360) |
|
Provisions and contingencies |
0.100 |
0.000 |
0.000 |
|
Profit After Tax |
0.300 |
0.500 |
(17.170) |
|
Extraordinary Items |
0.000 |
0.000 |
0.000 |
|
Prior Period Expenses |
0.000 |
0.000 |
0.000 |
|
Other Adjustments |
0.000 |
0.000 |
0.000 |
|
Net Profit |
0.300 |
0.500 |
(17.170) |
KEY RATIOS
|
PARTICULARS |
|
31.03.2014 |
31.03.2013 |
31.03.2012 |
|
Net Profit Margin (PAT/Sales) |
(%) |
(2.66) |
0.11 |
0.82 |
|
|
|
|
|
|
|
Operating Profit Margin (PBDIT/Sales) |
(%) |
4.31 |
7.56 |
8.29 |
|
|
|
|
|
|
|
Return on Total Assets (PBT/Total Assets} |
(%) |
(2.50) |
0.12 |
1.23 |
|
|
|
|
|
|
|
Return on Investment (ROI) (PBT/Networth) |
|
(0.14) |
0.01 |
0.05 |
|
|
|
|
|
|
|
Debt Equity Ratio (Total Debt/Networth) |
|
2.69 |
2.41 |
2.08 |
|
|
|
|
|
|
|
Current Ratio (Current Asset/Current Liability) |
|
1.04 |
1.02 |
1.03 |
FINANCIAL ANALYSIS
[all figures are in
Rupees Million]
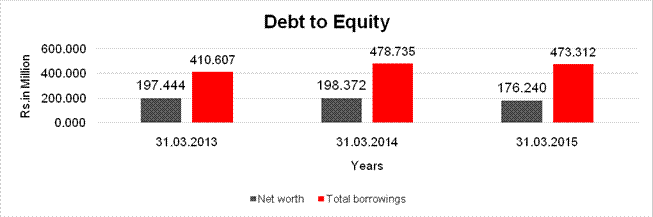
DEBT EQUITY RATIO
|
Particular |
31.03.2013 |
31.03.2014 |
31.03.2015 |
|
|
(Rs. In Million) |
(Rs. In Million) |
(Rs. In Million) |
|
Share Capital |
87.817 |
87.817 |
87.817 |
|
Reserves & Surplus |
109.627 |
110.555 |
88.423 |
|
Net worth |
197.444 |
198.372 |
176.240 |
|
|
|
|
|
|
long-term borrowings |
28.601 |
29.101 |
21.838 |
|
Short term borrowings |
372.370 |
439.889 |
441.838 |
|
Current Maturities of
Long Term Debt |
9.636 |
9.745 |
9.636 |
|
Total borrowings |
410.607 |
478.735 |
473.312 |
|
Debt/Equity ratio |
2.080 |
2.413 |
2.686 |
YEAR-ON-YEAR GROWTH
|
Year on Year Growth |
31.03.2012 |
31.03.2013 |
31.03.2014 |
|
|
(Rs.
In Million) |
(Rs.
In Million) |
(Rs.
In Million) |
|
Sales |
830.290 |
868.813 |
832.747 |
|
|
|
4.640 |
(4.151) |

NET PROFIT MARGIN
|
Net Profit Margin |
31.03.2012 |
31.03.2013 |
31.03.2014 |
|
|
(Rs.
In Million) |
(Rs.
In Million) |
(Rs.
In Million) |
|
Sales |
830.290 |
868.813 |
832.747 |
|
Profit/ (Loss) |
6.815 |
0.928 |
(22.132) |
|
|
0.82% |
0.11% |
(2.66%) |

LOCAL AGENCY FURTHER INFORMATION
|
Sr. No. |
Check list by
info agents |
Available in
Report (Yes/No) |
|
1 |
Year of establishment |
Yes |
|
2 |
Constitution of the entity -Incorporation
details |
Yes |
|
3 |
Locality of the entity |
Yes |
|
4 |
Premises details |
No |
|
5 |
Buyer visit details |
---------------------- |
|
6 |
Contact numbers |
Yes |
|
7 |
Name of the person contacted |
Yes |
|
8 |
Designation of contact person |
Yes |
|
9 |
Promoter’s background |
No |
|
10 |
Date of Birth of Proprietor / Partners /
Directors |
No |
|
11 |
Pan Card No. of Proprietor / Partners |
No |
|
12 |
Voter Id Card No. of Proprietor / Partners |
No |
|
13 |
Type of business |
Yes |
|
14 |
Line of Business |
Yes |
|
15 |
Export/import details (if applicable) |
No |
|
16 |
No. of employees |
No |
|
17 |
Details of sister concerns |
Yes |
|
18 |
Major suppliers |
No |
|
19 |
Major customers |
No |
|
20 |
Banking Details |
Yes |
|
21 |
Banking facility details |
Yes |
|
22 |
Conduct of the banking account |
---------------------- |
|
23 |
Financials, if provided |
Yes |
|
24 |
Capital in the business |
Yes |
|
25 |
Last accounts filed at ROC, if applicable |
Yes |
|
26 |
Turnover of firm for last three years |
Yes |
|
27 |
Reasons for variation <> 20% |
---------------------- |
|
28 |
Estimation for coming financial year |
Yes / No |
|
29 |
Profitability for last three years |
Yes |
|
30 |
Major shareholders, if available |
Yes |
|
31 |
External Agency Rating, if available |
Yes |
|
32 |
Litigations that the firm/promoter
involved in |
---------------------- |
|
33 |
Market information |
---------------------- |
|
34 |
Payments terms |
No |
|
35 |
Negative Reporting by Auditors in the
Annual Report |
No |
INDEX OF CHARGES
|
S. No. |
Charge ID |
Date of Charge Creation/Modification |
Charge amount secured |
Charge Holder |
Address |
Service Request Number (SRN) |
|
1 |
10435080 |
14/06/2013 |
425,500,000.00 |
STATE BANK OF INDIA |
COMMERCIAL BRANCH, NO.232 N.S.C.BOSE ROAD, CHENNAI, Tamil Nadu - 600001, INDIA |
B78653664 |
|
2 |
90288597 |
03/03/2014 * |
590,500,000.00 |
STATE BANK OF INDIA - LEAD BANK |
COMMERCIAL BRANCH, No.232, NSC BOSE ROAD, CHENNAI, Tamil Nadu - 600001, INDIA |
C00354639 |
* Date of charge modification
UNSECURED LOANS
|
PARTICULARS |
31.03.2014 (Rs.
In Million) |
31.03.2013 (Rs.
In Million) |
|
LONG-TERM BORROWINGS |
|
|
|
Public Deposits |
3.495 |
5.305 |
|
Loans and advances from related parties |
9.600 |
5.130 |
|
SHORT TERM BORROWINGS |
|
|
|
From other parties |
15.000 |
0.000 |
|
Public Deposits |
2.905 |
1.725 |
|
Total |
31.000 |
12.160 |
OPERATIONS AND FINANCIAL PERFORMANCE
The consolidated revenue of Jumbo Bag Limited stands at Rs. 835.300
Million for the financial year ended 31st March 2014 as compared to the revenue
of Rs 877.600 Million in the previous year. The Company has incurred a loss
this year amounting to Rs. 22.132 Million in the current year as against a
Profit of Rs.0.928 Million in the previous year.
The Company had faced a setback in the financial year 2012-13; however,
it picked up on its performance gradually and made a profit of Rs.3.000 Million
in the Second Quarter of the year 2013-14. The operation of the company was
again affected due to a major fire accident at Unit II (Athipedu Factory) that
occurred on 23rd November 2013. Major portion of the factory was gutted in fire
and the company faced huge loss in terms of materials and machinery. The
factory was completely shut down till 9th December 2014. Thereafter, the
portion that was not damaged operated.
Further to the above, there was a strike by the workers in Unit I
(Ponneri Factory) that lasted for 25 days from 27th December, 2013 to 20th
January, 2014. Despite the unforeseen hurdles, the company took immediate steps
to control the damage caused and maintained the production level. Rigorous
steps are being taken to fulfill the customer obligations on time and to keep
the production going up to the maximum capacity with the help of various
sources available in the market. The company would like to inform that despite
the hard times, the market and the customer have been understanding to their
situation and have given them helping hand in every way possible. The company
is con dent that it will recover from this setback at the earliest
possible time.
The company has been able to withstand two big jolts experienced during
the last financial year and it was able to resume its operations at the
unaffected part of the Athipedu Unit within a short span of time from the date
of incidents. The company’s cordial relationship with the market in general
helped in garnering support at the time of adversity from its competitors and
vendors. Besides, the company managed to find alternative sources to finish the
orders on time so that the customers did not suffer due to the setback faced by
the company in production.
On the brighter aspects, the company has been able to sustain its growth
in the trading of IOCL Products in terms of sales and volume. The financial
year 2013-14 saw 20% growth in volume of sales.
MANAGEMENT DISCUSSION AND ANALYSIS REPORT
WORLD ECONOMIC OUTLOOK:
With Continued slow down since 2008, global activity has broadly
strengthened and is expected to improve further in 2014–15, with much of the
impetus for growth coming from advanced economies. Although downside risks have
diminished overall, lower-than-expected inflation poses risks for advanced
economies, there is increased financial volatility in emerging market
economies, and increases in the cost of capital will likely dampen investment
and weigh on growth.
Global growth is now projected to be slightly higher in 2014, at around
3.7 percent, rising to 3.9 percent in 2015, but downward revisions to growth
forecasts in some economies highlight continued fragilities, and downside risks
remain. According to World Bank’s latest Global Economic Prospects report,
developing countries are headed for a third consecutive year of disappointing
growth below 5 percent, as first quarter weakness in 2014 has delayed an
expected pick-up in economic activity.
INDIAN ECONOMIC CONDITIONS:
India’s growth is expected to recover from 4.4 percent in 2013 to 5.4
percent in 2014, supported by slightly stronger global growth, improving export
competitiveness, and implementation of recently approved investment projects. A
pickup in exports in recent months and measures to curb gold imports has
contributed to lowering the current account deficit. Policy measures to bolster
capital flows have further helped reduce external vulnerabilities. Overall
growth is expected to firm up on policies supporting investment and a
confidence boost from recent policy actions, but the actual growth will remain
below trend.
The Indian manufacturing sector is facing challenging times. The
Government has to make every effort to improve the investment environment
enabling manufacturing and infrastructure projects to be implemented in the
shortest possible time. We need the competitiveness of their industry to be at
the core of policy so that they can supply the domestic market and export to
the world.
INDUSTRIAL TREND AND FIBC MARKET OUTLOOK:
The Indian packaging industry is currently $24.6 billion with a growth
rate of above 12.36% per annum more than twice the global average while their
GDP growth was 8.5%. Not only is the industry growing rapidly but it is also
creating lucrative jobs for those who find a career in it.
The Indian bulk packaging market started moving significantly only in
the 1990s as the industries acquired bulk handling capabilities to compete in
the globalized world. The markets really took off at the turn of the new millennium
spurred by an export-led and domestic growth in agro produce and foods. The
market grew at around 28% for the first 6-7 years and then settled down to a
15-20% band largely bucking the worldwide slowdown.
The usage of FIBCs has more than doubled in the past decade. Along with
this increase, the role of Flexible Intermediate Bulk Containers has evolved to
a point where it is a common method for transporting a wide range of products.
One of the most significant factors for the growth in usage can be attributed
to conversion. The conversion from smaller bags and drums to FIBCs continues to
increase. The change is typically driven by economic factors. Once in place,
the customers also find greater accuracy and greater productivity (time savings
of semi-bulk systems vs. human interface with smaller containers).
The market is very competitive with respect to price but it is also the
least important item when compared to other factors like quality control
procedures, knowledge of industry standards and regulations, customer service,
manufacturing facility certifications.
Increase in price of raw materials is a growing challenge in the FIBC
industry. While higher prices provide challenges, they have also resulted in
growth. Increase in transportation costs have highlighted the low package to
product weight ratio of a filled FIBC and the compact lightweight nature of an
empty FIBC. As costs increase, the freight advantages of FIBCs will continue to
drive conversion from other types of industrial packaging.
As a responsibility to the environment where they dwell, reuse and
reconditioning of FIBCs can be cost effective and can reduce a company’s
environmental impact, but it is critical that procedures are in place to ensure
that the FIBCs continue to meet or exceed industry standards. The FIBC design,
product and distribution environment all need to be considered to determine if
reuse is an option.
REVIEW OF OPERATIONS:
Though the Company’s top line performance has increased by 4% from
Rs.830.000 Million to Rs. 870.000 Million, it did not increase in the bottom
line mainly due to the fire accident which was a major blow to the operations
of the company considering the gradual increase in the profitability that the
company had witnessed by the end of the half year in 2013-14. However, the
company maintained the sales volume in both domestic and export sales and saw
an increase during the period.
FINANCIAL ANALYSIS:
The company had to face the volatility of the dollar price in the
financial year 2013-14 and suffered a forex loss. However, the company reviewed
the policy and took precautionary measures to ensure that the forex cover is
adequate and does not get influenced by the market fluctuations.
SEGMENT WISE PERFORMANCE:
MANUFACTURING
The manufacturing sector is still in the recovery mode in the current
fiscal year. With the new Government taking over the office, it is expected
that efforts on investment in the manufacturing sector and providing
infrastructure shall be taken up for a robust growth in the sector this year.
Although, the uptrend is expected hereon, due to the situation of the company
in the previous financial year due to fire accident, it shall be difficult for
the company to recover in the immediate future. However, every effort is being
taken by the company to fulfill the order books of the customers and is
mobilizing the resources to avoid halt at work.
TRADING
The company had been appointed as the Del – Credere Associate cum
Consignment Stockist (DCA/ CS) of Indian Oil Corporation Limited for Tamil
Nadu, Pondicherry and Kerala in the year 2009. The journey as a trader for IOCL
Polymer products has been encouraging so far and has contributed significantly
to the profitability of the company especially during the last financial year.
The profit from trading has enhanced this year also to an extent of 23% as
against the previous year. The commission sales from trading earned in the
current year amounts to Rs.10.200 Million as against Rs.8.300 Million in the
previous year. Jumbo Bag Limited earned the highest sales position among all
agents in South India in 2013-14.
STATEMENT OF UNAUDITED RESULTS FOR THE QUARTER ENDED 31.12.2014
(RS.
IN MILLION)
|
PARTICULARS |
3 months ended 31.12.2014 |
Preceding 3 months ended 30.09.2014 |
Year to date figures for current period ended
31.12.2014 |
|
|
Unaudited |
Unaudited |
Unaudited |
|
1. Income
from operations |
|
|
|
|
(a) Net sales/income from operations (Net of excise duty) |
212.106 |
240.827 |
658.991 |
|
(b) Other operating income |
8.731 |
6.897 |
26.336 |
|
Total
income from operations (net) |
220.837 |
247.724 |
685.327 |
|
|
|
|
|
|
2. Expenditure |
|
|
|
|
(a) Cost of materials consumed |
127.072 |
158.762 |
411.948 |
|
(b) Purchases of stock-in-trade |
9.444 |
6.717 |
39.293 |
|
(c) Changes in inventories of finished goods, work-in progress and
stock-in-trade |
(18.349) |
(22.855) |
(60.352) |
|
(d) Employee benefits expense |
20.945 |
20.234 |
60.392 |
|
(e) Depreciation and amortization
expense |
4.515 |
4.016 |
12.510 |
|
(f) Other expenses(Any item exceeding 10% of the total expenses
relating to continuing operations to be shown separately) |
80.435 |
66.270 |
199.891 |
|
Total
expenses |
224.062 |
233.144 |
663.682 |
|
|
|
|
|
|
3. Profit from Operations before Other income, interest
and Exceptional Items (1-2) |
(3.225) |
14.580 |
21.645 |
|
4. Other Income |
1.923 |
2.983 |
8.388 |
|
5. Profit before Interest and Exceptional Items (3+4) |
(1.302) |
17.563 |
30.033 |
|
6. Interest |
16.219 |
16.858 |
46.321 |
|
7. Profit after Interest but before exceptional |
(17.521) |
0.705 |
(16.288) |
|
8.Exceptional Items |
0.000 |
0.000 |
0.000 |
|
9. Profit (+)/ Loss (-) from Ordinary Activities before
tax (7+8) |
(17.521) |
0.705 |
(16.288) |
|
10. Tax expense |
(0.355) |
0.244 |
0.078 |
|
11. Net Profit after tax (9-10) |
(17.166) |
0.461 |
(16.366) |
|
12. Extraordinary
items |
0.000 |
0.000 |
0.000 |
|
13. Net Profit (+)/ Loss (-) for the period (11-12) |
(17.166) |
0.461 |
(16.366) |
|
14. Paid-up equity
share capital (Face value of the share (Rs. 10) |
83.737 |
83.737 |
83.737 |
|
15. Reserves
excluding Revaluation Reserves as per balance sheet of previous accounting
year |
72.057 |
89.223 |
72.057 |
|
Earnings per share Basic &
Diluted |
(0.20) |
0.01 |
(2.00) |
|
|
|
|
|
|
PARTICULARS
OF SHAREHOLDING |
|
|
|
|
17. Public
shareholding |
|
|
|
|
- Number of shares |
4735903 |
4736903 |
4735903 |
|
- Percentage of
shareholding |
56.56 |
56.57 |
56.56 |
|
|
|
|
|
|
18. Promoters and
Promoters' Group Shareholding |
|
|
|
|
- (a)
Pledged/Encumbered |
|
|
|
|
- No. of Shares |
0.000 |
0.000 |
0.000 |
|
- Percentage of Shares (as a % of the total
outstanding of Promoters and Promoters' groups) |
0.000 |
0.000 |
0.000 |
|
- Percentage of Shares (as a % of the total
share capital of the Company) |
0.000 |
0.000 |
0.000 |
|
|
|
|
|
|
- (b)
Non-Encumbered |
|
|
|
|
- No. of Shares |
3637797 |
3636797 |
3637797 |
|
- Percentage of Shares (as a % of the total
outstanding of Promoters and Promoters' groups) |
43.44 |
43.43 |
43.44 |
|
- Percentage of Shares (as a % of the total
share capital of the Company) |
100 |
100 |
100 |
|
Investor Complaints [Nos.] |
3 months ended 31.12.2014 |
|
Pending at the beginning of the quarter. |
Nil |
|
Received during the quarter. |
Nil |
|
Disposed of during the quarter. |
Nil |
|
Remaining unresolved at the end of the quarter. |
Nil |
SEGMENT
WISE REPORTING FOR THE YEAR ENDED 31.12.2014
(RS. IN MILLION)
|
PARTICULARS |
3 months ended 31.12.2014 |
Preceding 3 months ended 30.09.2014 |
Year to date figures for current period ended
31.12.2014 |
|
|
Unaudited |
Unaudited |
Unaudited |
|
1. Segment
Revenue |
|
|
|
|
(Net Sales / Income from each segment should be disclosed under this
head) |
|
|
|
|
(a) Segment A - Manufacturing Business |
207.138 |
236.045 |
633.663 |
|
(b) Segment B - Trading Business |
15.622 |
14.662 |
60.052 |
|
(c) Unallocated |
0.000 |
0.000 |
0.000 |
|
Total |
222.760 |
250.707 |
693.715 |
|
|
|
|
|
|
Less: Inter Segment Revenue |
0.000 |
0.000 |
0.000 |
|
|
|
|
|
|
Net Sales /
Income from Operations |
222.760 |
250.707 |
693.715 |
|
|
|
|
|
|
2. Segment Results - Profit (+) / Loss (-) before tax and interest
from each segment |
|
|
|
|
(a) Segment A - Manufacturing Business |
(6.231) |
10.876 |
12.701 |
|
(b) Segment B - Trading Business |
4.929 |
6.687 |
17.332 |
|
(c) Unallocated |
0.000 |
0.000 |
0.000 |
|
|
|
|
|
|
Total |
(1.302) |
17.563 |
30.033 |
|
|
|
|
|
|
Less: (i) Interest |
16.219 |
16.858 |
46.321 |
|
(ii) Other Un-allocable Expenditures Net off |
0.000 |
0.000 |
0.000 |
|
(iii) Unallocable Income |
0.000 |
0.000 |
0.000 |
|
|
|
|
|
|
Total Profit
before tax |
(17.521) |
0.705 |
(16.288) |
|
|
|
|
|
|
3. Capital
Employed |
|
|
|
|
(Segment Assets - Segment Liabilities) |
|
|
|
|
(a) Segment A |
159.874 |
177.040 |
159.874 |
|
(b) Segment B* |
0.000 |
0.000 |
0.000 |
|
(c) Unallocated |
0.000 |
0.000 |
0.000 |
|
|
|
|
|
|
Total |
159.874 |
177.040 |
159.874 |
* There is no long term fixed capital Employed, only short term Working
Capital is employed and this is of fluctuating nature.
NOTES:
- The above finical results were subjected to "Limited review" by the statutory Audios of the company, hove been reviewed by the Audit Committee of its meeting and token on record by the Board of Directors to its meeting held on 14th February 2015.
- The Company is currently focusing on two business segments viz. manufacturing of FIBC Bogs and Trading in Row material. The Organization structure is designed for effective management of segment while retaining focus on each one of them.
- Previous year's figures haw been rearranged /regrouped wherever necessary.
- Depreciation has been charged so per the Schedule XIV of the Companies Act, 1956. The elects of change brought out in Schedule ff of the Cowponies Act 2013 is being assessed by the Management based on technical evaluations and adjustments if any arising out of this exercise would be carried out in the lost quarter. The transitional adjustments if any arising out of this exercise will be adjusted in the Reserves and Surplus and as such will not affect the results for the above period".
- During the quarter, the company had received o letter of repudiation from one of the insurance company agonist the claim mode in the earlier yeas in respect of loss of stock. Based on the legal advice received the stand token by the insurance company is no tenable and the comport has already filed the objection/appeal agenist the said letter. The company will also be seeking appropriate remedies. The matter has been appropriately considered in the unaudited finical results.
- Deferred tax/current tax adjustments shall be made at the end of the year.
CONTINGENT
LIABILITIES:
|
PARTICULARS |
31.03.2014 (Rs.
In Million) |
31.03.2013 (Rs.
In Million) |
|
Contingent
Liabilities not provided for |
|
|
|
a. In respect of guarantees given by the Company |
51.000 |
51.000 |
|
b. Letter of credit for purchase of raw-materials |
4.989 |
8.732 |
|
c. Claims not acknowledged as debts |
0.000 |
0.000 |
|
d. Estimated amount of contracts remaining to be executed
on Capital accounts, not provided for |
0.000 |
0.000 |
|
e. Disputed amount of Central Excise |
5.345 |
26.954 |
|
f. Disputed amount on Income Tax |
15.927 |
10.589 |
|
g. Disputed TDS |
0.651 |
0.633 |
|
No provision has been made in the accounts in respect of disputed
amount of sales tax as the company has contested the case and is hopeful of
getting the verdict in its favor. Certain claims/show cause notices disputed
have neither been considered as contingent liability nor acknowledged as
claim, based on the opinion obtained, since the possibility of loss is
remote. |
||
FIXED ASSETS:
· Land
· Buildings
· Plant and Equipment
· Furniture and Fixtures
· Vehicles
· Office equipment
·
Electrical and Electronic equipment’s
CMT REPORT (Corruption, Money Laundering & Terrorism]
The Public Notice information has been collected from various sources
including but not limited to: The Courts,
1] INFORMATION ON
DESIGNATED PARTY
No exist designating subject or any of its beneficial owners,
controlling shareholders or senior officers as terrorist or terrorist
organization or whom notice had been received that all financial transactions
involving their assets have been blocked or convicted, found guilty or against
whom a judgement or order had been entered in a proceedings for violating
money-laundering, anti-corruption or bribery or international economic or
anti-terrorism sanction laws or whose assets were seized, blocked, frozen or
ordered forfeited for violation of money laundering or international
anti-terrorism laws.
2] Court Declaration :
No exist to suggest that subject is or was
the subject of any formal or informal allegations, prosecutions or other
official proceeding for making any prohibited payments or other improper
payments to government officials for engaging in prohibited transactions or
with designated parties.
3] Asset Declaration :
No records exist to suggest that the property or assets of the subject are
derived from criminal conduct or a prohibited transaction.
4] Record on Financial
Crime :
Charges or conviction
registered against subject: None
5] Records on Violation of
Anti-Corruption Laws :
Charges or investigation
registered against subject: None
6] Records on Int’l
Anti-Money Laundering Laws/Standards :
Charges or
investigation registered against subject: None
7] Criminal Records
No
available information exist that suggest that subject or any of its principals
have been formally charged or convicted by a competent governmental authority
for any financial crime or under any formal investigation by a competent
government authority for any violation of anti-corruption laws or international
anti-money laundering laws or standard.
8] Affiliation with
Government :
No record
exists to suggest that any director or indirect owners, controlling
shareholders, director, officer or employee of the company is a government
official or a family member or close business associate of a Government
official.
9] Compensation Package :
Our market
survey revealed that the amount of compensation sought by the subject is fair
and reasonable and comparable to compensation paid to others for similar
services.
10] Press Report :
No press reports / filings exists on
the subject.
CORPORATE GOVERNANCE
MIRA INFORM as part of its Due Diligence do provide comments on
Corporate Governance to identify management and governance. These factors often
have been predictive and in some cases have created vulnerabilities to credit
deterioration.
Our Governance Assessment focuses principally on the interactions
between a company’s management, its Board of Directors, Shareholders and other
financial stakeholders.
CONTRAVENTION
Subject is not known to have contravened any existing local laws,
regulations or policies that prohibit, restrict or otherwise affect the terms
and conditions that could be included in the agreement with the subject.
FOREIGN EXCHANGE RATES
|
Currency |
Unit
|
Indian Rupees |
|
US Dollar |
1 |
Rs. 63.70 |
|
|
1 |
Rs. 98.91 |
|
Euro |
1 |
Rs. 70.66 |
INFORMATION DETAILS
|
Information
Gathered by : |
SPY |
|
|
|
|
Analysis Done by
: |
DIV |
|
|
|
|
Report Prepared
by : |
PNM |
SCORE & RATING EXPLANATIONS
|
SCORE FACTORS |
RANGE |
POINTS |
|
HISTORY |
1~10 |
3 |
|
PAID-UP CAPITAL |
1~10 |
4 |
|
OPERATING SCALE |
1~10 |
3 |
|
FINANCIAL
CONDITION |
|
|
|
--BUSINESS SCALE |
1~10 |
3 |
|
--PROFITABILIRY |
1~10 |
2 |
|
--LIQUIDITY |
1~10 |
3 |
|
--LEVERAGE |
1~10 |
3 |
|
--RESERVES |
1~10 |
4 |
|
--CREDIT LINES |
1~10 |
3 |
|
--MARGINS |
-5~5 |
--- |
|
DEMERIT POINTS |
|
|
|
--BANK CHARGES |
YES/NO |
YES |
|
--LITIGATION |
YES/NO |
NO |
|
--OTHER ADVERSE INFORMATION |
YES/NO |
NO |
|
MERIT POINTS |
|
|
|
--SOLE DISTRIBUTORSHIP |
YES/NO |
NO |
|
--EXPORT ACTIVITIES |
YES/NO |
NO |
|
--AFFILIATION |
YES/NO |
YES |
|
--LISTED |
YES/NO |
YES |
|
--OTHER MERIT FACTORS |
YES/NO |
YES |
|
DEFAULTERS |
|
|
|
--RBI |
YES/NO |
NO |
|
--EPF |
YES/NO |
NO |
|
TOTAL |
|
28 |
This score serves as a reference to assess
SC’s credit risk and to set the amount of credit to be extended. It is
calculated from a composite of weighted scores obtained from each of the major
sections of this report. The assessed factors and their relative weights (as
indicated through %) are as follows:
Financial
condition (40%) Ownership
background (20%) Payment
record (10%)
Credit history
(10%) Market trend (10%) Operational size
(10%)
RATING EXPLANATIONS
|
RATING |
STATUS |
PROPOSED CREDIT LINE |
|
|
>86 |
Aaa |
Possesses an extremely sound financial base with the strongest
capability for timely payment of interest and principal sums |
Unlimited |
|
71-85 |
Aa |
Possesses adequate working capital. No caution needed for credit
transaction. It has above average (strong) capability for payment of interest
and principal sums |
Large |
|
56-70 |
A |
Financial & operational base are regarded healthy. General
unfavourable factors will not cause fatal effect. Satisfactory capability for
payment of interest and principal sums |
Fairly Large |
|
41-55 |
Ba |
Overall operation is considered normal. Capable to meet normal
commitments. |
Satisfactory |
|
26-40 |
B |
Capability to overcome financial difficulties seems comparatively
below average. |
Small |
|
11-25 |
Ca |
Adverse factors are apparent. Repayment of interest and principal sums
in default or expected to be in default upon maturity |
Limited with
full security |
|
<10 |
C |
Absolute credit risk exists. Caution needed to be exercised |
Credit not
recommended |
|
-- |
NB |
New Business |
-- |
This report is issued at your request without any
risk and responsibility on the part of MIRA INFORM PRIVATE LIMITED (MIPL) or
its officials.