MIRA INFORM REPORT
|
Report No. : |
348036 |
|
Report Date : |
07.11.2015 |
IDENTIFICATION DETAILS
|
Name : |
SALVA INDUSTRIAL SA |
|
|
|
|
Registered Office : |
Pol.,
107 Crta. Gi-636, Km 6. - Lezo - 20100 - Guipuzcoa |
|
|
|
|
Country : |
Spain |
|
|
|
|
Financials (as on) : |
2014 |
|
|
|
|
Date of Incorporation : |
25.07.1967 |
|
|
|
|
Legal Form : |
Public Company |
|
|
|
|
Line of Business : |
Manufacture of Machinery For Food, Beverage and Tobacco Processing. |
|
|
|
|
No. of Employees : |
156 |
RATING & COMMENTS
|
MIRA’s Rating : |
Ba |
|
RATING |
STATUS |
PROPOSED CREDIT LINE |
|
|
41-55 |
Ba |
Overall operation is considered normal. Capable to meet normal
commitments. |
Satisfactory |
|
Status : |
Satisfactory |
|
Payment Behaviour : |
No Complaints |
|
Litigation : |
Clear |
NOTES:
Any query related to this report can be made
on e-mail: infodept@mirainform.com
while quoting report number, name and date.
ECGC Country Risk Classification List – March 31, 2015
|
Country Name |
Previous Rating (31.12.2014) |
Current Rating (31.03.2015) |
|
Spain |
A1 |
A1 |
|
Risk Category |
ECGC
Classification |
|
Insignificant |
A1 |
|
Low |
A2 |
|
Moderate |
B1 |
|
High |
B2 |
|
Very High |
C1 |
|
Restricted |
C2 |
|
Off-credit |
D |
SPAIN - ECONOMIC OVERVIEW
After experiencing a prolonged recession in the wake of the global financial crisis that began in 2008, in 2014 Spain marked the first full year of positive economic growth in seven years, largely due to increased private consumption. At the onset of the global financial crisis Spain's GDP contracted by 3.7% in 2009, ending a 16-year growth trend, and continued contracting through most of 2013. In 2013 the government successfully shored up struggling banks - exposed to the collapse of Spain's depressed real estate and construction sectors - and in January 2014 completed an EU-funded restructuring and recapitalization program.
Until 2014, credit contraction in the private sector, fiscal austerity, and high unemployment weighed on domestic consumption and investment. The unemployment rate rose from a low of about 8% in 2007 to more than 26% in 2013, but labor reforms prompted a modest reduction to 23.7% in 2014. High unemployment strained Spain's public finances, as spending on social benefits increased while tax revenues fell. Spain’s budget deficit peaked at 11.4% of GDP in 2010, but Spain gradually reduced the deficit to just under 7% of GDP in 2013-14, slightly above the 6.5% target negotiated between Spain and the EU. Public debt has increased substantially – from 60.1% of GDP in 2010 to more than 97% in 2014.
Exports were resilient throughout the economic downturn and helped to bring Spain's current account into surplus in 2013 for the first time since 1986, where it remained in 2014. Rising labor productivity and an internal devaluation resulting from moderating labor costs and lower inflation have helped to improve foreign investor interest in the economy and positive FDI flows have been restored.
The government's efforts to implement labor, pension, health, tax, and education reforms - aimed at supporting investor sentiment - have become overshadowed by political activity in 2015 in anticipation of the national parliamentary elections in November. Spain’s 2015 budget, published in September 2014, rolls back some recently imposed taxes in advance of the elections and leaves untouched the country’s value-added tax (VAT) regime, which continues to generate significantly lower revenue than the EU average. Spain’s borrowing costs are dramatically lower since their peak in mid-2012, and despite the recent uptic in economic activity, inflation has dropped sharply, from 1.5% in 2013 to nearly flat in 2014.
|
Source
: CIA |
EXECUTIVE
SUMMARY
|
|
Name: |
SALVA
INDUSTRIAL SA |
|
NIF
/ Fiscal code: |
A20039426 |
|
Status: |
ACTIVA |
|
Incorporation
Date: |
25/07/1967 |
|
Register Data |
Register
Section 8 Sheet 1869 |
|
Last Publication in BORME: |
07/10/2015
[Reelections] |
|
Last
Published Account Deposit: |
2014 |
|
Share
Capital: |
3.000.000 |
|
|
|
|
Localization: |
Pol.
, 107 Crta. Gi-636, Km 6. - Lezo - 20100 - Guipuzcoa |
|
Telephone
- Fax - Email - Website: |
Telephone.
943449300 Email. salva@salva.es Website. www.salva.es |
|
|
|
|
Activity: |
|
|
NACE: |
2893
- Manufacture of machinery for food, beverage and tobacco processing |
|
Registered
Trademarks: |
|
|
Audited
/ Opinion: |
Si
/ |
|
Tenders
and Awards: |
8
for a total cost of 707.121,19 |
|
Subsidies: |
16
for a total cost of 2284000 |
|
Quality
Certificate: |
No |
|
|
|
|
Payment
Behaviour: |
According
to the agreed terms |
|
Prospects: |
Consolidation |
|
Industry
situation: |
Maturity |
|
|
|
|
Defaults, Legal Claims and
Insolvency Proceedings : |
|
|
|
|
|
|
|
Number |
Amount (€) |
Most Recent Entry |
|
Insolvency
Proceedings, Bankruptcy and Suspension of Payments |
|
Unpublished |
--- |
--- |
|
Defaults
on debt with Financial Institutions and Large Companies |
|
None |
--- |
--- |
|
Judicial
Claims (Notices, Executive Proceedings, Attachments, Auctions, Bad Debt) |
|
None |
0 |
--- |
|
Proceedings
heard by the Civil Court |
|
Unpublished |
0 |
--- |
|
Proceedings
heard by the Labour Court |
|
Unpublished |
0 |
--- |
|
|
|
Partners
|
|
|
|
INMASER
SA |
6.35
% |
|
|
Shares: |
3 |
|
|
Other
Links: |
5 |
|
|
No.
of Active Corporate Bodies: |
CHIEF
EXECUTIVE OFFICER 1 |
|
|
Ratios |
2014 |
2013 |
Change |
|
|
|
|
|
Guarantees: |
|
|
Properties
Registered: |
Company
NO, Administrator NO |
|
Financing
/ Guarantee Sources : |
Sources
YES, Guarantees YES |
|
|
|
|
INVESTIGATION
SUMMARY |
|
|
It
is a corporation that has been established many years ago, which gives it
sufficient experience in the sector of activities it carries out and it has a
good reputation in general amongst consulted references. Its manufacturing
has increases with a percentage of 3,20 % in 2014 in comparison to the
previous year. Atiende con normalidad los compromisos de pago. |
|
|
Interviewed
Person: |
|
|
|
|
|
Enquiry
Details
|
|
|
Business address regime: |
Property |
|
|
|
|
Identification
|
|
|
Social Denomination: |
SALVA INDUSTRIAL SA |
|
NIF / Fiscal code: |
A20039426 |
|
Corporate Status: |
ACTIVA |
|
Start of activity: |
1967 |
|
Registered Office: |
POL. , 107 CRTA. GI-636,
KM 6. |
|
Locality: |
LEZO |
|
Province: |
GUIPUZCOA |
|
Postal Code: |
20100 |
|
Telephone: |
943449300 |
|
Fax: |
943449329 |
|
Website: |
www.salva.es |
|
Email: |
salva@salva.es |
|
Interviewed Person: |
Empleado |
|
|
|
|
Activity
|
|
|
NACE: |
2893 |
|
Additional Information: |
It is dedicated to the
manufacture of products and provision of solutions for bakeries, patisserie and
hotel industries. It is integrated in Grupo SALVA. It has 24.000m2 of
manufacturing installations. |
|
Additional Address: |
POL. , 107 CRTA. GI-636,
KM 6 20100 LEZO ( GUIPUZOCA ), registered office and offices, factory, storehouse,
industrial plant in property. |
|
Import / export: |
EXPORTS |
|
Future Perspective: |
Consolidation |
|
Industry situation: |
Maturity |
|
|
|
|
Number
of Employees
|
|
|
Year |
No. of employees |
Established |
Incidentals |
|
|
|
2015 |
156 |
|
|
|
The data of employees is from the latest available financial statements in axesor. Failing that, are estimates data calculated by statistical methods
Chronological
Summary
|
|||
|
|
Year |
Act |
|
|
|
1990 |
Accounts deposit (year 1989) Dividends Payment (1) |
|
|
|
1991 |
Accounts deposit (year 1990) Adaptation to Law (1) Appointments/ Re-elections (3) Cessations/ Resignations/ Reversals (1) |
|
|
|
1992 |
Accounts deposit (year 1991) |
|
|
|
1993 |
Accounts deposit (year 1992) |
|
|
|
1994 |
Accounts deposit (year 1993) Appointments/ Re-elections (3) Increase of Capital (1) Statutory Modifications (1) |
|
|
|
1995 |
Accounts deposit (year 1994) Appointments/ Re-elections (4) Dividends Payment (1) |
|
|
|
1996 |
Accounts deposit (year 1995) Appointments/ Re-elections (1) Board Meeting (1) Cessations/ Resignations/ Reversals (1) Increase of Capital (1) |
|
|
|
1997 |
Appointments/ Re-elections (2) Board Meeting (1) Cessations/ Resignations/ Reversals (1) Dividends Payment (2) Increase of Capital (1) |
|
|
|
1998 |
Accounts deposit (year 1996, 1997) Appointments/ Re-elections (1) Board Meeting (1) Cessations/ Resignations/ Reversals (2) |
|
|
|
1999 |
Appointments/ Re-elections (3) Board Meeting (1) Cessations/ Resignations/ Reversals (1) Increase of Capital (1) |
|
|
|
2000 |
Accounts deposit (year 1998) Appointments/ Re-elections (1) Board Meeting (1) Cessations/ Resignations/ Reversals (1) |
|
|
|
2001 |
Accounts deposit (year 2000 consolidated, 1999, 2000) Appointments/ Re-elections (5) Board Meeting (1) Cessations/ Resignations/ Reversals (4) Other Concepts/ Events (1) |
|
|
|
2002 |
Accounts deposit (year 2001 consolidated, 2001) Appointments/ Re-elections (4) Board Meeting (1) Cessations/ Resignations/ Reversals (6) Change of Social Denomination (1) Other Concepts/ Events (1) |
|
|
|
2003 |
Accounts deposit (year 2002 consolidated, 2002) Appointments/ Re-elections (4) Board Meeting (1) Cessations/ Resignations/ Reversals (1) |
|
|
|
2004 |
Accounts deposit (year 2003 consolidated, 2003) Appointments/ Re-elections (3) Board Meeting (1) |
|
|
|
2005 |
Accounts deposit (year 2004 consolidated, 2004) Appointments/ Re-elections (8) Board Meeting (1) Cessations/ Resignations/ Reversals (1) |
|
|
|
2006 |
Appointments/ Re-elections (1) Board Meeting (1) Cessations/ Resignations/ Reversals (2) |
|
|
|
2007 |
Accounts deposit (year 2005 consolidated, 2006 consolidated, 2005, 2006) Appointments/ Re-elections (1) Board Meeting (1) |
|
|
|
2008 |
Accounts deposit (year 2007 consolidated, 2007) Appointments/ Re-elections (2) Board Meeting (1) |
|
|
|
2009 |
Accounts deposit (year 2008 consolidated, 2008) Appointments/ Re-elections (1) Board Meeting (1) Cessations/ Resignations/ Reversals (1) |
|
|
|
2010 |
Accounts deposit (year 2009 consolidated, 2009) Board Meeting (1) |
|
|
|
2011 |
Accounts deposit (year 2010 consolidated, 2010) Appointments/ Re-elections (2) Board Meeting (1) |
|
|
|
2012 |
Accounts deposit (year 2011) Appointments/ Re-elections (1) Board Meeting (1) Other Concepts/ Events (1) |
|
|
|
2013 |
Accounts deposit (year 2012) Appointments/ Re-elections (1) Board Meeting (1) Cessations/ Resignations/ Reversals (1) |
|
|
|
2014 |
Accounts deposit (year 2013) Appointments/ Re-elections (1) Board Meeting (1) |
|
|
|
2015 |
Accounts deposit (year 2014) Appointments/ Re-elections (1) Board Meeting (1) Change of Social address (1) Other Concepts/ Events (2) |
|
|
|
|
|
|
|
Breakdown
of Owners' Equity
|
|
|
Registered Capital: |
3.000.000 |
|
Paid up capital: |
3.000.000 |
|
|
|
|
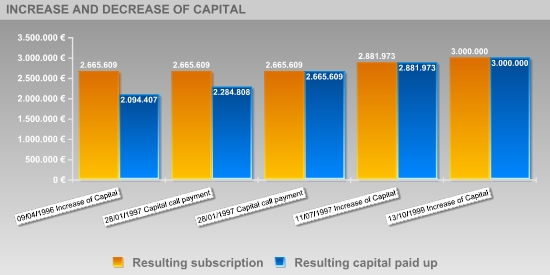
Updated
Evolution of the Subscribed and Paid-in Capital
|
|||||
|
|
|
|
|
|
|
|
|
|||||
|
|
|
|
|
|
|
|
Publishing Date |
Registration Type |
Capital Subscribed |
Paid up capital |
Underwritten result |
Disbursed Result |
|
19/09/1990 |
Capital call payment |
--- |
198.334 |
--- |
--- |
|
08/02/1994 |
Increase of Capital |
317.334 |
158.667 |
1.904.006 |
1.745.339 |
|
05/01/1995 |
Capital call payment |
--- |
158.667 |
1.904.006 |
1.904.006 |
|
09/04/1996 |
Increase of Capital |
761.603 |
190.401 |
2.665.609 |
2.094.407 |
|
28/01/1997 |
Capital call payment |
--- |
190.401 |
2.665.609 |
2.284.808 |
|
28/01/1997 |
Capital call payment |
--- |
380.801 |
2.665.609 |
2.665.609 |
|
11/07/1997 |
Increase of Capital |
216.364 |
216.364 |
2.881.973 |
2.881.973 |
|
13/10/1999 |
Increase of Capital |
118.027 |
118.027 |
3.000.000 |
3.000.000 |
|
|
|
|
|
|
|
Active
Social Bodies
|
|
|
|
|
|
Post published |
Social Body's Name |
Appointment Date |
Other Positions in this Company |
|
PRESIDENT |
LLORDES IBAÑEZ JAIME |
05/08/2013 |
14 |
|
CHIEF EXECUTIVE OFFICER |
BAÑUELOS RODENAS ARTURO |
14/04/2004 |
1 |
|
MEMBER OF THE BOARD |
INMASER SA |
30/09/2015 |
6 |
|
|
LLORDES ARRATIBEL DAVID |
05/08/2013 |
7 |
|
|
LLORDES IBAÑEZ JAIME |
05/08/2013 |
14 |
|
|
TIMESHEETS SL |
21/08/2012 |
5 |
|
|
SOCIEDAD ANONIMA DE PROMOCION Y DESARROLLO TALDE |
24/04/1997 |
1 |
|
PROXY |
SOTO DEL RIO SILVIA |
08/02/2006 |
1 |
|
|
IRAETA MUÑOZ PATXI MIKEL |
23/06/2005 |
1 |
|
|
IBARGUREN MARTINEZ PELLO |
23/06/2005 |
1 |
|
|
EGUILEOR RAMIREZ MARCIAL |
23/06/2005 |
1 |
|
|
PRIOR MURILLO FELIPE |
23/06/2005 |
1 |
|
|
LLORDES USANDIZAGA IGOR |
23/06/2005 |
1 |
|
|
LLORDES ARRATIBEL DAVID |
11/07/1995 |
7 |
|
|
LLORDES CISTERO LUIS |
14/06/1994 |
6 |
|
SECRETARY |
TUDURI ESNAL FRANCISCO |
06/11/1998 |
1 |
|
MEMBER |
ALKAIN MARTICORENA JESUS |
14/01/1994 |
1 |
|
REPRESENTATIVE |
JULIA SALAVERRIA MONFORT |
30/04/2001 |
1 |
|
ACCOUNTS' AUDITOR / HOLDER |
DELOITTE SL |
23/09/2014 |
3 |
|
|
|
|
|
Historical
Social Bodies
|
|
|
|
|
|
Social Body's Name |
Post published |
End Date |
Other Positions in this Company |
|
ALKAIN MARTIKORENA JESUS |
MEMBER |
13/12/1991 |
1 |
|
ALKAIN MARTIKORENA JESUS MARIA |
MEMBER OF THE BOARD |
13/12/1991 |
5 |
|
|
MEMBER OF THE BOARD |
09/04/1996 |
|
|
|
MEMBER OF THE BOARD |
27/09/1999 |
|
|
|
MEMBER OF THE BOARD |
23/08/2001 |
|
|
|
MEMBER |
09/04/1996 |
|
|
AMILIBIA ALARCIA VIRGINIA |
PROXY |
26/02/2002 |
1 |
|
AMILIBIA SODUPE MARIA PILAR |
PROXY |
14/06/1994 |
2 |
|
|
PROXY |
26/02/2002 |
|
|
AMILIBIA SODUPE PILAR |
PROXY |
04/07/1995 |
2 |
|
|
PROXY |
26/02/2002 |
|
|
COMAS AUDITORES CONSULTORES SL |
ACCOUNTS' AUDITOR / HOLDER |
03/02/1997 |
1 |
|
COMAS CIA AUDITORES SOC CIVIL CJC |
ACCOUNTS' AUDITOR / HOLDER |
05/07/1994 |
2 |
|
|
ACCOUNTS' AUDITOR / HOLDER |
03/02/1997 |
|
|
COOPERS AND LYBRAND SA |
ACCOUNTS' AUDITOR / HOLDER |
27/09/1999 |
1 |
|
COOPERS LYBRAND AUDITORIA Y CONSULTORIA SRL |
ACCOUNTS' AUDITOR / HOLDER |
18/08/2000 |
1 |
|
DE LAMA MIGUEL JUAN JOSE |
MEMBER OF THE BOARD |
26/02/2002 |
2 |
|
|
VICE CHAIRMAN |
26/02/2002 |
|
|
DELOITTE SL |
ACCOUNTS' AUDITOR / HOLDER |
23/09/2014 |
3 |
|
|
CONSOLIDATED ACCOUNTS' AUDITOR |
23/09/2014 |
|
|
ECHAVARRIA GIMENEZ JESUS MARIA |
PROXY |
23/06/2005 |
1 |
|
INMASER SA |
MEMBER OF THE BOARD |
06/08/2003 |
6 |
|
|
MEMBER OF THE BOARD |
05/08/2002 |
|
|
|
MEMBER OF THE BOARD |
30/09/2015 |
|
|
|
MEMBER OF THE BOARD |
04/08/2011 |
|
|
|
MEMBER OF THE BOARD |
03/08/2007 |
|
|
JUAN LUIS BONAFUENTE AVELLANER |
REPRESENTATIVE |
30/04/2001 |
1 |
|
KPMG AUDITORES SL |
ACCOUNTS' AUDITOR / HOLDER |
06/08/2008 |
4 |
|
|
CONSOLIDATED ACCOUNTS' AUDITOR |
06/08/2008 |
|
|
|
ACCOUNTS' AUDITOR / HOLDER |
04/08/2011 |
|
|
|
CONSOLIDATED ACCOUNTS' AUDITOR |
04/08/2011 |
|
|
LAMA MIGUEL JUAN JOSE |
MEMBER OF THE BOARD |
13/12/1991 |
5 |
|
|
MEMBER OF THE BOARD |
09/04/1996 |
|
|
|
MEMBER OF THE BOARD |
27/09/1999 |
|
|
|
VICE CHAIRMAN |
14/01/1994 |
|
|
|
VICE CHAIRMAN |
09/04/1996 |
|
|
LLAMA MIGUEL JUAN JOSE |
VICE CHAIRMAN |
13/12/1991 |
1 |
|
LLORDES ARRATIBEL DAVID |
PROXY |
06/06/1995 |
7 |
|
|
PROXY |
11/07/1995 |
|
|
|
MEMBER OF THE BOARD |
05/08/2013 |
|
|
|
MEMBER OF THE BOARD |
09/09/2009 |
|
|
|
MEMBER OF THE BOARD |
17/08/2005 |
|
|
LLORDES CISTERO JOSE |
MEMBER OF THE BOARD |
14/01/1994 |
6 |
|
|
MEMBER OF THE BOARD |
06/11/1998 |
|
|
|
MEMBER OF THE BOARD |
23/08/2001 |
|
|
|
PROXY |
14/03/2006 |
|
|
|
SECRETARY |
14/01/1994 |
|
|
|
SECRETARY |
06/11/1998 |
|
|
LLORDES CISTERO LUIS |
MEMBER OF THE BOARD |
09/04/1996 |
6 |
|
|
MEMBER |
14/01/1994 |
|
|
|
MEMBER |
09/04/1996 |
|
|
|
MEMBER OF THE BOARD |
27/09/1999 |
|
|
|
MEMBER OF THE BOARD |
26/02/2002 |
|
|
LLORDES CISTERO LUIS RAMON |
PROXY |
14/03/2006 |
1 |
|
LLORDES CREUS JUAN |
PROXY |
09/03/2009 |
1 |
|
LLORDES IBAÑEZ JAIME |
MEMBER OF THE BOARD |
14/01/1994 |
14 |
|
|
MEMBER OF THE BOARD |
06/11/1998 |
|
|
|
MEMBER OF THE BOARD |
23/08/2001 |
|
|
|
MEMBER OF THE BOARD |
17/08/2005 |
|
|
|
MEMBER OF THE BOARD |
09/09/2009 |
|
|
|
MEMBER OF THE BOARD |
05/08/2013 |
|
|
|
PROXY |
04/07/1995 |
|
|
|
PROXY |
09/03/2009 |
|
|
|
PRESIDENT |
14/01/1994 |
|
|
|
PRESIDENT |
23/08/2001 |
|
|
|
PRESIDENT |
09/09/2009 |
|
|
|
PRESIDENT |
05/08/2013 |
|
|
LOYOLA ZABALA ISAAC |
PROXY |
03/10/2003 |
1 |
|
PRICE WATERHOUSE COOPERS AUDITORES SL |
ACCOUNTS' AUDITOR / HOLDER |
23/08/2001 |
9 |
|
|
CONSOLIDATED ACCOUNTS' AUDITOR |
23/08/2001 |
|
|
|
ACCOUNTS' AUDITOR / HOLDER |
06/08/2003 |
|
|
|
CONSOLIDATED ACCOUNTS' AUDITOR |
06/08/2003 |
|
|
|
CONSOLIDATED ACCOUNTS' AUDITOR |
23/06/2005 |
|
|
|
ACCOUNTS' AUDITOR / HOLDER |
17/08/2004 |
|
|
|
CONSOLIDATED ACCOUNTS' AUDITOR |
17/08/2004 |
|
|
|
ACCOUNTS' AUDITOR / HOLDER |
12/09/2002 |
|
|
|
CONSOLIDATED ACCOUNTS' AUDITOR |
17/08/2005 |
|
|
SOCIEDAD ANONIMA PROMOCION DESARROLLO TALDE SA |
MEMBER OF THE BOARD |
25/02/2002 |
1 |
|
TALDE PROMOCION Y DESARROLLO S.C.R S.A |
MEMBER OF THE BOARD |
30/04/2001 |
1 |
|
TIMESHEETS SL |
MEMBER OF THE BOARD |
06/08/2008 |
5 |
|
|
MEMBER OF THE BOARD |
21/08/2012 |
|
|
|
MEMBER OF THE BOARD |
05/08/2002 |
|
|
|
MEMBER OF THE BOARD |
05/08/2004 |
|
|
VICENTE ALVARADO MARIA LUCIA |
PROXY |
08/02/2006 |
1 |
|
|
|
|
|
Executive
board
|
||
|
|
|
|
|
Post |
NIF |
Name |
|
FINANCIAL DIRECTOR |
|
DAVID LLORDES ARRATIBEL |
|
MANAGING DIRECTOR |
|
ARTURO BAÑUELOS RODENAS |
|
|
|
|
Defaults,
Legal Claims and Insolvency Proceedings
|
|
|
|
|
Section enabling assessment of the degree of compliance of the company
queried with its payment obligations. It provides information on the existence and
nature of all stages of Insolvency and Legal Proceedings published with
reference to the Company in the country's various Official Bulletins and
national newspapers, as well Defaults Registered in the main national credit
bureaus (ASNEF Industrial and RAI ).
>
Summary
Chronological summary
|
|
|
Number of Publications |
Amount (_) |
Start date |
End date |
|
Insolvency
Proceedings, Bankruptcy and Suspension of Payments |
|
Unpublished |
--- |
--- |
--- |
|
Request/Declaration |
|
0 |
--- |
date |
|
|
Proceedings |
|
--- |
--- |
|
--- |
|
Resolution |
|
--- |
--- |
|
--- |
|
Defaults
on debt with Financial Institutions and Large Companies |
Bank
and Commercial Delinquency |
None |
0 |
|
|
|
Status:
Friendly |
|
--- |
|
|
|
|
Status:
Pre-Litigation |
|
--- |
|
|
|
|
Status:
Litigation |
|
--- |
|
|
|
|
Status:
Non-performing |
|
--- |
|
|
|
|
Status:
insolvency proceedings, bankruptcy and suspension of payments |
|
--- |
|
|
|
|
Other
status |
|
--- |
|
|
|
|
Legal
and Administrative Proceedings |
|
Unpublished |
--- |
|
|
|
Notices
of defaults and enforcement |
|
--- |
--- |
|
--- |
|
Seizures |
|
--- |
--- |
|
--- |
|
Auctions |
|
--- |
--- |
|
--- |
|
Declarations
of insolvency and bad debt |
|
--- |
--- |
|
--- |
|
Proceedings
heard by the Civil Court |
|
Unpublished |
--- |
|
|
|
Proceedings
heard by the Labour Court |
|
Unpublished |
--- |
|
|
>
Details
>
Basis for scoring
|
Positive Factors |
Adverse Factors |
|
No judicial claims have been detected in the Official Gazettes, regarding
any Entity's outstanding debts with the Tax Bureau or Social Security
administrations, as submitted by Courts of the various court jurisdictions. No irregular payment performance has been detected based on
information obtained from credit bureaus. Significant level of financial autonomy. The asset is financed mostly
with equity and financing with maturity exceeding one year, providing a solid
financial structure. The current debt represents a 41.04of the financial structure. In
principle, a decrease in this ratio would indicate an improvement in the
short-term financial situation. It has financial profitability.. SALVA INDUSTRIAL SA obtains financial
return as a consequence of an investment in its own resources which, a
priori, might improve its financial and economic situation. |
Debts assumed by the company based on the volume of its own resources
have increased in the previous financial year. Limited capacity to generate cash and cash equivalents through operating
income. In principle, a decrease in this ratio would indicate a worsening in
the Company´s financial situation. Possible difficulty accessing financing. Uncertainties about economic
recovery will hinder access to credit for new projects or for obtaining the
liquidity necessary for short-term needs. |
The
information contained in the latest annual statements has led to a Scoring
review for the company.
Probability of default
|
> Estimated Probability
of Default for the next 12 months: 1.281 %
|
Sector
in which comparison is carried out: 289 Manufacture
of other special-purpose machinery |
|
|
Relative
Position:
|
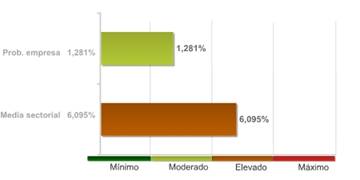
The company's comparative analysis with the rest of the companies that comprise the sector, shows the company holds a better position with regard to the probability of non-compliance.
The 89.00% of the companies of the sector SALVA INDUSTRIAL SA belongs to show a higher probability of non-compliance.
The probability of the company's non-compliance with its payment obligations within deadlines estimated by our qualifications models is 1.281%.
In the event they fail to comply with the payment, the seriousness of the loss will depend on factors such as the promptness of the commencement of the charging management, the existence of executive documents which match the credit or the existence of guarantees and free debt assets under the name of the debtor. Therefore, the probability of non-compliance should not be solely interpreted as the total loss of the owed amount.
Result of query submitted to the R.A.I.
(Spanish Bad Debt Register) on
|
|
Summary
of Judicial Claims |
|
|
|
|
|
|
|
|
||
|
|
|
No
se han publicado |
|
|
|
|
No
se han publicado |
|
|
|
|
||
|
|
|
No
se han publicado |
|
|
|
|
No
se han publicado |
|
|
|
|
No
se han publicado |
|
|
|
|
No
se han publicado |
|
|
|
|
||
|
|
|
No
se han publicado |
|
|
|
|
No
se han publicado |
|
|
|
|
||
|
|
|
No
se han publicado |
|
|
Link
List
|
|
BELONGS TO THE
ADMINISTRATION BOARD OF: |
1 Entities |
|
HAS IN ITS ADMINISTRATION
BOARD TO: |
2 Entities |
|
IS RELATED WITH: |
2 Entities |
|
PARTICIPATES IN: |
3 Entities |
|
SHAREHOLDERS: |
1 Entities |
> Shareholders
|
Relationship |
Entity |
Province |
Shareholding stake |
|
SHAREHOLDERS |
INMASER SA |
GUIPUZCOA |
6.35 |
|
PARTICIPATES IN |
DICOEL SL |
BARCELONA |
24 |
|
|
SALVA FRANCE SAS (FRANCIA) |
|
100 |
|
|
SALVA MIDDLE EAST FZE |
|
100 |
> Other relationships
|
Relationship |
Entity |
Province |
Shareholding stake |
|
IS RELATED WITH |
| | |
|
|
|
|
TALDE GESTION S.G.E.C.R.
SOCIEDAD ANONIMA |
VIZCAYA |
13.5 |
|
|
TIMESHEETS SL |
GUIPUZCOA |
|
|
HAS IN ITS ADMINISTRATION
BOARD TO |
TIMESHEETS SL |
GUIPUZCOA |
|
|
|
INMASER SA |
GUIPUZCOA |
|
|
BELONGS TO THE
ADMINISTRATION BOARD OF |
CONSORCIO INTERNACIONAL DE
CONSULTORIA INGENIERIA Y TECNOLOGIA SL |
BARCELONA |
|
|
|
|
|
|
Turnover
|
|
|
Total Sales 2014 |
28.744.613,45 |
The sales data is from the
latest available financial statements in axesor. Failing that, are estimates data
calculated by statistical methods.
Financial
Accounts and Balance Sheets
|
|
Ejercicio |
Tipo
de Cuentas Anuales |
Fecha
Presentacion |
|
2014 |
Normales |
October
2015 |
|
2013 |
Normales |
September
2014 |
|
2012 |
Normales |
September
2013 |
|
2011 |
Normales |
September
2012 |
|
2010 |
Consolidadas |
October
2011 |
|
2010 |
Normales |
October
2011 |
|
2009 |
Consolidadas |
December
2010 |
|
2009 |
Normales |
September
2010 |
|
2008 |
Consolidadas |
November
2009 |
|
2008 |
Normales |
November
2009 |
|
2007 |
Consolidadas |
November
2008 |
|
2007 |
Normales |
November
2008 |
|
2006 |
Consolidadas |
September
2007 |
|
2006 |
Normales |
September
2007 |
|
2005 |
Consolidadas |
September
2007 |
|
2005 |
Normales |
May
2007 |
|
2004 |
Consolidadas |
December
2005 |
|
2004 |
Normales |
October
2005 |
|
2003 |
Consolidadas |
October
2004 |
|
2003 |
Normales |
October
2004 |
|
2002 |
Consolidadas |
October
2003 |
|
2002 |
Normales |
October
2003 |
|
2001 |
Consolidadas |
September
2002 |
|
2001 |
Normales |
September
2002 |
|
2000 |
Consolidadas |
November
2001 |
|
2000 |
Normales |
November
2001 |
|
1999 |
Normales |
December
2000 |
|
1998 |
Normales |
December
1999 |
|
1997 |
Normales |
November
1998 |
|
1996 |
Normales |
November
1998 |
|
1995 |
Normales |
October
1996 |
|
1994 |
Normales |
October
1995 |
|
1993 |
Normales |
October
1994 |
|
1992 |
Normales |
July
1993 |
|
1991 |
Normales |
July
1992 |
|
1990 |
Normales |
July
1991 |
|
1989 |
Normales |
September
1990 |
The data in the report
regarding the last Company Accounts submitted by the company is taken from the
TRADE REGISTER serving the region in which the company's address is located
31/12/2014
> Normal format Balance in accordance with the New
Accounting Plan 2007
Information corresponding
to the fiscal year 2014 2013 2012 2011 2010 is taken
from information submitted to the TRADE REGISTER. Data corresponding to fiscal
years before 2014 2013 2012 2011 2010 has been
compiled based on the equivalence criteria stipulated in Act JUS/206/2009.
Where the provisions of the Act did not establish relevant equivalence criteria,
such criteria using its own methodology. To view details on the methodology.
|
|
ORIGINAL |
ORIGINAL |
ORIGINAL |
ORIGINAL |
ORIGINAL |
|
|
Assets |
2014 |
2013 |
2012 |
2011 |
2010 |
|
|
A)
NON-CURRENT ASSETS: 11000 |
13.942.260,00 |
13.625.136,00 |
14.123.927,00 |
14.087.000,00 |
14.684.000,00 |
|
|
I. Intangible fixed assets : 11100 |
2.154.963,00 |
1.750.121,00 |
1.513.650,00 |
1.113.000,00 |
1.061.000,00 |
|
|
1. Development: 11110 |
2.153.697,00 |
1.746.471,00 |
1.505.733,00 |
1.099.000,00 |
1.045.000,00 |
|
|
2. Concessions: 11120 |
0,00 |
0,00 |
0,00 |
0,00 |
0,00 |
|
|
3. Patents, licencing, trade marks and
similar: 11130 |
0,00 |
0,00 |
0,00 |
0,00 |
0,00 |
|
|
4. Goodwill: 11140 |
0,00 |
0,00 |
0,00 |
0,00 |
0,00 |
|
|
5. IT applications: 11150 |
1.267,00 |
3.650,00 |
7.917,00 |
14.000,00 |
16.000,00 |
|
|
6. Investigation: 11160 |
0,00 |
0,00 |
0,00 |
0,00 |
0,00 |
|
|
7. Intellectual property: 11180 |
0,00 |
0,00 |
0,00 |
0,00 |
0,00 |
|
|
8. Greenhouse gas emission allowance:
11190 |
0,00 |
0,00 |
0,00 |
0,00 |
0,00 |
|
|
9. Other intangible fixed assets. :
11170 |
0,00 |
0,00 |
0,00 |
0,00 |
0,00 |
|
|
II. Tangible fixed assets : 11200 |
6.072.844,00 |
6.462.316,00 |
6.991.319,00 |
7.568.000,00 |
7.962.000,00 |
|
|
1. Land and buildings: 11210 |
5.496.645,00 |
5.656.937,00 |
5.804.892,00 |
5.942.000,00 |
5.927.000,00 |
|
|
2. Technical installations and other
tangible fixed assets: 11220 |
576.199,00 |
805.379,00 |
1.186.427,00 |
1.626.000,00 |
2.019.000,00 |
|
|
3. Tangible asset in progress and
advances: 11230 |
0,00 |
0,00 |
0,00 |
0,00 |
16.000,00 |
|
|
III. Real estate investment: 11300 |
50.450,00 |
0,00 |
0,00 |
0,00 |
0,00 |
|
|
1. Land: 11310 |
0,00 |
0,00 |
0,00 |
0,00 |
0,00 |
|
|
2. Buildings: 11320 |
50.450,00 |
0,00 |
0,00 |
0,00 |
0,00 |
|
|
IV. Long-term investments in Group companies and associates :
11400 |
536.106,00 |
536.106,00 |
514.106,00 |
514.000,00 |
514.000,00 |
|
|
1. Equity instruments: 11410 |
536.106,00 |
536.106,00 |
514.106,00 |
514.000,00 |
514.000,00 |
|
|
2. Credits to businesses: 11420 |
0,00 |
0,00 |
0,00 |
0,00 |
0,00 |
|
|
3. Debt securities: 11430 |
0,00 |
0,00 |
0,00 |
0,00 |
0,00 |
|
|
4. Derivatives : 11440 |
0,00 |
0,00 |
0,00 |
0,00 |
0,00 |
|
|
5. Other financial assets : 11450 |
0,00 |
0,00 |
0,00 |
0,00 |
0,00 |
|
|
6. Other investments: 11460 |
0,00 |
0,00 |
0,00 |
0,00 |
0,00 |
|
|
V. Long-term financial investments: 11500 |
88.720,00 |
66.419,00 |
54.544,00 |
57.000,00 |
66.000,00 |
|
|
1. Equity instruments: 11510 |
0,00 |
0,00 |
0,00 |
0,00 |
0,00 |
|
|
2. Credits to third parties : 11520 |
0,00 |
0,00 |
0,00 |
0,00 |
0,00 |
|
|
3. Debt securities: 11530 |
0,00 |
0,00 |
0,00 |
0,00 |
0,00 |
|
|
4. Derivatives : 11540 |
0,00 |
0,00 |
0,00 |
0,00 |
0,00 |
|
|
5. Other financial assets : 11550 |
88.720,00 |
66.419,00 |
54.544,00 |
57.000,00 |
66.000,00 |
|
|
6. Other investments: 11560 |
0,00 |
0,00 |
0,00 |
0,00 |
0,00 |
|
|
VI. Assets for deferred tax : 11600 |
3.075.510,00 |
3.201.428,00 |
3.615.012,00 |
3.686.000,00 |
3.662.000,00 |
|
|
VII. Non-current trade debts : 11700 |
1.963.666,00 |
1.608.745,00 |
1.435.296,00 |
1.149.000,00 |
1.419.000,00 |
|
|
B)
CURRENT ASSETS: 12000 |
15.575.090,00 |
14.767.886,00 |
14.351.735,00 |
15.168.000,00 |
15.112.000,00 |
|
|
I. Non-current assets held for sale : 12100 |
0,00 |
0,00 |
0,00 |
0,00 |
0,00 |
|
|
II. Stocks: 12200 |
6.632.020,00 |
6.743.951,00 |
6.868.943,00 |
7.128.000,00 |
7.143.000,00 |
|
|
1. Commercial: 12210 |
1.649.451,00 |
1.712.421,00 |
1.598.456,00 |
1.674.000,00 |
1.380.000,00 |
|
|
2. Primary material and other supplies:
12220 |
2.082.039,00 |
2.011.305,00 |
2.059.205,00 |
2.078.000,00 |
1.926.000,00 |
|
|
3. Work in progress: 12230 |
1.508.319,00 |
1.666.414,00 |
1.788.025,00 |
1.692.000,00 |
1.919.000,00 |
|
|
a) Of long-term
production cycle : 12231 |
0,00 |
0,00 |
0,00 |
0,00 |
0,00 |
|
|
b) Of short-term
production cycle : 12232 |
1.508.319,00 |
1.666.414,00 |
1.788.025,00 |
1.692.000,00 |
1.919.000,00 |
|
|
4. Finished goods: 12240 |
1.392.210,00 |
1.353.811,00 |
1.423.256,00 |
1.684.000,00 |
1.918.000,00 |
|
|
a) Of long-term
production cycle : 12241 |
0,00 |
0,00 |
0,00 |
0,00 |
0,00 |
|
|
b) Of short-term
production cycle : 12242 |
1.392.210,00 |
1.353.811,00 |
1.423.256,00 |
1.684.000,00 |
1.918.000,00 |
|
|
5. By-products, residues and recycled
materials: 12250 |
0,00 |
0,00 |
0,00 |
0,00 |
0,00 |
|
|
6. Advances to suppliers: 12260 |
0,00 |
0,00 |
0,00 |
0,00 |
0,00 |
|
|
III. Trade debtors and others receivable accounts: 12300 |
8.333.356,00 |
7.594.919,00 |
7.145.546,00 |
7.692.000,00 |
7.686.000,00 |
|
|
1. Trade debtors / accounts receivable:
12310 |
8.025.535,00 |
7.113.550,00 |
6.792.827,00 |
7.188.000,00 |
7.079.000,00 |
|
|
a) Long-term
receivables from sales and services supplied : 12311 |
0,00 |
0,00 |
0,00 |
0,00 |
0,00 |
|
|
b) Customers for
sales and provisions of services : 12312 |
8.025.535,00 |
7.113.550,00 |
6.792.827,00 |
7.188.000,00 |
7.079.000,00 |
|
|
2. Customers, Group companies and
associates : 12320 |
0,00 |
4.384,00 |
17.000,00 |
8.000,00 |
248.000,00 |
|
|
3. Other accounts receivable: 12330 |
0,00 |
0,00 |
0,00 |
0,00 |
0,00 |
|
|
4. Personnel: 12340 |
0,00 |
0,00 |
0,00 |
0,00 |
0,00 |
|
|
5. Assets for deferred tax: 12350 |
0,00 |
0,00 |
0,00 |
0,00 |
0,00 |
|
|
6. Other debtors, including tax and social
security: 12360 |
307.822,00 |
476.985,00 |
335.719,00 |
496.000,00 |
359.000,00 |
|
|
7. Called up share capital: 12370 |
0,00 |
0,00 |
0,00 |
0,00 |
0,00 |
|
|
IV. Short-term investments in Group companies and associates:
12400 |
0,00 |
0,00 |
0,00 |
0,00 |
0,00 |
|
|
1. Equity instruments: 12410 |
0,00 |
0,00 |
0,00 |
0,00 |
0,00 |
|
|
2. Credits to businesses: 12420 |
0,00 |
0,00 |
0,00 |
0,00 |
0,00 |
|
|
3. Debt securities: 12430 |
0,00 |
0,00 |
0,00 |
0,00 |
0,00 |
|
|
4. Derivatives : 12440 |
0,00 |
0,00 |
0,00 |
0,00 |
0,00 |
|
|
5. Other financial assets : 12450 |
0,00 |
0,00 |
0,00 |
0,00 |
0,00 |
|
|
6. Other investments: 12460 |
0,00 |
0,00 |
0,00 |
0,00 |
0,00 |
|
|
V. Short-term financial investments : 12500 |
138.864,00 |
171.657,00 |
202.103,00 |
199.000,00 |
272.000,00 |
|
|
1. Equity instruments: 12510 |
0,00 |
0,00 |
0,00 |
0,00 |
0,00 |
|
|
2. Credits to businesses: 12520 |
0,00 |
0,00 |
10.750,00 |
5.000,00 |
0,00 |
|
|
3. Debt securities: 12530 |
0,00 |
0,00 |
0,00 |
0,00 |
0,00 |
|
|
4. Derivatives : 12540 |
0,00 |
0,00 |
0,00 |
0,00 |
0,00 |
|
|
5. Other financial assets : 12550 |
138.864,00 |
171.657,00 |
191.353,00 |
194.000,00 |
272.000,00 |
|
|
6. Other investments: 12560 |
0,00 |
0,00 |
0,00 |
0,00 |
0,00 |
|
|
VI. Short-term accruals: 12600 |
44.022,00 |
85.875,00 |
23.044,00 |
57.000,00 |
0,00 |
|
|
VII. Cash and other equivalent liquid assets : 12700 |
426.827,00 |
171.485,00 |
112.099,00 |
92.000,00 |
11.000,00 |
|
|
1. Treasury: 12710 |
426.827,00 |
171.485,00 |
112.099,00 |
92.000,00 |
11.000,00 |
|
|
2. Other equivalent liquid assets:
12720 |
0,00 |
0,00 |
0,00 |
0,00 |
0,00 |
|
|
TOTAL
ASSETS (A + B) : 10000 |
29.517.349,00 |
28.393.022,00 |
28.475.662,00 |
29.255.000,00 |
29.796.000,00 |
|
|
|
ORIGINAL |
ORIGINAL |
ORIGINAL |
ORIGINAL |
ORIGINAL |
|
|
Liabilities and Net Worth |
2014 |
2013 |
2012 |
2011 |
2010 |
|
|
A)
NET WORTH: 20000 |
13.400.518,00 |
13.628.872,00 |
13.218.512,00 |
13.970.000,00 |
14.216.000,00 |
|
|
A-1) Shareholders' equity: 21000 |
13.069.981,00 |
13.346.660,00 |
12.877.837,00 |
13.616.000,00 |
13.673.000,00 |
|
|
I. Capital: 21100 |
3.000.000,00 |
3.000.000,00 |
3.000.000,00 |
3.000.000,00 |
3.000.000,00 |
|
|
1. Registered capital : 21110 |
3.000.000,00 |
3.000.000,00 |
3.000.000,00 |
3.000.000,00 |
3.000.000,00 |
|
|
2. (Uncalled capital): 21120 |
0,00 |
0,00 |
0,00 |
0,00 |
0,00 |
|
|
II. Share premium: 21200 |
0,00 |
0,00 |
0,00 |
0,00 |
0,00 |
|
|
III. Reserves: 21300 |
9.746.660,00 |
9.627.837,00 |
10.616.304,00 |
10.470.000,00 |
10.469.000,00 |
|
|
1. Legal and statutory: 21310 |
601.400,00 |
601.400,00 |
600.000,00 |
601.000,00 |
600.000,00 |
|
|
2. Other reserves: 21320 |
9.145.260,00 |
9.026.437,00 |
10.016.304,00 |
9.869.000,00 |
9.869.000,00 |
|
|
3. Revaluation reserves: 21330 |
0,00 |
0,00 |
0,00 |
0,00 |
0,00 |
|
|
IV. (Common stock equity): 21400 |
0,00 |
0,00 |
0,00 |
0,00 |
0,00 |
|
|
V. Results from previous periods: 21500 |
0,00 |
0,00 |
0,00 |
0,00 |
0,00 |
|
|
1. Brought forward: 21510 |
0,00 |
0,00 |
0,00 |
0,00 |
0,00 |
|
|
2. (Negative results from previous
periods): 21520 |
0,00 |
0,00 |
0,00 |
0,00 |
0,00 |
|
|
VI. Other shareholders' contributions: 21600 |
0,00 |
0,00 |
0,00 |
0,00 |
0,00 |
|
|
VII. Result of the period: 21700 |
323.321,00 |
718.823,00 |
-738.467,00 |
146.000,00 |
204.000,00 |
|
|
VIII. (Interim dividend): 21800 |
0,00 |
0,00 |
0,00 |
0,00 |
0,00 |
|
|
IX. Other net worth instruments: 21900 |
0,00 |
0,00 |
0,00 |
0,00 |
0,00 |
|
|
A-2) Adjustments due to changes in value: 22000 |
0,00 |
0,00 |
0,00 |
0,00 |
0,00 |
|
|
I. Financial assets held for sale: 22100 |
0,00 |
0,00 |
0,00 |
0,00 |
0,00 |
|
|
II. Hedge operations: 22200 |
0,00 |
0,00 |
0,00 |
0,00 |
0,00 |
|
|
III. Linked non-current assets and liabilities held for sale :
22300 |
0,00 |
0,00 |
0,00 |
0,00 |
0,00 |
|
|
IV. Exchange rate difference: 22400 |
0,00 |
0,00 |
0,00 |
0,00 |
0,00 |
|
|
V. Other: 22500 |
0,00 |
0,00 |
0,00 |
0,00 |
0,00 |
|
|
A-3) Received subsidies, donations and legacies: 23000 |
330.537,00 |
282.212,00 |
340.675,00 |
354.000,00 |
543.000,00 |
|
|
B)
NON-CURRENT LIABILITIES: 31000 |
4.002.717,00 |
4.006.070,00 |
3.935.284,00 |
3.031.000,00 |
3.852.000,00 |
|
|
I. Long-term provisions: 31100 |
50.121,00 |
108.781,00 |
95.323,00 |
77.000,00 |
248.000,00 |
|
|
1. Long-term employee benefits liability:
31110 |
50.121,00 |
108.781,00 |
95.323,00 |
0,00 |
0,00 |
|
|
2. Environmental actions: 31120 |
0,00 |
0,00 |
0,00 |
0,00 |
0,00 |
|
|
3. Restructuring provisions: 31130 |
0,00 |
0,00 |
0,00 |
0,00 |
0,00 |
|
|
4. Other provisions: 31140 |
0,00 |
0,00 |
0,00 |
77.000,00 |
248.000,00 |
|
|
II Long-term creditors: 31200 |
3.738.551,00 |
3.702.037,00 |
3.621.973,00 |
2.731.000,00 |
3.307.000,00 |
|
|
1. Liabilities and other securities:
31210 |
0,00 |
0,00 |
0,00 |
0,00 |
0,00 |
|
|
2. Amounts owed to credit institutions:
31220 |
2.781.326,00 |
2.754.161,00 |
2.398.182,00 |
1.696.000,00 |
2.132.000,00 |
|
|
3. Creditors from financial leasing:
31230 |
0,00 |
0,00 |
0,00 |
0,00 |
0,00 |
|
|
4. Derivatives : 31240 |
0,00 |
0,00 |
0,00 |
0,00 |
0,00 |
|
|
5. Other financial liabilities :
31250 |
957.225,00 |
947.876,00 |
1.223.791,00 |
1.035.000,00 |
1.175.000,00 |
|
|
III. Long-term debts with Group companies and associates:
31300 |
0,00 |
0,00 |
0,00 |
0,00 |
0,00 |
|
|
IV. Liabilities for deferred tax: 31400 |
214.045,00 |
195.252,00 |
217.988,00 |
223.000,00 |
297.000,00 |
|
|
V. Long-term accruals: 31500 |
0,00 |
0,00 |
0,00 |
0,00 |
0,00 |
|
|
VI. Non-current trade creditors : 31600 |
0,00 |
0,00 |
0,00 |
0,00 |
0,00 |
|
|
VII. Special long-term debts : 31700 |
0,00 |
0,00 |
0,00 |
0,00 |
0,00 |
|
|
C)
CURRENT LIABILITIES : 32000 |
12.114.115,00 |
10.758.080,00 |
11.321.867,00 |
12.254.000,00 |
11.728.000,00 |
|
|
I. Liabilities linked to non-current assets held for sale:
32100 |
0,00 |
0,00 |
0,00 |
0,00 |
0,00 |
|
|
II. Short-term provisions: 32200 |
342.494,00 |
389.931,00 |
380.163,00 |
397.000,00 |
294.000,00 |
|
|
1. Provisions from greenhouse gas emission
allowance: 32210 |
0,00 |
0,00 |
0,00 |
0,00 |
0,00 |
|
|
2. Other provisions: 32220 |
342.494,00 |
389.931,00 |
0,00 |
0,00 |
0,00 |
|
|
III. Short-term creditors : 32300 |
6.287.492,00 |
5.277.940,00 |
6.133.757,00 |
6.426.000,00 |
5.127.000,00 |
|
|
1. Liabilities and other securities:
32310 |
0,00 |
0,00 |
0,00 |
0,00 |
0,00 |
|
|
2. Amounts owed to credit institutions:
32320 |
6.244.089,00 |
5.241.506,00 |
6.063.057,00 |
6.220.000,00 |
4.874.000,00 |
|
|
3. Creditors from financial leasing:
32330 |
0,00 |
0,00 |
0,00 |
0,00 |
0,00 |
|
|
4. Derivatives : 32340 |
0,00 |
0,00 |
0,00 |
0,00 |
0,00 |
|
|
5. Other financial liabilities :
32350 |
43.404,00 |
36.434,00 |
70.700,00 |
206.000,00 |
253.000,00 |
|
|
IV. Short-term debts with Group companies and associates:
32400 |
0,00 |
0,00 |
436.778,00 |
0,00 |
0,00 |
|
|
V. Trade creditors and other accounts payable: 32500 |
5.484.128,00 |
4.886.087,00 |
4.329.869,00 |
5.431.000,00 |
6.307.000,00 |
|
|
1. Suppliers: 32510 |
4.121.589,00 |
3.877.559,00 |
3.435.986,00 |
4.481.000,00 |
5.192.000,00 |
|
|
a) Long-term debts :
32511 |
0,00 |
0,00 |
0,00 |
0,00 |
0,00 |
|
|
b) Short-term debts :
32512 |
4.121.589,00 |
3.877.559,00 |
3.435.986,00 |
4.481.000,00 |
5.192.000,00 |
|
|
2. Suppliers, Group companies and
associates: 32520 |
494.506,00 |
283.855,00 |
245.814,00 |
485.000,00 |
589.000,00 |
|
|
3. Other creditors: 32530 |
487.655,00 |
168.958,00 |
136.438,00 |
125.000,00 |
199.000,00 |
|
|
4. Personnel (remuneration due):
32540 |
49.140,00 |
226.281,00 |
81.249,00 |
47.000,00 |
60.000,00 |
|
|
5. Liabilities for current tax:
32550 |
0,00 |
0,00 |
0,00 |
0,00 |
0,00 |
|
|
6. Other accounts payable to Public
Administrations.: 32560 |
331.238,00 |
329.435,00 |
430.381,00 |
293.000,00 |
267.000,00 |
|
|
7. Advances from clients: 32570 |
0,00 |
0,00 |
0,00 |
0,00 |
0,00 |
|
|
VI. Short-term accruals: 32600 |
0,00 |
204.122,00 |
41.300,00 |
0,00 |
0,00 |
|
|
VII. Special short-term debts : 32700 |
0,00 |
0,00 |
0,00 |
0,00 |
0,00 |
|
|
TOTAL
NET WORTH AND LIABILITIES (A + B + C) : 30000 |
29.517.349,00 |
28.393.022,00 |
28.475.662,00 |
29.255.000,00 |
29.796.000,00 |
|
|
|
ORIGINAL |
ORIGINAL |
ORIGINAL |
ORIGINAL |
ORIGINAL |
|
|
Profit and Loss |
2014 |
2013 |
2012 |
2011 |
2010 |
|
|
1.
Net turnover: 40100 |
28.744.613,00 |
27.853.621,00 |
25.202.485,00 |
26.129.000,00 |
25.129.000,00 |
|
|
a) Sales: 40110 |
28.316.721,00 |
27.409.915,00 |
24.826.152,00 |
25.782.000,00 |
24.851.000,00 |
|
|
b) Rendering of services: 40120 |
427.892,00 |
443.706,00 |
376.333,00 |
347.000,00 |
278.000,00 |
|
|
c) Income of financial nature of holding companies: 40130 |
0,00 |
0,00 |
0,00 |
0,00 |
0,00 |
|
|
2.
Changes in stocks of finished goods and work in progress: 40200 |
-155.134,00 |
-191.056,00 |
-165.477,00 |
-461.000,00 |
-1.033.000,00 |
|
|
3.
Works carried out by the company for its assets: 40300 |
644.891,00 |
479.016,00 |
700.000,00 |
383.000,00 |
305.000,00 |
|
|
4.
Supplies : 40400 |
-12.887.492,00 |
-11.773.391,00 |
-11.164.473,00 |
-11.202.000,00 |
-10.080.000,00 |
|
|
a) Stock consumption: 40410 |
-5.887.714,00 |
-5.095.545,00 |
-5.359.647,00 |
-5.143.000,00 |
-4.573.000,00 |
|
|
b) Consumption of raw materials and miscellaneous consumable ones:
40420 |
-5.428.683,00 |
-5.338.790,00 |
-4.704.496,00 |
-4.843.000,00 |
-4.414.000,00 |
|
|
c) Works carried out by other companies: 40430 |
-1.571.094,00 |
-1.339.056,00 |
-1.100.330,00 |
-1.216.000,00 |
-1.093.000,00 |
|
|
d) Impairment of stock, primary material and other supplies:
40440 |
0,00 |
0,00 |
0,00 |
0,00 |
0,00 |
|
|
5.
Other operating income: 40500 |
371.199,00 |
377.808,00 |
293.382,00 |
825.000,00 |
825.000,00 |
|
|
a) Auxiliary income and other from current management:
40510 |
267.686,00 |
164.569,00 |
123.720,00 |
372.000,00 |
151.000,00 |
|
|
b) Operation subsidies included in the Period's
result: 40520 |
103.513,00 |
213.240,00 |
169.662,00 |
453.000,00 |
674.000,00 |
|
|
6.
Personnel costs: 40600 |
-8.043.580,00 |
-7.919.932,00 |
-7.522.279,00 |
-7.526.000,00 |
-7.751.000,00 |
|
|
a) Wages, salaries et al.: 40610 |
-5.778.615,00 |
-5.783.810,00 |
-5.592.074,00 |
-5.566.000,00 |
-5.418.000,00 |
|
|
b) Social security costs: 40620 |
-2.264.965,00 |
-2.136.121,00 |
-1.930.204,00 |
-1.960.000,00 |
-2.333.000,00 |
|
|
c) Provisions : 40630 |
0,00 |
0,00 |
0,00 |
0,00 |
0,00 |
|
|
7.
Other operating costs: 40700 |
-7.401.282,00 |
-7.116.912,00 |
-6.941.001,00 |
-7.053.000,00 |
-6.279.000,00 |
|
|
a) External services: 40710 |
-7.110.214,00 |
-6.594.653,00 |
-6.564.135,00 |
-6.629.000,00 |
-6.175.000,00 |
|
|
b) Taxes: 40720 |
-66.679,00 |
-58.509,00 |
-59.591,00 |
-47.000,00 |
-52.000,00 |
|
|
c) Losses, impairments and variation in provisions from trade
operations : 40730 |
-213.487,00 |
-459.110,00 |
-307.055,00 |
-329.000,00 |
-39.000,00 |
|
|
d) Other current management expenditure : 40740 |
-10.902,00 |
-4.640,00 |
-10.220,00 |
-48.000,00 |
-13.000,00 |
|
|
e) Expenses due to greenhouse gas emissions: 40750 |
0,00 |
0,00 |
0,00 |
0,00 |
0,00 |
|
|
8.
Amortisation of fixed assets: 40800 |
-818.667,00 |
-879.348,00 |
-980.039,00 |
-1.133.000,00 |
-1.178.000,00 |
|
|
9.
Allocation of subsidies of non-financial fixed assets and other: 40900 |
77.115,00 |
81.198,00 |
62.282,00 |
277.000,00 |
131.000,00 |
|
|
10.
Excess provisions : 41000 |
14.435,00 |
0,00 |
0,00 |
0,00 |
16.000,00 |
|
|
11.
Impairment and result of transfers of fixed assets: 41100 |
-21.182,00 |
0,00 |
-52.154,00 |
0,00 |
0,00 |
|
|
a) Impairment and losses : 41110 |
0,00 |
0,00 |
0,00 |
0,00 |
0,00 |
|
|
b) Results for transfers and other : 41120 |
-21.182,00 |
0,00 |
-52.154,00 |
0,00 |
0,00 |
|
|
c) Impairment and profit due to disposals of assets of holding
companies: 41130 |
0,00 |
0,00 |
0,00 |
0,00 |
0,00 |
|
|
12.
Negative difference in combined businesses: 41200 |
0,00 |
0,00 |
0,00 |
0,00 |
0,00 |
|
|
13.
Other results : 41300 |
0,00 |
0,00 |
0,00 |
0,00 |
0,00 |
|
|
A.1)
OPERATING INCOME (1 + 2 + 3 + 4 + 5 + 6 + 7 + 8 + 9 + 10 + 11 + 12 + 13) :
49100 |
524.918,00 |
911.005,00 |
-567.273,00 |
239.000,00 |
85.000,00 |
|
|
14.
Financial income : 41400 |
243.928,00 |
357.741,00 |
255.603,00 |
206.000,00 |
241.000,00 |
|
|
a) Of shares in equity instruments : 41410 |
76.478,00 |
74.800,00 |
6.944,00 |
25.000,00 |
0,00 |
|
|
a 1) In Group companies and associates:
41411 |
76.478,00 |
74.800,00 |
6.944,00 |
0,00 |
0,00 |
|
|
a 2) In third parties: 41412 |
0,00 |
0,00 |
0,00 |
25.000,00 |
0,00 |
|
|
b) From negotiable securities and other financial instruments :
41420 |
167.450,00 |
282.941,00 |
248.659,00 |
181.000,00 |
241.000,00 |
|
|
b 1) From Group companies and associates :
41421 |
167.450,00 |
0,00 |
0,00 |
0,00 |
0,00 |
|
|
b 2) From third parties : 41422 |
0,00 |
282.941,00 |
248.659,00 |
181.000,00 |
241.000,00 |
|
|
c) Allocation of financial subsidies, donations and legacies :
41430 |
0,00 |
0,00 |
0,00 |
0,00 |
0,00 |
|
|
15.
Financial expenditure: 41500 |
-353.060,00 |
-365.447,00 |
-339.187,00 |
-273.000,00 |
-214.000,00 |
|
|
a) Amounts owed to Group companies and associates : 41510 |
0,00 |
0,00 |
0,00 |
0,00 |
0,00 |
|
|
b) For debts with third parties : 41520 |
-353.060,00 |
-365.447,00 |
-339.187,00 |
-273.000,00 |
-214.000,00 |
|
|
c) Stock renewal : 41530 |
0,00 |
0,00 |
0,00 |
0,00 |
0,00 |
|
|
16.
Changes in fair value of financial instruments : 41600 |
0,00 |
0,00 |
0,00 |
0,00 |
0,00 |
|
|
a) Trading book and other : 41610 |
0,00 |
0,00 |
0,00 |
0,00 |
0,00 |
|
|
b) Allocation of financial assets held for sale to the result
for the period: 41620 |
0,00 |
0,00 |
0,00 |
0,00 |
0,00 |
|
|
17.
Exchange rate differences : 41700 |
33.453,00 |
-20.893,00 |
-15.943,00 |
-50.000,00 |
-18.000,00 |
|
|
18.
Impairment and result for transfers of financial instruments: 41800 |
0,00 |
0,00 |
0,00 |
0,00 |
0,00 |
|
|
a) Impairment and losses : 41810 |
0,00 |
0,00 |
0,00 |
0,00 |
0,00 |
|
|
b) Results for transfers and other : 41820 |
0,00 |
0,00 |
0,00 |
0,00 |
0,00 |
|
|
19.
Other financial income and expenditure: 42100 |
0,00 |
0,00 |
0,00 |
0,00 |
0,00 |
|
|
a) Incorporation of financial expenditure to assets:
42110 |
0,00 |
0,00 |
0,00 |
0,00 |
0,00 |
|
|
b) Financial income from arrangement with creditors:
42120 |
0,00 |
0,00 |
0,00 |
0,00 |
0,00 |
|
|
c) Other income and expenditure: 42130 |
0,00 |
0,00 |
0,00 |
0,00 |
0,00 |
|
|
A.2)
FINANCIAL REVENUE (14+15+16+17+18+19) : 49200 |
-75.679,00 |
-28.599,00 |
-99.526,00 |
-117.000,00 |
9.000,00 |
|
|
A.3)
NET RESULT BEFORE TAXES (A.1+A.2) : 49300 |
449.239,00 |
882.406,00 |
-666.799,00 |
122.000,00 |
94.000,00 |
|
|
20.
Income taxes: 41900 |
-125.918,00 |
-163.584,00 |
-71.668,00 |
24.000,00 |
110.000,00 |
|
|
A.4)
PROFIT AFTER TAXES (A.3+20) : 49400 |
323.321,00 |
718.823,00 |
-738.467,00 |
146.000,00 |
204.000,00 |
|
|
21.
Result of the year coming from interrupted operations : 42000 |
0,00 |
0,00 |
0,00 |
0,00 |
0,00 |
|
|
A.5)
RESULT OF THE PERIOD (A.4+21) : 49500 |
323.321,00 |
718.823,00 |
-738.467,00 |
146.000,00 |
204.000,00 |
|
> Normal Balance Sheet under the rules of the 1990 General Accounting Plan (repealed since 1st January of 2008)
Information corresponding to the fiscal year 2014 2013 2012 2011 2010 has been compiled based on the equivalence criteria stipulated in Act JUS/206/2009. Where the provisions of the Act did not establish relevant equivalence criteria, such criteria using its own methodology. To view details on the methodology 2014 2013 2012 2011 2010 is taken from information submitted to the TRADE REGISTER.
|
|
EQUIVALENCIA |
EQUIVALENCIA |
EQUIVALENCIA |
EQUIVALENCIA |
EQUIVALENCIA |
|
|
ASSETS |
2014 |
2013 |
2012 |
2011 |
2010 |
|
|
A)
SHAREHOLDERS (PARTNERS) BY UNCALLED SUSCRIBED CAPITAL: |
0,00 |
0,00 |
0,00 |
0,00 |
0,00 |
|
|
B)
FIXED ASSETS: |
10.866.750,00 |
10.423.708,00 |
10.508.915,00 |
10.401.000,00 |
11.022.000,00 |
|
|
I. Formation expenses: |
0,00 |
0,00 |
0,00 |
0,00 |
0,00 |
|
|
II. Intangible fixed assets: |
2.154.963,00 |
1.750.121,00 |
1.513.650,00 |
1.113.000,00 |
1.061.000,00 |
|
|
1. Research and development costs: |
2.153.697,00 |
1.746.471,00 |
1.505.733,00 |
1.099.000,00 |
1.045.000,00 |
|
|
2. Concessions, patents, licences,
trademarks et al.: |
0,00 |
0,00 |
0,00 |
0,00 |
0,00 |
|
|
3. Goodwill: |
0,00 |
0,00 |
0,00 |
0,00 |
0,00 |
|
|
4. Key money paid for premises: |
0,00 |
0,00 |
0,00 |
0,00 |
0,00 |
|
|
5. Software: |
1.267,00 |
3.650,00 |
7.917,00 |
14.000,00 |
16.000,00 |
|
|
6. Assets under capital leases: |
0,00 |
0,00 |
0,00 |
0,00 |
0,00 |
|
|
7. Payments on account: |
0,00 |
0,00 |
0,00 |
0,00 |
0,00 |
|
|
8. Provisions: |
0,00 |
0,00 |
0,00 |
0,00 |
0,00 |
|
|
9. Accumulated depreciation: |
0,00 |
0,00 |
0,00 |
0,00 |
0,00 |
|
|
III. Tangible fixed assets: |
6.123.294,00 |
6.462.316,00 |
6.991.319,00 |
7.568.000,00 |
7.962.000,00 |
|
|
1. Land and construction: |
5.547.095,00 |
5.656.937,00 |
5.804.892,00 |
5.942.000,00 |
5.927.000,00 |
|
|
2. Technical installations and machinery:
|
322.181,00 |
450.327,00 |
663.390,00 |
909.177,00 |
1.128.923,00 |
|
|
3. Other installations, tools and
furniture: |
175.519,00 |
245.330,00 |
361.403,00 |
495.304,00 |
615.017,00 |
|
|
4. Payments on account and tangible fixed
assets under construction: |
0,00 |
0,00 |
0,00 |
0,00 |
16.000,00 |
|
|
5. Other tangible assets: |
78.499,00 |
109.721,00 |
161.633,00 |
221.519,00 |
275.059,00 |
|
|
6. Provisions: |
0,00 |
0,00 |
0,00 |
0,00 |
0,00 |
|
|
7. Accumulated depreciation: |
0,00 |
0,00 |
0,00 |
0,00 |
0,00 |
|
|
IV. Financial investments: |
624.826,00 |
602.526,00 |
568.651,00 |
571.000,00 |
580.000,00 |
|
|
1. Equity investments in group companies:
|
495.036,00 |
495.036,00 |
474.721,00 |
474.623,00 |
474.623,00 |
|
|
2. Receivables from group companies:
|
0,00 |
0,00 |
0,00 |
0,00 |
0,00 |
|
|
3. Equity investment in associated
companies: |
41.070,00 |
41.070,00 |
39.385,00 |
39.377,00 |
39.377,00 |
|
|
4. Credits to associated companies: |
0,00 |
0,00 |
0,00 |
0,00 |
0,00 |
|
|
5. Long-term securities portfolio: |
0,00 |
0,00 |
0,00 |
0,00 |
0,00 |
|
|
6. Other receivables: |
0,00 |
0,00 |
0,00 |
0,00 |
0,00 |
|
|
7. Long term guarantees and deposits:
|
88.720,00 |
66.419,00 |
54.544,00 |
57.000,00 |
66.000,00 |
|
|
8. Provisions: |
0,00 |
0,00 |
0,00 |
0,00 |
0,00 |
|
|
9. Long-term receivables from public
bodies: |
0,00 |
0,00 |
0,00 |
0,00 |
0,00 |
|
|
V. Own shares: |
0,00 |
0,00 |
0,00 |
0,00 |
0,00 |
|
|
VI. Long-term trade receivables: |
1.963.666,00 |
1.608.745,00 |
1.435.296,00 |
1.149.000,00 |
1.419.000,00 |
|
|
C)
Deferred expenses: |
0,00 |
0,00 |
0,00 |
0,00 |
0,00 |
|
|
D)
CURRENT ASSETS: |
18.650.599,00 |
17.969.314,00 |
17.966.747,00 |
18.854.000,00 |
18.774.000,00 |
|
|
I. Called-up share capital (not paid): |
0,00 |
0,00 |
0,00 |
0,00 |
0,00 |
|
|
II. Stocks: |
6.632.020,00 |
6.743.951,00 |
6.868.943,00 |
7.128.000,00 |
7.143.000,00 |
|
|
1. Goods for resale: |
1.649.451,00 |
1.712.421,00 |
1.598.456,00 |
1.674.000,00 |
1.380.000,00 |
|
|
2. Raw materials and other consumables:
|
2.082.039,00 |
2.011.305,00 |
2.059.205,00 |
2.078.000,00 |
1.926.000,00 |
|
|
3. Goods in process and semifinished ones:
|
1.508.319,00 |
1.666.414,00 |
1.788.025,00 |
1.692.000,00 |
1.919.000,00 |
|
|
4. Finished products: |
1.392.210,00 |
1.353.811,00 |
1.423.256,00 |
1.684.000,00 |
1.918.000,00 |
|
|
5. Byproducts, scrap and recovered
materials: |
0,00 |
0,00 |
0,00 |
0,00 |
0,00 |
|
|
6. Payments on account: |
0,00 |
0,00 |
0,00 |
0,00 |
0,00 |
|
|
7. Provisions: |
0,00 |
0,00 |
0,00 |
0,00 |
0,00 |
|
|
III. Debtors: |
11.408.866,00 |
10.796.347,00 |
10.760.558,00 |
11.378.000,00 |
11.348.000,00 |
|
|
1. Trade debtors / accounts receivable:
|
8.025.535,00 |
7.113.550,00 |
6.792.827,00 |
7.188.000,00 |
7.079.000,00 |
|
|
2. Accounts receivable, Group companies:
|
0,00 |
4.384,00 |
17.000,00 |
8.000,00 |
248.000,00 |
|
|
3. Accounts receivable, associated companies:
|
0,00 |
0,00 |
0,00 |
0,00 |
0,00 |
|
|
4. Other debtors: |
0,00 |
0,00 |
0,00 |
0,00 |
0,00 |
|
|
5. Staff: |
0,00 |
0,00 |
0,00 |
0,00 |
0,00 |
|
|
6. Public bodies: |
3.383.331,00 |
3.678.413,00 |
3.950.731,00 |
4.182.000,00 |
4.021.000,00 |
|
|
7. Provisions: |
0,00 |
0,00 |
0,00 |
0,00 |
0,00 |
|
|
IV. Short-term investments: |
138.864,00 |
171.657,00 |
202.103,00 |
199.000,00 |
272.000,00 |
|
|
1. Equity investments in group companies:
|
0,00 |
0,00 |
0,00 |
0,00 |
0,00 |
|
|
2. Receivables from group companies:
|
0,00 |
0,00 |
0,00 |
0,00 |
0,00 |
|
|
3. Equity investment in associated companies:
|
0,00 |
0,00 |
0,00 |
0,00 |
0,00 |
|
|
4. Credits to associated companies: |
0,00 |
0,00 |
0,00 |
0,00 |
0,00 |
|
|
5. Short term securities portfolio: |
0,00 |
0,00 |
0,00 |
0,00 |
0,00 |
|
|
6. Other receivables: |
0,00 |
0,00 |
10.750,00 |
5.000,00 |
0,00 |
|
|
7. Shor term guarantees and deposits:
|
138.864,00 |
171.657,00 |
191.353,00 |
194.000,00 |
272.000,00 |
|
|
8. Provisions: |
0,00 |
0,00 |
0,00 |
0,00 |
0,00 |
|
|
V. Short-term treasury shares: |
0,00 |
0,00 |
0,00 |
0,00 |
0,00 |
|
|
VI. Cash at bank and in hand: |
426.827,00 |
171.485,00 |
112.099,00 |
92.000,00 |
11.000,00 |
|
|
VII. Prepayments and accrued income: |
44.022,00 |
85.875,00 |
23.044,00 |
57.000,00 |
0,00 |
|
|
GENERAL
TOTAL (A + B + C + D): |
29.517.349,00 |
28.393.022,00 |
28.475.662,00 |
29.255.000,00 |
29.796.000,00 |
|
MERCANTILE REGISTRY.
|
|
EQUIVALENCIA |
EQUIVALENCIA |
EQUIVALENCIA |
EQUIVALENCIA |
EQUIVALENCIA |
|
|
LIABILITIES |
2014 |
2013 |
2012 |
2011 |
2010 |
|
|
A)
EQUITY: |
13.169.142,00 |
13.431.323,00 |
12.980.039,00 |
13.722.200,00 |
13.835.900,00 |
|
|
I. Subscribed capital: |
3.000.000,00 |
3.000.000,00 |
3.000.000,00 |
3.000.000,00 |
3.000.000,00 |
|
|
II. Share premium: |
0,00 |
0,00 |
0,00 |
0,00 |
0,00 |
|
|
III. Revaluation reserves: |
841.924,00 |
838.779,00 |
940.259,00 |
936.401,00 |
951.857,00 |
|
|
IV. Reserves: |
9.003.897,00 |
8.873.722,00 |
9.778.247,00 |
9.639.799,00 |
9.680.043,00 |
|
|
1. Legal reserve: |
601.400,00 |
601.400,00 |
600.000,00 |
601.000,00 |
600.000,00 |
|
|
2. Reserves for own shares: |
0,00 |
0,00 |
0,00 |
0,00 |
0,00 |
|
|
3. Reserves for shares of the controlling
company: |
0,00 |
0,00 |
0,00 |
0,00 |
0,00 |
|
|
4. Statutory reserves: |
0,00 |
0,00 |
0,00 |
0,00 |
0,00 |
|
|
5. Miscellaneous reserves: |
8.402.497,00 |
8.272.322,00 |
9.178.247,00 |
9.038.799,00 |
9.080.043,00 |
|
|
Differences due to capital adjustement to
euros: |
0,00 |
0,00 |
0,00 |
0,00 |
0,00 |
|
|
V. Profit or loss brought forward: |
0,00 |
0,00 |
0,00 |
0,00 |
0,00 |
|
|
1. Retained earnings: |
0,00 |
0,00 |
0,00 |
0,00 |
0,00 |
|
|
2. Prior year losses: |
0,00 |
0,00 |
0,00 |
0,00 |
0,00 |
|
|
3. Partners' contributions so as
to compensate losses: |
0,00 |
0,00 |
0,00 |
0,00 |
0,00 |
|
|
VI. Profit or loss for the financial year: |
323.321,00 |
718.823,00 |
-738.467,00 |
146.000,00 |
204.000,00 |
|
|
VII. Interim dividend paid: |
0,00 |
0,00 |
0,00 |
0,00 |
0,00 |
|
|
VIII. Own shares for capital reduction: |
0,00 |
0,00 |
0,00 |
0,00 |
0,00 |
|
|
B)
Deferred income: |
231.376,00 |
197.549,00 |
238.472,00 |
247.800,00 |
380.100,00 |
|
|
1. Capital grants: |
231.376,00 |
197.549,00 |
238.472,00 |
247.800,00 |
380.100,00 |
|
|
2. Unrealised exchange gains: |
0,00 |
0,00 |
0,00 |
0,00 |
0,00 |
|
|
3. Other deferred income: |
0,00 |
0,00 |
0,00 |
0,00 |
0,00 |
|
|
4. Public revenues to distribute in
several financial years: |
0,00 |
0,00 |
0,00 |
0,00 |
0,00 |
|
|
C)
PROVISIONS FOR LIABILITIES AND CHARGES: |
50.121,00 |
108.781,00 |
95.323,00 |
77.000,00 |
248.000,00 |
|
|
1. Provisions for pension fund and other
similar obligations: |
50.121,00 |
108.781,00 |
95.323,00 |
0,00 |
0,00 |
|
|
2. Provisions for taxes: |
0,00 |
0,00 |
0,00 |
0,00 |
0,00 |
|
|
3. Other provisions: |
0,00 |
0,00 |
0,00 |
77.000,00 |
248.000,00 |
|
|
4. Reversion fund: |
0,00 |
0,00 |
0,00 |
0,00 |
0,00 |
|
|
D)
LONG TERM LIABILITIES: |
3.952.596,00 |
3.897.289,00 |
3.839.961,00 |
2.954.000,00 |
3.604.000,00 |
|
|
I. Issued debentures and other marketable securities: |
0,00 |
0,00 |
0,00 |
0,00 |
0,00 |
|
|
1. Non-convertible debentures: |
0,00 |
0,00 |
0,00 |
0,00 |
0,00 |
|
|
2. Convertible debentures: |
0,00 |
0,00 |
0,00 |
0,00 |
0,00 |
|
|
3. Other debt securities: |
0,00 |
0,00 |
0,00 |
0,00 |
0,00 |
|
|
II. Amounts owed to credit institutions: |
2.781.326,00 |
2.754.161,00 |
2.398.182,00 |
1.696.000,00 |
2.132.000,00 |
|
|
1. Loans and other liabilities: |
2.781.326,00 |
2.754.161,00 |
2.398.182,00 |
1.696.000,00 |
2.132.000,00 |
|
|
2. Long-term liabilities from capital leases:
|
0,00 |
0,00 |
0,00 |
0,00 |
0,00 |
|
|
III. Debts with companies of the group and affiliated ones:
|
0,00 |
0,00 |
0,00 |
0,00 |
0,00 |
|
|
1. Amounts owed to group companies: |
0,00 |
0,00 |
0,00 |
0,00 |
0,00 |
|
|
2. Amounts owed to associated companies:
|
0,00 |
0,00 |
0,00 |
0,00 |
0,00 |
|
|
IV. Other creditors: |
1.171.270,00 |
1.143.128,00 |
1.441.779,00 |
1.258.000,00 |
1.472.000,00 |
|
|
1. Long-term bills of exchange payable:
|
0,00 |
0,00 |
0,00 |
0,00 |
0,00 |
|
|
2. Other creditors: |
956.975,00 |
947.628,00 |
1.223.471,00 |
1.034.729,00 |
1.174.692,00 |
|
|
3. Long term guarantees and deposits received:
|
251,00 |
248,00 |
320,00 |
271,00 |
308,00 |
|
|
4. Long term payables to public bodies:
|
214.045,00 |
195.252,00 |
217.988,00 |
223.000,00 |
297.000,00 |
|
|
V. Unpaid portion of equity investment: |
0,00 |
0,00 |
0,00 |
0,00 |
0,00 |
|
|
1. Group companies: |
0,00 |
0,00 |
0,00 |
0,00 |
0,00 |
|
|
2. Associated companies: |
0,00 |
0,00 |
0,00 |
0,00 |
0,00 |
|
|
3. Third parties: |
0,00 |
0,00 |
0,00 |
0,00 |
0,00 |
|
|
VI. Long term trade creditors: |
0,00 |
0,00 |
0,00 |
0,00 |
0,00 |
|
|
E)
SHORT TERM CREDITORS: |
12.114.115,00 |
10.758.080,00 |
11.321.867,00 |
12.254.000,00 |
11.728.000,00 |
|
|
I. Issued debentures and other marketable securities: |
0,00 |
0,00 |
0,00 |
0,00 |
0,00 |
|
|
1. Non-convertible debentures: |
0,00 |
0,00 |
0,00 |
0,00 |
0,00 |
|
|
2. Convertible debentures: |
0,00 |
0,00 |
0,00 |
0,00 |
0,00 |
|
|
3. Other debt securities: |
0,00 |
0,00 |
0,00 |
0,00 |
0,00 |
|
|
4. Accrued interest on debentures and
other debt securities: |
0,00 |
0,00 |
0,00 |
0,00 |
0,00 |
|
|
II. Amounts owed to credit institutions: |
6.244.089,00 |
5.241.506,00 |
6.063.057,00 |
6.220.000,00 |
4.874.000,00 |
|
|
1. Loans and other liabilities: |
6.244.089,00 |
5.241.506,00 |
6.063.057,00 |
6.220.000,00 |
4.874.000,00 |
|
|
2. Accrued interest on liabilities with
credit institutions: |
0,00 |
0,00 |
0,00 |
0,00 |
0,00 |
|
|
3. Short-term liabilities from capital
leases: |
0,00 |
0,00 |
0,00 |
0,00 |
0,00 |
|
|
III. Short-term amounts owed to group and associated companies:
|
494.506,00 |
283.855,00 |
682.592,00 |
485.000,00 |
589.000,00 |
|
|
1. Amounts owed to group companies: |
0,00 |
0,00 |
0,00 |
0,00 |
0,00 |
|
|
2. Amounts owed to associated companies:
|
494.506,00 |
283.855,00 |
682.592,00 |
485.000,00 |
589.000,00 |
|
|
IV. Trade creditors: |
4.609.244,00 |
4.046.517,00 |
3.572.424,00 |
4.606.000,00 |
5.391.000,00 |
|
|
1. Advanced payments from customers:
|
0,00 |
0,00 |
0,00 |
0,00 |
0,00 |
|
|
2. Amounts owed for purchases of goods or
services: |
4.609.244,00 |
4.046.517,00 |
3.572.424,00 |
4.606.000,00 |
5.391.000,00 |
|
|
3. Debts represented by notes payable:
|
0,00 |
0,00 |
0,00 |
0,00 |
0,00 |
|
|
V. Other creditors: |
423.782,00 |
592.150,00 |
582.330,00 |
546.000,00 |
580.000,00 |
|
|
1. Public bodies: |
331.238,00 |
329.435,00 |
430.381,00 |
293.000,00 |
267.000,00 |
|
|
2. Bills of exchange payable: |
0,00 |
0,00 |
0,00 |
0,00 |
0,00 |
|
|
3. Miscellaneous debts: |
43.404,00 |
36.434,00 |
70.700,00 |
206.000,00 |
253.000,00 |
|
|
4. Wages and salaries payable: |
49.140,00 |
226.281,00 |
81.249,00 |
47.000,00 |
60.000,00 |
|
|
5. Guarantees and deposits received at
short term: |
0,00 |
0,00 |
0,00 |
0,00 |
0,00 |
|
|
VI. Provisions: |
342.494,00 |
389.931,00 |
380.163,00 |
397.000,00 |
294.000,00 |
|
|
VII. Prepayments and accrued income: |
0,00 |
204.122,00 |
41.300,00 |
0,00 |
0,00 |
|
|
F)
SHORT-TERM PROVISIONS FOR LIABILITIES AND CHARGES: |
0,00 |
0,00 |
0,00 |
0,00 |
0,00 |
|
|
GENERAL
TOTAL (A + B + C + D + E + F): |
29.517.349,00 |
28.393.022,00 |
28.475.662,00 |
29.255.000,00 |
29.796.000,00 |
|
MERCANTILE REGISTRY.
|
|
EQUIVALENCIA |
EQUIVALENCIA |
EQUIVALENCIA |
EQUIVALENCIA |
EQUIVALENCIA |
|
|
DEBIT |
2014 |
2013 |
2012 |
2011 |
2010 |
|
|
A)
CHARGES (A.1 to A.15): |
29.806.314,00 |
28.430.562,00 |
27.252.219,00 |
27.674.000,00 |
26.443.000,00 |
|
|
A.1. Stock reduction of both manufactured goods
and the ones in process: |
155.134,00 |
191.056,00 |
165.477,00 |
461.000,00 |
1.033.000,00 |
|
|
A.2. Supplies: |
12.887.492,00 |
11.773.391,00 |
11.164.473,00 |
11.202.000,00 |
10.080.000,00 |
|
|
a) Stock consumption:
|
5.887.714,00 |
5.095.545,00 |
5.359.647,00 |
5.143.000,00 |
4.573.000,00 |
|
|
b) Consumption of raw
materials and miscellaneous consumable ones: |
5.428.683,00 |
5.338.790,00 |
4.704.496,00 |
4.843.000,00 |
4.414.000,00 |
|
|
c) Miscellaneous
external expenditure: |
1.571.094,00 |
1.339.056,00 |
1.100.330,00 |
1.216.000,00 |
1.093.000,00 |
|
|
A.3. Staff costs: |
8.043.580,00 |
7.919.932,00 |
7.522.279,00 |
7.526.000,00 |
7.751.000,00 |
|
|
a) Wages, salaries et
al.: |
5.778.615,00 |
5.783.810,00 |
5.592.074,00 |
5.566.000,00 |
5.418.000,00 |
|
|
b) Social security
costs: |
2.264.965,00 |
2.136.121,00 |
1.930.204,00 |
1.960.000,00 |
2.333.000,00 |
|
|
A.4. Depreciation expense: |
818.667,00 |
879.348,00 |
980.039,00 |
1.133.000,00 |
1.178.000,00 |
|
|
A.5. Variation of trade provisions and losses
of unrecovered receivables: |
213.487,00 |
459.110,00 |
307.055,00 |
329.000,00 |
39.000,00 |
|
|
a) Stock provision
variation: |
0,00 |
0,00 |
0,00 |
0,00 |
0,00 |
|
|
b) Variation in provision
and bad debt losses: |
203.344,00 |
437.297,00 |
292.466,00 |
313.368,00 |
37.147,00 |
|
|
c) Variation of other
trade provisions: |
10.144,00 |
21.814,00 |
14.589,00 |
15.632,00 |
1.853,00 |
|
|
A.6. Other operating charges: |
7.187.795,00 |
6.657.801,00 |
6.633.946,00 |
6.724.000,00 |
6.240.000,00 |
|
|
a) External services:
|
7.110.214,00 |
6.594.653,00 |
6.564.135,00 |
6.629.000,00 |
6.175.000,00 |
|
|
b) Taxes: |
66.679,00 |
58.509,00 |
59.591,00 |
47.000,00 |
52.000,00 |
|
|
c) Other operating
expenses: |
10.902,00 |
4.640,00 |
10.220,00 |
48.000,00 |
13.000,00 |
|
|
d) Allocation to revision
fund: |
0,00 |
0,00 |
0,00 |
0,00 |
0,00 |
|
|
A.I. OPERATING BENEFITS
(B.1+B.2+B.3+B.4-A.1-A.2-A.3-A.4-A.5-A.6): |
468.985,00 |
829.808,00 |
0,00 |
0,00 |
0,00 |
|
|
A.7. Financial and similar charges: |
353.060,00 |
365.447,00 |
339.187,00 |
273.000,00 |
214.000,00 |
|
|
a) Due to liabilities
with companies of the group: |
0,00 |
0,00 |
0,00 |
0,00 |
0,00 |
|
|
b) Due to liabilities
with associated companies: |
0,00 |
0,00 |
0,00 |
0,00 |
0,00 |
|
|
c) Due to other
debts.: |
353.060,00 |
365.447,00 |
339.187,00 |
273.000,00 |
214.000,00 |
|
|
d) Losses from
financial investments: |
0,00 |
0,00 |
0,00 |
0,00 |
0,00 |
|
|
A.8. Changes in financial investment
provisions: |
0,00 |
0,00 |
0,00 |
0,00 |
0,00 |
|
|
A.9. Exchange losses: |
0,00 |
20.893,00 |
15.943,00 |
50.000,00 |
18.000,00 |
|
|
A.II. NET FINANCIAL INCOME (B.5+B.6+B.7+B.8-A.7-A.8-A.9):
|
0,00 |
0,00 |
0,00 |
0,00 |
9.000,00 |
|
|
A.III. PROFIT FROM ORDINARY ACTIVITIES (A.I+A.II-B.I-B.II):
|
393.307,00 |
801.209,00 |
0,00 |
0,00 |
0,00 |
|
|
A.10. Changes in provisions for
intangible, tangible and securities portfolio: |
0,00 |
0,00 |
0,00 |
0,00 |
0,00 |
|
|
A.11. Losses from tangible and intangible
fixed assets and securities portfolio: |
21.182,00 |
0,00 |
52.154,00 |
0,00 |
0,00 |
|
|
A.12. Losses from transactions with own
shares and debentures: |
0,00 |
0,00 |
0,00 |
0,00 |
0,00 |
|
|
A.13. Extraordinary expenses: |
0,00 |
0,00 |
0,00 |
0,00 |
0,00 |
|
|
A.14. Expenses and losses of former
financial years: |
0,00 |
0,00 |
0,00 |
0,00 |
0,00 |
|
|
A.IV. EXTRAORDINARY PROFIT
(B.9+B.10+B.11+B.12+B.13-A.10-A.11-A.12-A.13-A.14): |
55.933,00 |
81.198,00 |
10.128,00 |
277.000,00 |
131.000,00 |
|
|
A.V. PROFIT BEFORE TAXES (A.III+A.IV-B.III-B.IV): |
449.239,00 |
882.406,00 |
0,00 |
122.000,00 |
94.000,00 |
|
|
A.15. Corporation tax: |
125.918,00 |
163.584,00 |
71.668,00 |
-24.000,00 |
-110.000,00 |
|
|
A.16. Miscellaneous taxes: |
0,00 |
0,00 |
0,00 |
0,00 |
0,00 |
|
|
A.VI. FINANCIAL YEAR RESULTS (PROFIT) (A.V-A.15-A.16): |
323.321,00 |
718.823,00 |
0,00 |
146.000,00 |
204.000,00 |
|
MERCANTILE REGISTRY.
|
|
EQUIVALENCIA |
EQUIVALENCIA |
EQUIVALENCIA |
EQUIVALENCIA |
EQUIVALENCIA |
|
|
CREDIT |
2014 |
2013 |
2012 |
2011 |
2010 |
|
|
B)
INCOME ( B.1 to B.13): |
30.129.635,00 |
29.149.384,00 |
26.513.752,00 |
27.820.000,00 |
26.647.000,00 |
|
|
B.1. Net total sales: |
28.744.613,00 |
27.853.621,00 |
25.202.485,00 |
26.129.000,00 |
25.129.000,00 |
|
|
a) Sales: |
28.662.943,00 |
27.745.049,00 |
25.129.695,00 |
26.097.230,00 |
25.154.847,00 |
|
|
b) Rendering of
services: |
427.892,00 |
443.706,00 |
376.333,00 |
347.000,00 |
278.000,00 |
|
|
Returns and Rappel on
sales: |
-346.222,00 |
-335.134,00 |
-303.543,00 |
-315.230,00 |
-303.847,00 |
|
|
B.2. Stock increase of manufactured goods
and products in process: |
0,00 |
0,00 |
0,00 |
0,00 |
0,00 |
|
|
B.3. Works performed by the company for
fixed assets: |
644.891,00 |
479.016,00 |
700.000,00 |
383.000,00 |
305.000,00 |
|
|
B.4. Miscellaneous operating income:
|
385.635,00 |
377.808,00 |
293.382,00 |
825.000,00 |
841.000,00 |
|
|
a) Auxiliary income
and other from current management: |
267.686,00 |
164.569,00 |
123.720,00 |
372.000,00 |
151.000,00 |
|
|
b) Grants: |
103.513,00 |
213.240,00 |
169.662,00 |
453.000,00 |
674.000,00 |
|
|
c) Liabilities and
charges provisions surplus: |
14.435,00 |
0,00 |
0,00 |
0,00 |
16.000,00 |
|
|
B.I. PÉRDIDAS DE EXPLOTACIÓN
(A.1+A.2+A.3+A.4+A.5-A.6-B.1-B.2-B.3-B.4): |
0,00 |
0,00 |
577.401,00 |
38.000,00 |
46.000,00 |
|
|
B.5. Income from equity investment: |
76.478,00 |
74.800,00 |
6.944,00 |
25.000,00 |
0,00 |
|
|
a) In companies of
the group: |
76.478,00 |
74.800,00 |
6.944,00 |
0,00 |
0,00 |
|
|
b) In associated
companies: |
0,00 |
0,00 |
0,00 |
0,00 |
0,00 |
|
|
c) Third parties:
|
0,00 |
0,00 |
0,00 |
25.000,00 |
0,00 |
|
|
B.6. Income from other marketable
securities and long-term receivables: |
0,00 |
0,00 |
0,00 |
0,00 |
0,00 |
|
|
a) From companies of
the group: |
0,00 |
0,00 |
0,00 |
0,00 |
0,00 |
|
|
b) From associated
companies: |
0,00 |
0,00 |
0,00 |
0,00 |
0,00 |
|
|
c) From companies out
of the group: |
0,00 |
0,00 |
0,00 |
0,00 |
0,00 |
|
|
B.7. Miscellaneous interests or similar
income: |
167.450,00 |
282.941,00 |
248.659,00 |
181.000,00 |
241.000,00 |
|
|
a) From companies of
the group: |
167.450,00 |
0,00 |
0,00 |
0,00 |
0,00 |
|
|
b) From associated
companies: |
0,00 |
0,00 |
0,00 |
0,00 |
0,00 |
|
|
c) Miscellaneous
interests: |
0,00 |
282.941,00 |
248.659,00 |
181.000,00 |
241.000,00 |
|
|
d) Profit on
financial investment: |
0,00 |
0,00 |
0,00 |
0,00 |
0,00 |
|
|
B.8. Exchange positive differences: |
33.453,00 |
0,00 |
0,00 |
0,00 |
0,00 |
|
|
B.II. NEGATIVE FINANCIAL RESULTS (A.7+A.8+A.9-B.5-B.6-B.7-B.8):
|
75.679,00 |
28.599,00 |
99.526,00 |
117.000,00 |
0,00 |
|
|
B.III. LOSSES ON ORDINARY ACTIVITIES ( B.I + B.II - A.I - A.II
): |
0,00 |
0,00 |
676.927,00 |
155.000,00 |
37.000,00 |
|
|
B.9.Profit on disposal of both tangible and
intangible fixed assets and securities portfolio: |
0,00 |
0,00 |
0,00 |
0,00 |
0,00 |
|
|
B.10. Profit on transactions with own
shares and debentures: |
0,00 |
0,00 |
0,00 |
0,00 |
0,00 |
|
|
B.11. Capital grants transferred to profit
and loss: |
77.115,00 |
81.198,00 |
62.282,00 |
277.000,00 |
131.000,00 |
|
|
B.12. Extraordinary income: |
0,00 |
0,00 |
0,00 |
0,00 |
0,00 |
|
|
B.13. Income and profit of former
financial years: |
0,00 |
0,00 |
0,00 |
0,00 |
0,00 |
|
|
B.IV. NEGATIVE EXTRAORDINARY RESULTS
(A.10+A.11+A.12+A.13+A.14-B.9-B.10-B.11-B.12-B.13): |
0,00 |
0,00 |
0,00 |
0,00 |
0,00 |
|
|
B.V. LOSSES BEFORE TAXES (B.III+B.IV-A.III-A.IV): |
0,00 |
0,00 |
666.799,00 |
0,00 |
0,00 |
|
|
B.VI. RESULT OF THE PERIOD (LOSSES) (B.V+A.15+A.16): |
0,00 |
0,00 |
738.467,00 |
0,00 |
0,00 |
|
MERCANTILE REGISTRY.
CASHFLOW
STATEMENT
|
Model: Normal
>
Source of information: Data contained in this section is taken from the
information declared in the Annual Accounts submitted to the Trade Register.
|
|
2014 |
2013 |
2012 |
2011 |
2010 |
|
|
1.
Fiscal year result before taxes.: 61100 |
449.000,00 |
883.000,00 |
-667.000,00 |
122.000,00 |
94.000,00 |
|
|
2.
Results adjustments.: 61200 |
882.000,00 |
1.223.000,00 |
1.458.000,00 |
1.252.000,00 |
968.000,00 |
|
|
a) Fixed Assets Amortization (+).: 61201 |
819.000,00 |
880.000,00 |
980.000,00 |
1.133.000,00 |
1.178.000,00 |
|
|
b) Obsolescence Allowances (+/-). : 61202 |
220.000,00 |
373.000,00 |
388.000,00 |
397.000,00 |
-207.000,00 |
|
|
c) Variation in Provision (+/-). : 61203 |
0,00 |
23.000,00 |
1.000,00 |
-68.000,00 |
155.000,00 |
|
|
d) Allocation of grants (-).: 61204 |
-77.000,00 |
-81.000,00 |
-62.000,00 |
-277.000,00 |
-131.000,00 |
|
|
e) Results on disposal of fixed assets (+/-). : 61205 |
21.000,00 |
0,00 |
52.000,00 |
0,00 |
0,00 |
|
|
g) Financial income (-).: 61207 |
-420.000,00 |
-358.000,00 |
-256.000,00 |
-206.000,00 |
-241.000,00 |
|
|
h) Financial Expenses (+). : 61208 |
353.000,00 |
365.000,00 |
339.000,00 |
273.000,00 |
214.000,00 |
|
|
i) Exchange differences (+/-). : 61209 |
-34.000,00 |
21.000,00 |
16.000,00 |
0,00 |
0,00 |
|
|
3.
Changes in current capital equity.: 61300 |
375.000,00 |
-828.000,00 |
-445.000,00 |
-820.000,00 |
1.496.000,00 |
|
|
a) Stock (+/-).: 61301 |
104.000,00 |
213.000,00 |
260.000,00 |
-53.000,00 |
1.138.000,00 |
|
|
d) Debtors and other accounts receivable (+/-). : 61302 |
-147.000,00 |
-1.570.000,00 |
164.000,00 |
-38.000,00 |
-824.000,00 |
|
|
d) Creditors and other accounts payable (+/-). : 61304 |
601.000,00 |
514.000,00 |
-849.000,00 |
-889.000,00 |
1.182.000,00 |
|
|
f) Other non-current assets and liabilities (+/-).: 61306 |
-183.000,00 |
15.000,00 |
-20.000,00 |
160.000,00 |
0,00 |
|
|
4.
Other cash flows for operating activities.: 61400 |
-38.000,00 |
1.000,00 |
-68.000,00 |
-67.000,00 |
-16.000,00 |
|
|
a) Interest payments (-). : 61401 |
-353.000,00 |
-357.000,00 |
-325.000,00 |
-273.000,00 |
-206.000,00 |
|
|
b) Dividend payment collection (+). : 61402 |
76.000,00 |
75.000,00 |
7.000,00 |
25.000,00 |
0,00 |
|
|
c) Interest collection (+). : 61403 |
344.000,00 |
283.000,00 |
249.000,00 |
181.000,00 |
241.000,00 |
|
|
e) Other payments (payment collection) (-/+) : 61405 |
-105.000,00 |
0,00 |
1.000,00 |
0,00 |
-51.000,00 |
|
|
5.
Operating activity cash flows (1 + 2 + 3 + 4) : 61500 |
1.668.000,00 |
1.279.000,00 |
278.000,00 |
487.000,00 |
2.542.000,00 |
|
|
6.
Payments for investment (-).: 62100 |
-866.000,00 |
-611.000,00 |
-859.000,00 |
-791.000,00 |
-474.000,00 |
|
|
a) Companies of the group and affiliates. : 62101 |
0,00 |
-22.000,00 |
0,00 |
0,00 |
0,00 |
|
|
b) Intangible fixed assets. : 62102 |
-645.000,00 |
-479.000,00 |
-706.000,00 |
-390.000,00 |
-322.000,00 |
|
|
c) Fixed assets. : 62103 |
-198.000,00 |
-110.000,00 |
-153.000,00 |
-401.000,00 |
-152.000,00 |
|
|
e) Other financial assets. : 62105 |
-23.000,00 |
0,00 |
0,00 |
0,00 |
0,00 |
|
|
7.
Divestment payment collection (+). : 62200 |
33.000,00 |
0,00 |
2.000,00 |
0,00 |
512.000,00 |
|
|
e) Other financial assets. : 62205 |
33.000,00 |
0,00 |
2.000,00 |
0,00 |
512.000,00 |
|
|
8.
Investment activity cash flows (6 + 7) minus Amortization: 62300 |
-833.000,00 |
-611.000,00 |
-857.000,00 |
-791.000,00 |
38.000,00 |
|
|
9.
Payment collection and payments for equity instruments. : 63100 |
145.000,00 |
0,00 |
0,00 |
0,00 |
15.000,00 |
|
|
e) Grants, donations and bequests received (+). : 63105 |
145.000,00 |
0,00 |
0,00 |
0,00 |
15.000,00 |
|
|
10.
Payment collection and payments for financial liabilities instruments.:
63200 |
-162.000,00 |
-584.000,00 |
615.000,00 |
638.000,00 |
-2.593.000,00 |
|
|
a) Issuance : 63201 |
2.160.000,00 |
1.660.000,00 |
2.430.000,00 |
1.496.000,00 |
36.000,00 |
|
|
2. Debts incurred with credit institutions (+). : 63203 |
2.160.000,00 |
1.660.000,00 |
2.430.000,00 |
1.496.000,00 |
0,00 |
|
|
5. Other debts (+). : 63206 |
0,00 |
0,00 |
0,00 |
0,00 |
36.000,00 |
|
|
b) Repayment and amortization of : 63207 |
-2.322.000,00 |
-2.244.000,00 |
-1.815.000,00 |
-858.000,00 |
-2.629.000,00 |
|
|
2. Debts incurred with credit institutions (-).: 63209 |
-2.322.000,00 |
-1.807.000,00 |
-1.815.000,00 |
-586.000,00 |
-2.355.000,00 |
|
|
3. Debts incurred with companies of the group and affiliates (-).
: 63210 |
0,00 |
-437.000,00 |
0,00 |
0,00 |
0,00 |
|
|
5. Other debts (-). : 63212 |
0,00 |
0,00 |
0,00 |
-272.000,00 |
-274.000,00 |
|
|
11.
Payments from dividends and remunerations from other assets instruments. :
63300 |
-600.000,00 |
0,00 |
0,00 |
-203.000,00 |
0,00 |
|
|
a) Dividends (-).: 63301 |
-600.000,00 |
0,00 |
0,00 |
-203.000,00 |
0,00 |
|
|
12.
Cash flows for financing activities (9+10+11).: 63400 |
-617.000,00 |
-584.000,00 |
615.000,00 |
435.000,00 |
-2.578.000,00 |
|
|
D)
EFFECT OF EXCHANGE RATE CHANGES: 64000 |
34.000,00 |
-21.000,00 |
-16.000,00 |
-50.000,00 |
0,00 |
|
|
E)
NET INCREASE/DECREASE OF CASH OR EQUIVALENT ASSETS (+/-5+/-8+/12+/-D) :
65000 |
252.000,00 |
63.000,00 |
20.000,00 |
81.000,00 |
2.000,00 |
|
|
Cash or equivalent assets as of beginning of the fiscal year.:
65100 |
175.000,00 |
112.000,00 |
92.000,00 |
11.000,00 |
9.000,00 |
|
|
Cash or equivalent assets as of end of the fiscal year.:
65200 |
427.000,00 |
175.000,00 |
112.000,00 |
92.000,00 |
11.000,00 |
|
FINANCIAL
DIAGNOSIS
|
> Economic-Financial Comparative Analysis
Data used in the following ratios and indicators is taken from the
Annual Accounts submitted by the company to the TRADE REGISTER.
>
Comparison within the Sector
|
Cash
Flow |
2014 |
2013 |
Variación 2014 - 2013 |
|
|||
|
|
Empresa |
Sector |
Empresa |
Sector |
Empresa |
Sector |
|
|
Cash
Flow over Sales: |
0,01 % |
0,04 % |
0,00 % |
0,01 % |
|
240,41 % |
|
|
EBITDA
over Sales: |
4,43 % |
12,44 % |
6,14 % |
11,37 % |
-27,82 % |
9,48 % |
|
|
Cash
Flow Yield: |
0,01 % |
0,02 % |
0,00 % |
0,01 % |
|
271,38 % |
|
|
Profitability |
2014 |
2013 |
Variación 2014 - 2013 |
|
|||
|
|
Empresa |
Sector |
Empresa |
Sector |
Empresa |
Sector |
|
|
Operating
economic profitability: |
1,96 % |
8,93 % |
3,50 % |
6,86 % |
-44,06 % |
30,12 % |
|
|
Total
economic profitability: |
2,72 % |
5,07 % |
4,39 % |
3,75 % |
-38,15 % |
35,01 % |
|
|
Financial
profitability: |
2,47 % |
7,78 % |
5,39 % |
4,24 % |
-54,07 % |
83,48 % |
|
|
Margin:
|
1,76 % |
7,76 % |
3,17 % |
6,71 % |
-44,41 % |
15,63 % |
|
|
Mark-up:
|
1,51 % |
6,97 % |
3,07 % |
4,49 % |
-50,89 % |
55,19 % |
|
|
Solvency |
2014 |
2013 |
Variación 2014 - 2013 |
|
|||
|
|
Empresa |
Sector |
Empresa |
Sector |
Empresa |
Sector |
|
|
Liquidity:
|
0,04 |
0,15 |
0,02 |
0,13 |
119,22 |
10,17 |
|
|
Acid
Test: |
0,76 |
0,89 |
0,77 |
0,87 |
-1,26 |
2,65 |
|
|
Working
Capital / Investment: |
0,12 |
0,03 |
0,14 |
0,05 |
-16,98 |
-44,57 |
|
|
Solvency:
|
1,58 |
1,21 |
1,73 |
1,18 |
-8,58 |
2,79 |
|
|
Indebtedness |
2014 |
2013 |
Variación 2014 - 2013 |
|
|||
|
|
Empresa |
Sector |
Empresa |
Sector |
Empresa |
Sector |
|
|
Indebtedness
level: |
1,17 |
1,31 |
1,04 |
1,39 |
12,58 |
-6,01 |
|
|
Borrowing
Composition: |
0,34 |
1,17 |
0,38 |
1,01 |
-10,67 |
16,36 |
|
|
Repayment
Ability: |
61,58 |
24,87 |
240,22 |
94,77 |
-74,36 |
-73,75 |
|
|
Warranty:
|
1,88 |
1,77 |
1,99 |
1,73 |
-5,68 |
2,59 |
|
|
Generated
resources / Total creditors: |
0,07 |
0,09 |
0,11 |
0,08 |
-35,17 |
7,98 |
|
|
Efficiency |
2014 |
2013 |
Variación 2014 - 2013 |
|
|||
|
|
Empresa |
Sector |
Empresa |
Sector |
Empresa |
Sector |
|
|
Productivity:
|
1,16 |
2,02 |
1,22 |
1,85 |
-4,73 |
9,47 |
|
|
Turnover
of Collection Rights : |
3,57 |
5,50 |
3,78 |
4,99 |
-5,53 |
10,35 |
|
|
Turnover
of Payment Entitlements: |
3,67 |
3,74 |
3,83 |
3,63 |
-4,07 |
3,03 |
|
|
Stock
rotation: |
4,42 |
8,82 |
4,13 |
7,34 |
6,89 |
20,14 |
|
|
Assets
turnover: |
1,11 |
1,15 |
1,10 |
1,02 |
0,64 |
12,53 |
|
|
Borrowing
Cost: |
2,25 |
2,93 |
2,56 |
2,87 |
-12,35 |
2,12 |
|
>
Trend of indicators under the General Accounting Plan of 2007 (2014, 2013,
2012, 2011, 2010)
|
Cash
Flow |
2014 |
2013 |
2012 |
2011 |
2010 |
|
|
Cash
Flow over Sales: |
0,01 % |
0,00 % |
0,00 % |
0,00 % |
0,00 % |
|
|
EBITDA
over Sales: |
4,43 % |
6,14 % |
1,60 % |
4,19 % |
4,44 % |
|
|
Cash
Flow Yield: |
0,01 % |
0,00 % |
0,00 % |
0,00 % |
0,00 % |
|
|
Profitability |
2014 |
2013 |
2012 |
2011 |
2010 |
|
|
Operating
economic profitability: |
1,96 % |
3,50 % |
-2,16 % |
0,87 % |
0,31 % |
|
|
Total
economic profitability: |
2,72 % |
4,39 % |
-1,15 % |
1,35 % |
1,03 % |
|
|
Financial
profitability: |
2,47 % |
5,39 % |
-5,73 % |
1,07 % |
1,49 % |
|
|
Margin:
|
1,76 % |
3,17 % |
-2,17 % |
0,87 % |
0,32 % |
|
|
Mark-up:
|
1,51 % |
3,07 % |
-2,55 % |
0,45 % |
0,36 % |
|
|
Solvency |
2014 |
2013 |
2012 |
2011 |
2010 |
|
|
Liquidity:
|
0,04 |
0,02 |
0,01 |
0,01 |
0,00 |
|
|
Acid
Test: |
0,76 |
0,77 |
0,68 |
0,67 |
0,70 |
|
|
Working
Capital / Investment: |
0,12 |
0,14 |
0,11 |
0,10 |
0,11 |
|
|
Solvency:
|
1,58 |
1,73 |
1,64 |
1,59 |
1,64 |
|
|
Indebtedness |
2014 |
2013 |
2012 |
2011 |
2010 |
|
|
Indebtedness
level: |
1,17 |
1,04 |
1,11 |
1,05 |
1,04 |
|
|
Borrowing
Composition: |
0,34 |
0,38 |
0,35 |
0,25 |
0,32 |
|
|
Repayment
Ability: |
61,58 |
240,22 |
735,43 |
182,85 |
-157,59 |
|
|
Warranty:
|
1,88 |
1,99 |
1,93 |
1,98 |
1,98 |
|
|
Generated
resources / Total creditors: |
0,07 |
0,11 |
0,02 |
0,09 |
0,09 |
|
|
Efficiency |
2014 |
2013 |
2012 |
2011 |
2010 |
|
|
Productivity:
|
1,16 |
1,22 |
1,05 |
1,15 |
1,14 |
|
|
Turnover
of Collection Rights : |
3,57 |
3,78 |
3,67 |
3,55 |
3,42 |
|
|
Turnover
of Payment Entitlements: |
3,67 |
3,83 |
4,14 |
3,28 |
2,43 |
|
|
Stock
rotation: |
4,42 |
4,13 |
3,90 |
3,84 |
3,68 |
|
|
Assets
turnover: |
1,11 |
1,10 |
1,00 |
1,00 |
0,95 |
|
|
Borrowing
Cost: |
2,25 |
2,56 |
2,29 |
1,84 |
1,42 |
|
COMPARATIVE SECTORIAL BALANCE
|
Sector-based Comparison under the
rules of the New General Accounting Plan.
|
|
Variación - |
|
|
|
Empresa |
Sector |
|
|
Variación - |
|
|
|
Empresa |
Sector |
|
|
Variación - |
|
|
|
Empresa |
Sector |
Public
Tenders and Works Won
|
|
|
|
Organisation
that calls the tender: |
|
TRABAJO PENITENCIARIO Y FORMACION PARA EL EMPLEO |
|
Objective
of Tender: |
|
ADQUISICION DE UN HORNO ELECTRICO ROTATIVO DE
CONVECCION POR AIRE CALIENTE PARA LA PANADERIA DEL CENTRO PENITENCIARIO DE
MADRID VI ARANJUEZ |
|
Date
Awarded: |
|
16/10/2014 |
|
Cost: |
|
20.607,51 EURO. |
|
|
|
Organisation
that calls the tender: |
|
ORGANISMO AUTONOMO TRABAJO PENITENCIARIO Y
FORMACION PARA EL EMPLEO |
|
Objective
of Tender: |
|
Adquisición de seis carretillas elevadoras para
talleres productivos de los Centros Penitenciarios de Alcalá de Guadaira
(Sevilla), Córdoba, Daroca (Zaragoza), Madrid III, Madrid IV y Valladolid
(Lote n.º 1) |
|
Date
Awarded: |
|
22/07/2008 |
|
Cost: |
|
260.353,21 EURO. |
|
|
|
Organisation
that calls the tender: |
|
CONSTRUCCIONES E INFRAESTRUCTURAS EDUCATIVAS DE
LA GENERALITAT VALENCIANA SA |
|
Objective
of Tender: |
|
suministro para el equipamiento de centros
docentes |
|
Date
Awarded: |
|
01/08/2006 |
|
Cost: |
|
Importe compartido entre distintos Contratistas |
|
|
|
Organisation
that calls the tender: |
|
CONSTRUCCIONES E INFRAESTRUCTURAS EDUCATIVAS DE
LA GENERALITAT VALENCIANA SA |
|
Objective
of Tender: |
|
suministro para el equipamiento de centros
docentes 3. Tramitación, procedimiento y forma de adjudicación a)
Tramitación: ordinaria |
|
Date
Awarded: |
|
01/08/2006 |
|
Cost: |
|
Importe compartido entre distintos Contratistas |
|
|
|
Organisation
that calls the tender: |
|
ORGANISMO AUTONOMO TRABAJO PENITENCIARIO Y
FORMACION PARA EL EMPLEO |
|
Objective
of Tender: |
|
Adquisición de equipamiento para los Talleres de
Panadería de varios Centros Penitenciarios |
|
Date
Awarded: |
|
01/08/2006 |
|
Cost: |
|
136.304,15 EURO. |
|
|
|
Organisation
that calls the tender: |
|
ORGANISMO AUTONOMO TRABAJO PENITENCIARIO Y FORMACION
PARA EL EMPLEO |
|
Objective
of Tender: |
|
Suministro para la adquisición de equipamiento
para los talleres de artes gráficas de varios Centros Penitenciarios y la
adquisición de maquinaria diversa para equipar un punto de cocción en el
Centro Penitenciario de Ibiza. |
|
Date
Awarded: |
|
18/05/2006 |
|
Cost: |
|
Importe compartido entre distintos Contratistas |
|
|
|
Organisation
that calls the tender: |
|
ORGANISMO AUTONOMO TRABAJO PENITENCIARIO Y
FORMACION PARA EL EMPLEO |
|
Objective
of Tender: |
|
Adquisición de hornos rotativos para equipar
puntos de cocción de pan precocido congelado en diferentes Centros
Penitenciarios |
|
Date
Awarded: |
|
08/06/2005 |
|
Cost: |
|
136.001,60 EURO. |
|
|
|
Organisation
that calls the tender: |
|
ORGANISMO AUTONOMO TRABAJO PENITENCIARIO Y
FORMACION PARA EL EMPLEO |
|
Objective
of Tender: |
|
Adquisición de hornos de convención para equipar
puntos de cocción de pan precocido congelados en diferentes Centros
Penitenciarios |
|
Date
Awarded: |
|
08/06/2005 |
|
Cost: |
|
153.854,72 EURO. |
Detail
of Subsidies appearing in Balances Memories
|
|
Entity |
CENTRO PARA EL DESARROLLO TECNOLOGICO INDUSTRIAL |
|
Status |
CONCEDIDA |
|
Amount Granted |
74.000,00 |
|
Notes |
El saldo al cierre es de 53.000 euros. |
|
Entity |
CENTRO PARA EL DESARROLLO TECNOLOGICO INDUSTRIAL |
|
Status |
CONCEDIDA |
|
Amount Granted |
71.000,00 |
|
Notes |
El saldo al cierre es de 51.000 euros. |
|
Entity |
MINISTERIO DE INDUSTRIA |
|
Status |
CONCEDIDA |
|
Amount Granted |
61.000,00 |
|
Notes |
El importe reflejado corresponde al imputado a la
cuenta de pérdidas y ganancias, quedando un saldo pendiente de imputar de
216.000 euros. |
|
Entity |
GOBIERNO VASCO |
|
Status |
CONCEDIDA |
|
Amount Granted |
10.000,00 |
|
Notes |
El importe reflejado corresponde al imputado a la
cuenta de pérdidas y ganancias, quedando un saldo pendiente de imputar de
7.000 euros. |
|
Entity |
CENTRO PARA EL DESARROLLO TECNOLOGICO INDUSTRIAL |
|
Status |
CONCEDIDA |
|
Amount Granted |
3.000,00 |
|
Notes |
El importe reflejado corresponde al imputado a la
cuenta de pérdidas y ganancias, quedando un saldo pendiente de imputar de
5.000 euros. |
|
Entity |
CENTRO PARA EL DESARROLLO TECNOLOGICO INDUSTRIAL |
|
Status |
CONCEDIDA |
|
Amount Granted |
3.000,00 |
|
Notes |
El importe reflejado corresponde al traspasado a
resultados, no quedando ningún saldo al cierre. |
|
Entity |
CENTRO PARA EL DESARROLLO TECNOLOGICO INDUSTRIAL |
|
Status |
CONCEDIDA |
|
Amount Granted |
11.000,00 |
|
Notes |
El importe reflejado corresponde al traspasado a
resultados. |
|
Entity |
MINISTERIO DE INDUSTRIA |
|
Status |
CONCEDIDA |
|
Amount Granted |
46.000,00 |
|
Notes |
El importe reflejado corresponde al imputado a la
cuenta de pérdidas y ganancias, quedando un saldo pendiente de imputar de
300.000 euros. |
|
Entity |
MINISTERIO DE INDUSTRIA |
|
Status |
CONCEDIDA |
|
Amount Granted |
2.000,00 |
|
Notes |
El importe reflejado corresponde al imputado a la
cuenta de pérdidas y ganancias, no quedando ningún saldo al cierre. |
|
Entity |
GOBIERNO VASCO |
|
Status |
CONCEDIDA |
|
Amount Granted |
218.000,00 |
|
Notes |
El importe reflejado corresponde al imputado a
resultados en el ejercicio, no quedando ningún saldo pendiente de imputar. |
|
Entity |
MINISTERIO DE INDUSTRIA |
|
Status |
CONCEDIDA |
|
Amount Granted |
37.000,00 |
|
Notes |
El importe reflejado corresponde al imputado a la
cuenta de pérdidas y ganancias, quedando un saldo pendiente de imputar de
311.000 euros. |
|
Entity |
GOBIERNO VASCO |
|
Status |
CONCEDIDA |
|
Amount Granted |
18.000,00 |
|
Notes |
El importe reflejado corresponde al imputado a la
cuenta de pérdidas y ganancias, quedando un saldo pendiente de imputar de
30.000 euros. |
|
Entity |
CENTRO PARA EL DESARROLLO TECNOLOGICO INDUSTRIAL |
|
Status |
CONCEDIDA |
|
Amount Granted |
14.000,00 |
|
Notes |
El saldo al cierre es de 11.000 euros. |
|
Entity |
MINISTERIO DE INDUSTRIA |
|
Status |
CONCEDIDA |
|
Amount Granted |
4.000,00 |
|
Notes |
El importe reflejado corresponde al imputado a la
cuenta de pérdidas y ganancias, quedando un saldo pendiente de imputar de
2.000 euros. |
|
Entity |
ORGANISMO NO ESPECIFICADO |
|
Subsidy Concept |
Subvención de explotación |
|
Status |
CONCEDIDA |
|
Amount Granted |
654.000,00 |
|
Entity |
GOBIERNO VASCO |
|
Status |
CONCEDIDA |
|
Project |
PLAN EKIMEN |
|
Amount Granted |
1.058.000,00 |
|
Research
Summary
|
|
It is a corporation that
has been established many years ago, which gives it sufficient experience in the
sector of activities it carries out and it has a good reputation in general
amongst consulted references. Its manufacturing has increases with a
percentage of 3,20 % in 2014 in comparison to the previous year. Atiende con
normalidad los compromisos de pago. |
Sources
|
|
Registry of Commerce's
Official Gazette. Own and external data bases Company References |
FOREIGN EXCHANGE RATES
|
Currency |
Unit
|
Indian Rupees |
|
US Dollar |
1 |
Rs.65.79 |
|
|
1 |
Rs.99.95 |
|
Euro |
1 |
Rs.71.55 |
INFORMATION DETAILS
|
Analysis Done by
: |
HEE |
|
|
|
|
Report Prepared
by : |
TPT |
RATING EXPLANATIONS
|
RATING |
STATUS |
PROPOSED CREDIT LINE |
|
|
|
>86 |
Aaa |
Possesses an extremely sound financial base with the strongest capability
for timely payment of interest and principal sums |
Unlimited |
|
|
71-85 |
Aa |
Possesses adequate working capital. No caution needed for credit
transaction. It has above average (strong) capability for payment of interest
and principal sums |
Large |
|
|
56-70 |
A |
Financial & operational base are regarded healthy. General
unfavourable factors will not cause fatal effect. Satisfactory capability for
payment of interest and principal sums |
Fairly Large |
|
|
41-55 |
Ba |
Overall operation is considered normal. Capable to meet normal
commitments. |
Satisfactory |
|
|
26-40 |
B |
Capability to overcome financial difficulties seems comparatively
below average. |
Small |
|
|
11-25 |
Ca |
Adverse factors are apparent. Repayment of interest and principal sums
in default or expected to be in default upon maturity |
Limited with
full security |
|
|
<10 |
C |
Absolute credit risk exists. Caution needed to be exercised |
Credit not
recommended |
|
|
-- |
NB |
New Business |
-- |
|
This score serves as a reference to assess
SC’s credit risk and to set the amount of credit to be extended. It is
calculated from a composite of weighted scores obtained from each of the major sections
of this report. The assessed factors and their relative weights (as indicated
through %) are as follows:
Financial
condition (40%) Ownership
background (20%) Payment
record (10%)
Credit history
(10%) Market trend (10%) Operational size
(10%)
This report is issued at your request without any
risk and responsibility on the part of MIRA INFORM PRIVATE LIMITED (MIPL)
or its officials.