MIRA INFORM REPORT
|
Report No. : |
349134 |
|
Report Date : |
18.11.2015 |
IDENTIFICATION DETAILS
|
Name : |
V.K. CONSTRUCTION |
|
|
|
|
Registered
Office : |
Rajyog Renuka Nagar, Lane No. 1,
Pune-Bangalore Highway, Warje, Pune – 411058, Maharashtra |
|
Mob. No.: |
91-9881012210 [Mr. Vipul Kantilal Thorat] |
|
|
|
|
Country : |
India |
|
|
|
|
Financials (as
on) : |
31.03.2015 |
|
|
|
|
Date of
Establishment : |
13.03.2007 |
|
|
|
|
Capital
Investment : |
Rs. 4.182 Million |
|
|
|
|
IEC No.: |
Not Available |
|
|
|
|
PAN No.: [Permanent Account No.] |
AFJPT4336E |
|
|
|
|
Legal Form : |
Sole Proprietary Concern |
|
|
|
|
Line of Business
: |
Subject act as a Government Building Contractor. |
|
|
|
|
No. of Employees
: |
2 (Approximately) |
RATING & COMMENTS
|
MIRA’s Rating : |
Ba (50) |
|
RATING |
STATUS |
PROPOSED CREDIT LINE |
|
|
41-55 |
Ba |
Overall operation is considered normal. Capable to meet normal
commitments. |
Satisfactory |
|
Status : |
Satisfactory |
|
|
|
|
Payment Behaviour : |
Slow but correct |
|
|
|
|
Litigation : |
Clear |
|
|
|
|
Comments : |
Subject is an established proprietary concern started in the year 2007
having satisfactory track record. Subject act as a Government Building Contractor. The concern is performing well. General financial position of the
concern is sound. Trade relations are reported as fair. Business is active. Payment
terms are reported as slow but correct. The concern can be considered normal for business dealings at usual
trade terms and conditions. |
NOTES :
Any query related to this report can be made
on e-mail : infodept@mirainform.com
while quoting report number, name and date.
ECGC Country Risk Classification List – March 31, 2015
|
Country Name |
Previous Rating (31.12.2014) |
Current Rating (31.03.2015) |
|
India |
A1 |
A1 |
|
Risk Category |
ECGC
Classification |
|
Insignificant |
A1 |
|
Low |
A2 |
|
Moderate |
B1 |
|
High |
B2 |
|
Very High |
C1 |
|
Restricted |
C2 |
|
Off-credit |
D |
EXTERNAL AGENCY RATING
NOT AVAILABLE
RBI DEFAULTERS’ LIST STATUS
Subject’s name is not enlisted as a defaulter
in the publicly available RBI Defaulters’ list.
EPF (Employee Provident Fund) DEFAULTERS’ LIST STATUS
Subject’s name is not enlisted as a defaulter
in the publicly available EPF (Employee Provident Fund) Defaulters’ list as of
31-03-2015.
INFORMATION PARTED BY
|
Name : |
Mr. Vipul Kantilal Thorat |
|
Designation : |
Proprietor |
|
Contact No.: |
91-9881012210 |
|
Date : |
16.11.2015 |
LOCATIONS
|
Registered Office : |
Rajyog Renuka Nagar, Lane No. 1,
Pune-Bangalore Highway, Warje, Pune – 411058, Maharashtra, India |
|
Tel. No.: |
Not Available |
|
Mobile No.: |
91-9881012210 [Mr. Vipul Kantilal Thorat] |
|
Fax No.: |
Not Available |
|
E-Mail : |
|
|
Area : |
300 Sq. ft. |
|
Location : |
Owned |
SOLE PROPRIETOR
|
Name : |
Mr. Vipul Kantilal Thorat |
|
Designation : |
Proprietor |
|
Address : |
Rajyog Renuka Nagar, Lane No. 1,
Pune-Bangalore Highway, Warje, Pune – 411058, Maharashtra, India |
|
Date of Birth/Age : |
27.06.1985 |
|
Qualification : |
B.E. Civil |
|
Experience : |
10 Years |
|
PAN No.: |
AFJPT4336E |
|
Profile : |
Mr. Vipul Kantilal Thorat, Proprietor of V.K. Constructions is a Class
4 Registered Govt. PMC and PWC Class 5 Civil Contractor since last 8 years. He
is very famous contractor around PMC Pune – 411005. The proprietor desirous
to meet working capital need. All most works order are work in progress but final work will be
awaited. Costly works such as Bitumen and Concreting with civil work,
finishing works to need the money. R.A. bill will be receivable, balance
works and M.B. recorded but payment not realize. He is fit in his line of
experience and activities. He is quiet enthusiastic. He is residing at Rajyog
Renuka Nagar, Lane No. 01, Pune Bangalore Highway, Warje, Pune – 411058. This
is near to work site and thus can devote their full time to the business. As
he has been born and brought up in the same area, they have good developed
lot of relation and contract. He is engaged in the social activities and thus
all the people in the surrounding area know also his works activities since
last 8 years. Good quality of work and service under his work line. |
BUSINESS DETAILS
|
Line of Business : |
Subject act as a Government Building Contractor. |
|
|
|
|
Brand Names : |
-- |
|
|
|
|
Agencies Held : |
-- |
|
|
|
|
Exports : |
-- |
|
|
|
|
Imports : |
-- |
|
|
|
|
Terms : |
|
|
Selling : |
Cash and Credit [30 Days] |
|
|
|
|
Purchasing : |
Cash and Credit [30 Days] |
GENERAL INFORMATION
|
Suppliers : |
· Jinendra Enterprises Plot No. 257/2, S. No. 103/3, Autade, Handewadi, Tal. Haveli, Pune –
411048, Maharashtra, India 91-9970962171 [Mr. Jinendra] [Ringing] · Rupaji Nagaji Bhavani Peth, Pune, Maharashtra, India Mr. Vinod Oswal [91-9822490187]
[Switch Off] · Marble Centre Katraj, Pune, Maharashtra, India |
||||||||||||||||||||||||||||
|
|
|
||||||||||||||||||||||||||||
|
Customers : |
-- |
||||||||||||||||||||||||||||
|
|
|
||||||||||||||||||||||||||||
|
No. of Employees : |
2 (Approximately) |
||||||||||||||||||||||||||||
|
|
|
||||||||||||||||||||||||||||
|
Bankers : |
|
||||||||||||||||||||||||||||
|
|
|
||||||||||||||||||||||||||||
|
Facilities : |
|
||||||||||||||||||||||||||||
|
|
|
|
Auditors : |
|
|
Name : |
Bhutada V. M. and Company Chartered Accountants |
|
Address : |
Sr. No. 143, Shruti House, 1st Floor, Narayan Peth, Pune –
411030, Maharashtra, India |
|
Tel. No.: |
91-20-24441788 |
|
Mobile No.: |
91-9970796333 |
|
E-Mail : |
|
|
|
|
|
Memberships : |
-- |
|
|
|
|
Collaborators : |
-- |
|
|
|
|
Associates/Subsidiaries : |
Not Available |
CAPITAL STRUCTURE
CAPITAL
ACCOUNT AS ON 31.03.2015
|
PARTICULARS |
AMOUNT IN
MILLION |
|
|
|
|
Mr. Vipul K. Thorat Capital |
3.654 |
|
Add: Net Profit |
1.167 |
|
Add: S.B. Interest received |
0.007 |
|
|
-------------- |
|
|
4.828 |
|
Less: Drawing [Other] |
0.347 |
|
Less: Drawing [TDS I. Tax] |
0.299 |
|
|
-------------- |
|
Total |
4.182 |
FINANCIAL DATA
[all figures are
in Rupees Million]
Note : Sole Proprietary and Partnership concerns are
exempted from filing their financials with the Government Authorities or
Registry.
ABRIDGED
BALANCE SHEET
|
SOURCES OF FUNDS |
31.03.2015 |
31.03.2014 |
31.03.2013 |
|
|
SHAREHOLDERS FUNDS |
|
|
|
|
|
1] Capital Account |
4.182 |
2.624 |
0.950 |
|
|
2] Share Application Money |
0.000 |
0.000 |
0.000 |
|
|
3] Reserves & Surplus |
0.000 |
0.000 |
0.000 |
|
|
4] (Accumulated Losses) |
0.000 |
0.000 |
0.000 |
|
|
NETWORTH |
4.182 |
2.624 |
0.950 |
|
|
LOAN FUNDS |
|
|
|
|
|
1] Secured Loans |
0.639 |
0.664 |
0.764 |
|
|
2] Unsecured Loans |
0.000 |
0.000 |
0.000 |
|
|
TOTAL BORROWING |
0.639 |
0.664 |
0.764 |
|
|
DEFERRED TAX LIABILITIES |
0.000 |
0.000 |
0.000 |
|
|
|
|
|
|
|
|
TOTAL |
4.821 |
3.288 |
1.714 |
|
|
|
|
|
|
|
|
APPLICATION OF
FUNDS |
|
|
|
|
|
|
|
|
|
|
|
FIXED ASSETS [Net Block] |
0.086 |
0.102 |
0.120 |
|
|
Capital work-in-progress |
0.000 |
0.000 |
0.000 |
|
|
|
|
|
|
|
|
INVESTMENT |
0.451 |
0.283 |
0.284 |
|
|
DEFERRED TAX ASSETS |
0.000 |
0.000 |
0.000 |
|
|
|
|
|
|
|
|
CURRENT ASSETS, LOANS & ADVANCES |
|
|
|
|
|
|
Inventories |
0.000
|
0.000 |
0.000 |
|
|
Sundry Debtors |
5.013
|
2.673 |
0.667 |
|
|
Cash & Bank Balances |
0.527
|
0.183 |
0.323 |
|
|
Other Current Assets |
0.000
|
0.000 |
0.000 |
|
|
Loans & Advances |
1.412
|
0.939 |
1.182 |
|
Total
Current Assets |
6.952
|
3.795 |
2.172 |
|
|
Less :
CURRENT LIABILITIES & PROVISIONS |
|
|
|
|
|
|
Sundry Creditors |
2.601
|
0.841 |
0.843 |
|
|
Other Current Liabilities |
0.000
|
0.000 |
0.000 |
|
|
Provisions |
0.067
|
0.051 |
0.019 |
|
Total
Current Liabilities |
2.668
|
0.892 |
0.862 |
|
|
Net Current Assets |
4.284
|
2.903 |
1.310 |
|
|
|
|
|
|
|
|
MISCELLANEOUS EXPENSES |
0.000 |
0.000 |
0.000 |
|
|
|
|
|
|
|
|
TOTAL |
4.821 |
3.288 |
1.714 |
|
PROFIT
& LOSS ACCOUNT
|
|
PARTICULARS |
31.03.2015 |
31.03.2014 |
31.03.2013 |
|
|
|
SALES |
|
|
|
|
|
|
|
Contract Receipt |
13.521 |
10.038 |
3.687 |
|
|
|
Other Income |
0.000 |
0.000 |
0.000 |
|
|
|
TOTAL |
13.521 |
10.038 |
3.687 |
|
|
|
|
|
|
|
|
Less |
EXPENSES |
|
|
|
|
|
|
|
Purchase |
4.997 |
1.374 |
0.921 |
|
|
|
Labour Expenses |
3.552 |
4.604 |
0.000 |
|
|
|
Other Expenses [W.C.] |
0.550 |
0.507 |
0.000 |
|
|
|
Site Expenses |
0.414 |
0.364 |
0.000 |
|
|
|
Water Expenses |
0.200 |
0.128 |
0.000 |
|
|
|
Bank Charges and Interest |
0.119 |
0.120 |
0.137 |
|
|
|
Conveyance Expenses |
0.207 |
0.225 |
0.014 |
|
|
|
Hiring Expenses |
0.148 |
0.133 |
0.000 |
|
|
|
Office Expenses |
0.159 |
0.209 |
0.020 |
|
|
|
Other Expenses |
0.044 |
0.224 |
0.055 |
|
|
|
Repairs and Maintenance |
0.326 |
0.305 |
0.078 |
|
|
|
Salary to Staff |
0.354 |
0.336 |
0.215 |
|
|
|
Sales Tax (Vat) |
0.636 |
0.313 |
0.138 |
|
|
|
Other Expenses |
0.633 |
0.322 |
1.756 |
|
|
|
TOTAL |
12.339 |
9.164 |
3.334 |
|
|
|
|
|
|
|
|
|
PROFIT
BEFORE DEPRECIATION AND AMORTISATION |
1.182 |
0.874 |
0.353 |
|
|
|
|
|
|
|
|
|
Less/ Add |
DEPRECIATION/ AMORTISATION |
0.015 |
0.018 |
0.021 |
|
|
|
|
|
|
|
|
|
|
NET PROFIT |
1.167 |
0.856 |
0.332 |
|
KEY
RATIOS
|
PARTICULARS |
|
31.03.2015 |
31.03.2014 |
31.03.2013 |
|
Net Profit Margin (PAT / Sales) |
(%) |
8.63
|
8.53 |
9.00 |
|
|
|
|
|
|
|
Return on Total Assets (PBT/Total Assets} |
(%) |
16.58
|
21.97 |
14.49 |
|
|
|
|
|
|
|
Return on Investment (ROI) (PBT/Networth) |
|
0.28
|
0.33 |
0.35 |
|
|
|
|
|
|
|
Debt Equity Ratio (Total Liability/Networth) |
|
0.15
|
0.25 |
0.80 |
|
|
|
|
|
|
|
Current Ratio (Current Asset/Current Liability) |
|
2.61
|
4.25 |
2.52 |
FINANCIAL ANALYSIS
[all figures are
in Rupees Million]
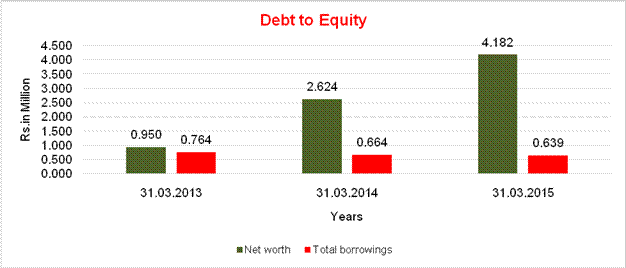
DEBT EQUITY RATIO
|
Particulars |
31.03.2013 |
31.03.2014 |
31.03.2015 |
|
|
(Rs.
In Million) |
(Rs.
In Million) |
(Rs.
In Million) |
|
Capital Account |
0.950 |
2.624 |
4.182 |
|
Reserves & Surplus |
0.000 |
0.000 |
0.000 |
|
Net
worth |
0.950 |
2.624 |
4.182 |
|
|
|
|
|
|
Long-term borrowings |
0.764 |
0.664 |
0.639 |
|
Short term borrowings |
0.000 |
0.000 |
0.000 |
|
Total
borrowings |
0.764 |
0.664 |
0.639 |
|
Debt/Equity ratio |
0.804 |
0.253 |
0.153 |
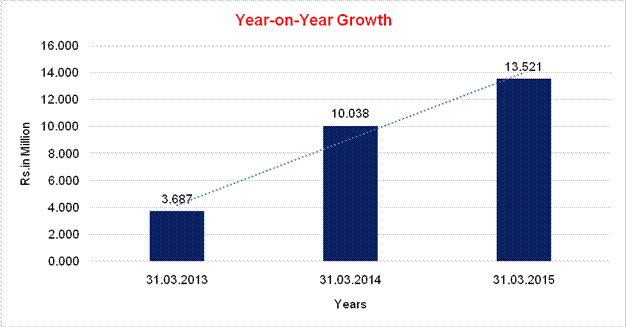
YEAR-ON-YEAR GROWTH
|
Year on Year Growth |
31.03.2013 |
31.03.2014 |
31.03.2015 |
|
|
(Rs.
In Million) |
(Rs.
In Million) |
(Rs.
In Million) |
|
Contract Receipt |
3.687 |
10.038 |
13.521 |
|
|
|
172.254 |
34.698 |
NET PROFIT MARGIN
|
Net Profit Margin |
31.03.2013 |
31.03.2014 |
31.03.2015 |
|
|
(Rs.
In Million) |
(Rs.
In Million) |
(Rs.
In Million) |
|
Contract Receipt |
3.687 |
10.038 |
13.521 |
|
Profit |
0.332 |
0.856 |
1.167 |
|
|
9.00% |
8.53% |
8.63% |
LOCAL AGENCY FURTHER INFORMATION
|
Sr. No. |
Check list by
info agents |
Available in
Report (Yes/No) |
|
1 |
Year of establishment |
Yes |
|
2 |
Constitution of the entity -Incorporation
details |
Yes |
|
3 |
Locality of the entity |
Yes |
|
4 |
Premises details |
Yes |
|
5 |
Buyer visit details |
-- |
|
6 |
Contact numbers |
Yes |
|
7 |
Name of the person contacted |
Yes |
|
8 |
Designation of contact person |
Yes |
|
9 |
Promoter’s background |
Yes |
|
10 |
Date of Birth of Proprietor / Partners /
Directors |
Yes |
|
11 |
Pan Card No. of Proprietor / Partners |
Yes |
|
12 |
Voter Id Card No. of Proprietor / Partners |
No |
|
13 |
Type of business |
Yes |
|
14 |
Line of Business |
Yes |
|
15 |
Export/import details (if applicable) |
No |
|
16 |
No. of employees |
Yes |
|
17 |
Details of sister concerns |
No |
|
18 |
Major suppliers |
Yes |
|
19 |
Major customers |
No |
|
20 |
Banking Details |
Yes |
|
21 |
Banking facility details |
Yes |
|
22 |
Conduct of the banking account |
Yes |
|
23 |
Financials, if provided |
Yes |
|
24 |
Capital in the business |
Yes |
|
25 |
Last accounts filed at ROC, if applicable |
Yes |
|
26 |
Turnover of firm for last three years |
Yes |
|
27 |
Reasons for variation <> 20% |
-- |
|
28 |
Estimation for coming financial year |
Yes |
|
29 |
Profitability for last three years |
Yes |
|
30 |
Major shareholders, if available |
No |
|
31 |
External Agency Rating, if available |
No |
|
32 |
Litigations that the firm/promoter
involved in |
-- |
|
33 |
Market information |
-- |
|
34 |
Payments terms |
Yes |
|
35 |
Negative Reporting by Auditors in the
Annual Report |
No |
------------------------------------------------------------------------------------------------------------------------------
TENTITIVE BALANCE SHEET
[RS. IN MILLION]
|
SOURCES OF FUNDS |
|
|
31.03.2016 |
|
|
SHAREHOLDERS FUNDS |
|
|
|
|
|
1] Capital Account |
|
|
5.195 |
|
|
2] Share Application Money |
|
|
0.000 |
|
|
3] Reserves & Surplus |
|
|
0.000 |
|
|
4] (Accumulated Losses) |
|
|
0.000 |
|
|
NETWORTH |
|
|
5.195 |
|
|
LOAN FUNDS |
|
|
|
|
|
1] Secured Loans |
|
|
3.641 |
|
|
2] Unsecured Loans |
|
|
0.000 |
|
|
TOTAL BORROWING |
|
|
3.641 |
|
|
DEFERRED TAX LIABILITIES |
|
|
0.000 |
|
|
|
|
|
|
|
|
TOTAL |
|
|
8.836 |
|
|
|
|
|
|
|
|
APPLICATION OF
FUNDS |
|
|
|
|
|
|
|
|
|
|
|
FIXED ASSETS [Net Block] |
|
|
0.881 |
|
|
Capital work-in-progress |
|
|
0.000 |
|
|
|
|
|
|
|
|
INVESTMENT |
|
|
0.451 |
|
|
DEFERRED TAX ASSETS |
|
|
0.000 |
|
|
|
|
|
|
|
|
CURRENT ASSETS, LOANS & ADVANCES |
|
|
|
|
|
|
Inventories |
|
|
1.015 |
|
|
Sundry Debtors |
|
|
8.129 |
|
|
Cash & Bank Balances |
|
|
0.258 |
|
|
Other Current Assets |
|
|
0.000 |
|
|
Loans & Advances |
|
|
1.412 |
|
Total
Current Assets |
|
|
10.814 |
|
|
Less :
CURRENT LIABILITIES & PROVISIONS |
|
|
|
|
|
|
Sundry Creditors |
|
|
2.878 |
|
|
Other Current Liabilities |
|
|
0.000 |
|
|
Provisions |
|
|
0.432 |
|
Total
Current Liabilities |
|
|
3.310 |
|
|
Net Current Assets |
|
|
7.504 |
|
|
|
|
|
|
|
|
MISCELLANEOUS EXPENSES |
|
|
0.000 |
|
|
|
|
|
|
|
|
TOTAL |
|
|
8.836 |
|
------------------------------------------------------------------------------------------------------------------------------
TENTITIVE PROFIT & LOSS ACCOUNT
[RS. IN MILLION]
|
|
PARTICULARS |
|
|
31.03.2016 |
|
|
|
SALES |
|
|
|
|
|
|
|
Contract Receipts |
|
|
15.555 |
|
|
|
Other Income |
|
|
0.000 |
|
|
|
TOTAL (A) |
|
|
15.555 |
|
|
|
|
|
|
|
|
Less |
EXPENSES |
|
|
|
|
|
|
|
Purchase |
|
|
5.755 |
|
|
|
Direct Expenses |
|
|
6.217 |
|
|
|
Conveyance Expenses |
|
|
0.219 |
|
|
|
Hiring Expenses |
|
|
0.211 |
|
|
|
Office Expenses |
|
|
0.170 |
|
|
|
Other Expenses |
|
|
0.066 |
|
|
|
Repairs and Maintenance |
|
|
0.381 |
|
|
|
Salary paid |
|
|
0.380 |
|
|
|
Transport Expenses |
|
|
0.191 |
|
|
|
Sales Tax (Vat) |
|
|
0.579 |
|
|
|
Other Expenses |
|
|
0.169 |
|
|
|
Work in Progress |
|
|
(1.015) |
|
|
|
TOTAL (B) |
|
|
13.323 |
|
|
|
|
|
|
|
|
|
PROFIT
BEFORE INTEREST, TAX, DEPRECIATION AND AMORTISATION (A-B) (C) |
|
|
2.232 |
|
|
|
|
|
|
|
|
|
Less |
FINANCIAL
EXPENSES (D) |
|
|
0.332 |
|
|
|
|
|
|
|
|
|
|
PROFIT
BEFORE TAX, DEPRECIATION AND AMORTISATION (C-D) (E) |
|
|
1.900 |
|
|
|
|
|
|
|
|
|
Less/ Add |
DEPRECIATION/
AMORTISATION (F) |
|
|
0.155 |
|
|
|
|
|
|
|
|
|
|
PROFIT BEFORE
TAX (E-F) (G) |
|
|
1.745 |
|
|
|
|
|
|
|
|
|
Less |
TAX (H) |
|
|
0.383 |
|
|
|
|
|
|
|
|
|
|
PROFIT AFTER TAX
(G-H) (I) |
|
|
1.362 |
|
------------------------------------------------------------------------------------------------------------------------------
PERFORMANCE AND FINANCIAL INDICATORS
[RS. IN MILLION]
|
PARTICULARS |
2015-16 Estimated |
2016-17 Projection |
2017-18 Projection |
|
|
|
|
|
|
(a) Paid up Capital |
3.832 |
4.795 |
5.955 |
|
|
|
|
|
|
(b) Net Worth |
5.195 |
6.455 |
8.007 |
|
Less: Revaluation Reserves and Intangibles |
0.000 |
0.000 |
0.000 |
|
Tangibles Net Worth |
5.195 |
6.455 |
8.007 |
|
|
|
|
|
|
(c) Investment in subsidiaries/associates/
Fin. Instruments |
0.450 |
0.450 |
0.450 |
|
|
|
|
|
|
(d) Net Sales (Percentage increase over previous year) |
15.555 15.04% |
18.355 18.00% |
22.027 20.00% |
|
|
|
|
|
|
(e) Other income from |
0.000 |
0.000 |
0.000 |
|
(i) |
|
|
|
|
(ii) |
|
|
|
|
(iii) |
|
|
|
|
|
|
|
|
|
(f) Gross Profit |
1.900 |
2.268 |
2.664 |
|
|
|
|
|
|
(g) Depreciation |
0.156 |
0.132 |
0.112 |
|
|
|
|
|
|
(h) Tax |
0.383 |
0.475 |
0.500 |
|
|
|
|
|
|
(i) Net Profit/Loss |
1.362 |
1.661 |
2.052 |
|
|
|
|
|
|
(j)
Dividend |
0.000 |
0.000 |
0.000 |
|
Percentage |
0% |
0% |
0% |
|
|
|
|
|
|
(k) Fixed Assets |
0.881 |
0.749 |
0.637 |
|
|
|
|
|
|
(l) Contingent Liabilities not provided for |
-- |
-- |
-- |
------------------------------------------------------------------------------------------------------------------------------
FINANCIAL RATIO
[RS. IN MILLION]
|
PARTICULARS |
2015-16 Estimated |
2016-17 Projection |
2017-18 Projection |
|
|
|
|
|
|
(a) Current Ratio |
1.71 |
1.84 |
1.97 |
|
|
|
|
|
|
(b) Total Debt Equity Ratio |
1.34 |
1.16 |
1.01 |
|
|
|
|
|
|
(c) Gross profit/Net Sales (%) |
12.22 |
12.36 |
12.09 |
|
|
|
|
|
|
(d) Interest Coverage Ratio |
5.57 |
5.27 |
6.15 |
|
|
|
|
|
|
(e) Debt Service Coverage Ratio |
2.10 |
4.44 |
5.10 |
|
|
|
|
|
|
(f) Dividend/ Cash Accruals (%) |
0.00 |
0.00 |
0.00 |
|
|
|
|
|
|
(g) Investment in Subsidiaries/TNW (%) |
8.67 |
6.98 |
5.63 |
|
|
|
|
|
|
(h) Net Profit-Appropriations/ Net Interest
Liability |
-- |
-- |
-- |
------------------------------------------------------------------------------------------------------------------------------
ASSESSMENT OF WORKING CAPITAL REQUIREMENTS
OPERATING STATEMENT
(RS. IN MILLION)
|
PARTICULARS |
2015-16 Estimated |
2016-17 Projection |
2017-18 Projection |
|
|
|
|
|
|
Gross Sales (net of returns) |
|
|
|
|
Domestic Sales |
15.555 |
18.355 |
22.027 |
|
Export Sales |
0.000 |
0.000 |
0.000 |
|
Job-Work |
0.000 |
0.000 |
0.000 |
|
|
|
|
|
|
TOTAL |
15.555 |
18.355 |
22.027 |
|
|
|
|
|
|
Less: Excise Duty/ Sales Tax |
0.000 |
0.000 |
0.000 |
|
|
|
|
|
|
Net Sales
(1-2) |
15.555 |
18.355 |
22.027 |
|
|
|
|
|
|
%age rise or fall in Net sales as compared
to the previous year |
15.04 |
18.00 |
20.00 |
|
|
|
|
|
|
Cost of Sales: |
|
|
|
|
i) Raw Material Consumption |
|
|
|
|
Imported |
0.000 |
0.000 |
0.000 |
|
Indigenous |
5.755 |
6.791 |
8.150 |
|
ii) Stores, Spares and Consumables |
|
|
|
|
Imported |
0.000 |
0.000 |
0.000 |
|
Indigenous |
0.000 |
0.000 |
0.000 |
|
|
|
|
|
|
Power, Fuel and Water |
0.000 |
0.000 |
0.000 |
|
Direct Labour and Other Expenses |
4.351 |
4.956 |
5.947 |
|
Other Manufacturing Expenses |
1.867 |
2.205 |
2.645 |
|
Depreciation |
0.156 |
0.132 |
0.112 |
|
Sub total (i to vi) |
12.128 |
14.085 |
16.855 |
|
Add: Opening Stock-in-process |
0.000 |
1.015 |
2.091 |
|
Sub total |
12.128 |
15.101 |
18.946 |
|
Less: Closing Stock-in-process |
1.015 |
2.091 |
3.240 |
|
Subtotal
(Cost of Production) |
11.113 |
13.010 |
15.705 |
|
% to Net Sales |
71.44 |
70.88 |
71.30 |
|
|
|
|
|
|
Add: Opening stock of finished goods |
0.000 |
0.000 |
0.000 |
|
Subtotal |
11.113 |
13.010 |
15.705 |
|
Less: Closing stock of finished goods |
0.000 |
0.000 |
0.000 |
|
Subtotal
(Cost of Sales) |
11.113 |
13.010 |
15.705 |
|
% to Net Sales |
71.44 |
70.88 |
71.30 |
|
|
|
|
|
|
Selling, general and Administrative Expenses |
2.366 |
2.790 |
3.350 |
|
Subtotal (5+6) |
13.478 |
15.800 |
19.055 |
|
|
|
|
|
|
Operating Profit before Interest (3-7) |
2.077 |
2.556 |
2.972 |
|
|
|
|
|
|
Interest and Lease Rent |
0.332 |
0.420 |
0.420 |
|
|
|
|
|
|
Operating Profit after Interest (8-9) |
1.745 |
2.136 |
2.552 |
|
|
|
|
|
|
Other Income/ (Expenses) |
0.000 |
0.000 |
0.000 |
|
|
|
|
|
|
Transferred to Deferred Revenue Expenses |
0.000 |
0.000 |
0.000 |
|
|
|
|
|
|
Deferred Revenue Expenditure Written Off |
0.000 |
0.000 |
0.000 |
|
|
|
|
|
|
Profit Before Tax |
1.745 |
2.136 |
2.552 |
|
|
|
|
|
|
Provision for Taxes |
0.383 |
0.475 |
0.500 |
|
|
|
|
|
|
Net Profit (14-15) |
1.362 |
1.661 |
2.052 |
|
|
|
|
|
|
Equity Dividend Paid |
0.000 |
0.000 |
0.000 |
|
Rate of Dividend (%) |
0% |
0% |
0% |
|
|
|
|
|
|
Retained Profit (16-17) |
1.362 |
1.661 |
2.052 |
|
|
|
|
|
|
Retained Profit/ Net Profit/ (%) |
100% |
100% |
100% |
|
|
|
|
|
|
Cash Accruals (14+5(vi) + 13) |
1.518 |
1.793 |
2.164 |
------------------------------------------------------------------------------------------------------------------------------
ANALYSIS OF BALANCE SHEET
(RS. IN MILLION)
|
PARTICULARS |
2015-16 Estimated |
2016-17 Projection |
2017-18 Projection |
|
|
|
|
|
|
LIABILITIES |
|
|
|
|
|
|
|
|
|
Current Liabilities |
|
|
|
|
Short term borrowings from Banks |
|
|
|
|
Bank of Maharashtra |
0.000 |
0.000 |
0.000 |
|
Bank of India – CC Required |
3.000 |
3.000 |
3.000 |
|
Indian Overseas bank |
0.000 |
0.000 |
0.000 |
|
Bank of Baroda |
0.000 |
0.000 |
0.000 |
|
Central Bank of India |
0.000 |
0.000 |
0.000 |
|
Bills Discounted |
0.000 |
0.000 |
0.000 |
|
Bills Discounted outside MPBF |
0.000 |
0.000 |
0.000 |
|
Interest accrued and due |
0.000 |
0.000 |
0.000 |
|
Sub-total
(A) |
3.000 |
3.000 |
3.000 |
|
|
|
|
|
|
Short term borrowings from others |
0.000 |
0.000 |
0.000 |
|
Sundry Creditors (trade) |
2.878 |
3.396 |
4.075 |
|
Advance payment from customers/ deposit from
Dealers |
0.000 |
0.000 |
0.000 |
|
Net Tax Liability |
0.000 |
0.000 |
0.000 |
|
Dividend Payable |
0.000 |
0.000 |
0.000 |
|
Other Statutory Liabilities (due within one
year) |
0.000 |
0.000 |
0.000 |
|
Deposits/Term Loan Instt./ Debentures/DPGs
maturing within one year |
0.000 |
0.000 |
0.000 |
|
|
|
|
|
|
Other Current Liabilities and Provisions
(due within one year) |
0.433 |
0.525 |
0.550 |
|
(Specify major items separately) |
|
|
|
|
Creditors for Capital Goods |
0.000 |
0.000 |
0.000 |
|
Liability for Expenses |
0.000 |
0.000 |
0.000 |
|
Interest charges accrued and due |
0.000 |
0.000 |
0.000 |
|
Interest accrued but not due |
0.000 |
0.000 |
0.000 |
|
Sub-total (B) |
3.310 |
3.921 |
4.625 |
|
|
|
|
|
|
Total Current Liabilities (1 to 9) |
6.310 |
6.921 |
7.625 |
|
|
|
|
|
|
Term Liabilities |
|
|
|
|
Debentures |
0.000 |
0.000 |
0.000 |
|
Preference Shares (redeemable after 1 year) |
0.000 |
0.000 |
0.000 |
|
Term Loans – Bank of India |
0.641 |
0.563 |
0.476 |
|
Deposits/ Term Loan
Installment/Debentures/DPG maturing within 1 year |
0.000 |
0.000 |
0.000 |
|
Deferred Payment Credits [excluding
installments payable within 1 year] |
0.000 |
0.000 |
0.000 |
|
Term Deposits (repayable after 1 year) |
0.000 |
0.000 |
0.000 |
|
Other Term Liabilities:- Unsecured Loan |
0.000 |
0.000 |
0.000 |
|
Interest-free long term loan under incentive
scheme of Govt of Maharashtra |
0.000 |
0.000 |
0.000 |
|
Total Term Liabilities |
0.641 |
0.563 |
0.476 |
|
|
|
|
|
|
Total Outside Liabilities (Item 10 plus 17) |
6.951 |
7.483 |
8.101 |
|
|
|
|
|
|
Non Current Liabilities |
0.000 |
0.000 |
0.000 |
|
|
|
|
|
|
Net Worth |
|
|
|
|
Ordinary Share Capital |
3.832 |
4.795 |
5.955 |
|
Advance against share capital |
0.000 |
0.000 |
0.000 |
|
A) Interest-free long term loan under
incentive scheme of Govt of Maharashtra |
|
|
|
|
Capital Reserve |
0.000 |
0.000 |
0.000 |
|
General Reserve |
0.000 |
0.000 |
0.000 |
|
Revaluation Reserve |
0.000 |
0.000 |
0.000 |
|
Other Reserve (excluding provisions) |
0.000 |
0.000 |
0.000 |
|
Preference Share/quasi equity |
0.000 |
0.000 |
0.000 |
|
Surplus/Deficit in P & L a/c |
1.362 |
1.661 |
2.052 |
|
Net worth |
5.195 |
6.455 |
8.007 |
|
|
|
|
|
|
TOTAL LIABILITIES (18+26) |
12.146 |
13.938 |
16.107 |
|
|
|
|
|
|
ASSETS |
|
|
|
|
|
|
|
|
|
Current Assets |
|
|
|
|
Cash and Bank Balances |
0.258 |
0.283 |
0.309 |
|
Investments (other than long term
investments, eg sinking fund etc) |
0.000 |
0.000 |
0.000 |
|
Govt and other trustee securities |
0.093 |
0.093 |
0.093 |
|
Fixed deposits with banks and Others |
1.319 |
1.319 |
1.319 |
|
Receivables |
8.128 |
8.953 |
10.059 |
|
Export Receivables |
0.000 |
0.000 |
0.000 |
|
Installments of deferred receivables (due
within year) |
0.000 |
0.000 |
0.000 |
|
Inventory |
|
|
|
|
Raw Material |
|
|
|
|
Imported |
0.000 |
0.000 |
0.000 |
|
Indigenous |
0.000 |
0.000 |
0.000 |
|
Stock in progress (WIP) |
1.015 |
2.091 |
3.240 |
|
Finished Goods |
0.000 |
0.000 |
0.000 |
|
Other consumable spares |
0.000 |
0.000 |
0.000 |
|
|
|
|
|
|
Advance to suppliers of raw material and
stores/ spare consumables |
0.000 |
0.000 |
0.000 |
|
Advance payment of tax/ Excise |
0.000 |
0.000 |
0.000 |
|
TDS |
0.000 |
0.000 |
0.000 |
|
Advance against Technical knowhow |
0.000 |
0.000 |
0.000 |
|
Other current assets (Loans and advances) |
0.000 |
0.000 |
0.000 |
|
|
|
|
|
|
Total Current Assets |
10.814 |
12.739 |
15.020 |
|
|
|
|
|
|
Fixed Assets |
|
|
|
|
Gross Block (Land and Building, Machinery,
Construction in progress etc) |
0.087 |
0.881 |
0.749 |
|
Advances to suppliers of capital goods and
capital expenditure |
0.950 |
0.000 |
0.000 |
|
Depreciation to date |
0.156 |
0.132 |
0.112 |
|
Net Block (37+38-39) |
0.881 |
0.749 |
0.637 |
|
|
|
|
|
|
Other Non-Current Assets |
|
|
|
|
Investment etc. which are not current assets |
|
|
|
|
Investments |
0.450 |
0.450 |
0.450 |
|
Others and affiliates*** Overdue Debtors |
0.000 |
0.000 |
0.000 |
|
Advance to suppliers of capital goods and
capital expenditure |
0.000 |
0.000 |
0.000 |
|
Others (F.D. with banks and others) |
0.000 |
0.000 |
0.000 |
|
Non consumable stores and spares |
0.000 |
0.000 |
0.000 |
|
Other misc. assets include dues from directors |
0.000 |
0.000 |
0.000 |
|
Total Other Non-Current Assets (41 to 43) |
0.450 |
0.450 |
0.450 |
|
|
|
|
|
|
Intangible Assets and Deferred Revenue
Expenditure |
0.000 |
0.000 |
0.000 |
|
|
|
|
|
|
TOTAL ASSETS (36+40+44+45) |
12.145 |
13.938 |
16.107 |
|
|
|
|
|
|
Tangible Networth |
5.195 |
6.455 |
8.007 |
|
|
|
|
|
|
Liabilities – Assets (should be equal to 0) |
0.000 |
0.000 |
0.000 |
------------------------------------------------------------------------------------------------------------------------------
RATIO ANALYSIS
(RS. IN MILLION)
|
PARTICULARS |
2015-16 Estimated |
2016-17 Projection |
2017-18 Projection |
|
|
|
|
|
|
Liquidity Ratios |
|
|
|
|
Current Ratio |
1.71 |
1.84 |
1.97 |
|
Current Ratio considering term liabilities
maturing within 1 year as current |
1.71 |
1.84 |
1.97 |
|
Net Working Capital |
4.504 |
5.818 |
7.395 |
|
Bank Finance to WC Gap |
0.67 |
0.52 |
0.41 |
|
Bank Finance to Current Liabilities |
0.48 |
0.43 |
0.39 |
|
|
|
|
|
|
Investment Ratios |
|
|
|
|
Return on Investment (PBIT/ Investment) |
34.67 |
35.74 |
34.57 |
|
Return on Equity |
26.22 |
25.73 |
25.62 |
|
|
|
|
|
|
Profitability Ratios |
|
|
|
|
Gross Operating Margin |
11.89 |
12.06 |
11.73 |
|
Net Operating margin |
8.76 |
9.05 |
9.31 |
|
Raw Material to COP |
51.79 |
52.20 |
51.89 |
|
Stores and Spares to COP |
0.00 |
0.00 |
0.00 |
|
Power, Fuel and Water to COP |
0.00 |
0.00 |
0.00 |
|
Direct Labour to COP |
39.15 |
38.10 |
37.87 |
|
Other Manufacturing Expenses to COP |
16.80 |
16.95 |
16.84 |
|
Selling, general and Administrative Expenses
to Sales |
17.55 |
17.66 |
17.58 |
|
Interest to Sales |
2.14 |
2.29 |
1.91 |
|
|
|
|
|
|
Leverage Ratios |
|
|
|
|
Long Term Debt-Equity Ratio |
0.12 |
0.09 |
0.06 |
|
Total Debt-Equity Ratio |
1.34 |
1.16 |
1.01 |
|
Interest Coverage Ratio |
5.57 |
5.27 |
6.15 |
|
DSCR |
2.10 |
4.44 |
5.10 |
|
|
|
|
|
|
Turnover Ratios |
|
|
|
|
Inventory Turnover Ratio |
9.14 |
16.07 |
20.63 |
|
Receivables Turnover Ratio |
52.25 |
48.77 |
45.67 |
|
Interest/ All Loans |
4.78 |
5.61 |
5.18 |
|
Average Collection Period |
162 |
151 |
142 |
------------------------------------------------------------------------------------------------------------------------------
COMPARATIVE STATEMENT OF CURRENT ASSETS
& CURRENT LIABILITIES
(RS. IN MILLION)
|
PARTICULARS |
2015-16 Estimated |
2016-17 Projection |
2017-18 Projection |
|
|
|
|
|
|
CURRENT ASSETS |
|
|
|
|
Raw materials |
|
|
|
|
(a) Imported |
0.000 |
0.000 |
0.000 |
|
Months consumption |
0.00 |
0.00 |
0.00 |
|
|
|
|
|
|
(b) Indigenous |
0.000 |
0.000 |
0.000 |
|
Months consumption |
0.00 |
0.00 |
0.00 |
|
|
|
|
|
|
Other consumable spares |
0.000 |
0.000 |
0.000 |
|
Months consumption |
0.00 |
0.00 |
0.00 |
|
|
|
|
|
|
Stocks in progress |
1.015 |
2.091 |
3.240 |
|
Months cost of production |
0.00 |
0.00 |
0.00 |
|
|
|
|
|
|
Finished Goods |
0.000 |
0.000 |
0.000 |
|
Months cost of Sales |
0.00 |
0.00 |
0.00 |
|
|
|
|
|
|
(i)
Receivables other than export and deferred receivables including bills
purchased/ discounted by banks |
8.128 |
8.953 |
10.059 |
|
Months domestic sales |
0.00 |
0.00 |
0.00 |
|
|
|
|
|
|
(ii) Export Receivables |
0.000 |
0.000 |
0.000 |
|
Months export sales |
0.00 |
0.00 |
0.00 |
|
|
|
|
|
|
Advance to suppliers of raw material and
stores/spares and consumables |
0.000 |
0.000 |
0.000 |
|
|
|
|
|
|
Other Current Assets including cash and bank
balances and deferred receivables due within 1 year |
0.258 |
0.283 |
0.309 |
|
|
|
|
|
|
Investment and Bank FDR |
1.412 |
1.412 |
1.412 |
|
|
|
|
|
|
TOTAL CURRENT ASSETS (To agree with item 36 as in form III) |
10.814 |
12.739 |
15.020 |
|
|
|
|
|
|
CURRENT LIABILITIES |
|
|
|
|
Creditors for purchase of raw material and
stones etc. |
2.878 |
3.396 |
4.075 |
|
Months purchase |
0.00 |
0.00 |
0.00 |
|
|
|
|
|
|
Advance from Customers |
0.000 |
0.000 |
0.000 |
|
|
|
|
|
|
Statutory Liabilities |
0.000 |
0.000 |
0.000 |
|
|
|
|
|
|
Other Current Liabilities |
0.433 |
0.525 |
0.550 |
|
|
|
|
|
|
TOTAL CURRENT LIABILITIES (to agree with sub total (B) as in form III) |
3.310 |
3.921 |
4.625 |
------------------------------------------------------------------------------------------------------------------------------
COMPUTATION OF MAXIMUM PERMISSIBLE BANK FINANCE
FOR WORKING CAPITAL
(RS. IN MILLION)
|
PARTICULARS |
2015-16 Estimated |
2016-17 Projection |
2017-18 Projection |
|
|
|
|
|
|
Total Current Assets (9 in form IV) |
10.814 |
12.739 |
15.020 |
|
|
|
|
|
|
Other Current Liabilities (other than Bank
borrowing and Term Loans repayable in 1 year-14 of Form IV-B) |
3.310 |
3.921 |
4.625 |
|
|
|
|
|
|
Working Capital Gap (1-2) |
7.504 |
8.818 |
10.395 |
|
|
|
|
|
|
Minimum stipulated Net WC (25% of Total Current
Assets) |
2.703 |
3.185 |
3.755 |
|
|
|
|
|
|
Actual/ projected Net WC |
4.504 |
5.818 |
7.395 |
|
|
|
|
|
|
Item 3 minus Item 4 |
4.800 |
5.633 |
6.640 |
|
|
|
|
|
|
Item 3 minus Item 5 |
3.000 |
3.000 |
3.000 |
|
|
|
|
|
|
Maximum Permissible Bank Finance (lower of Item 6 or 7 whichever is lower) |
3.000 |
3.000 |
3.000 |
|
|
|
|
|
|
Excess Borrowings (Item 5 – Item 4) |
0 |
0 |
0 |
------------------------------------------------------------------------------------------------------------------------------
COMPANY PROFILE
STATUS OF THE CONTRACTOR
He is Class 4 Registered Govt. PMC and Class 5
of Govt. PWD Civil Contractor Certificates.
The business of civil contractor has been
already big and broad created works in PMC Pune – 411005 around Pune PMC and
PWD area. The Contractor have various works order. Newly speed up at side this
work requires to be completed at the earliest as per work order period, so
contractor needs some working capital to complete the works as early as
possible.
WORK EXPERIENCE
In order to know the intricacies of business
and in order to know the details of the business activities, the style of its
working etc. due to proprietor has gained the rich experience in the field, he
is getting the valuable contract from all sphere of civil construction. He is
responsible for the entire working of the business and was controlling the day
to day work of the business.
SCOPE FOR BUSINESS
In addition to the above entire belt is
developing very fast as PMC and PWD area the nearest Pune City. This also are
the business line activities in this area to which the good bright future. The proprietor
Mr. Vipul K. Thorat fit the capable contractor in this area. Contractor having
good quality of works, capable to complete the work within time span and
complied before tender period.
FINANCIAL OUTLAY
The requirement for meeting working capital
needs under target group and eligibility, purpose, nature of activity, quantum
of limit, appraisal of loan, margin, security etc.
SECURITY OFFERS
The proprietor will offer primary security as
the own business current assets and collateral security such as Flat at
Kothrud.
Secondly hypothecation of debtors, bill
receivable for fund base cash working capital limit and non-fund limit bank
guarantee. Requirement was full fill and its margin also maintains the
proprietor against the work order.
------------------------------------------------------------------------------------------------------------------------------
FIXED ASSETS
· Office Building
· Plant and Machinery
· Vehicles
CMT REPORT (Corruption, Money Laundering & Terrorism]
The Public Notice information has been collected from various sources
including but not limited to: The Courts,
1] INFORMATION ON
DESIGNATED PARTY
No exist designating subject or any of its
beneficial owners, controlling shareholders or senior officers as terrorist or
terrorist organization or whom notice had been received that all financial
transactions involving their assets have been blocked or convicted, found
guilty or against whom a judgement or order had been entered in a proceedings
for violating money-laundering, anti-corruption or bribery or international
economic or anti-terrorism sanction laws or whose assets were seized, blocked,
frozen or ordered forfeited for violation of money laundering or international
anti-terrorism laws.
2] Court Declaration :
No records exist to suggest that subject is
or was the subject of any formal or informal allegations, prosecutions or other
official proceeding for making any prohibited payments or other improper payments
to government officials for engaging in prohibited transactions or with
designated parties.
3] Asset Declaration :
No records exist to suggest that the
property or assets of the subject are derived from criminal conduct or a
prohibited transaction.
4] Record on Financial
Crime :
Charges or conviction
registered against subject: None
5] Records on Violation of
Anti-Corruption Laws :
Charges or
investigation registered against subject: None
6] Records on Int’l
Anti-Money Laundering Laws/Standards :
Charges or
investigation registered against subject: None
7] Criminal Records
No
available information exist that suggest that subject or any of its principals
have been formally charged or convicted by a competent governmental authority
for any financial crime or under any formal investigation by a competent
government authority for any violation of anti-corruption laws or international
anti-money laundering laws or standard.
8] Affiliation with
Government :
No
record exists to suggest that any director or indirect owners, controlling
shareholders, director, officer or employee of the company is a government
official or a family member or close business associate of a Government
official.
9] Compensation Package :
Our
market survey revealed that the amount of compensation sought by the subject is
fair and reasonable and comparable to compensation paid to others for similar
services.
10] Press Report :
No press reports / filings exists on
the subject.
CORPORATE GOVERNANCE
MIRA INFORM as part of its Due Diligence do provide comments on
Corporate Governance to identify management and governance. These factors often
have been predictive and in some cases have created vulnerabilities to credit
deterioration.
Our Governance Assessment focuses principally on the interactions
between a company’s management, its Board of Directors, Shareholders and other
financial stakeholders.
CONTRAVENTION
Subject is not known to have contravened any existing local laws,
regulations or policies that prohibit, restrict or otherwise affect the terms
and conditions that could be included in the agreement with the subject.
FOREIGN EXCHANGE RATES
|
Currency |
Unit
|
Indian Rupees |
|
US Dollar |
1 |
Rs. 65.98 |
|
|
1 |
Rs. 100.11 |
|
Euro |
1 |
Rs. 70.35 |
INFORMATION DETAILS
|
Information
Gathered by : |
SVA |
|
|
|
|
Analysis Done by
: |
DIV |
|
|
|
|
Report Prepared
by : |
BVA |
SCORE & RATING EXPLANATIONS
|
SCORE FACTORS |
RANGE |
POINTS |
|
HISTORY |
1~10 |
6 |
|
PAID-UP CAPITAL |
1~10 |
5 |
|
OPERATING SCALE |
1~10 |
6 |
|
FINANCIAL CONDITION |
|
|
|
--BUSINESS SCALE |
1~10 |
6 |
|
--PROFITABILITY |
1~10 |
6 |
|
--LIQUIDITY |
1~10 |
6 |
|
--LEVERAGE |
1~10 |
5 |
|
--RESERVES |
1~10 |
5 |
|
--CREDIT LINES |
1~10 |
5 |
|
--MARGINS |
-5~5 |
-- |
|
DEMERIT POINTS |
|
|
|
--BANK CHARGES |
YES/NO |
YES |
|
--LITIGATION |
YES/NO |
NO |
|
--OTHER ADVERSE INFORMATION |
YES/NO |
NO |
|
MERIT POINTS |
|
|
|
--SOLE DISTRIBUTORSHIP |
YES/NO |
NO |
|
--EXPORT ACTIVITIES |
YES/NO |
NO |
|
--AFFILIATION |
YES/NO |
NO |
|
--LISTED |
YES/NO |
NO |
|
--OTHER MERIT FACTORS |
YES/NO |
YES |
|
DEFAULTER |
|
|
|
--RBI |
YES/NO |
NO |
|
--EPF |
YES/NO |
NO |
|
TOTAL |
|
50 |
This score serves as a
reference to assess SC’s credit risk and to set the amount of credit to be
extended. It is calculated from a composite of weighted scores obtained from
each of the major sections of this report. The assessed factors and their
relative weights (as indicated through %) are as follows:
Financial
condition (40%) Ownership
background (20%) Payment
record (10%)
Credit history
(10%) Market trend (10%) Operational size
(10%)
RATING EXPLANATIONS
|
RATING |
STATUS |
PROPOSED CREDIT LINE |
|
|
>86 |
Aaa |
Possesses an extremely sound financial base with the strongest
capability for timely payment of interest and principal sums |
Unlimited |
|
71-85 |
Aa |
Possesses adequate working capital. No caution needed for credit transaction.
It has above average (strong) capability for payment of interest and
principal sums |
Large |
|
56-70 |
A |
Financial & operational base are regarded healthy. General unfavourable
factors will not cause fatal effect. Satisfactory capability for payment of
interest and principal sums |
Fairly Large |
|
41-55 |
Ba |
Overall operation is considered normal. Capable to meet normal
commitments. |
Satisfactory |
|
26-40 |
B |
Capability to overcome financial difficulties seems comparatively
below average. |
Small |
|
11-25 |
Ca |
Adverse factors are apparent. Repayment of interest and principal sums
in default or expected to be in default upon maturity |
Limited with full
security |
|
<10 |
C |
Absolute credit risk exists. Caution needed to be exercised |
Credit not
recommended |
|
-- |
NB |
New Business |
-- |
This report is issued at your request without any risk
and responsibility on the part of MIRA INFORM PRIVATE LIMITED (MIPL) or its
officials.