MIRA INFORM REPORT
|
Report No. : |
350906 |
|
Report Date : |
25.11.2015 |
IDENTIFICATION DETAILS
|
Name : |
PUNTO FA SL |
|
|
|
|
Registered Office : |
C/ Mercaders, 9-11 - Polig. Ind. Riera De Caldes |
|
|
|
|
Country : |
Spain |
|
|
|
|
Financials (as on) : |
30.12.2014 |
|
|
|
|
Date of Incorporation : |
13.12.1989 |
|
|
|
|
Legal Form : |
Private Company |
|
|
|
|
Line of Business : |
Manufacturing of clothing and dressmaking; all type of business of
properties of any kind, their transformation, construction and
legal-economical exploitation. |
|
|
|
|
No. of Employees : |
4200 |
RATING & COMMENTS
|
MIRA’s Rating : |
A |
|
RATING |
STATUS |
PROPOSED CREDIT LINE |
|
|
56-70 |
A |
Financial & operational base are regarded healthy. General
unfavourable factors will not cause fatal effect. Satisfactory capability for
payment of interest and principal sums |
Fairly Large |
|
Status : |
Good |
|
|
|
|
Payment Behaviour : |
Regular |
|
|
|
|
Litigation : |
Clear |
NOTES:
Any query related to this report can be made
on e-mail: infodept@mirainform.com
while quoting report number, name and date.
ECGC Country Risk Classification List – March 31, 2015
|
Country Name |
Previous Rating (31.12.2014) |
Current Rating (31.03.2015) |
|
Spain |
A1 |
A1 |
|
Risk Category |
ECGC
Classification |
|
Insignificant |
A1 |
|
Low |
A2 |
|
Moderate |
B1 |
|
High |
B2 |
|
Very High |
C1 |
|
Restricted |
C2 |
|
Off-credit |
D |
SPAIN - ECONOMIC OVERVIEW
After experiencing a prolonged recession in the wake of the global financial crisis that began in 2008, in 2014 Spain marked the first full year of positive economic growth in seven years, largely due to increased private consumption. At the onset of the global financial crisis Spain's GDP contracted by 3.7% in 2009, ending a 16-year growth trend, and continued contracting through most of 2013. In 2013 the government successfully shored up struggling banks - exposed to the collapse of Spain's depressed real estate and construction sectors - and in January 2014 completed an EU-funded restructuring and recapitalization program.
Until 2014, credit contraction in the private sector, fiscal austerity, and high unemployment weighed on domestic consumption and investment. The unemployment rate rose from a low of about 8% in 2007 to more than 26% in 2013, but labor reforms prompted a modest reduction to 23.7% in 2014. High unemployment strained Spain's public finances, as spending on social benefits increased while tax revenues fell. Spain’s budget deficit peaked at 11.4% of GDP in 2010, but Spain gradually reduced the deficit to just under 7% of GDP in 2013-14, slightly above the 6.5% target negotiated between Spain and the EU. Public debt has increased substantially – from 60.1% of GDP in 2010 to more than 97% in 2014.
Exports were resilient throughout the economic downturn and helped to bring Spain's current account into surplus in 2013 for the first time since 1986, where it remained in 2014. Rising labor productivity and an internal devaluation resulting from moderating labor costs and lower inflation have helped to improve foreign investor interest in the economy and positive FDI flows have been restored.
The government's efforts to implement labor, pension, health, tax, and education reforms - aimed at supporting investor sentiment - have become overshadowed by political activity in 2015 in anticipation of the national parliamentary elections in November. Spain’s 2015 budget, published in September 2014, rolls back some recently imposed taxes in advance of the elections and leaves untouched the country’s value-added tax (VAT) regime, which continues to generate significantly lower revenue than the EU average. Spain’s borrowing costs are dramatically lower since their peak in mid-2012, and despite the recent uptic in economic activity, inflation has dropped sharply, from 1.5% in 2013 to nearly flat in 2014.
|
Source
: CIA |
EXECUTIVE
SUMMARY
|
Name: |
PUNTO FA
SL |
|
NIF /
Fiscal code: |
B59088948 |
|
Status: |
ACTIVE |
|
Incorporation
Date: |
13/12/1989 |
|
Register Data |
Register
Section 8 Sheet 167948 |
|
Last Publication in BORME: |
25/08/2015
[Appointments] |
|
Last
Published Account Deposit: |
2014 |
|
Share
Capital: |
12.565 |
|
|
|
|
Localization: |
C/
MERCADERS, 9-11 - POLIG.IND.RIERA DE CALDES - PALAU-SOLITA I PLEGAMANS -
08184 - BARCELONA |
|
Telephone
- Fax - Email - Website: |
Telephone.
938 602 222 Email. customer.service@mango.com Website.
www.mango.es |
|
Number
of Branches |
137 |
|
|
|
|
Activity: |
|
|
NACE: |
4751 -
Retail sale of textiles in specialised stores |
|
Registered
Trademarks: |
|
|
Audited
/ Opinion: |
Si /
|
|
Tenders
and Awards: |
|
|
Subsidies: |
2 for a
total cost of 8000 |
|
Quality
Certificate: |
No |
|
|
|
|
|
|
|
Defaults, Legal Claims and
Insolvency Proceedings : |
|
|
|
|
Number |
Amount
(€) |
Most
Recent Entry |
|
Insolvency
Proceedings, Bankruptcy and Suspension of Payments |
|
Unpublished |
--- |
--- |
|
Defaults
on debt with Financial Institutions and Large Companies |
|
1 |
177,19 |
--- |
|
Judicial
Claims (Notices, Executive Proceedings, Attachments, Auctions, Bad Debt) |
|
1 |
0 |
--- |
|
Proceedings
heard by the Civil Court |
|
Unpublished |
0 |
--- |
|
Proceedings
heard by the Labour Court |
|
Unpublished |
0 |
--- |
Partners:
|
MANGO MNG
CAPITAL SL |
11.61 % |
|
MANGO
MNG SL |
88.39 % |
|
MANGO
MNG HOLDING SA |
|
|
Shares: |
64 |
|
Other
Links: |
19 |
|
No. of
Active Corporate Bodies: |
CHIEF
EXECUTIVE OFFICER 2 |
|
Ratios |
2014 |
2013 |
Change |
|
|
Guarantees: |
|
|
Properties
Registered: |
Company
NO, Administrator NO |
|
Financing
/ Guarantee Sources : |
Sources
YES, Guarantees YES |
INVESTIGATION SUMMARY
This company was
founded several years ago, reason why it has quite experience in its sector. It
enjoys a good concept among the sources consulted. Its turnover increased by
6.43% in 2014 vs the previous year. It meets payment commitments in an orderly
manner.
Enquiry
Details
|
Business address regime: |
Alquiler |
Identification
|
Social Denomination: |
PUNTO FA
SL |
|
NIF / Fiscal code: |
B59088948 |
|
Corporate Status: |
ACTIVE |
|
Start of activity: |
1989 |
|
Registered Office: |
C/
MERCADERS, 9-11 - POLIG.IND.RIERA DE CALDES |
|
Locality: |
PALAU-SOLITA
I PLEGAMANS |
|
Province: |
BARCELONA |
|
Postal Code: |
08184 |
|
Telephone: |
938 602
222 |
|
Fax: |
938 602
207 |
|
Website: |
www.mango.es |
|
Email: |
customer.service@mango.com |
|
Interviewed Person: |
Empleado
administración |
Branch
Offices
|
Address |
Postal Code |
City |
Province |
|
CALLE
DUQUE DE WELLINGTON 6 A 1 |
01010 |
VITORIA-GASTEIZ |
ALAVA |
|
CALLE
GENERAL ALAVA 30 B |
01005 |
VITORIA-GASTEIZ |
ALAVA |
|
CALLE
ALCALDE CONANGLA |
02008 |
ALBACETE |
ALBACETE |
|
CALLE
TINTE 5 BJ |
02001 |
ALBACETE |
ALBACETE |
|
AVENIDA
DENIA S/N |
03002 |
ALICANTE/ALACANT |
ALICANTE |
|
AVENIDA
MAISONNAVE 33 |
03003 |
ALICANTE/ALACANT |
ALICANTE |
|
CALLE
REYES CATOLICOS 31 |
03003 |
ALICANTE/ALACANT |
ALICANTE |
|
AVENIDA
MEDITERRANEO 1 |
03503 |
BENIDORM |
ALICANTE |
|
CALLE
ALMORIDA 1 |
03203 |
ELCHE/ELX |
ALICANTE |
|
CALLE
PAIS VALENCIA 2 |
03509 |
FINESTRAT |
ALICANTE |
|
AVENIDA
DEL MEDITERRANEO 73 |
04007 |
ALMERIA |
ALMERIA |
|
AVENIDA
BARTOMEU RAMON I TUR 2 |
07800 |
EIVISSA |
BALEARES |
|
CALLE CREU
DE SA 26 BJ |
07800 |
EIVISSA |
BALEARES |
|
CARRETERA
PALMA-INCA 12 |
07141 |
MARRATXI |
BALEARES |
|
AVENIDA
GABRIEL ROCA 54 |
07015 |
PALMA DE
MALLORCA |
BALEARES |
|
AVENIDA
JAUME III 9 |
07012 |
PALMA DE
MALLORCA |
BALEARES |
|
CALLE SANT
MIQUEL 18 |
07002 |
PALMA DE
MALLORCA |
BALEARES |
|
CALLE
MAR 44 |
08911 |
BADALONA |
BARCELONA |
|
PLAZA
CATALUNYA 66 |
08002 |
BARCELONA |
BARCELONA |
|
CALLE
CIUTAT D'ASUNCION 35 BJ 34 |
08030 |
BARCELONA |
BARCELONA |
|
AVENIDA DIAGONAL
586 |
08021 |
BARCELONA |
BARCELONA |
|
CALLE
GIRONA 37 |
08010 |
BARCELONA |
BARCELONA |
|
PASEO
GRACIA 8 BJ |
08007 |
BARCELONA |
BARCELONA |
|
GRAN VIA
CALLE GRAN VIA CORTS CATALANES 850 33 1 |
08018 |
BARCELONA |
BARCELONA |
|
CALLE
PELAI 48 |
08001 |
BARCELONA |
BARCELONA |
|
AVENIDA
DE L'ANGEL 7 BJ |
08002 |
BARCELONA |
BARCELONA |
|
CALLE
TAMARIT 169 |
08015 |
BARCELONA |
BARCELONA |
|
CALLE
TARRAGONA |
08015 |
BARCELONA |
BARCELONA |
|
MUELLE
D'ESPANYA 1 |
08039 |
BARCELONA |
BARCELONA |
|
PASEO
ANDREU NIN S/N PB |
08016 |
BARCELONA |
BARCELONA |
|
CARRETERA
ESPLUGUES 1 C AL 34 |
08940 |
CORNELLA
DE LLOBREGAT |
BARCELONA |
|
CALLE
SANTA ANNA 6 |
08401 |
GRANOLLERS |
BARCELONA |
|
AVENIDA
DE LA GRANVIA DE L'HOSPITALET 13 B 14 75 LOCAL B |
08908 |
HOSPITALET
DE LLOBREGAT (L') |
BARCELONA |
|
CALLE
ANGEL GUIMERA 51 BX 1 |
08241 |
MANRESA |
BARCELONA |
|
CALLE DE
BRUSSELLES 6 |
08304 |
MATARO |
BARCELONA |
|
CALLE MIG
(DEL) 3 |
08110 |
MONTCADA
I REIXAC |
BARCELONA |
|
VIA
AUGUSTA 10 |
08184 |
PALAU-SOLITA
I PLEGAMANS |
BARCELONA |
|
CALLE
DELS BASTERS 18 |
08184 |
PALAU-SOLITA
I PLEGAMANS |
BARCELONA |
|
CALLE
TORRE DE CELLERS 2 |
08150 |
PARETS
DEL VALLES |
BARCELONA |
|
ZONA
AEROPORT |
08820 |
PRAT DE
LLOBREGAT (EL) |
BARCELONA |
|
CALLE CA
LA DANIELA 7 |
08202 |
SABADELL |
BARCELONA |
|
CALLE
MAJOR 40 BA |
08221 |
TERRASSA |
BARCELONA |
|
CALLE
SEGURA 26 |
08223 |
TERRASSA |
BARCELONA |
|
PLAZA
VILA |
08840 |
VILADECANS |
BARCELONA |
|
RAMBLA
PRINCIPAL 29 BX |
08800 |
VILANOVA
I LA GELTRU |
BARCELONA |
|
CALLE
SANTANDER 11 BJ |
09004 |
BURGOS |
BURGOS |
|
CALLE
SAN FRANCISCO 13 |
11004 |
CADIZ |
CADIZ |
|
CALLE CONDE
DE GONDOMAR 6 |
14003 |
CORDOBA |
CORDOBA |
|
AVENIDA
DEL GRAN CAPITAN 4 |
14008 |
CORDOBA |
CORDOBA |
|
CALLE
ALCALDE MARCHESI 15 |
15006 |
CORUÑA
(A) |
LA
CORUÑA |
|
CALLE
REAL 85 |
15003 |
CORUÑA
(A) |
LA
CORUÑA |
|
CALLE
COPERNICO 7 |
15008 |
CORUÑA
(A) |
LA
CORUÑA |
|
CALLE
DOLORES 49 B |
15402 |
FERROL |
LA
CORUÑA |
|
CALLE DO
XENERAL PARDIÑAS 22 |
15701 |
SANTIAGO
DE COMPOSTELA |
LA
CORUÑA |
|
CALLE
GIRONA 20 BJ |
17600 |
FIGUERES |
GIRONA |
|
CALLE
MIGDIA 4 BS 3 |
17002 |
GIRONA |
GIRONA |
|
AVENIDA
GALICIA 22 |
17700 |
JONQUERA
(LA) |
GIRONA |
|
CALLE
RECOGIDAS 11 |
18005 |
GRANADA |
GRANADA |
|
CALLE
REYES CATOLICOS 22 |
18009 |
GRANADA |
GRANADA |
|
BARRIO
VENTAS |
20305 |
IRUN |
GUIPUZCOA |
|
CALLE ARRASATE
25 |
20005 |
DONOSTIA-SAN
SEBASTIAN |
GUIPUZCOA |
|
CALLE
FUENTERRABIA 15 |
20005 |
DONOSTIA-SAN
SEBASTIAN |
GUIPUZCOA |
|
TRAVESIA
GARBERA |
20017 |
DONOSTIA-SAN
SEBASTIAN |
GUIPUZCOA |
|
CALLE
CONCEPCION 17 |
21001 |
HUELVA |
HUELVA |
|
CALLE
RAIÑA (DA) 3 BJ |
27001 |
LUGO |
LUGO |
|
AVENIDA
DE EUROPA 13 3 |
28108 |
ALCOBENDAS |
MADRID |
|
CALLE
ISABEL ALLENDE 4 |
28903 |
GETAFE |
MADRID |
|
CALLE
RIO GUADALQUIVIR 15 |
28906 |
GETAFE |
MADRID |
|
AVENIDA
LENGUA ESPAOLA 25 |
28914 |
LEGANES |
MADRID |
|
CALLE
ARENAL 24 BJ |
28013 |
MADRID |
MADRID |
|
CALLE
BRAVO MURILLO 114 |
28020 |
MADRID |
MADRID |
|
PASEO
FLORIDA S N |
28008 |
MADRID |
MADRID |
|
CALLE
FUENCARRAL 70 |
28004 |
MADRID |
MADRID |
|
CALLE GOYA
83 |
28001 |
MADRID |
MADRID |
|
CALLE
HERMOSILLA 22 |
28001 |
MADRID |
MADRID |
|
CALLE
GRAN VIA 32 |
28013 |
MADRID |
MADRID |
|
AVENIDA
POBLADOS 58 |
28044 |
MADRID |
MADRID |
|
CALLE
PRECIADOS 10 |
28013 |
MADRID |
MADRID |
|
CALLE PRINCESA
75 |
28008 |
MADRID |
MADRID |
|
CALLE
RAIMUNDO FERNANDEZ VILLAVERDE 61 |
28003 |
MADRID |
MADRID |
|
CALLE
SERRANO 61 |
28006 |
MADRID |
MADRID |
|
CALLE
SILVANO 77 B 27 |
28043 |
MADRID |
MADRID |
|
CALLE
VELAZQUEZ 49 |
28001 |
MADRID |
MADRID |
|
AVENIDA
MONFORTE DE LEMOS 36 |
28029 |
MADRID |
MADRID |
|
AVENIDA
PABLO NERUDA 91 P 40 |
28018 |
MADRID |
MADRID |
|
CALLE
CALDERILLA 1 |
28054 |
MADRID |
MADRID |
|
CALLE
QUIMICOS |
28222 |
MAJADAHONDA |
MADRID |
|
CALLE
MORERAS 2 |
28222 |
MAJADAHONDA |
MADRID |
|
AVENIDA
EUROPA 26 |
28224 |
POZUELO
DE ALARCON |
MADRID |
|
CALLE
MARIE CURIE 4 31 LOCAL LB |
28521 |
RIVAS-VACIAMADRID |
MADRID |
|
PLAZA
COMERCIO 11 |
28703 |
SAN
SEBASTIAN DE LOS REYES |
MADRID |
|
AVENIDA
CONDES DE SAN ISIDRO 11 |
29640 |
FUENGIROLA |
MALAGA |
|
CALLE
ARMENGUAL DE LA MOTA 14 |
29007 |
MALAGA |
MALAGA |
|
CALLE
MARQUES DE LARIOS 6 |
29005 |
MALAGA |
MALAGA |
|
AVENIDA
LUIS BUUEL 14 |
29009 |
MALAGA |
MALAGA |
|
AVENIDA
VELAZQUEZ 233 |
29004 |
MALAGA |
MALAGA |
|
CALLE
OJEN S/N |
29603 |
MARBELLA |
MALAGA |
|
AVENIDA
RICARDO SORIANO 17 |
29601 |
MARBELLA |
MALAGA |
|
CALLE
TOTALAN |
29730 |
RINCON
DE LA VICTORIA |
MALAGA |
|
CALLE DE
MURCIA 19 |
30310 |
CARTAGENA |
MURCIA |
|
TRAVESIA
JUAN CARLOS I 30 |
30800 |
LORCA |
MURCIA |
|
CARRETERA
DE LORCA KM 1 LOC 51 PB |
30810 |
LORCA |
MURCIA |
|
AVENIDA
DON JUAN BORBON 63 |
30007 |
MURCIA |
MURCIA |
|
CALLE
MANZANA 13 |
30830 |
MURCIA |
MURCIA |
|
AVENIDA
CARLOS III EL NOBLE 31 |
31002 |
PAMPLONA/IRUÑA |
NAVARRA |
|
CALLE
GAZTAMBIDE CARRERA 8 |
31500 |
TUDELA |
NAVARRA |
|
CALLE
RIO DE ORO 3 |
33209 |
GIJON |
ASTURIAS |
|
CALLE
TOMAS ZARRACINA 1 |
33206 |
GIJON |
ASTURIAS |
|
CALLE
URIA 30 |
33003 |
OVIEDO |
ASTURIAS |
|
AVENIDA
JOSE MESA Y LOPEZ 38 |
35007 |
PALMAS
DE GRAN CANARIA (LAS) |
LAS
PALMAS |
|
CALLE
TRIANA 40 |
35002 |
PALMAS
DE GRAN CANARIA (LAS) |
LAS
PALMAS |
|
CALLE
JUAN SANCHEZ SANCHEZ |
35015 |
PALMAS DE
GRAN CANARIA (LAS) |
LAS
PALMAS |
|
AVENIDA
PINTOR FELO MONZON 1 |
35019 |
PALMAS
DE GRAN CANARIA (LAS) |
LAS
PALMAS |
|
CALLE
ADRAGOMA |
35110 |
SANTA
LUCIA DE TIRAJANA |
LAS
PALMAS |
|
CALLE
PRINCIPE 57 |
36202 |
VIGO |
PONTEVEDRA |
|
CALLE
TORO 100 |
37002 |
SALAMANCA |
SALAMANCA |
|
RAMBLA
BENTACAYSE 12 |
38111 |
SANTA
CRUZ DE TENERIFE |
SANTA
CRUZ DE TENERIFE |
|
CALLE
CASTILLO 20 |
38002 |
SANTA
CRUZ DE TENERIFE |
SANTA
CRUZ DE TENERIFE |
|
CALLE
CONSOLACION 9 1 |
39300 |
TORRELAVEGA |
CANTABRIA |
|
AVENIDA
BARRERILLO (DEL) 1 |
41930 |
BORMUJOS |
SEVILLA |
|
CALLE
FINCA LOS ESPARTALES 56 |
41309 |
RINCONADA
(LA) |
SEVILLA |
|
CALLE
ASUNCION 30 |
41011 |
SEVILLA |
SEVILLA |
|
CALLE
LUIS DE MORALES |
41005 |
SEVILLA |
SEVILLA |
|
CALLE
LLOVERA 48 |
43201 |
REUS |
TARRAGONA |
|
AVENIDA
CARDENAL VIDAL I BARRAQUER 15 S 70 |
43005 |
TARRAGONA |
TARRAGONA |
|
CALLE DE
LA UNIO 32 |
43001 |
TARRAGONA |
TARRAGONA |
|
CALLE DE
BARCELONA 8 |
43840 |
SALOU |
TARRAGONA |
|
CALLE
COLON 20 |
46004 |
VALENCIA |
VALENCIA |
|
CALLE
DON JUAN DE AUSTRIA 7 B |
46002 |
VALENCIA |
VALENCIA |
|
CALLE
MENORCA |
46023 |
VALENCIA |
VALENCIA |
|
CALLE
SANTA GENOVEVA TORRES 21 |
46019 |
VALENCIA |
VALENCIA |
|
CAMINO
VIEJO DE SIMANCAS |
47008 |
VALLADOLID |
VALLADOLID |
|
CALLE
RETUERTO 9 |
48903 |
BARAKALDO |
VIZCAYA |
|
CALLE
RIBERA LA 7 |
48902 |
BARAKALDO |
VIZCAYA |
|
GRAN VIA
GRAN DIEGO LOPEZ DE HARO 13 |
48001 |
BILBAO |
VIZCAYA |
|
AVENIDA INDEPENDENCIA
19 LC |
50001 |
ZARAGOZA |
ZARAGOZA |
|
CALLE
MARIA ZAMBRANO 35 |
50018 |
ZARAGOZA |
ZARAGOZA |
Activity
|
NACE: |
4751 |
|
CNAE Obtaining Source: |
4751 |
|
Legal Form: |
MANUFACTURING
OF CLOTHING AND DRESSMAKING; ALL TYPE OF BUSINESS OF PROPERTIES OF ANY KIND,
THEIR TRANSFORMATION, CONSTRUCTION AND LEGAL-ECONOMICAL EXPLOITATION.
ADMINISTRATION AND MANAGEMENT OF BONDS OF NON SPANISH RESIDENT COMPANIES' OWN
FUNDS THROUGH THE CORRESPONDENT ORGANIZATION OF MATERIAL MEANS, ETC. |
|
Additional Information: |
It's
engaged in trading, importing and exporting clothing and complements.
TRADEMARK: MANGO It's part of the group MANGO It has more than 2,700 stores in
more than 105 countries. It has been the catalan brand pioneering in the
online sector. It created it first corporative webpage in 1995 and 5 years
later, in 2000, it opened its online shopping service, through which it
currently commercialise all its products in the EU countries, as well as USA,
Canada, Turkey, Russia, China and Japan. |
|
Additional Address: |
Registered
office and offices C/ MERCADERS, 9-11 - POLIG.IND.RIERA DE CALDES 08184
PALAU-SOLITA I PLEGAMANS ( BARCELONA ) |
|
Import / export: |
IMPORTS
/ EXPORTS |
|
Future Perspective: |
Consolidation |
|
Industry situation: |
Maturity |
Number
of Employees
|
|
Year |
No. of
employees |
Established |
Incidentals |
|
|
|
2015 |
4200 |
|
|
|
The data of
employees is from the latest available financial statements. Failing that, are
estimates data calculated by statistical methods
Chronological
Summary
|
Year |
Act |
|
1991 |
Accounts
deposit (year 1990) Appointments/ Re-elections (2) |
|
1992 |
Accounts
deposit (year 1991) Appointments/ Re-elections (3) Capital Reduction (1)
Increase of Capital (1) |
|
1993 |
Appointments/
Re-elections (1) Change of Social Purpose (1) |
|
1994 |
Accounts
deposit (year 1992, 1993) Appointments/ Re-elections (1) |
|
1995 |
Accounts
deposit (year 1994) Change of Social address (1) |
|
1996 |
Accounts
deposit (year 1995) |
|
1997 |
Accounts
deposit (year 1996 consolidated, 1996) Adaptation to Law (1) Appointments/
Re-elections (3) Change of Social Purpose (1) |
|
1998 |
Accounts
deposit (year 1997 consolidated, 1997) Appointments/ Re-elections (4) |
|
1999 |
Accounts
deposit (year 1998 consolidated, 1998) Appointments/ Re-elections (4)
Statutory Modifications (1) Take-over Merger (4) |
|
2000 |
Accounts
deposit (year 1999 consolidated, 1999) Appointments/ Re-elections (2) Other
Concepts/ Events (1) Statutory Modifications (2) Take-over Merger (1) |
|
2001 |
Accounts
deposit (year 2000) Appointments/ Re-elections (1) |
|
2002 |
Accounts
deposit (year 2001) Appointments/ Re-elections (1) Change of Social Purpose
(1) |
|
2003 |
Accounts
deposit (year 2002) Appointments/ Re-elections (1) Cessations/ Resignations/
Reversals (2) |
|
2004 |
Accounts
deposit (year 2003) Appointments/ Re-elections (3) |
|
2005 |
Accounts
deposit (year 2004) Appointments/ Re-elections (1) |
|
2006 |
Appointments/
Re-elections (4) Cessations/ Resignations/ Reversals (1) |
|
2007 |
Accounts
deposit (year 2005, 2006) Appointments/ Re-elections (7) Cessations/ Resignations/
Reversals (4) Increase of Capital (2) Loss of the sole propietorship
condition (1) Other Concepts/ Events (1) Statutory Modifications (2) |
|
2008 |
Appointments/
Re-elections (1) |
|
2009 |
Accounts
deposit (year 2007, 2008) Appointments/ Re-elections (2) Cessations/
Resignations/ Reversals (2) |
|
2010 |
Appointments/
Re-elections (3) Cessations/ Resignations/ Reversals (1) |
|
2011 |
Accounts
deposit (year 2009, 2010) Appointments/ Re-elections (5) Take-over Merger (1) |
|
2012 |
Accounts
deposit (year 2011) Appointments/ Re-elections (2) |
|
2013 |
Accounts
deposit (year 2012) Appointments/ Re-elections (3) Cessations/ Resignations/
Reversals (2) |
|
2014 |
Accounts
deposit (year 2013) Appointments/ Re-elections (1) |
|
2015 |
Accounts
deposit (year 2014) Appointments/ Re-elections (4) |
Main
Historic Changes
|
Concept |
Publication |
Act |
Date |
|
Corporate
Purpose Changes: |
LAS
OPERACIONES Y NEGOCIOS DE TODAS CLASES SOBRE BIENES INMUEBLES DE CUALQUIER NATURALEZA.
SU TRANSFORMACION POR URBANIZACION Y CONSTRUCCION Y EXPLOTACION JURIDICA Y
ECONOMICA. |
|
05/12/1997 |
Breakdown
of Owners' Equity
|
|
|
Registered Capital: |
12.565 |
|
Paid up capital: |
12.565 |
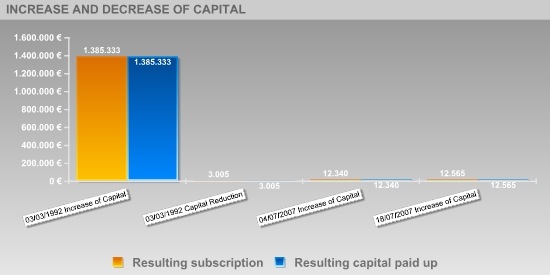
Updated Evolution of the Subscribed and
Paid-in Capital
|
|||||
|
|
|||||
|
|
|
|
|
|
|
|
Publishing Date |
Registration Type |
Capital Subscribed |
Paid up capital |
Underwritten result |
Disbursed Result |
|
03/03/1992 |
Increase
of Capital |
1.382.328 |
1.382.328 |
1.385.333 |
1.385.333 |
|
03/03/1992 |
Capital
Reduction |
-1.382.328 |
-1.382.328 |
3.005 |
3.005 |
|
04/07/2007 |
Increase
of Capital |
9.334 |
9.334 |
12.340 |
12.340 |
|
18/07/2007 |
Increase
of Capital |
225 |
225 |
12.565 |
12.565 |
Active
Social Bodies
|
Post published |
Social Body's Name |
Appointment Date |
Other Positions in this Company |
|
PRESIDENT |
MANGO
MNG HOLDING SL |
29/01/2010 |
3 |
|
MEMBER
OF THE BOARD |
MANGO
MNG SL |
29/01/2010 |
3 |
|
|
MANGO
MNG HOLDING SL |
29/01/2010 |
3 |
|
|
KAPIT
ADMINT SL |
18/07/2007 |
1 |
|
JOINT
ATTORNEY |
LAZCANO
ALBERDI SAIOA |
18/08/2015 |
1 |
|
|
ABASCAL ALONSO
NATALIA |
18/08/2015 |
1 |
|
|
UNYO
BOVER ANNA |
18/08/2015 |
1 |
|
|
MAGDALENA
EMILIA STRASZAK |
18/08/2015 |
1 |
|
|
CALERO
LLINARES ISABEL |
18/08/2015 |
1 |
|
|
PASSARELL
BEYA JAIME |
18/08/2015 |
1 |
|
|
PRAT
ALFONSO MONTSERRAT |
18/08/2015 |
1 |
|
|
NICOLA
COCCO |
18/08/2015 |
1 |
|
|
DIANE
SANTONI SAUMELL |
18/08/2015 |
1 |
|
|
GARCIA
LECUMBERRI MARIA JESUS |
20/07/2015 |
14 |
|
PROXY |
ORTEGA
GARCIA ISABEL |
26/03/2013 |
3 |
|
|
VILALTA
BIESCAS ELISENDA |
26/03/2013 |
5 |
|
|
ESCUTIA
GARCIA ALEJANDRO |
26/03/2013 |
4 |
|
|
LOPEZ
GARCIA DANIEL |
11/10/2011 |
3 |
|
|
DELFA
ARISTA ANA |
26/05/2011 |
2 |
|
|
CASI
BRUNSO ENRIC |
23/12/2009 |
2 |
|
|
GIL
BERTOMEU MIRIAM |
26/01/2007 |
2 |
|
|
MARTINEZ
VICENTE ESTER |
10/04/2006 |
2 |
|
|
ANDRES
GARCIA DEBORA |
24/02/2004 |
1 |
|
|
BELLO
BODAS SILVIA |
06/08/1998 |
1 |
|
|
ERMAY
ANDIC SOL |
22/02/1994 |
1 |
|
|
NAHMAN
ANDIC |
30/10/1992 |
1 |
|
|
ISAK
HALFON |
09/04/1992 |
1 |
|
CHIEF
EXECUTIVE OFFICER |
MANGO
MNG HOLDING SL |
29/01/2010 |
3 |
|
|
MANGO
MNG SL |
29/01/2010 |
3 |
|
SECRETARY |
MANGO
MNG SL |
29/01/2010 |
3 |
|
REPRESENTATIVE |
ANDIC
RAIG JONATHAN |
15/07/2013 |
1 |
|
|
ISAK
ANDIC ERMAY |
29/01/2010 |
5 |
|
|
CASI
BRUNSO ENRIC |
18/07/2007 |
2 |
|
ACCOUNTS'
AUDITOR / HOLDER |
AUREN
AUDITORS BCN SLP |
20/02/2015 |
1 |
|
|
PRICEWATERHOUSECOOPERS
AUDITORES SL |
20/02/2015 |
2 |
Historical
Social Bodies
|
Social
Body's Name |
Post
published |
End Date |
Other
Positions in this Company |
|
AUREN
AUDITORS BARCELONA SA |
ACCOUNTS'
AUDITOR / HOLDER |
11/11/2010 |
4 |
|
|
ACCOUNTS'
AUDITOR / HOLDER |
06/04/2011 |
|
|
|
ACCOUNTS'
AUDITOR / HOLDER |
10/04/2012 |
|
|
|
ACCOUNTS'
AUDITOR / HOLDER |
25/01/2013 |
|
|
AUREN
AUDITORS BCN SA |
ACCOUNTS'
AUDITOR / HOLDER |
24/07/2014 |
2 |
|
|
ACCOUNTS'
AUDITOR / HOLDER |
20/02/2015 |
|
|
AUREN
AUDITORS CONSULTORS BARCELONA SA |
ACCOUNTS'
AUDITOR / HOLDER |
23/04/2009 |
6 |
|
|
ACCOUNTS'
AUDITOR / HOLDER |
28/11/2008 |
|
|
|
ACCOUNTS'
AUDITOR / HOLDER |
22/03/2004 |
|
|
|
ACCOUNTS'
AUDITOR / HOLDER |
15/03/2005 |
|
|
|
ACCOUNTS'
AUDITOR / HOLDER |
30/03/2006 |
|
|
|
ACCOUNTS'
AUDITOR / HOLDER |
20/04/2007 |
|
|
AUREN
FIDEM CONSULTORS AUDITORS SA |
ACCOUNTS'
AUDITOR / HOLDER |
28/06/1999 |
5 |
|
|
CONSOLIDATED
ACCOUNTS' AUDITOR |
22/04/2000 |
|
|
|
ACCOUNTS'
AUDITOR / HOLDER |
12/02/2001 |
|
|
|
ACCOUNTS'
AUDITOR / HOLDER |
08/03/2002 |
|
|
|
ACCOUNTS'
AUDITOR / HOLDER |
28/02/2003 |
|
|
COOPERS
AND LYBRAND AUDITORIA Y CONSULTORIA SRL |
ACCOUNTS'
AUDITOR / HOLDER |
28/06/1999 |
2 |
|
|
CONSOLIDATED
ACCOUNTS' AUDITOR |
22/04/2000 |
|
|
DELFA
ARISTA ANA |
PROXY |
26/05/2011 |
2 |
|
ESCUTIA GARCIA
ALEJANDRO |
PROXY |
26/05/2011 |
4 |
|
|
PROXY |
26/03/2013 |
|
|
|
PROXY |
13/12/2010 |
|
|
FIDEM
AUDITORS SA |
ACCOUNTS'
AUDITOR / HOLDER |
28/06/1999 |
1 |
|
FOLIA
AND CIA AUDITORS CENSORS JURATS DE COMPTES S |
ACCOUNTS'
AUDITOR / HOLDER |
07/07/1997 |
1 |
|
GARCIA
LECUMBERRI MARIA JESUS |
PROXY |
20/02/1997 |
14 |
|
|
PROXY |
06/04/1998 |
|
|
|
PROXY |
06/08/1999 |
|
|
|
PROXY |
25/05/2004 |
|
|
|
PROXY |
07/09/2006 |
|
|
|
PROXY |
09/02/2007 |
|
|
|
PROXY |
16/05/2007 |
|
|
|
PROXY |
23/11/2007 |
|
|
|
PROXY |
17/11/2009 |
|
|
|
PROXY |
07/03/2012 |
|
|
|
PROXY |
26/03/2013 |
|
|
|
PROXY |
15/05/2015 |
|
|
|
JOINT
ATTORNEY |
20/07/2015 |
|
|
GIL
BERTOMEU MIRIAM |
PROXY |
26/01/2007 |
2 |
|
HALFON
ISAK |
PROXY |
17/11/2009 |
1 |
|
ISAK
ANDIC ERMAY |
ADMINISTRATOR |
18/07/2007 |
5 |
|
|
MEMBER
OF THE BOARD |
29/01/2010 |
|
|
|
CHIEF
EXECUTIVE OFFICER |
29/01/2010 |
|
|
|
PRESIDENT |
29/01/2010 |
|
|
ISAK ERMAY |
ADMINISTRATOR |
18/07/2007 |
1 |
|
LOPEZ
GARCIA DANIEL |
PROXY |
24/08/2011 |
3 |
|
|
PROXY |
11/10/2011 |
|
|
MACARRO
FERNANDEZ MONTSERRAT |
PROXY |
22/10/2003 |
1 |
|
MANGO-MNG
SL |
SINGLE
PARTNER |
18/07/2007 |
1 |
|
MARGARIT
BONET JORDI |
PROXY |
22/10/2003 |
1 |
|
MARTINEZ
VICENTE ESTER |
PROXY |
10/04/2006 |
2 |
|
NAHMAN
ANDIC ERMAY |
ADMINISTRATOR |
18/07/2007 |
5 |
|
|
MEMBER
OF THE BOARD |
29/01/2010 |
|
|
|
REPRESENTATIVE |
15/07/2013 |
|
|
|
CHIEF EXECUTIVE
OFFICER |
29/01/2010 |
|
|
|
SECRETARY |
29/01/2010 |
|
|
ORTEGA
GARCIA ISABEL |
PROXY |
26/05/2011 |
3 |
|
|
PROXY |
26/03/2013 |
|
|
PRICE
WATERHOUSE COOPERS AUDITORES S L |
ACCOUNTS'
AUDITOR / HOLDER |
20/04/2007 |
1 |
|
PRICE WATERHOUSE
COOPERS AUDITORES SL |
ACCOUNTS'
AUDITOR / HOLDER |
22/03/2004 |
12 |
|
|
ACCOUNTS'
AUDITOR / HOLDER |
08/03/2002 |
|
|
|
ACCOUNTS'
AUDITOR / HOLDER |
28/02/2003 |
|
|
|
ACCOUNTS'
AUDITOR / HOLDER |
15/03/2005 |
|
|
|
ACCOUNTS'
AUDITOR / HOLDER |
30/03/2006 |
|
|
|
ACCOUNTS'
AUDITOR / HOLDER |
28/11/2008 |
|
|
|
ACCOUNTS'
AUDITOR / HOLDER |
23/04/2009 |
|
|
|
ACCOUNTS'
AUDITOR / HOLDER |
11/11/2010 |
|
|
|
ACCOUNTS'
AUDITOR / HOLDER |
10/04/2012 |
|
|
|
ACCOUNTS'
AUDITOR / HOLDER |
06/04/2011 |
|
|
|
ACCOUNTS'
AUDITOR / HOLDER |
24/07/2014 |
|
|
|
ACCOUNTS'
AUDITOR / HOLDER |
25/01/2013 |
|
|
PRICE
WATERHOUSE COOPERS SL |
ACCOUNTS'
AUDITOR / HOLDER |
12/02/2001 |
1 |
|
PRICEWATERHOUSECOOPERS
AUDITORES SL |
ACCOUNTS'
AUDITOR / HOLDER |
20/02/2015 |
2 |
|
SORIANO
PEREZ EVARISTO |
PROXY |
23/11/2007 |
1 |
|
SORIANO
PEREZ MARIA PILAR |
PROXY |
06/08/1999 |
3 |
|
|
PROXY |
16/05/2007 |
|
|
|
PROXY |
17/11/2009 |
|
|
VILALTA BIESCAS
ELISENDA |
PROXY |
06/08/1999 |
5 |
|
|
PROXY |
16/05/2007 |
|
|
|
PROXY |
17/11/2009 |
|
|
|
PROXY |
26/03/2013 |
|
Defaults, Legal Claims and Insolvency
Proceedings
Section
enabling assessment of the degree of compliance of the company queried with its
payment obligations. It provides information on the existence and nature of all
stages of Insolvency and Legal Proceedings published with reference to the
Company in the country's various Official Bulletins and national newspapers, as
well Defaults Registered in the main national credit bureaus (ASNEF Industrial
and RAI ).
>
Summary
Chronological
summary
|
|
|
Number
of Publications |
Amount
(_) |
Start
date |
End date |
|
Insolvency
Proceedings, Bankruptcy and Suspension of Payments |
|
Unpublished |
--- |
--- |
--- |
|
Request/Declaration |
|
0 |
--- |
date |
|
|
Proceedings |
|
--- |
--- |
|
--- |
|
Resolution |
|
--- |
--- |
|
--- |
|
Defaults
on debt with Financial Institutions and Large Companies |
Bank and
Commercial Delinquency |
1 |
0 |
10/12/2013 |
24/11/2015 |
|
Status:
Friendly |
|
1 |
177.19 |
10/12/2013 |
10/03/2014 |
|
Status:
Pre-Litigation |
|
--- |
|
|
|
|
Status:
Litigation |
|
--- |
|
|
|
|
Status:
Non-performing |
|
--- |
|
|
|
|
Status:
insolvency proceedings, bankruptcy and suspension of payments |
|
--- |
|
|
|
|
Other
status |
|
--- |
|
|
|
|
Legal
and Administrative Proceedings |
|
1 |
--- |
23/02/2010 |
23/02/2010 |
|
Notices
of defaults and enforcement |
|
1 |
--- |
|
--- |
|
Seizures |
|
--- |
--- |
|
--- |
|
Auctions |
|
--- |
--- |
|
--- |
|
Declarations
of insolvency and bad debt |
|
--- |
--- |
|
--- |
|
Proceedings
heard by the Civil Court |
|
Unpublished |
--- |
|
|
|
Proceedings
heard by the Labour Court |
|
Unpublished |
--- |
|
|
>
Details
IMPAGOS EN
ENTIDADES FINANCIERAS Y GRANDES EMPRESAS
Section comprising a
list of the instances of default recorded in the ASNEF Industrial file under
the name of .
List of
current instances of default for each of the transactions in progress
|
Type of
creditor |
Product |
Value of
transactions (_) |
Status |
No. of
defaults |
Default
balance (_) |
Date of
first default |
Date of
last default |
|
OTRAS |
Otros |
--- |
Amistoso |
4 |
177.19 |
10/12/13 |
10/03/14 |
|
|
|
177,19 |
|
|
|
||
Change in
values of defaults and settled debts
Legal Notice:
This
data has been obtained from consultation of the ASNEF Industrial register. This
data may not be reused or included in any database, and may not be ceded.
> Basis
for scoring
|
Positive Factors |
Adverse Factors |
|
It is
one of the major domestic companies in terms of sales volume. PUNTO FA
SL 's borrowing cost is appropriate according to its volume of external
financing sources. Significant
operating income. The Company has the necessary return on the investments for
its main activity with respect to its assets. This return is lower than that
of the financial year 2013 . It
presents a efficient productivity. EBITDA shows adequate company costs
management as income exceed operating expenses. Positive
Working CapitalThe Company's Working Capital quality is significant, i.e.
much of the Company financing comes from its equity. A structure is
considered optimal if its liquidity level is slightly above its debt volume
as a result of low idleness levels of its financial resources involved. |
It has
been found to have irregular payment performance at the credit bureaus,
although it is not relevant enough to change the rating. PUNTO FA
SL it presents an excessive indebtedness that may compromise their balance
sheet. The
development of the debt structure during the last two years indicates an
increase of the debt with credit institutions and trade creditors in respect to
all liabilities. The higher the level of debt, the greater the dependence on
suppliers' capital and the more compromised will be its financial situation. PUNTO FA
SL presents a low turnover of the current assets , which could indicate an
inefficient use of non-current assets due to the lacking of enough operating
income capacity based on the dedicated assets available for sale. |
Probability
of default
>
Estimated Probability of Default for the next 12 months: 0.434 %
|
Sector
in which comparison is carried out: 475 Retail
sale of other household equipment in specialised stores |
|
|
Relative
Position:
|

The
company's comparative analysis with the rest of the companies that comprise the
sector, shows the company holds a better position with regard to the
probability of non-compliance.
The
99.00% of the companies of the sector PUNTO FA SL belongs to show a higher
probability of non-compliance.
The
probability of the company's non-compliance with its payment obligations within
deadlines estimated by our qualifications models is 0.434%.
In
the event they fail to comply with the payment, the seriousness of the loss
will depend on factors such as the promptness of the commencement of the
charging management, the existence of executive documents which match the
credit or the existence of guarantees and free debt assets under the name of
the debtor. Therefore, the probability of non-compliance should not be solely
interpreted as the total loss of the owed amount.
LEGAL
CLAIMS
Summary of Judicial
Claims
|
PROCEDURES
OF CONTEST, BANKRUPTCY AND BANKRUPTCY PROTECTION |
|
|
|
|
|
No
se han publicado |
|
|
|
No
se han publicado |
|
INCIDENCES
WITH THE PUBLIC ADMINISTRATIONS |
|
|
|
|
|
No
se han publicado |
|
|
|
No
se han publicado |
|
|
|
No
se han publicado |
|
|
|
|
|
PROCEDURES
BEFORE COURTS OF CIVIL MATTERS |
|
|
|
|
|
No
se han publicado |
|
|
|
No
se han publicado |
|
PROCEEDINGS
BEFORE THE INDUSTRIAL TRIBUNAL |
|
|
|
|
|
No
se han publicado |
|
Incidences
Detailed |
|
Incidences
with the Local Administration |
|
PROCESSED
BY THE LOCAL GOVERNMENT DE SEVILLA - Date 23/02/2010 |
|
Last
Published Stage: |
SEIZURE |
|
Record
Number: |
200900045023 |
|
Amount
of the incidence: |
0,00 E |
|
Requested
by: |
ADMINISTRACION
LOCAL |
|
Published
domicile: |
(DESCONOCIDA) |
|
Source: |
B.O.P.
SEVILLA Nº20, 2010 SUPLEMENTO 1 PAGINA 280 |
Link
List
|
PARTICIPATES
IN: |
64 Entities |
|
SHAREHOLDERS: |
3 Entities |
|
ABSORBS
TO: |
3 Entities |
|
BELONGS
TO THE ADMINISTRATION BOARD OF: |
1 Entities |
|
HAS IN
ITS ADMINISTRATION BOARD TO: |
3 Entities |
|
IS
RELATED WITH: |
12 Entities |
>
Shareholders
|
Relationship |
Entity |
Province |
Shareholding
stake |
|
SHAREHOLDERS |
MANGO
MNG CAPITAL SL |
BARCELONA |
11.61 |
|
|
MANGO
MNG SL |
BARCELONA |
88.39 |
|
|
MANGO
MNG HOLDING SA |
BARCELONA |
|
|
PARTICIPATES
IN |
PUNTO MI
SL |
BARCELONA |
100 |
|
|
DIKNAH
SL |
BARCELONA |
100 |
|
|
KAYSERI INVERSIONES
SIMCAV SA |
BARCELONA |
100 |
|
|
DARDANELOS
INVERSIONES SICAV SA |
BARCELONA |
100 |
|
|
FOURSOME
SICAV S.A. |
BARCELONA |
100 |
|
|
INVESTMENTS
AKNAM SICAV SA |
BARCELONA |
100 |
|
|
INVESTMENTS
ANSAVE SICAV SOCIEDAD ANONIMA |
BARCELONA |
100 |
|
|
TOPKAPI
INVERSIONES SICAV SA |
BARCELONA |
100 |
|
|
MANGO
HONG KONG, SOCIEDAD ANONIMA, (CHINA) |
|
99 |
|
|
MANGO
BELGIQUE SPRL (BELGICA) |
|
99.99 |
|
|
MANGO
FRANCE SARL (FRANCIA) |
|
100 |
|
|
MANGO HUNGARY
KFT (HUNGRIA) |
|
100 |
|
|
MANGO
ITALIA, SOCIEDAD LIMITADA, (ITALIA) |
|
100 |
|
|
MANGO
NEDERLAND BV (HOLANDA) |
|
100 |
|
|
MANGO
NORGE AS (NORUEGA) |
|
100 |
|
|
MANGO
OSTERREICH HANDELS, SOCIEDAD ANONIMA, (AUSTRIA) |
|
100 |
|
|
MANGO
SUISSE, SOCIEDAD ANONIMA, (SUIZA) |
|
100 |
|
|
MANGO TR
TEKSTILTIC, SOCIEDAD ANONIMA, STI (TURQUIA) |
|
99.91 |
|
|
DISTEX
INC (EEUU) |
|
|
|
|
MANGO CZ
SRO (REPUBLICA CHECA) |
|
99.91 |
|
|
MANGO BRASIL
COMERCIAL, SOCIEDAD ANONIMA, (BRASIL) |
|
99.99 |
|
|
MANGO
DANMARK APS (DINAMARCA) |
|
100 |
|
|
MANGO
DEUTSCHLAND, SOCIEDAD ANONIMA, (ALEMANIA) |
|
51 |
|
|
MANGO
MNG USA INC (EEUU) |
|
100 |
|
|
MANGO NY
INC (EEUU) |
|
|
|
|
MANGO ON
LINE INC (EEUU) |
|
|
|
|
MANGO
POLSKA SP ZOO (POLONIA) |
|
100 |
|
|
MANGO
SVERIGE AB (SUECIA) |
|
100 |
|
|
TEXDIS
USA INC (EEUU) |
|
|
|
|
MANGO
MERITXELL, SOCIEDAD ANONIMA, (ANDORRA) |
|
100 |
|
|
DEREK
INVESTMENT SA |
BARCELONA |
100 |
|
|
MNG
MANGO CANADA CORPORATION (CANADA) |
|
100 |
|
|
PUNTA NA
DEUTSCHLAND, S.A. |
|
6 |
|
|
MANGO
GARMENTS AND ACCESSORY TRADING, S.A. |
|
100 |
|
|
AFYON
INVESTMENTS SICAV SA |
BARCELONA |
100 |
|
|
SAS
MANGO HAUSSMAN (FRANCIA) |
|
100 |
|
|
MANGO
GARMENTS RUMANIA, SOCIEDAD LIMITADA, (RUMANIA) |
|
100 |
|
|
MANGO
SINGAPUR (SINGAPUR) |
|
100 |
|
|
MANGO
SLOVENSKO SRO (ESLOVAQUIA) |
|
99.91 |
|
|
MANGO
(MACAU) LIMITADA |
|
99.98 |
|
|
MANGO
EGYPT LLC (EGIPTO) |
|
|
|
|
MANGO
GARMENTS HELLAS, SOCIEDAD ANONIMA, (GRECIA) |
|
100 |
|
|
MANGONOR
COMER DE VESTUAR, SOCIEDAD ANONIMA, (PORTUGAL) |
|
100 |
|
|
MANGO
MODA DOO |
|
100 |
|
|
CONSOLIDATED
ARTISTS BV (HOLANDA) |
|
|
|
|
MANGO JAPAN,
SOCIEDAD ANONIMA, (JAPON) |
|
100 |
|
|
MANGO
KOREA, SOCIEDAD ANONIMA, (KOREA) |
|
100 |
|
|
MANGO
LUXEMBOURG SARL (LUXEMBURGO) |
|
100 |
|
|
MANGO
RUSSIA (RUSIA) |
|
100 |
|
|
MANGO
SRB DOO BEOGRAD |
|
100 |
|
|
MANGO SUOMI
OY (FINLANDIA) |
|
100 |
|
|
MANGO
UKRAINE TOV (UCRANIA) |
|
100 |
|
|
MNG
MANGO IRELAND, SOCIEDAD ANONIMA, (IRLANDA) |
|
100 |
|
|
MNG
MANGO UK LITD (REINO UNIDO) |
|
100 |
|
|
TEXTIL
EGYPT TRADING JSC (EGIPTO) |
|
99.98 |
|
|
VLT MODA
TEKSTIL IC VEDIS TIC |
|
|
|
|
MANGO
OPERACIONES MEXICO S DE RL DE CV |
|
99.9 |
|
|
MEXDIC
SERVICIOS DE GESTION S DE RL DE CV |
|
99.9 |
|
|
PUNTA NA
FRANCE (FRANCIA) |
|
49.99 |
|
|
PUNTA NA
TAKSIM GAYRIMENKUL TI (TURQUIA) |
|
99.99 |
|
|
IL
CERRERO, SOCIEDAD LIMITADA, (ITALIA) |
|
|
|
|
MANGO
TOULON SAS (FRANCIA) |
|
|
|
|
M
GARMENTS & ACCES COLT (CHINA) |
|
|
|
|
MANGO
SERIGEAB (SUECIA) |
|
100 |
> Other
relationships
|
Relationship |
Entity |
Province |
Shareholding
stake |
|
IS
RELATED WITH |
| | |
|
|
|
|
SCI
PUNTA NA FRANCE (FRANCIA) |
|
|
|
|
AU GRAND
OARTIER SAS |
|
|
|
|
GALERIE
DE GRANDE ARCADES SARL |
|
|
|
|
GRANDE
MAISON DE BLANC (FRANCIA) |
|
|
|
|
SOCIEDAD
ANONIMA DRALUX (FRANCIA) |
|
|
|
|
SOCIEDAD
ANONIMA VOLIMOB (FRANCIA) |
|
|
|
|
SCI
GALERIES GRANDES ARCADES (FRANCIA) |
|
|
|
|
IL
CERRERO, SOCIEDAD LIMITADA, (ITALIA) |
|
|
|
|
M
GARMENTS & ACCES (CH) CO LT |
|
|
|
|
MANGO
BULGARIA EOOD |
|
|
|
|
MANGO
TOULON SAS (FRANCIA) |
|
|
|
|
PUNTA NA
FRANCE (FRANCIA) |
|
|
|
ABSORBS
TO |
NEW
CLOS, S.A. |
BARCELONA |
|
|
|
PUNTO MI
SL |
BARCELONA |
|
|
|
PUNTO RE
SL |
BARCELONA |
|
|
HAS IN
ITS ADMINISTRATION BOARD TO |
KAPIT ADMINT
S.L |
BARCELONA |
|
|
|
MANGO
MNG HOLDING SL |
BARCELONA |
|
|
|
MANGO
MNG SL |
BARCELONA |
|
|
BELONGS
TO THE ADMINISTRATION BOARD OF |
MANGO
MNG HOLDING SL |
BARCELONA |
|
Turnover
|
Total Sales 2014 |
1.310.010.000 |
The sales data
is from the latest available financial statements. Failing that, are estimates
data calculated by statistical methods.
Financial
Accounts and Balance Sheets
Financial Years Presented
|
Ejercicio |
Tipo de
Cuentas Anuales |
Fecha
Presentacion |
|
2014 |
Normales |
August
2015 |
|
2013 |
Normales |
September
2014 |
|
2012 |
Normales |
August
2013 |
|
2011 |
Normales |
August
2012 |
|
2010 |
Normales |
August
2011 |
|
2009 |
Normales |
December
2010 |
|
2008 |
Normales |
September
2009 |
|
2007 |
Normales |
December
2008 |
|
2006 |
Normales |
August
2007 |
|
2005 |
Normales |
December
2006 |
|
2004 |
Normales |
September
2005 |
|
2003 |
Normales |
August
2004 |
|
2002 |
Normales |
September
2003 |
|
2001 |
Normales |
August
2002 |
|
2000 |
Normales |
August
2001 |
|
1999 |
Consolidadas |
October
2000 |
|
1999 |
Normales |
August
2000 |
|
1999 |
Normales |
August
2000 |
|
1998 |
Consolidadas |
August
1999 |
|
1998 |
Normales |
August
1999 |
|
1997 |
Consolidadas |
September
1998 |
|
1997 |
Normales |
November
1998 |
|
1996 |
Consolidadas |
September
1997 |
|
1996 |
Normales |
September
1997 |
|
1995 |
Normales |
July
1996 |
|
1994 |
Normales |
August
1995 |
|
1993 |
Normales |
September
1994 |
|
1992 |
Normales |
December
1993 |
|
1991 |
Normales |
July
1992 |
|
1990 |
Normales |
September
1991 |
The data in the report
regarding the last Company Accounts submitted by the company is taken from the TRADE
REGISTER serving the region in which the company's address is located
30/12/2014
>
Normal format Balance in accordance with the New Accounting Plan 2007
Information
corresponding to the fiscal year 2014 2013 2012 2011 2010
is taken from information submitted to the TRADE REGISTER. Data corresponding
to fiscal years before 2014 2013 2012 2011 2010 has
been compiled based on the equivalence criteria stipulated in Act JUS/206/2009.
To view details on the methodology.
|
|
ORIGINAL |
ORIGINAL |
ORIGINAL |
ORIGINAL |
ORIGINAL |
|
|
Assets |
2014 |
2013 |
2012 |
2011 |
2010 |
|
|
A)
NON-CURRENT ASSETS: 11000 |
1.428.314.000,00 |
1.384.046.000,00 |
1.463.739.000,00 |
1.299.854.000,00 |
1.280.447.000,00 |
|
|
I. Intangible fixed assets : 11100 |
29.040.000,00 |
16.907.000,00 |
16.010.000,00 |
15.162.000,00 |
14.426.000,00 |
|
|
1. Development: 11110 |
0,00 |
0,00 |
0,00 |
0,00 |
0,00 |
|
|
2. Concessions: 11120 |
0,00 |
0,00 |
0,00 |
0,00 |
0,00 |
|
|
3. Patents, licencing, trade marks and
similar: 11130 |
0,00 |
0,00 |
0,00 |
0,00 |
0,00 |
|
|
4. Goodwill: 11140 |
0,00 |
0,00 |
0,00 |
0,00 |
0,00 |
|
|
5. IT applications: 11150 |
3.509.000,00 |
2.325.000,00 |
2.641.000,00 |
2.718.000,00 |
2.143.000,00 |
|
|
6. Investigation: 11160 |
0,00 |
0,00 |
0,00 |
0,00 |
0,00 |
|
|
7. Intellectual property: 11180 |
0,00 |
0,00 |
0,00 |
0,00 |
0,00 |
|
|
8. Greenhouse gas emission allowance:
11190 |
0,00 |
0,00 |
0,00 |
0,00 |
0,00 |
|
|
9. Other intangible fixed assets. :
11170 |
25.531.000,00 |
14.582.000,00 |
13.369.000,00 |
12.444.000,00 |
12.283.000,00 |
|
|
II. Tangible fixed assets : 11200 |
154.558.000,00 |
110.292.000,00 |
104.577.000,00 |
111.965.000,00 |
124.773.000,00 |
|
|
1. Land and buildings: 11210 |
0,00 |
0,00 |
0,00 |
0,00 |
0,00 |
|
|
2. Technical installations and other
tangible fixed assets: 11220 |
80.092.000,00 |
88.505.000,00 |
99.150.000,00 |
110.345.000,00 |
122.647.000,00 |
|
|
3. Tangible asset in progress and
advances: 11230 |
74.466.000,00 |
21.787.000,00 |
5.427.000,00 |
1.620.000,00 |
2.126.000,00 |
|
|
III. Real estate investment: 11300 |
0,00 |
0,00 |
0,00 |
0,00 |
0,00 |
|
|
1. Land: 11310 |
0,00 |
0,00 |
0,00 |
0,00 |
0,00 |
|
|
2. Buildings: 11320 |
0,00 |
0,00 |
0,00 |
0,00 |
0,00 |
|
|
IV. Long-term investments in Group companies and associates :
11400 |
1.020.296.000,00 |
1.029.335.000,00 |
1.135.082.000,00 |
983.802.000,00 |
965.991.000,00 |
|
|
1. Equity instruments: 11410 |
882.573.000,00 |
970.443.000,00 |
1.098.746.000,00 |
930.961.000,00 |
923.717.000,00 |
|
|
2. Credits to businesses: 11420 |
0,00 |
0,00 |
36.336.000,00 |
52.841.000,00 |
42.274.000,00 |
|
|
3. Debt securities: 11430 |
0,00 |
0,00 |
0,00 |
0,00 |
0,00 |
|
|
4. Derivatives : 11440 |
0,00 |
0,00 |
0,00 |
0,00 |
0,00 |
|
|
5. Other financial assets : 11450 |
137.723.000,00 |
58.892.000,00 |
0,00 |
0,00 |
0,00 |
|
|
6. Other investments: 11460 |
0,00 |
0,00 |
0,00 |
0,00 |
0,00 |
|
|
V. Long-term financial investments: 11500 |
12.251.000,00 |
8.115.000,00 |
6.618.000,00 |
5.970.000,00 |
4.363.000,00 |
|
|
1. Equity instruments: 11510 |
0,00 |
0,00 |
0,00 |
0,00 |
0,00 |
|
|
2. Credits to third parties : 11520 |
0,00 |
0,00 |
0,00 |
25.000,00 |
100.000,00 |
|
|
3. Debt securities: 11530 |
3.585.000,00 |
2.550.000,00 |
1.750.000,00 |
1.400.000,00 |
0,00 |
|
|
4. Derivatives : 11540 |
0,00 |
0,00 |
0,00 |
0,00 |
0,00 |
|
|
5. Other financial assets : 11550 |
8.666.000,00 |
5.565.000,00 |
4.868.000,00 |
4.545.000,00 |
4.263.000,00 |
|
|
6. Other investments: 11560 |
0,00 |
0,00 |
0,00 |
0,00 |
0,00 |
|
|
VI. Assets for deferred tax : 11600 |
212.169.000,00 |
219.397.000,00 |
201.452.000,00 |
182.955.000,00 |
170.894.000,00 |
|
|
VII. Non-current trade debts : 11700 |
0,00 |
0,00 |
0,00 |
0,00 |
0,00 |
|
|
B)
CURRENT ASSETS: 12000 |
1.472.559.000,00 |
1.245.786.000,00 |
1.138.476.000,00 |
1.334.100.000,00 |
873.889.000,00 |
|
|
I. Non-current assets held for sale : 12100 |
0,00 |
0,00 |
0,00 |
0,00 |
0,00 |
|
|
II. Stocks: 12200 |
474.746.000,00 |
367.693.000,00 |
343.592.000,00 |
348.742.000,00 |
302.685.000,00 |
|
|
1. Commercial: 12210 |
416.810.000,00 |
306.003.000,00 |
299.257.000,00 |
309.410.000,00 |
270.755.000,00 |
|
|
2. Primary material and other supplies:
12220 |
57.936.000,00 |
61.690.000,00 |
19.652.000,00 |
26.639.000,00 |
16.516.000,00 |
|
|
3. Work in progress: 12230 |
0,00 |
0,00 |
24.679.000,00 |
12.693.000,00 |
15.403.000,00 |
|
|
a) Of long-term
production cycle : 12231 |
0,00 |
0,00 |
0,00 |
0,00 |
0,00 |
|
|
b) Of short-term production
cycle : 12232 |
0,00 |
0,00 |
24.679.000,00 |
12.693.000,00 |
15.403.000,00 |
|
|
4. Finished goods: 12240 |
0,00 |
0,00 |
4.000,00 |
0,00 |
11.000,00 |
|
|
a) Of long-term
production cycle : 12241 |
0,00 |
0,00 |
0,00 |
0,00 |
0,00 |
|
|
b) Of short-term
production cycle : 12242 |
0,00 |
0,00 |
4.000,00 |
0,00 |
11.000,00 |
|
|
5. By-products, residues and recycled
materials: 12250 |
0,00 |
0,00 |
0,00 |
0,00 |
0,00 |
|
|
6. Advances to suppliers: 12260 |
0,00 |
0,00 |
0,00 |
0,00 |
0,00 |
|
|
III. Trade debtors and others receivable accounts: 12300 |
247.676.000,00 |
318.463.000,00 |
284.385.000,00 |
293.443.000,00 |
267.130.000,00 |
|
|
1. Trade debtors / accounts receivable:
12310 |
81.064.000,00 |
138.804.000,00 |
177.150.000,00 |
173.349.000,00 |
182.752.000,00 |
|
|
a) Long-term receivables
from sales and services supplied : 12311 |
0,00 |
0,00 |
0,00 |
0,00 |
0,00 |
|
|
b) Customers for
sales and provisions of services : 12312 |
81.064.000,00 |
138.804.000,00 |
177.150.000,00 |
173.349.000,00 |
182.752.000,00 |
|
|
2. Customers, Group companies and
associates : 12320 |
115.255.000,00 |
148.327.000,00 |
76.477.000,00 |
102.792.000,00 |
68.298.000,00 |
|
|
3. Other accounts receivable: 12330 |
11.593.000,00 |
10.468.000,00 |
10.865.000,00 |
7.505.000,00 |
5.258.000,00 |
|
|
4. Personnel: 12340 |
563.000,00 |
0,00 |
18.000,00 |
232.000,00 |
148.000,00 |
|
|
5. Assets for deferred tax: 12350 |
0,00 |
0,00 |
0,00 |
0,00 |
0,00 |
|
|
6. Other debtors, including tax and social
security: 12360 |
39.201.000,00 |
20.864.000,00 |
19.875.000,00 |
9.565.000,00 |
10.674.000,00 |
|
|
7. Called up share capital: 12370 |
0,00 |
0,00 |
0,00 |
0,00 |
0,00 |
|
|
IV. Short-term investments in Group companies and associates:
12400 |
1.000,00 |
0,00 |
141.000,00 |
83.000,00 |
0,00 |
|
|
1. Equity instruments: 12410 |
0,00 |
0,00 |
0,00 |
0,00 |
0,00 |
|
|
2. Credits to businesses: 12420 |
0,00 |
0,00 |
0,00 |
0,00 |
0,00 |
|
|
3. Debt securities: 12430 |
0,00 |
0,00 |
0,00 |
0,00 |
0,00 |
|
|
4. Derivatives : 12440 |
0,00 |
0,00 |
0,00 |
0,00 |
0,00 |
|
|
5. Other financial assets : 12450 |
1.000,00 |
0,00 |
141.000,00 |
83.000,00 |
0,00 |
|
|
6. Other investments: 12460 |
0,00 |
0,00 |
0,00 |
0,00 |
0,00 |
|
|
V. Short-term financial investments : 12500 |
281.886.000,00 |
255.907.000,00 |
207.595.000,00 |
136.753.000,00 |
164.398.000,00 |
|
|
1. Equity instruments: 12510 |
0,00 |
0,00 |
0,00 |
0,00 |
0,00 |
|
|
2. Credits to businesses: 12520 |
129.482.000,00 |
176.882.000,00 |
144.126.000,00 |
130.703.000,00 |
152.404.000,00 |
|
|
3. Debt securities: 12530 |
150.000.000,00 |
75.500.000,00 |
62.500.000,00 |
2.319.000,00 |
10.225.000,00 |
|
|
4. Derivatives : 12540 |
0,00 |
0,00 |
616.000,00 |
3.147.000,00 |
812.000,00 |
|
|
5. Other financial assets : 12550 |
2.404.000,00 |
3.525.000,00 |
353.000,00 |
584.000,00 |
957.000,00 |
|
|
6. Other investments: 12560 |
0,00 |
0,00 |
0,00 |
0,00 |
0,00 |
|
|
VI. Short-term accruals: 12600 |
29.647.000,00 |
23.341.000,00 |
14.118.000,00 |
7.052.000,00 |
6.670.000,00 |
|
|
VII. Cash and other equivalent liquid assets : 12700 |
438.603.000,00 |
280.382.000,00 |
288.645.000,00 |
548.027.000,00 |
133.006.000,00 |
|
|
1. Treasury: 12710 |
438.603.000,00 |
178.382.000,00 |
96.923.000,00 |
227.084.000,00 |
57.810.000,00 |
|
|
2. Other equivalent liquid assets:
12720 |
0,00 |
102.000.000,00 |
191.722.000,00 |
320.943.000,00 |
75.196.000,00 |
|
|
TOTAL
ASSETS (A + B) : 10000 |
2.900.873.000,00 |
2.629.832.000,00 |
2.602.215.000,00 |
2.633.954.000,00 |
2.154.336.000,00 |
|
|
|
ORIGINAL |
ORIGINAL |
ORIGINAL |
ORIGINAL |
ORIGINAL |
|
|
Liabilities
and Net Worth |
2014 |
2013 |
2012 |
2011 |
2010 |
|
|
A) NET
WORTH: 20000 |
582.529.000,00 |
515.452.000,00 |
405.329.000,00 |
428.229.000,00 |
498.045.000,00 |
|
|
A-1) Shareholders' equity: 21000 |
582.529.000,00 |
515.452.000,00 |
405.329.000,00 |
428.229.000,00 |
498.045.000,00 |
|
|
I. Capital: 21100 |
13.000,00 |
13.000,00 |
13.000,00 |
13.000,00 |
13.000,00 |
|
|
1. Registered capital : 21110 |
13.000,00 |
13.000,00 |
13.000,00 |
13.000,00 |
13.000,00 |
|
|
2. (Uncalled capital): 21120 |
0,00 |
0,00 |
0,00 |
0,00 |
0,00 |
|
|
II. Share premium: 21200 |
31.184.000,00 |
31.184.000,00 |
31.184.000,00 |
31.184.000,00 |
31.184.000,00 |
|
|
III. Reserves: 21300 |
485.092.000,00 |
377.991.000,00 |
303.605.000,00 |
372.951.000,00 |
338.559.000,00 |
|
|
1. Legal and statutory: 21310 |
3.000,00 |
3.000,00 |
3.000,00 |
3.000,00 |
3.000,00 |
|
|
2. Other reserves: 21320 |
481.230.000,00 |
374.129.000,00 |
303.602.000,00 |
372.948.000,00 |
338.556.000,00 |
|
|
3. Revaluation reserves: 21330 |
3.859.000,00 |
3.859.000,00 |
0,00 |
0,00 |
0,00 |
|
|
IV. (Common stock equity): 21400 |
0,00 |
0,00 |
0,00 |
0,00 |
0,00 |
|
|
V. Results from previous periods: 21500 |
0,00 |
0,00 |
0,00 |
0,00 |
0,00 |
|
|
1. Brought forward: 21510 |
0,00 |
0,00 |
0,00 |
0,00 |
0,00 |
|
|
2. (Negative results from previous
periods): 21520 |
0,00 |
0,00 |
0,00 |
0,00 |
0,00 |
|
|
VI. Other shareholders' contributions: 21600 |
0,00 |
0,00 |
0,00 |
0,00 |
0,00 |
|
|
VII. Result of the period: 21700 |
66.240.000,00 |
106.264.000,00 |
70.527.000,00 |
24.081.000,00 |
128.289.000,00 |
|
|
VIII. (Interim dividend): 21800 |
0,00 |
0,00 |
0,00 |
0,00 |
0,00 |
|
|
IX. Other net worth instruments: 21900 |
0,00 |
0,00 |
0,00 |
0,00 |
0,00 |
|
|
A-2) Adjustments due to changes in value: 22000 |
0,00 |
0,00 |
0,00 |
0,00 |
0,00 |
|
|
I. Financial assets held for sale: 22100 |
0,00 |
0,00 |
0,00 |
0,00 |
0,00 |
|
|
II. Hedge operations: 22200 |
0,00 |
0,00 |
0,00 |
0,00 |
0,00 |
|
|
III. Linked non-current assets and liabilities held for sale :
22300 |
0,00 |
0,00 |
0,00 |
0,00 |
0,00 |
|
|
IV. Exchange rate difference: 22400 |
0,00 |
0,00 |
0,00 |
0,00 |
0,00 |
|
|
V. Other: 22500 |
0,00 |
0,00 |
0,00 |
0,00 |
0,00 |
|
|
A-3) Received subsidies, donations and legacies: 23000 |
0,00 |
0,00 |
0,00 |
0,00 |
0,00 |
|
|
B)
NON-CURRENT LIABILITIES: 31000 |
1.538.214.000,00 |
1.489.711.000,00 |
1.612.146.000,00 |
1.525.168.000,00 |
892.160.000,00 |
|
|
I. Long-term provisions: 31100 |
6.341.000,00 |
7.261.000,00 |
2.440.000,00 |
2.298.000,00 |
2.142.000,00 |
|
|
1. Long-term employee benefits liability:
31110 |
0,00 |
0,00 |
0,00 |
0,00 |
0,00 |
|
|
2. Environmental actions: 31120 |
0,00 |
0,00 |
0,00 |
0,00 |
0,00 |
|
|
3. Restructuring provisions: 31130 |
0,00 |
0,00 |
0,00 |
0,00 |
0,00 |
|
|
4. Other provisions: 31140 |
6.341.000,00 |
7.261.000,00 |
2.440.000,00 |
2.298.000,00 |
0,00 |
|
|
II Long-term creditors: 31200 |
773.693.000,00 |
697.582.000,00 |
753.206.000,00 |
706.029.000,00 |
649.440.000,00 |
|
|
1. Liabilities and other securities:
31210 |
0,00 |
0,00 |
0,00 |
0,00 |
0,00 |
|
|
2. Amounts owed to credit institutions:
31220 |
741.293.000,00 |
672.796.000,00 |
731.430.000,00 |
678.681.000,00 |
609.181.000,00 |
|
|
3. Creditors from financial leasing:
31230 |
24.111.000,00 |
16.662.000,00 |
14.200.000,00 |
22.797.000,00 |
31.637.000,00 |
|
|
4. Derivatives : 31240 |
0,00 |
0,00 |
0,00 |
804.000,00 |
737.000,00 |
|
|
5. Other financial liabilities :
31250 |
8.289.000,00 |
8.124.000,00 |
7.576.000,00 |
3.747.000,00 |
7.885.000,00 |
|
|
III. Long-term debts with Group companies and associates:
31300 |
736.432.000,00 |
760.845.000,00 |
834.315.000,00 |
795.452.000,00 |
224.955.000,00 |
|
|
IV. Liabilities for deferred tax: 31400 |
21.748.000,00 |
24.023.000,00 |
22.185.000,00 |
21.389.000,00 |
15.623.000,00 |
|
|
V. Long-term accruals: 31500 |
0,00 |
0,00 |
0,00 |
0,00 |
0,00 |
|
|
VI. Non-current trade creditors : 31600 |
0,00 |
0,00 |
0,00 |
0,00 |
0,00 |
|
|
VII. Special long-term debts : 31700 |
0,00 |
0,00 |
0,00 |
0,00 |
0,00 |
|
|
C)
CURRENT LIABILITIES : 32000 |
780.130.000,00 |
624.669.000,00 |
584.740.000,00 |
680.557.000,00 |
764.131.000,00 |
|
|
I. Liabilities linked to non-current assets held for sale:
32100 |
0,00 |
0,00 |
0,00 |
0,00 |
0,00 |
|
|
II. Short-term provisions: 32200 |
0,00 |
0,00 |
0,00 |
0,00 |
0,00 |
|
|
1. Provisions from greenhouse gas emission
allowance: 32210 |
0,00 |
0,00 |
0,00 |
0,00 |
0,00 |
|
|
2. Other provisions: 32220 |
0,00 |
0,00 |
0,00 |
0,00 |
0,00 |
|
|
III. Short-term creditors : 32300 |
350.813.000,00 |
270.569.000,00 |
294.041.000,00 |
412.765.000,00 |
545.793.000,00 |
|
|
1. Liabilities and other securities:
32310 |
0,00 |
0,00 |
0,00 |
0,00 |
0,00 |
|
|
2. Amounts owed to credit institutions:
32320 |
342.337.000,00 |
264.545.000,00 |
284.927.000,00 |
394.699.000,00 |
526.989.000,00 |
|
|
3. Creditors from financial leasing:
32330 |
8.476.000,00 |
6.024.000,00 |
9.112.000,00 |
14.272.000,00 |
16.175.000,00 |
|
|
4. Derivatives : 32340 |
0,00 |
0,00 |
0,00 |
3.794.000,00 |
2.629.000,00 |
|
|
5. Other financial liabilities :
32350 |
0,00 |
0,00 |
2.000,00 |
0,00 |
0,00 |
|
|
IV. Short-term debts with Group companies and associates:
32400 |
0,00 |
0,00 |
0,00 |
0,00 |
0,00 |
|
|
V. Trade creditors and other accounts payable: 32500 |
377.496.000,00 |
317.807.000,00 |
269.084.000,00 |
260.103.000,00 |
208.911.000,00 |
|
|
1. Suppliers: 32510 |
185.478.000,00 |
186.525.000,00 |
156.588.000,00 |
177.415.000,00 |
159.107.000,00 |
|
|
a) Long-term debts :
32511 |
0,00 |
0,00 |
0,00 |
0,00 |
0,00 |
|
|
b) Short-term debts :
32512 |
185.478.000,00 |
186.525.000,00 |
156.588.000,00 |
177.415.000,00 |
159.107.000,00 |
|
|
2. Suppliers, Group companies and
associates: 32520 |
111.114.000,00 |
74.513.000,00 |
65.416.000,00 |
58.644.000,00 |
26.600.000,00 |
|
|
3. Other creditors: 32530 |
39.151.000,00 |
23.957.000,00 |
19.565.000,00 |
4.832.000,00 |
3.346.000,00 |
|
|
4. Personnel (remuneration due):
32540 |
6.407.000,00 |
8.218.000,00 |
5.849.000,00 |
5.106.000,00 |
5.056.000,00 |
|
|
5. Liabilities for current tax:
32550 |
0,00 |
0,00 |
0,00 |
0,00 |
0,00 |
|
|
6. Other accounts payable to Public
Administrations.: 32560 |
35.346.000,00 |
24.594.000,00 |
21.666.000,00 |
14.106.000,00 |
14.802.000,00 |
|
|
7. Advances from clients: 32570 |
0,00 |
0,00 |
0,00 |
0,00 |
0,00 |
|
|
VI. Short-term accruals: 32600 |
51.821.000,00 |
36.293.000,00 |
21.615.000,00 |
7.689.000,00 |
9.427.000,00 |
|
|
VII. Special short-term debts : 32700 |
0,00 |
0,00 |
0,00 |
0,00 |
0,00 |
|
|
TOTAL
NET WORTH AND LIABILITIES (A + B + C) : 30000 |
2.900.873.000,00 |
2.629.832.000,00 |
2.602.215.000,00 |
2.633.954.000,00 |
2.154.336.000,00 |
|
|
|
ORIGINAL |
ORIGINAL |
ORIGINAL |
ORIGINAL |
ORIGINAL |
|
|
Profit
and Loss |
2014 |
2013 |
2012 |
2011 |
2010 |
|
|
1. Net
turnover: 40100 |
1.310.010.000,00 |
1.230.913.000,00 |
1.118.748.000,00 |
1.006.299.000,00 |
895.269.000,00 |
|
|
a) Sales: 40110 |
1.299.423.000,00 |
1.219.791.000,00 |
1.107.093.000,00 |
995.497.000,00 |
886.020.000,00 |
|
|
b) Rendering of services: 40120 |
10.587.000,00 |
11.122.000,00 |
11.655.000,00 |
10.802.000,00 |
9.249.000,00 |
|
|
c) Income of financial nature of holding companies: 40130 |
0,00 |
0,00 |
0,00 |
0,00 |
0,00 |
|
|
2.
Changes in stocks of finished goods and work in progress: 40200 |
105.927.000,00 |
24.039.000,00 |
-8.000.000,00 |
-2.721.000,00 |
8.758.000,00 |
|
|
3. Works
carried out by the company for its assets: 40300 |
0,00 |
0,00 |
0,00 |
0,00 |
0,00 |
|
|
4.
Supplies : 40400 |
-870.271.000,00 |
-683.862.000,00 |
-640.909.000,00 |
-602.240.000,00 |
-520.216.000,00 |
|
|
a) Stock consumption: 40410 |
-561.857.000,00 |
-449.796.000,00 |
-458.545.000,00 |
-455.458.000,00 |
-360.191.000,00 |
|
|
b) Consumption of raw materials and miscellaneous consumable ones:
40420 |
-217.359.000,00 |
-149.065.000,00 |
-121.951.000,00 |
-90.675.000,00 |
-107.576.000,00 |
|
|
c) Works carried out by other companies: 40430 |
-91.055.000,00 |
-85.001.000,00 |
-60.413.000,00 |
-56.107.000,00 |
-52.449.000,00 |
|
|
d) Impairment of stock, primary material and other supplies:
40440 |
0,00 |
0,00 |
0,00 |
0,00 |
0,00 |
|
|
5. Other
operating income: 40500 |
252.701.000,00 |
139.367.000,00 |
126.847.000,00 |
131.400.000,00 |
94.890.000,00 |
|
|
a) Auxiliary income and other from current management:
40510 |
252.701.000,00 |
139.367.000,00 |
126.847.000,00 |
131.400.000,00 |
94.669.000,00 |
|
|
b) Operation subsidies included in the Period's
result: 40520 |
0,00 |
0,00 |
0,00 |
0,00 |
221.000,00 |
|
|
6.
Personnel costs: 40600 |
-159.243.000,00 |
-151.838.000,00 |
-136.861.000,00 |
-131.970.000,00 |
-120.262.000,00 |
|
|
a) Wages, salaries et al.: 40610 |
-123.223.000,00 |
-111.879.000,00 |
-106.134.000,00 |
-102.677.000,00 |
-92.850.000,00 |
|
|
b) Social security costs: 40620 |
-36.020.000,00 |
-39.959.000,00 |
-30.727.000,00 |
-29.293.000,00 |
-27.412.000,00 |
|
|
c) Provisions : 40630 |
0,00 |
0,00 |
0,00 |
0,00 |
0,00 |
|
|
7. Other
operating costs: 40700 |
-466.938.000,00 |
-369.910.000,00 |
-333.461.000,00 |
-288.312.000,00 |
-200.272.000,00 |
|
|
a) External services: 40710 |
-464.149.000,00 |
-366.368.000,00 |
-330.496.000,00 |
-285.817.000,00 |
-190.050.000,00 |
|
|
b) Taxes: 40720 |
-2.772.000,00 |
-2.826.000,00 |
-1.915.000,00 |
-1.934.000,00 |
-1.681.000,00 |
|
|
c) Losses, impairments and variation in provisions from trade
operations : 40730 |
0,00 |
0,00 |
0,00 |
0,00 |
0,00 |
|
|
d) Other current management expenditure : 40740 |
-17.000,00 |
-19.000,00 |
-1.050.000,00 |
-561.000,00 |
-8.541.000,00 |
|
|
e) Expenses due to greenhouse gas emissions: 40750 |
0,00 |
-697.000,00 |
0,00 |
0,00 |
0,00 |
|
|
8.
Amortisation of fixed assets: 40800 |
-34.443.000,00 |
-31.639.000,00 |
-31.119.000,00 |
-29.898.000,00 |
-29.809.000,00 |
|
|
9.
Allocation of subsidies of non-financial fixed assets and other: 40900 |
0,00 |
0,00 |
0,00 |
0,00 |
0,00 |
|
|
10.
Excess provisions : 41000 |
0,00 |
0,00 |
0,00 |
0,00 |
0,00 |
|
|
11.
Impairment and result of transfers of fixed assets: 41100 |
-3.254.000,00 |
-2.143.000,00 |
-460.000,00 |
-876.000,00 |
-11.378.000,00 |
|
|
a) Impairment and losses : 41110 |
0,00 |
0,00 |
0,00 |
0,00 |
-10.513.000,00 |
|
|
b) Results for transfers and other : 41120 |
-3.254.000,00 |
-2.143.000,00 |
-460.000,00 |
-876.000,00 |
-865.000,00 |
|
|
c) Impairment and profit due to disposals of assets of holding
companies: 41130 |
0,00 |
0,00 |
0,00 |
0,00 |
0,00 |
|
|
12.
Negative difference in combined businesses: 41200 |
0,00 |
0,00 |
0,00 |
0,00 |
0,00 |
|
|
13. Other
results : 41300 |
0,00 |
0,00 |
0,00 |
0,00 |
0,00 |
|
|
A.1)
OPERATING INCOME (1 + 2 + 3 + 4 + 5 + 6 + 7 + 8 + 9 + 10 + 11 + 12 + 13) :
49100 |
134.489.000,00 |
154.927.000,00 |
94.785.000,00 |
81.682.000,00 |
116.980.000,00 |
|
|
14. Financial
income : 41400 |
13.783.000,00 |
14.251.000,00 |
11.542.000,00 |
20.035.000,00 |
17.281.000,00 |
|
|
a) Of shares in equity instruments : 41410 |
2.264.000,00 |
484.000,00 |
110.000,00 |
162.000,00 |
11.121.000,00 |
|
|
a 1) In Group companies and associates:
41411 |
2.264.000,00 |
484.000,00 |
110.000,00 |
162.000,00 |
11.121.000,00 |
|
|
a 2) In third parties: 41412 |
0,00 |
0,00 |
0,00 |
0,00 |
0,00 |
|
|
b) From negotiable securities and other financial instruments :
41420 |
11.519.000,00 |
13.767.000,00 |
11.432.000,00 |
19.873.000,00 |
6.160.000,00 |
|
|
b 1) From Group companies and associates :
41421 |
384.000,00 |
164.000,00 |
238.000,00 |
886.000,00 |
725.000,00 |
|
|
b 2) From third parties : 41422 |
11.135.000,00 |
13.603.000,00 |
11.194.000,00 |
18.987.000,00 |
5.435.000,00 |
|
|
c) Allocation of financial subsidies, donations and legacies : 41430 |
0,00 |
0,00 |
0,00 |
0,00 |
0,00 |
|
|
15.
Financial expenditure: 41500 |
-37.161.000,00 |
-34.824.000,00 |
-47.094.000,00 |
-40.819.000,00 |
-37.723.000,00 |
|
|
a) Amounts owed to Group companies and associates : 41510 |
-12.808.000,00 |
-13.381.000,00 |
-12.813.000,00 |
-8.548.000,00 |
-5.414.000,00 |
|
|
b) For debts with third parties : 41520 |
-24.353.000,00 |
-21.443.000,00 |
-34.281.000,00 |
-32.271.000,00 |
-32.309.000,00 |
|
|
c) Stock renewal : 41530 |
0,00 |
0,00 |
0,00 |
0,00 |
0,00 |
|
|
16.
Changes in fair value of financial instruments : 41600 |
0,00 |
-616.000,00 |
2.549.000,00 |
1.131.000,00 |
-708.000,00 |
|
|
a) Trading book and other : 41610 |
0,00 |
-616.000,00 |
2.549.000,00 |
1.131.000,00 |
-708.000,00 |
|
|
b) Allocation of financial assets held for sale to the result
for the period: 41620 |
0,00 |
0,00 |
0,00 |
0,00 |
0,00 |
|
|
17.
Exchange rate differences : 41700 |
-42.788.000,00 |
-11.022.000,00 |
1.826.000,00 |
-1.461.000,00 |
24.667.000,00 |
|
|
18.
Impairment and result for transfers of financial instruments: 41800 |
11.616.000,00 |
4.942.000,00 |
-7.207.000,00 |
-45.201.000,00 |
10.115.000,00 |
|
|
a) Impairment and losses : 41810 |
-9.799.000,00 |
-18.769.000,00 |
-7.206.000,00 |
-45.201.000,00 |
0,00 |
|
|
b) Results for transfers and other : 41820 |
21.415.000,00 |
23.711.000,00 |
-1.000,00 |
0,00 |
10.115.000,00 |
|
|
19.
Other financial income and expenditure: 42100 |
0,00 |
0,00 |
0,00 |
0,00 |
0,00 |
|
|
a) Incorporation of financial expenditure to assets:
42110 |
0,00 |
0,00 |
0,00 |
0,00 |
0,00 |
|
|
b) Financial income from arrangement with creditors:
42120 |
0,00 |
0,00 |
0,00 |
0,00 |
0,00 |
|
|
c) Other income and expenditure: 42130 |
0,00 |
0,00 |
0,00 |
0,00 |
0,00 |
|
|
A.2)
FINANCIAL REVENUE (14+15+16+17+18+19) : 49200 |
-54.550.000,00 |
-27.269.000,00 |
-38.384.000,00 |
-66.315.000,00 |
13.632.000,00 |
|
|
A.3) NET
RESULT BEFORE TAXES (A.1+A.2) : 49300 |
79.939.000,00 |
127.658.000,00 |
56.401.000,00 |
15.367.000,00 |
130.612.000,00 |
|
|
20. Income
taxes: 41900 |
-13.699.000,00 |
-21.394.000,00 |
14.126.000,00 |
8.714.000,00 |
-2.323.000,00 |
|
|
A.4)
PROFIT AFTER TAXES (A.3+20) : 49400 |
66.240.000,00 |
106.264.000,00 |
70.527.000,00 |
24.081.000,00 |
128.289.000,00 |
|
|
21. Result
of the year coming from interrupted operations : 42000 |
0,00 |
0,00 |
0,00 |
0,00 |
0,00 |
|
|
A.5)
RESULT OF THE PERIOD (A.4+21) : 49500 |
66.240.000,00 |
106.264.000,00 |
70.527.000,00 |
24.081.000,00 |
128.289.000,00 |
|
>
Normal Balance Sheet under the rules of the 1990 General Accounting Plan
(repealed since 1st January of 2008)
Information
corresponding to the fiscal year
2014 2013 2012 2011 2010 has been compiled based on
the equivalence criteria stipulated in Act JUS/206/2009. To view details on the
methodology 2014 2013 2012 2011 2010 is taken from
information submitted to the TRADE REGISTER.
|
|
EQUIVALENCIA |
EQUIVALENCIA |
EQUIVALENCIA |
EQUIVALENCIA |
EQUIVALENCIA |
|
|
ASSETS |
2014 |
2013 |
2012 |
2011 |
2010 |
|
|
A)
SHAREHOLDERS (PARTNERS) BY UNCALLED SUSCRIBED CAPITAL: |
0,00 |
0,00 |
0,00 |
0,00 |
0,00 |
|
|
B) FIXED
ASSETS: |
1.216.145.000,00 |
1.164.649.000,00 |
1.262.287.000,00 |
1.116.899.000,00 |
1.109.553.000,00 |
|
|
I. Formation expenses: |
0,00 |
0,00 |
0,00 |
0,00 |
0,00 |
|
|
II. Intangible fixed assets: |
29.040.000,00 |
16.907.000,00 |
16.010.000,00 |
15.162.000,00 |
14.426.000,00 |
|
|
1. Research and development costs: |
0,00 |
0,00 |
0,00 |
0,00 |
0,00 |
|
|
2. Concessions, patents, licences,
trademarks et al.: |
0,00 |
0,00 |
0,00 |
0,00 |
0,00 |
|
|
3. Goodwill: |
0,00 |
0,00 |
0,00 |
0,00 |
0,00 |
|
|
4. Key money paid for premises: |
25.531.000,00 |
14.582.000,00 |
13.369.000,00 |
12.444.000,00 |
12.283.000,00 |
|
|
5. Software: |
3.509.000,00 |
2.325.000,00 |
2.641.000,00 |
2.718.000,00 |
2.143.000,00 |
|
|
6. Assets under capital leases: |
0,00 |
0,00 |
0,00 |
0,00 |
0,00 |
|
|
7. Payments on account: |
0,00 |
0,00 |
0,00 |
0,00 |
0,00 |
|
|
8. Provisions: |
0,00 |
0,00 |
0,00 |
0,00 |
0,00 |
|
|
9. Accumulated depreciation: |
0,00 |
0,00 |
0,00 |
0,00 |
0,00 |
|
|
III. Tangible fixed assets: |
154.558.000,00 |
110.292.000,00 |
104.577.000,00 |
111.965.000,00 |
124.773.000,00 |
|
|
1. Land and construction: |
0,00 |
0,00 |
0,00 |
0,00 |
0,00 |
|
|
2. Technical installations and machinery:
|
4.831.410,00 |
5.338.910,00 |
5.981.051,00 |
6.656.370,00 |
7.398.467,00 |
|
|
3. Other installations, tools and
furniture: |
44.600.013,00 |
49.284.874,00 |
55.212.646,00 |
61.446.692,00 |
68.297.180,00 |
|
|
4. Payments on account and tangible fixed
assets under construction: |
74.466.000,00 |
21.787.000,00 |
5.427.000,00 |
1.620.000,00 |
2.126.000,00 |
|
|
5. Other tangible assets: |
30.660.577,00 |
33.881.216,00 |
37.956.303,00 |
42.241.938,00 |
46.951.353,00 |
|
|
6. Provisions: |
0,00 |
0,00 |
0,00 |
0,00 |
0,00 |
|
|
7. Accumulated depreciation: |
0,00 |
0,00 |
0,00 |
0,00 |
0,00 |
|
|
IV. Financial investments: |
1.032.547.000,00 |
1.037.450.000,00 |
1.141.700.000,00 |
989.772.000,00 |
970.354.000,00 |
|
|
1. Equity investments in group companies:
|
882.573.000,00 |
970.443.000,00 |
1.098.746.000,00 |
930.961.000,00 |
923.717.000,00 |
|
|
2. Receivables from group companies:
|
0,00 |
0,00 |
36.336.000,00 |
52.841.000,00 |
42.274.000,00 |
|
|
3. Equity investment in associated
companies: |
0,00 |
0,00 |
0,00 |
0,00 |
0,00 |
|
|
4. Credits to associated companies: |
0,00 |
0,00 |
0,00 |
0,00 |
0,00 |
|
|
5. Long-term securities portfolio: |
3.585.000,00 |
2.550.000,00 |
1.750.000,00 |
1.400.000,00 |
0,00 |
|
|
6. Other receivables: |
0,00 |
0,00 |
0,00 |
25.000,00 |
100.000,00 |
|
|
7. Long term guarantees and deposits:
|
146.389.000,00 |
64.457.000,00 |
4.868.000,00 |
4.545.000,00 |
4.263.000,00 |
|
|
8. Provisions: |
0,00 |
0,00 |
0,00 |
0,00 |
0,00 |
|
|
9. Long-term receivables from public
bodies: |
0,00 |
0,00 |
0,00 |
0,00 |
0,00 |
|
|
V. Own shares: |
0,00 |
0,00 |
0,00 |
0,00 |
0,00 |
|
|
VI. Long-term trade receivables: |
0,00 |
0,00 |
0,00 |
0,00 |
0,00 |
|
|
C) Deferred
expenses: |
0,00 |
0,00 |
0,00 |
0,00 |
0,00 |
|
|
D)
CURRENT ASSETS: |
1.684.728.000,00 |
1.465.183.000,00 |
1.339.312.000,00 |
1.513.908.000,00 |
1.043.971.000,00 |
|
|
I. Called-up share capital (not paid): |
0,00 |
0,00 |
0,00 |
0,00 |
0,00 |
|
|
II. Stocks: |
474.746.000,00 |
367.693.000,00 |
343.592.000,00 |
348.742.000,00 |
302.685.000,00 |
|
|
1. Goods for resale: |
416.810.000,00 |
306.003.000,00 |
299.257.000,00 |
309.410.000,00 |
270.755.000,00 |
|
|
2. Raw materials and other consumables:
|
57.936.000,00 |
61.690.000,00 |
19.652.000,00 |
26.639.000,00 |
16.516.000,00 |
|
|
3. Goods in process and semifinished ones:
|
0,00 |
0,00 |
24.679.000,00 |
12.693.000,00 |
15.403.000,00 |
|
|
4. Finished products: |
0,00 |
0,00 |
4.000,00 |
0,00 |
11.000,00 |
|
|
5. Byproducts, scrap and recovered
materials: |
0,00 |
0,00 |
0,00 |
0,00 |
0,00 |
|
|
6. Payments on account: |
0,00 |
0,00 |
0,00 |
0,00 |
0,00 |
|
|
7. Provisions: |
0,00 |
0,00 |
0,00 |
0,00 |
0,00 |
|
|
III. Debtors: |
459.845.000,00 |
537.860.000,00 |
485.837.000,00 |
476.398.000,00 |
438.024.000,00 |
|
|
1. Trade debtors / accounts receivable:
|
81.064.000,00 |
138.804.000,00 |
177.150.000,00 |
173.349.000,00 |
182.752.000,00 |
|
|
2. Accounts receivable, Group companies:
|
115.255.000,00 |
148.327.000,00 |
76.477.000,00 |
102.792.000,00 |
68.298.000,00 |
|
|
3. Accounts receivable, associated
companies: |
0,00 |
0,00 |
0,00 |
0,00 |
0,00 |
|
|
4. Other debtors: |
11.593.000,00 |
10.468.000,00 |
10.865.000,00 |
7.505.000,00 |
5.258.000,00 |
|
|
5. Staff: |
563.000,00 |
0,00 |
18.000,00 |
232.000,00 |
148.000,00 |
|
|
6. Public bodies: |
251.370.000,00 |
240.261.000,00 |
221.327.000,00 |
192.520.000,00 |
181.568.000,00 |
|
|
7. Provisions: |
0,00 |
0,00 |
0,00 |
0,00 |
0,00 |
|
|
IV. Short-term investments: |
281.887.000,00 |
357.907.000,00 |
398.842.000,00 |
454.632.000,00 |
238.782.000,00 |
|
|
1. Equity investments in group companies:
|
0,00 |
0,00 |
0,00 |
0,00 |
0,00 |
|
|
2. Receivables from group companies:
|
0,00 |
0,00 |
0,00 |
0,00 |
0,00 |
|
|
3. Equity investment in associated
companies: |
0,00 |
0,00 |
0,00 |
0,00 |
0,00 |
|
|
4. Credits to associated companies: |
0,00 |
0,00 |
0,00 |
0,00 |
0,00 |
|
|
5. Short term securities portfolio: |
150.000.000,00 |
177.500.000,00 |
254.222.000,00 |
323.262.000,00 |
85.421.000,00 |
|
|
6. Other receivables: |
129.483.000,00 |
176.882.000,00 |
144.267.000,00 |
130.786.000,00 |
152.404.000,00 |
|
|
7. Shor term guarantees and deposits:
|
2.404.000,00 |
3.525.000,00 |
353.000,00 |
584.000,00 |
957.000,00 |
|
|
8. Provisions: |
0,00 |
0,00 |
0,00 |
0,00 |
0,00 |
|
|
V. Short-term treasury shares: |
0,00 |
0,00 |
0,00 |
0,00 |
0,00 |
|
|
VI. Cash at bank and in hand: |
438.603.000,00 |
178.382.000,00 |
96.923.000,00 |
227.084.000,00 |
57.810.000,00 |
|
|
VII. Prepayments and accrued income: |
29.647.000,00 |
23.341.000,00 |
14.118.000,00 |
7.052.000,00 |
6.670.000,00 |
|
|
GENERAL
TOTAL (A + B + C + D): |
2.900.873.000,00 |
2.629.832.000,00 |
2.601.599.000,00 |
2.630.807.000,00 |
2.153.524.000,00 |
|
MERCANTILE REGISTRY.
|
|
EQUIVALENCIA |
EQUIVALENCIA |
EQUIVALENCIA |
EQUIVALENCIA |
EQUIVALENCIA |
|
|
LIABILITIES |
2014 |
2013 |
2012 |
2011 |
2010 |
|
|
A)
EQUITY: |
578.670.000,00 |
511.593.000,00 |
404.713.000,00 |
429.680.000,00 |
500.599.000,00 |
|
|
I. Subscribed capital: |
13.000,00 |
13.000,00 |
13.000,00 |
13.000,00 |
13.000,00 |
|
|
II. Share premium: |
31.184.000,00 |
31.184.000,00 |
31.184.000,00 |
31.184.000,00 |
31.184.000,00 |
|
|
III. Revaluation reserves: |
547.167,00 |
425.391,00 |
344.500,00 |
424.834,00 |
388.567,00 |
|
|
IV. Reserves: |
480.685.833,00 |
373.706.609,00 |
302.644.500,00 |
373.977.166,00 |
340.724.433,00 |
|
|
1. Legal reserve: |
3.000,00 |
3.000,00 |
3.000,00 |
3.000,00 |
3.000,00 |
|
|
2. Reserves for own shares: |
0,00 |
0,00 |
0,00 |
0,00 |
0,00 |
|
|
3. Reserves for shares of the controlling
company: |
0,00 |
0,00 |
0,00 |
0,00 |
0,00 |
|
|
4. Statutory reserves: |
0,00 |
0,00 |
0,00 |
0,00 |
0,00 |
|
|
5. Miscellaneous reserves: |
480.682.833,00 |
373.703.609,00 |
302.641.500,00 |
373.974.166,00 |
340.721.433,00 |
|
|
Differences due to capital adjustement to
euros: |
0,00 |
0,00 |
0,00 |
0,00 |
0,00 |
|
|
V. Profit or loss brought forward: |
0,00 |
0,00 |
0,00 |
0,00 |
0,00 |
|
|
1. Retained earnings: |
0,00 |
0,00 |
0,00 |
0,00 |
0,00 |
|
|
2. Prior year losses: |
0,00 |
0,00 |
0,00 |
0,00 |
0,00 |
|
|
3. Partners' contributions so as
to compensate losses: |
0,00 |
0,00 |
0,00 |
0,00 |
0,00 |
|
|
VI. Profit or loss for the financial year: |
66.240.000,00 |
106.264.000,00 |
70.527.000,00 |
24.081.000,00 |
128.289.000,00 |
|
|
VII. Interim dividend paid: |
0,00 |
0,00 |
0,00 |
0,00 |
0,00 |
|
|
VIII. Own shares for capital reduction: |
0,00 |
0,00 |
0,00 |
0,00 |
0,00 |
|
|
B)
Deferred income: |
0,00 |
0,00 |
0,00 |
0,00 |
0,00 |
|
|
1. Capital grants: |
0,00 |
0,00 |
0,00 |
0,00 |
0,00 |
|
|
2. Unrealised exchange gains: |
0,00 |
0,00 |
0,00 |
0,00 |
0,00 |
|
|
3. Other deferred income: |
0,00 |
0,00 |
0,00 |
0,00 |
0,00 |
|
|
4. Public revenues to distribute in
several financial years: |
0,00 |
0,00 |
0,00 |
0,00 |
0,00 |
|
|
C)
PROVISIONS FOR LIABILITIES AND CHARGES: |
6.341.000,00 |
7.261.000,00 |
2.440.000,00 |
2.298.000,00 |
2.142.000,00 |
|
|
1. Provisions for pension fund and other
similar obligations: |
0,00 |
0,00 |
0,00 |
0,00 |
0,00 |
|
|
2. Provisions for taxes: |
0,00 |
0,00 |
0,00 |
0,00 |
0,00 |
|
|
3. Other provisions: |
6.341.000,00 |
7.261.000,00 |
2.440.000,00 |
2.298.000,00 |
2.142.000,00 |
|
|
4. Reversion fund: |
0,00 |
0,00 |
0,00 |
0,00 |
0,00 |
|
|
D) LONG
TERM LIABILITIES: |
1.531.873.000,00 |
1.482.450.000,00 |
1.609.706.000,00 |
1.522.066.000,00 |
889.281.000,00 |
|
|
I. Issued debentures and other marketable securities: |
0,00 |
0,00 |
0,00 |
0,00 |
0,00 |
|
|
1. Non-convertible debentures: |
0,00 |
0,00 |
0,00 |
0,00 |
0,00 |
|
|
2. Convertible debentures: |
0,00 |
0,00 |
0,00 |
0,00 |
0,00 |
|
|
3. Other debt securities: |
0,00 |
0,00 |
0,00 |
0,00 |
0,00 |
|
|
II. Amounts owed to credit institutions: |
765.404.000,00 |
689.458.000,00 |
745.630.000,00 |
701.478.000,00 |
640.818.000,00 |
|
|
1. Loans and other liabilities: |
741.293.000,00 |
672.796.000,00 |
731.430.000,00 |
678.681.000,00 |
609.181.000,00 |
|
|
2. Long-term liabilities from capital leases:
|
24.111.000,00 |
16.662.000,00 |
14.200.000,00 |
22.797.000,00 |
31.637.000,00 |
|
|
III. Debts with companies of the group and affiliated ones:
|
736.432.000,00 |
760.845.000,00 |
834.315.000,00 |
795.452.000,00 |
224.955.000,00 |
|
|
1. Amounts owed to group companies: |
736.432.000,00 |
760.845.000,00 |
834.315.000,00 |
795.452.000,00 |
224.955.000,00 |
|
|
2. Amounts owed to associated companies:
|
0,00 |
0,00 |
0,00 |
0,00 |
0,00 |
|
|
IV. Other creditors: |
30.037.000,00 |
32.147.000,00 |
29.761.000,00 |
25.136.000,00 |
23.508.000,00 |
|
|
1. Long-term bills of exchange payable:
|
0,00 |
0,00 |
0,00 |
0,00 |
0,00 |
|
|
2. Other creditors: |
0,00 |
0,00 |
0,00 |
0,00 |
0,00 |
|
|
3. Long term guarantees and deposits
received: |
8.289.000,00 |
8.124.000,00 |
7.576.000,00 |
3.747.000,00 |
7.885.000,00 |
|
|
4. Long term payables to public bodies:
|
21.748.000,00 |
24.023.000,00 |
22.185.000,00 |
21.389.000,00 |
15.623.000,00 |
|
|
V. Unpaid portion of equity investment: |
0,00 |
0,00 |
0,00 |
0,00 |
0,00 |
|
|
1. Group companies: |
0,00 |
0,00 |
0,00 |
0,00 |
0,00 |
|
|
2. Associated companies: |
0,00 |
0,00 |
0,00 |
0,00 |
0,00 |
|
|
3. Third parties: |
0,00 |
0,00 |
0,00 |
0,00 |
0,00 |
|
|
VI. Long term trade creditors: |
0,00 |
0,00 |
0,00 |
0,00 |
0,00 |
|
|
E) SHORT
TERM CREDITORS: |
780.130.000,00 |
624.669.000,00 |
584.740.000,00 |
676.763.000,00 |
761.502.000,00 |
|
|
I. Issued debentures and other marketable securities: |
0,00 |
0,00 |
0,00 |
0,00 |
0,00 |
|
|
1. Non-convertible debentures: |
0,00 |
0,00 |
0,00 |
0,00 |
0,00 |
|
|
2. Convertible debentures: |
0,00 |
0,00 |
0,00 |
0,00 |
0,00 |
|
|
3. Other debt securities: |
0,00 |
0,00 |
0,00 |
0,00 |
0,00 |
|
|
4. Accrued interest on debentures and
other debt securities: |
0,00 |
0,00 |
0,00 |
0,00 |
0,00 |
|
|
II. Amounts owed to credit institutions: |
350.813.000,00 |
270.569.000,00 |
294.039.000,00 |
408.971.000,00 |
543.164.000,00 |
|
|
1. Loans and other liabilities: |
342.337.000,00 |
264.545.000,00 |
284.927.000,00 |
394.699.000,00 |
526.989.000,00 |
|
|
2. Accrued interest on liabilities with
credit institutions: |
0,00 |
0,00 |
0,00 |
0,00 |
0,00 |
|
|
3. Short-term liabilities from capital
leases: |
8.476.000,00 |
6.024.000,00 |
9.112.000,00 |
14.272.000,00 |
16.175.000,00 |
|
|
III. Short-term amounts owed to group and associated companies:
|
111.114.000,00 |
74.513.000,00 |
65.416.000,00 |
58.644.000,00 |
26.600.000,00 |
|
|
1. Amounts owed to group companies: |
111.114.000,00 |
74.513.000,00 |
65.416.000,00 |
58.644.000,00 |
26.600.000,00 |
|
|
2. Amounts owed to associated companies:
|
0,00 |
0,00 |
0,00 |
0,00 |
0,00 |
|
|
IV. Trade creditors: |
224.629.000,00 |
210.482.000,00 |
176.153.000,00 |
182.247.000,00 |
162.453.000,00 |
|
|
1. Advanced payments from customers:
|
0,00 |
0,00 |
0,00 |
0,00 |
0,00 |
|
|
2. Amounts owed for purchases of goods or
services: |
224.629.000,00 |
210.482.000,00 |
176.153.000,00 |
182.247.000,00 |
162.453.000,00 |
|
|
3. Debts represented by notes payable:
|
0,00 |
0,00 |
0,00 |
0,00 |
0,00 |
|
|
V. Other creditors: |
41.753.000,00 |
32.812.000,00 |
27.517.000,00 |
19.212.000,00 |
19.858.000,00 |
|
|
1. Public bodies: |
35.346.000,00 |
24.594.000,00 |
21.666.000,00 |
14.106.000,00 |
14.802.000,00 |
|
|
2. Bills of exchange payable: |
0,00 |
0,00 |
0,00 |
0,00 |
0,00 |
|
|
3. Miscellaneous debts: |
0,00 |
0,00 |
2.000,00 |
0,00 |
0,00 |
|
|
4. Wages and salaries payable: |
6.407.000,00 |
8.218.000,00 |
5.849.000,00 |
5.106.000,00 |
5.056.000,00 |
|
|
5. Guarantees and deposits received at
short term: |
0,00 |
0,00 |
0,00 |
0,00 |
0,00 |
|
|
VI. Provisions: |
0,00 |
0,00 |
0,00 |
0,00 |
0,00 |
|
|
VII. Prepayments and accrued income: |
51.821.000,00 |
36.293.000,00 |
21.615.000,00 |
7.689.000,00 |
9.427.000,00 |
|
|
F)
SHORT-TERM PROVISIONS FOR LIABILITIES AND CHARGES: |
0,00 |
0,00 |
0,00 |
0,00 |
0,00 |
|
|
GENERAL
TOTAL (A + B + C + D + E + F): |
2.897.014.000,00 |
2.625.973.000,00 |
2.601.599.000,00 |
2.630.807.000,00 |
2.153.524.000,00 |
|
MERCANTILE REGISTRY.
|
|
EQUIVALENCIA |
EQUIVALENCIA |
EQUIVALENCIA |
EQUIVALENCIA |
EQUIVALENCIA |
|
|
DEBIT |
2014 |
2013 |
2012 |
2011 |
2010 |
|
|
A)
CHARGES (A.1 to A.15): |
1.637.596.000,00 |
1.325.320.000,00 |
1.190.985.000,00 |
1.134.784.000,00 |
922.691.000,00 |
|
|
A.1. Stock reduction of both manufactured
goods and the ones in process: |
0,00 |
0,00 |
8.000.000,00 |
2.721.000,00 |
0,00 |
|
|
A.2. Supplies: |
870.271.000,00 |
683.862.000,00 |
640.909.000,00 |
602.240.000,00 |
520.216.000,00 |
|
|
a) Stock consumption:
|
561.857.000,00 |
449.796.000,00 |
458.545.000,00 |
455.458.000,00 |
360.191.000,00 |
|
|
b) Consumption of raw
materials and miscellaneous consumable ones: |
217.359.000,00 |
149.065.000,00 |
121.951.000,00 |
90.675.000,00 |
107.576.000,00 |
|
|
c) Miscellaneous
external expenditure: |
91.055.000,00 |
85.001.000,00 |
60.413.000,00 |
56.107.000,00 |
52.449.000,00 |
|
|
A.3. Staff costs: |
159.243.000,00 |
151.838.000,00 |
136.861.000,00 |
131.970.000,00 |
120.262.000,00 |
|
|
a) Wages, salaries et
al.: |
123.223.000,00 |
111.879.000,00 |
106.134.000,00 |
102.677.000,00 |
92.850.000,00 |
|
|
b) Social security
costs: |
36.020.000,00 |
39.959.000,00 |
30.727.000,00 |
29.293.000,00 |
27.412.000,00 |
|
|
A.4. Depreciation expense: |
34.443.000,00 |
31.639.000,00 |
31.119.000,00 |
29.898.000,00 |
29.809.000,00 |
|
|
A.5. Variation of trade provisions and
losses of unrecovered receivables: |
0,00 |
0,00 |
0,00 |
0,00 |
0,00 |
|
|
a) Stock provision
variation: |
0,00 |
0,00 |
0,00 |
0,00 |
0,00 |
|
|
b) Variation in
provision and bad debt losses: |
0,00 |
0,00 |
0,00 |
0,00 |
0,00 |
|
|
c) Variation of other
trade provisions: |
0,00 |
0,00 |
0,00 |
0,00 |
0,00 |
|
|
A.6. Other operating charges: |
466.938.000,00 |
369.213.000,00 |
333.461.000,00 |
288.312.000,00 |
200.272.000,00 |
|
|
a) External services:
|
464.149.000,00 |
366.368.000,00 |
330.496.000,00 |
285.817.000,00 |
190.050.000,00 |
|
|
b) Taxes: |
2.772.000,00 |
2.826.000,00 |
1.915.000,00 |
1.934.000,00 |
1.681.000,00 |
|
|
c) Other operating
expenses: |
17.000,00 |
19.000,00 |
1.050.000,00 |
561.000,00 |
8.541.000,00 |
|
|
d) Allocation to
revision fund: |
0,00 |
0,00 |
0,00 |
0,00 |
0,00 |
|
|
A.I. OPERATING BENEFITS (B.1+B.2+B.3+B.4-A.1-A.2-A.3-A.4-A.5-A.6):
|
137.743.000,00 |
157.767.000,00 |
95.245.000,00 |
82.558.000,00 |
128.358.000,00 |
|
|
A.7. Financial and similar charges: |
37.162.316,00 |
34.826.604,00 |
47.095.000,00 |
40.819.000,00 |
37.723.000,00 |
|
|
a) Due to liabilities
with companies of the group: |
12.808.000,00 |
13.381.000,00 |
12.813.000,00 |
8.548.000,00 |
5.414.000,00 |
|
|
b) Due to liabilities
with associated companies: |
0,00 |
0,00 |
0,00 |
0,00 |
0,00 |
|
|
c) Due to other
debts.: |
24.353.000,00 |
21.443.000,00 |
34.281.000,00 |
32.271.000,00 |
32.309.000,00 |
|
|
d) Losses from
financial investments: |
1.316,00 |
2.604,00 |
1.000,00 |
0,00 |
0,00 |
|
|
A.8. Changes in financial investment
provisions: |
909.932,00 |
1.800.084,00 |
454.670,00 |
2.852.001,00 |
708.000,00 |
|
|
A.9. Exchange losses: |
42.788.000,00 |
11.022.000,00 |
0,00 |
1.461.000,00 |
0,00 |
|
|
A.II. NET FINANCIAL INCOME (B.5+B.6+B.7+B.8-A.7-A.8-A.9):
|
0,00 |
0,00 |
0,00 |
0,00 |
13.632.000,00 |
|
|
A.III. PROFIT FROM ORDINARY ACTIVITIES (A.I+A.II-B.I-B.II):
|
92.080.752,00 |
148.080.312,00 |
63.612.330,00 |
58.591.999,00 |
141.990.000,00 |
|
|
A.10. Changes in provisions for
intangible, tangible and securities portfolio: |
8.887.752,00 |
17.582.312,00 |
6.751.330,00 |
42.348.999,00 |
10.513.000,00 |
|
|
A.11. Losses from tangible and intangible
fixed assets and securities portfolio: |
3.254.000,00 |
2.143.000,00 |
460.000,00 |
876.000,00 |
865.000,00 |
|
|
A.12. Losses from transactions with own shares
and debentures: |
0,00 |
0,00 |
0,00 |
0,00 |
0,00 |
|
|
A.13. Extraordinary expenses: |
0,00 |
0,00 |
0,00 |
0,00 |
0,00 |
|
|
A.14. Expenses and losses of former
financial years: |
0,00 |
0,00 |
0,00 |
0,00 |
0,00 |
|
|
A.IV. EXTRAORDINARY PROFIT
(B.9+B.10+B.11+B.12+B.13-A.10-A.11-A.12-A.13-A.14): |
0,00 |
0,00 |
0,00 |
0,00 |
0,00 |
|
|
A.V. PROFIT BEFORE TAXES (A.III+A.IV-B.III-B.IV): |
79.939.000,00 |
128.355.000,00 |
56.401.000,00 |
15.367.000,00 |
130.612.000,00 |
|
|
A.15. Corporation tax: |
13.699.000,00 |
21.394.000,00 |
-14.126.000,00 |
-8.714.000,00 |
2.323.000,00 |
|
|
A.16. Miscellaneous taxes: |
0,00 |
0,00 |
0,00 |
0,00 |
0,00 |
|
|
A.VI. FINANCIAL YEAR RESULTS (PROFIT) (A.V-A.15-A.16): |
66.240.000,00 |
106.961.000,00 |
70.527.000,00 |
24.081.000,00 |
128.289.000,00 |
|
MERCANTILE REGISTRY.
|
|
EQUIVALENCIA |
EQUIVALENCIA |
EQUIVALENCIA |
EQUIVALENCIA |
EQUIVALENCIA |
|
|
CREDIT |
2014 |
2013 |
2012 |
2011 |
2010 |
|
|
B)
INCOME ( B.1 to B.13): |
1.703.836.000,00 |
1.432.281.000,00 |
1.261.512.000,00 |
1.158.865.000,00 |
1.050.980.000,00 |
|
|
B.1. Net total sales: |
1.310.010.000,00 |
1.230.913.000,00 |
1.118.748.000,00 |
1.006.299.000,00 |
895.269.000,00 |
|
|
a) Sales: |
1.299.424.579,00 |
1.219.792.483,00 |
1.107.094.346,00 |
995.498.210,00 |
886.021.077,00 |
|
|
b) Rendering of
services: |
10.587.000,00 |
11.122.000,00 |
11.655.000,00 |
10.802.000,00 |
9.249.000,00 |
|
|
Returns and Rappel on
sales: |
-1.579,00 |
-1.483,00 |
-1.346,00 |
-1.210,00 |
-1.077,00 |
|
|
B.2. Stock increase of manufactured goods
and products in process: |
105.927.000,00 |
24.039.000,00 |
0,00 |
0,00 |
8.758.000,00 |
|
|
B.3. Works performed by the company for
fixed assets: |
0,00 |
0,00 |
0,00 |
0,00 |
0,00 |
|
|
B.4. Miscellaneous operating income:
|
252.701.000,00 |
139.367.000,00 |
126.847.000,00 |
131.400.000,00 |
94.890.000,00 |
|
|
a) Auxiliary income
and other from current management: |
252.701.000,00 |
139.367.000,00 |
126.847.000,00 |
131.400.000,00 |
94.669.000,00 |
|
|
b) Grants: |
0,00 |
0,00 |
0,00 |
0,00 |
221.000,00 |
|
|
c) Liabilities and
charges provisions surplus: |
0,00 |
0,00 |
0,00 |
0,00 |
0,00 |
|
|
B.I. PÉRDIDAS DE EXPLOTACIÓN
(A.1+A.2+A.3+A.4+A.5-A.6-B.1-B.2-B.3-B.4): |
0,00 |
0,00 |
0,00 |
0,00 |
0,00 |
|
|
B.5. Income from equity investment: |
2.264.000,00 |
484.000,00 |
110.000,00 |
162.000,00 |
11.121.000,00 |
|
|
a) In companies of
the group: |
2.264.000,00 |
484.000,00 |
110.000,00 |
162.000,00 |
11.121.000,00 |
|
|
b) In associated
companies: |
0,00 |
0,00 |
0,00 |
0,00 |
0,00 |
|
|
c) Third parties:
|
0,00 |
0,00 |
0,00 |
0,00 |
0,00 |
|
|
B.6. Income from other marketable
securities and long-term receivables: |
111.374,00 |
47.566,00 |
69.029,00 |
256.973,00 |
210.277,00 |
|
|
a) From companies of
the group: |
111.374,00 |
47.566,00 |
69.029,00 |
256.973,00 |
210.277,00 |
|
|
b) From associated
companies: |
0,00 |
0,00 |
0,00 |
0,00 |
0,00 |
|
|
c) From companies out
of the group: |
0,00 |
0,00 |
0,00 |
0,00 |
0,00 |
|
|
B.7. Miscellaneous interests or similar
income: |
32.822.626,00 |
37.430.434,00 |
13.911.971,00 |
20.747.027,00 |
16.064.723,00 |
|
|
a) From companies of
the group: |
272.626,00 |
116.434,00 |
168.971,00 |
629.027,00 |
514.723,00 |
|
|
b) From associated
companies: |
0,00 |
0,00 |
0,00 |
0,00 |
0,00 |
|
|
c) Miscellaneous
interests: |
11.135.000,00 |
13.603.000,00 |
11.194.000,00 |
18.987.000,00 |
5.435.000,00 |
|
|
d) Profit on
financial investment: |
21.415.000,00 |
23.711.000,00 |
2.549.000,00 |
1.131.000,00 |
10.115.000,00 |
|
|
B.8. Exchange positive differences: |
0,00 |
0,00 |
1.826.000,00 |
0,00 |
24.667.000,00 |
|
|
B.II. NEGATIVE FINANCIAL RESULTS (A.7+A.8+A.9-B.5-B.6-B.7-B.8):
|
45.662.248,00 |
9.686.688,00 |
31.632.670,00 |
23.966.001,00 |
0,00 |
|
|
B.III. LOSSES ON ORDINARY ACTIVITIES ( B.I + B.II - A.I - A.II
): |
0,00 |
0,00 |
0,00 |
0,00 |
0,00 |
|
|
B.9.Profit on disposal of both tangible
and intangible fixed assets and securities portfolio: |
0,00 |
0,00 |
0,00 |
0,00 |
0,00 |
|
|
B.10. Profit on transactions with own
shares and debentures: |
0,00 |
0,00 |
0,00 |
0,00 |
0,00 |
|
|
B.11. Capital grants transferred to profit
and loss: |
0,00 |
0,00 |
0,00 |
0,00 |
0,00 |
|
|
B.12. Extraordinary income: |
0,00 |
0,00 |
0,00 |
0,00 |
0,00 |
|
|
B.13. Income and profit of former
financial years: |
0,00 |
0,00 |
0,00 |
0,00 |
0,00 |
|
|
B.IV. NEGATIVE EXTRAORDINARY RESULTS (A.10+A.11+A.12+A.13+A.14-B.9-B.10-B.11-B.12-B.13):
|
12.141.752,00 |
19.725.312,00 |
7.211.330,00 |
43.224.999,00 |
11.378.000,00 |
|
|
B.V. LOSSES BEFORE TAXES (B.III+B.IV-A.III-A.IV): |
0,00 |
0,00 |
0,00 |
0,00 |
0,00 |
|
|
B.VI. RESULT OF THE PERIOD (LOSSES) (B.V+A.15+A.16): |
0,00 |
0,00 |
0,00 |
0,00 |
0,00 |
|
MERCANTILE REGISTRY.
CASHFLOW
STATEMENT
Model: Normal
>
Source of information: Data contained in this section is taken from the information
declared in the Annual Accounts submitted to the Trade Register.
|
|
2014 |
2013 |
2012 |
2011 |
2010 |
|
|
1.
Fiscal year result before taxes.: 61100 |
79.939.000,00 |
127.658.000,00 |
56.401.000,00 |
15.367.000,00 |
130.612.000,00 |
|
|
2.
Results adjustments.: 61200 |
92.247.000,00 |
61.051.000,00 |
69.963.000,00 |
97.245.000,00 |
27.754.000,00 |
|
|
a) Fixed Assets Amortization (+).: 61201 |
34.443.000,00 |
31.639.000,00 |
31.119.000,00 |
29.898.000,00 |
29.809.000,00 |
|
|
b) Obsolescence Allowances (+/-). : 61202 |
9.799.000,00 |
18.769.000,00 |
7.206.000,00 |
45.201.000,00 |
10.513.000,00 |
|
|
c) Variation in Provision (+/-). : 61203 |
0,00 |
0,00 |
0,00 |
156.000,00 |
199.000,00 |
|
|
e) Results on disposal of fixed assets (+/-). : 61205 |
3.254.000,00 |
2.143.000,00 |
460.000,00 |
876.000,00 |
865.000,00 |
|
|
f) Results on disposal of financial instruments (+/-).:
61206 |
-21.415.000,00 |
-23.711.000,00 |
1.000,00 |
0,00 |
-10.115.000,00 |
|
|
g) Financial income (-).: 61207 |
-13.783.000,00 |
-14.251.000,00 |
-11.542.000,00 |
-20.035.000,00 |
-17.281.000,00 |
|
|
h) Financial Expenses (+). : 61208 |
37.161.000,00 |
34.824.000,00 |
47.094.000,00 |
40.819.000,00 |
37.723.000,00 |
|
|
i) Exchange differences (+/-). : 61209 |
42.788.000,00 |
11.022.000,00 |
-1.826.000,00 |
1.461.000,00 |
-24.667.000,00 |
|
|
j) Reasonable Value Variation in Financial Instruments (+/-).:
61210 |
0,00 |
616.000,00 |
-2.549.000,00 |
-1.131.000,00 |
708.000,00 |
|
|
3.
Changes in current capital equity.: 61300 |
28.561.000,00 |
-1.600.000,00 |
34.575.000,00 |
-29.593.000,00 |
-6.289.000,00 |
|
|
a) Stock (+/-).: 61301 |
-107.053.000,00 |
-24.101.000,00 |
5.150.000,00 |
-46.057.000,00 |
-66.220.000,00 |
|
|
d) Debtors and other accounts receivable (+/-). : 61302 |
68.809.000,00 |
-33.788.000,00 |
9.552.000,00 |
-26.313.000,00 |
-50.861.000,00 |
|
|
c) Other current assets (+/-). : 61303 |
-6.307.000,00 |
-9.082.000,00 |
-7.124.000,00 |
-382.000,00 |
11.349.000,00 |
|
|
d) Creditors and other accounts payable (+/-). : 61304 |
58.504.000,00 |
45.872.000,00 |
16.646.000,00 |
51.192.000,00 |
98.261.000,00 |
|
|
e) Other current liabilities (+/-).: 61305 |
15.528.000,00 |
14.678.000,00 |
13.926.000,00 |
-1.738.000,00 |
1.182.000,00 |
|
|
f) Other non-current assets and liabilities (+/-).: 61306 |
-920.000,00 |
4.821.000,00 |
-3.575.000,00 |
-6.295.000,00 |
0,00 |
|
|
4. Other
cash flows for operating activities.: 61400 |
-44.772.000,00 |
-26.561.000,00 |
-41.540.000,00 |
-21.307.000,00 |
-33.959.000,00 |
|
|
a) Interest payments (-). : 61401 |
-37.161.000,00 |
-34.824.000,00 |
-47.094.000,00 |
-40.819.000,00 |
-37.723.000,00 |
|
|
b) Dividend payment collection (+). : 61402 |
384.000,00 |
0,00 |
0,00 |
0,00 |
0,00 |
|
|
c) Interest collection (+). : 61403 |
13.399.000,00 |
14.251.000,00 |
11.542.000,00 |
20.035.000,00 |
17.281.000,00 |
|
|
d) Income tax payment collection (payments) (+/-).: 61404 |
-21.394.000,00 |
-5.988.000,00 |
-5.988.000,00 |
-523.000,00 |
-13.517.000,00 |
|
|
5.
Operating activity cash flows (1 + 2 + 3 + 4) : 61500 |
155.975.000,00 |
160.548.000,00 |
119.399.000,00 |
61.712.000,00 |
118.118.000,00 |
|
|
6.
Payments for investment (-).: 62100 |
-251.742.000,00 |
-132.432.000,00 |
-279.258.000,00 |
-47.452.000,00 |
-68.790.000,00 |
|
|
a) Companies of the group and affiliates. : 62101 |
-109.924.000,00 |
-29.636.000,00 |
-175.337.000,00 |
-17.894.000,00 |
-45.561.000,00 |
|
|
b) Intangible fixed assets. : 62102 |
-6.329.000,00 |
-1.880.000,00 |
-3.255.000,00 |
-3.288.000,00 |
-1.724.000,00 |
|
|
c) Fixed assets. : 62103 |
-105.374.000,00 |
-35.085.000,00 |
-26.414.000,00 |
-24.663.000,00 |
-21.505.000,00 |
|
|
e) Other financial assets. : 62105 |
-4.136.000,00 |
-1.497.000,00 |
-648.000,00 |
-1.607.000,00 |
0,00 |
|
|
h) Other assets. : 62108 |
-25.979.000,00 |
-64.334.000,00 |
-73.604.000,00 |
0,00 |
0,00 |
|
|
7.
Divestment payment collection (+). : 62200 |
117.093.000,00 |
136.016.000,00 |
23.897.000,00 |
600.000,00 |
12.072.000,00 |
|
|
a) Companies of the group and affiliates. : 62201 |
87.870.000,00 |
135.383.000,00 |
16.505.000,00 |
0,00 |
0,00 |
|
|
b) Intangible fixed assets. : 62202 |
0,00 |
0,00 |
1.000,00 |
0,00 |
12.000,00 |
|
|
c) Fixed assets. : 62203 |
29.223.000,00 |
633.000,00 |
4.629.000,00 |
600.000,00 |
10.177.000,00 |
|
|
e) Other financial assets. : 62205 |
0,00 |
0,00 |
0,00 |
0,00 |
1.883.000,00 |
|
|
h) Other assets. : 62208 |
0,00 |
0,00 |
2.762.000,00 |
0,00 |
0,00 |
|
|
8.
Investment activity cash flows (6 + 7) minus Amortization: 62300 |
-134.649.000,00 |
3.584.000,00 |
-255.361.000,00 |
-46.852.000,00 |
-56.718.000,00 |
|
|
9.
Payment collection and payments for equity instruments. : 63100 |
0,00 |
0,00 |
0,00 |
0,00 |
0,00 |
|
|
10.
Payment collection and payments for financial liabilities instruments.:
63200 |
136.895.000,00 |
-172.395.000,00 |
-29.993.000,00 |
494.058.000,00 |
21.786.000,00 |
|
|
a) Issuance : 63201 |
163.583.000,00 |
3.010.000,00 |
98.134.000,00 |
570.497.000,00 |
120.250.000,00 |
|
|
2. Debts incurred with credit institutions (+). : 63203 |
156.355.000,00 |
2.462.000,00 |
52.749.000,00 |
0,00 |
113.839.000,00 |
|
|
3. Debts incurred with companies of the group and affiliates
(+).: 63204 |
0,00 |
0,00 |
38.863.000,00 |
570.497.000,00 |
0,00 |
|
|
4. Special characteristic debts (+). : 63205 |
0,00 |
0,00 |
6.522.000,00 |
0,00 |
0,00 |
|
|
5. Other debts (+). : 63206 |
7.228.000,00 |
548.000,00 |
0,00 |
0,00 |
6.411.000,00 |
|
|
b) Repayment and amortization of : 63207 |
-26.688.000,00 |
-175.405.000,00 |
-128.127.000,00 |
-76.439.000,00 |
-98.464.000,00 |
|
|
2. Debts incurred with credit institutions (-).: 63209 |
0,00 |
-82.104.000,00 |
-123.529.000,00 |
-73.533.000,00 |
-53.412.000,00 |
|
|
3. Debts incurred with companies of the group and affiliates
(-). : 63210 |
-24.413.000,00 |
-76.989.000,00 |
0,00 |
0,00 |
-28.171.000,00 |
|
|
5. Other debts (-). : 63212 |
-2.275.000,00 |
-16.312.000,00 |
-4.598.000,00 |
-2.906.000,00 |
-16.881.000,00 |
|
|
11. Payments
from dividends and remunerations from other assets instruments. : 63300 |
0,00 |
0,00 |
-93.427.000,00 |
-93.897.000,00 |
-92.621.000,00 |
|
|
a) Dividends (-).: 63301 |
0,00 |
0,00 |
-93.427.000,00 |
-93.897.000,00 |
-92.621.000,00 |
|
|
12. Cash
flows for financing activities (9+10+11).: 63400 |
136.895.000,00 |
-172.395.000,00 |
-123.420.000,00 |
400.161.000,00 |
-70.835.000,00 |
|
|
D)
EFFECT OF EXCHANGE RATE CHANGES: 64000 |
0,00 |
0,00 |
0,00 |
0,00 |
0,00 |
|
|
E) NET
INCREASE/DECREASE OF CASH OR EQUIVALENT ASSETS (+/-5+/-8+/12+/-D) :
65000 |
158.221.000,00 |
-8.263.000,00 |
-259.382.000,00 |
415.021.000,00 |
-9.435.000,00 |
|
|
Cash or equivalent assets as of beginning of the fiscal year.: 65100 |
280.382.000,00 |
288.645.000,00 |
548.027.000,00 |
133.006.000,00 |
142.441.000,00 |
|
|
Cash or equivalent assets as of end of the fiscal year.:
65200 |
438.603.000,00 |
280.382.000,00 |
288.645.000,00 |
548.027.000,00 |
133.006.000,00 |
|
FINANCIAL
DIAGNOSIS
>
Economic-Financial Comparative Analysis
Data
used in the following ratios and indicators is taken from the Annual Accounts
submitted by the company to the TRADE REGISTER.
>
Comparison within the Sector
|
Cash
Flow |
2014 |
2013 |
Variación
2014 - 2013 |
|
|||
|
|
Empresa |
Sector |
Empresa |
Sector |
Empresa |
Sector |
|
|
Cash
Flow over Sales: |
0,12 % |
0,04 % |
-0,01 % |
0,01 % |
1.899,17
% |
225,33 % |
|
|
EBITDA
over Sales: |
13,14 % |
12,01 % |
15,33 % |
11,53 % |
-14,27 % |
4,21 % |
|
|
Cash
Flow Yield: |
0,05 % |
0,02 % |
0,00 % |
0,01 % |
|
267,16 % |
|
|
Profitability |
2014 |
2013 |
Variación
2014 - 2013 |
|
|||
|
|
Empresa |
Sector |
Empresa |
Sector |
Empresa |
Sector |
|
|
Operating
economic profitability: |
8,48 % |
8,75 % |
11,59 % |
7,04 % |
-26,87 % |
24,32 % |
|
|
Total
economic profitability: |
4,04 % |
5,16 % |
6,18 % |
3,71 % |
-34,66 % |
39,14 % |
|
|
Financial
profitability: |
11,37 % |
7,96 % |
20,62 % |
4,06 % |
-44,84 % |
95,93 % |
|
|
Margin:
|
8,61 % |
7,51 % |
11,31 % |
6,88 % |
-23,88 % |
9,14 % |
|
|
Mark-up:
|
5,12 % |
7,03 % |
9,32 % |
4,52 % |
-45,09 % |
55,78 % |
|
|
Solvency |
2014 |
2013 |
Variación
2014 - 2013 |
|
|||
|
|
Empresa |
Sector |
Empresa |
Sector |
Empresa |
Sector |
|
|
Liquidity:
|
0,56 |
0,14 |
0,45 |
0,13 |
25,26 |
7,76 |
|
|
Acid
Test: |
1,24 |
0,89 |
1,37 |
0,87 |
-9,30 |
2,76 |
|
|
Working
Capital / Investment: |
0,24 |
0,03 |
0,24 |
0,05 |
1,07 |
-36,34 |
|
|
Solvency:
|
2,16 |
1,22 |
2,35 |
1,18 |
-7,93 |
3,73 |
|
|
Indebtedness |
2014 |
2013 |
Variación
2014 - 2013 |
|
|||
|
|
Empresa |
Sector |
Empresa |
Sector |
Empresa |
Sector |
|
|
Indebtedness
level: |
3,93 |
1,31 |
4,03 |
1,38 |
-2,60 |
-5,35 |
|
|
Borrowing
Composition: |
1,96 |
1,12 |
2,37 |
1,00 |
-17,26 |
11,78 |
|
|
Repayment
Ability: |
14,61 |
25,73 |
-255,01 |
96,63 |
105,73 |
-73,38 |
|
|
Warranty:
|
1,25 |
1,77 |
1,25 |
1,73 |
0,53 |
2,29 |
|
|
Generated
resources / Total creditors: |
0,04 |
0,09 |
0,06 |
0,08 |
-38,95 |
8,28 |
|
|
Efficiency |
2014 |
2013 |
Variación
2014 - 2013 |
|
|||
|
|
Empresa |
Sector |
Empresa |
Sector |
Empresa |
Sector |
|
|
Productivity:
|
2,08 |
2,01 |
2,24 |
1,86 |
-7,20 |
7,74 |
|
|
Turnover
of Collection Rights : |
6,31 |
5,42 |
4,30 |
4,99 |
46,64 |
8,63 |
|
|
Turnover
of Payment Entitlements: |
3,82 |
3,83 |
3,39 |
3,62 |
12,72 |
5,70 |
|
|
Stock
rotation: |
3,00 |
8,43 |
3,30 |
7,32 |
-9,03 |
15,21 |
|
|
Assets
turnover: |
0,99 |
1,17 |
1,03 |
1,02 |
-3,93 |
13,91 |
|
|
Borrowing
Cost: |
1,61 |
2,89 |
1,65 |
2,88 |
-2,75 |
0,46 |
|
> Trend
of indicators under the General Accounting Plan of 2007 (2014, 2013, 2012,
2011, 2010)
|
Cash
Flow |
2014 |
2013 |
2012 |
2011 |
2010 |
|
|
Cash Flow
over Sales: |
0,12 % |
-0,01 % |
-0,23 % |
0,41 % |
-0,01 % |
|
|
EBITDA
over Sales: |
13,14 % |
15,33 % |
11,30 % |
11,18 % |
17,67 % |
|
|
Cash
Flow Yield: |
0,05 % |
0,00 % |
-0,10 % |
0,16 % |
0,00 % |
|
|
Profitability |
2014 |
2013 |
2012 |
2011 |
2010 |
|
|
Operating
economic profitability: |
8,48 % |
11,59 % |
7,57 % |
5,42 % |
11,47 % |
|
|
Total
economic profitability: |
4,04 % |
6,18 % |
3,98 % |
2,13 % |
7,81 % |
|
|
Financial
profitability: |
11,37 % |
20,62 % |
17,40 % |
5,62 % |
25,76 % |
|
|
Margin:
|
8,61 % |
11,31 % |
7,61 % |
7,18 % |
11,81 % |
|
|
Mark-up:
|
5,12 % |
9,32 % |
4,53 % |
1,35 % |
13,19 % |
|
|
Solvency |
2014 |
2013 |
2012 |
2011 |
2010 |
|
|
Liquidity:
|
0,56 |
0,45 |
0,49 |
0,81 |
0,17 |
|
|
Acid
Test: |
1,24 |
1,37 |
1,34 |
1,44 |
0,74 |
|
|
Working
Capital / Investment: |
0,24 |
0,24 |
0,21 |
0,25 |
0,05 |
|
|
Solvency:
|
2,16 |
2,35 |
2,29 |
2,23 |
1,37 |
|
|
Indebtedness |
2014 |
2013 |
2012 |
2011 |
2010 |
|
|
Indebtedness
level: |
3,93 |
4,03 |
5,38 |
5,12 |
3,31 |
|
|
Borrowing
Composition: |
1,96 |
2,37 |
2,75 |
2,24 |
1,16 |
|
|
Repayment
Ability: |
14,61 |
-255,01 |
-8,46 |
5,31 |
-175,32 |
|
|
Warranty:
|
1,25 |
1,25 |
1,19 |
1,20 |
1,30 |
|
|
Generated
resources / Total creditors: |
0,04 |
0,06 |
0,05 |
0,05 |
0,09 |
|
|
Efficiency |
2014 |
2013 |
2012 |
2011 |
2010 |
|
|
Productivity:
|
2,08 |
2,24 |
1,92 |
1,85 |
2,32 |
|
|
Turnover
of Collection Rights : |
6,31 |
4,30 |
4,38 |
3,88 |
3,71 |
|
|
Turnover
of Payment Entitlements: |
3,82 |
3,39 |
3,59 |
3,41 |
3,49 |
|
|
Stock
rotation: |
3,00 |
3,30 |
3,35 |
3,03 |
2,85 |
|
|
Assets
turnover: |
0,99 |
1,03 |
0,99 |
0,75 |
0,97 |
|
|
Borrowing
Cost: |
1,61 |
1,65 |
2,15 |
1,85 |
2,28 |
|
COMPARATIVE
SECTORIAL BALANCE
Sector-based Comparison under the
rules of the New General Accounting Plan.
|
|
Variación
- |
|
|
|
Empresa |
Sector |
|
|
Variación
- |
|
|
|
Empresa |
Sector |
|
|
Variación
- |
|
|
|
Empresa |
Sector |
News
|
Diario de Burgos |
03/03/2015 |
|
Patrimonio permite la obra de Mango,
que arranca en junio |
|
|
Companies related |
|
Public
Tenders and Works Won
No Public Tenders assigned to the name
of the company.
Detail of Subsidies appearing in Balances
Memories
|
Entity |
ORGANISMO
NO ESPECIFICADO |
|
Subsidy
Concept |
Subvención
de capital. |
|
Status |
CONCEDIDA |
|
Amount
Granted |
3.000,00 |
|
Notes |
El
importe reflejado corresponde al traspasado a resultados del ejercicio,
quedando pendiente de imputación al cierre 1.000,00 euros. |
|
Entity |
ORGANISMO
NO ESPECIFICADO |
|
Subsidy Concept |
Subvención
de capital. |
|
Status |
CONCEDIDA |
|
Amount
Granted |
5.000,00 |
|
Notes |
El
importe reflejado es el imputado a resultados. |
Research
Summary
|
|
This company
was founded several years ago, reason why it has quite experience in its
sector. It enjoys a good concept among the sources consulted. Its turnover
increased by 6.43% in 2014 vs the previous year. It meets payment commitments
in an orderly manner. |
Sources
|
|
Registry
of Commerce's Official Gazette. Own and external data bases Company
References |
FOREIGN EXCHANGE RATES
|
Currency |
Unit
|
Indian Rupees |
|
US Dollar |
1 |
Rs.66.35 |
|
|
1 |
Rs.100.66 |
|
Euro |
1 |
Rs.70.47 |
INFORMATION DETAILS
|
Analysis Done by
: |
HEE |
|
|
|
|
Report Prepared
by : |
NIT |
RATING EXPLANATIONS
|
RATING |
STATUS |
PROPOSED CREDIT LINE |
|
|
|
>86 |
Aaa |
Possesses an extremely sound financial base with the strongest
capability for timely payment of interest and principal sums |
Unlimited |
|
|
71-85 |
Aa |
Possesses adequate working capital. No caution needed for credit
transaction. It has above average (strong) capability for payment of interest
and principal sums |
Large |
|
|
56-70 |
A |
Financial & operational base are regarded healthy. General
unfavourable factors will not cause fatal effect. Satisfactory capability for
payment of interest and principal sums |
Fairly Large |
|
|
41-55 |
Ba |
Overall operation is considered normal. Capable to meet normal
commitments. |
Satisfactory |
|
|
26-40 |
B |
Capability to overcome financial difficulties seems comparatively
below average. |
Small |
|
|
11-25 |
Ca |
Adverse factors are apparent. Repayment of interest and principal sums
in default or expected to be in default upon maturity |
Limited with
full security |
|
|
<10 |
C |
Absolute credit risk exists. Caution needed to be exercised |
Credit not
recommended |
|
|
-- |
NB |
New Business |
-- |
|
This score serves as a reference to assess
SC’s credit risk and to set the amount of credit to be extended. It is
calculated from a composite of weighted scores obtained from each of the major sections
of this report. The assessed factors and their relative weights (as indicated
through %) are as follows:
Financial
condition (40%) Ownership
background (20%) Payment
record (10%)
Credit history
(10%) Market trend (10%) Operational size
(10%)
This report is issued at your request without any
risk and responsibility on the part of MIRA INFORM PRIVATE LIMITED (MIPL)
or its officials.