MIRA INFORM REPORT
|
Report No. : |
351303 |
|
Report Date : |
27.11.2015 |
IDENTIFICATION DETAILS
|
Name : |
BROVA B.V. |
|
|
|
|
Registered Office : |
Huygensweg 36 5482TG Schijndel |
|
|
|
|
Country : |
Netherlands |
|
|
|
|
Financials (as on) : |
31.12.2013 |
|
|
|
|
Date of Incorporation : |
02.01.2003 |
|
|
|
|
Com. Reg. No.: |
KvK-nummer: 17151716 |
|
|
|
|
Legal Form : |
Private company with regular structure |
|
|
|
|
Line of Business : |
Acquisition, alienation and exploitation of real estate , participating in enterprises through participation in the security holdings or otherwise , driving , managing and / or advising companies , providing loans and guarantees, performance of all financial and commercial area and further to to the above is related to expel or may be beneficial |
|
|
|
|
No. of Employee : |
2 (2015) |
RATING & COMMENTS
|
MIRA’s Rating : |
B |
|
RATING |
STATUS |
PROPOSED CREDIT LINE |
|
|
26-40 |
B |
Capability to overcome financial difficulties seems comparatively
below average. |
Small |
|
Status : |
Moderate |
|
|
|
|
Payment Behaviour : |
Slow but correct |
|
|
|
|
Litigation : |
Clear |
NOTES :
Any query related to this report can be made on
e-mail : infodept@mirainform.com
while quoting report number, name and date.
ECGC Country Risk Classification List – March 31, 2015
|
Country Name |
Previous Rating (31.12.2014) |
Current Rating (31.03.2015) |
|
Netherlands |
A1 |
A1 |
|
Risk Category |
ECGC
Classification |
|
Insignificant |
A1 |
|
Low |
A2 |
|
Moderate |
B1 |
|
High |
B2 |
|
Very High |
C1 |
|
Restricted |
C2 |
|
Off-credit |
D |
NETHERLANDS ECONOMIC OVERVIEW
The Netherlands, the sixth-largest economy in the European Union, plays an important role as a European transportation hub, with a persistently high trade surplus, stable industrial relations, and moderate unemployment. Industry focuses on food processing, chemicals, petroleum refining, and electrical machinery. A highly mechanized agricultural sector employs only 2% of the labor force but provides large surpluses for food-processing and underpins the country’s status as the world’s second largest agricultural exporter. The Netherlands is part of the Eurozone, and as such, its monetary policy is controlled by the European Central Bank. The Dutch financial sector is highly concentrated, with four commercial banks possessing over 90% of banking assets. The sector suffered as a result of the global financial crisis and required billions of dollars of government support, but the European Banking Authority completed stringent reviews in 2014 and deemed Dutch banks to be well-capitalized. To address the 2009 and 2010 economic downturns, the government sought to stimulate the domestic economy by accelerating infrastructure programs, offering corporate tax breaks for employers to retain workers, and expanding export credits. The stimulus programs and bank bailouts, however, resulted in a government budget deficit of 5.3% of GDP in 2010 that contrasted sharply with a surplus of 0.7% in 2008. The government of Prime Minister Mark RUTTE has since implemented significant austerity measures to improve public finances and has instituted broad structural reforms in key policy areas, including the labor market, the housing sector, the energy market, and the pension system. As a result, the government budget deficit at the end of 2014 dropped to 1.8% of GDP. Following a protracted recession during which unemployment doubled to 7.4% and household consumption contracted for nearly three consecutive years, the year 2014 saw fragile GDP growth of 0.8 percent and a rise in most economic indicators. Drivers of growth included increased exports and business investments, as well as newly invigorated household consumption.
|
Source
: CIA |
Summary
Company
name Brova B.V.
Operative
address Huygensweg 36
5482TG SCHIJNDEL
Netherlands
Legal
form Private company
with regular structure
Registration
number KvK-nummer: 17151716
VAT-number
811520559
|
Year |
2013 |
Mutation |
2012 |
Mutation |
2011 |
|
Fixed assets |
7.510.938 |
8,99 |
6.891.512 |
-17,74 |
8.378.134 |
|
Total receivables |
2.326.642 |
-4,29 |
2.431.027 |
-57,53 |
5.724.026 |
|
Total equity |
2.294.102 |
-27,88 |
3.181.166 |
460,35 |
-882.797 |
|
Short term liabilities |
11.831.684 |
15,21 |
10.269.491 |
-32,07 |
15.118.790 |
|
Net result |
-2.587.064 |
-224,79 |
2.073.203 |
166,97 |
-3.095.812 |
|
Working capital |
130.148 |
-88,13 |
1.096.308 |
121,72 |
494.447 |
|
Quick ratio |
0,30 |
|
0,34 |
|
0,43 |
Contact
information
Company
name Brova B.V.
Trade
names Brova B.V.
Operative
address Huygensweg 36
5482TG SCHIJNDEL
Netherlands
Correspondence
address Postbus 199
5480AD SCHIJNDEL
Netherlands
Telephone
number 073-5431431
Fax
number 0735431400
Email
address info@brova.nl
Registration
Registration
number KvK-nummer: 17151716
Branch
number 000018698379
VAT-number
811520559
Status
Active
First
registration company
register
2003-01-02
Memorandum
2003-01-02
Establishment
date 2003-01-02
Legal
form Private company
with regular structure
Last
proposed admendment 2013-08-09
Issued
placed capital EUR 1.748.000
Paid
up share capital EUR 1.748.000
Activities
SBI 6420: Financial holding
Exporter
No
Importer
No
Goal Acquisition,
alienation and exploitation of real estate , participating in enterprises
through participation in the security holdings or otherwise , driving ,
managing and / or advising companies , providing loans and guarantees,
performance of all financial and commercial area and further to to the above is
related to expel or may be beneficial
Relations
Shareholders
Brova
Holding B.V.
Huygensweg 36
5482TG SCHIJNDEL
Netherlands
Registration number: 58391452
Percentage: 100%
Companies
on same address (number) 13
Management
Active
management J.P.M.
Seemann Jean Pierre Marinus
Netherlands
Competence: Jointly authorized
Function: Manager
Starting date: 2012-06-04
Date of birth: 1970-01-27, Utrecht, NL
H.J.M. Duthler Hendrik Johan Martin
Netherlands
Competence: Fully authorized
Function: General Director
Starting date: 2013-08-09
Date of birth: 1971-11-12, Wisch, NL
Employees
|
Year |
2015 |
2014 |
2013 |
2012 |
2011 |
|
Total |
2 |
2 |
713 |
787 |
892 |

Payments
Description Slow but Correct
Key
figures
|
Year |
2013 |
2012 |
2011 |
2010 |
2009 |
|
Quick ratio |
0,30 |
0,34 |
0,43 |
0,50 |
0,52 |
|
Current ratio |
1,01 |
1,11 |
1,03 |
1,25 |
1,07 |
|
Working capital/ balance
total |
0,01 |
0,06 |
0,02 |
0,13 |
0,05 |
|
Equity / balance
total |
0,12 |
0,17 |
-0,04 |
0,09 |
0,13 |
|
Equity / Fixed
assets |
0,31 |
0,46 |
-0,11 |
0,25 |
0,38 |
|
Equity / liabilities |
0,13 |
0,21 |
-0,04 |
0,10 |
0,15 |
|
Balance total /
liabilities |
1,13 |
1,21 |
0,96 |
1,10 |
1,15 |
|
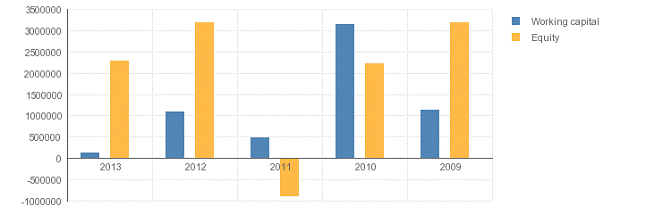
Working capital |
130.148 |
1.096.308 |
494.447 |
3.139.369 |
1.132.372 |
|
Equity |
2.294.102 |
3.181.166 |
-882.797 |
2.213.015 |
3.180.131 |
|
Mutation equity |
-27,88 |
460,35 |
-139,89 |
-30,41 |
-8,76 |
|
Mutation short term
liabilities |
15,21 |
-32,07 |
18,87 |
-18,00 |
-20,88 |
|
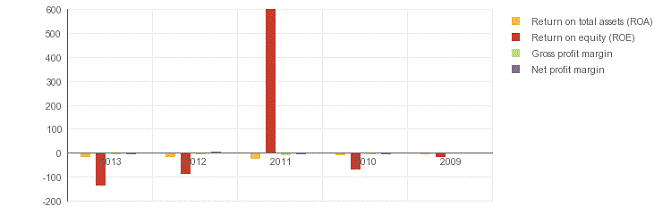
Return on total
assets (ROA) |
-15,52 |
-14,56 |
-22,06 |
-5,76 |
-1,92 |
|
Return on equity
(ROE) |
-131,76 |
-83,58 |
599,49 |
-64,38 |
-15,06 |
|
Gross profit margin |
-4,10 |
-3,61 |
-6,73 |
-1,32 |
0,33 |
|
Net profit margin |
-4,03 |
3,30 |
-4,30 |
-1,29 |
-0,27 |
|
Average collection ratio |
5,43 |
6,11 |
4,76 |
5,88 |
7,34 |
|
Average payment ratio |
27,61 |
25,81 |
12,58 |
12,88 |
29,36 |
|
Equity turnover ratio |
28,00 |
19,72 |
-81,57 |
33,82 |
35,78 |
|
Total assets turnover
ratio |
3,30 |
3,44 |
3,00 |
3,02 |
4,56 |
|
Fixed assets turnover
ratio |
8,55 |
9,11 |
8,60 |
8,42 |
13,66 |
|
Inventory conversion ratio |
7,63 |
7,94 |
7,88 |
7,87 |
13,17 |
|
Turnover |
64.228.585 |
62.748.409 |
72.014.125 |
74.838.584 |
113.780.197 |
|
Gross margin |
29.905.408 |
30.155.823 |
32.788.179 |
36.336.831 |
51.736.321 |
|
Operating result |
-2.634.136 |
-2.266.780 |
-4.849.173 |
-986.225 |
374.850 |
|
Net result after
taxes |
-2.587.064 |
2.073.203 |
-3.095.812 |
-967.115 |
-305.191 |
|
Cashflow |
-739.346 |
3.911.607 |
-934.864 |
1.183.761 |
2.676.577 |
|
EBIT |
-2.634.136 |
-2.266.780 |
-4.849.173 |
-986.225 |
374.850 |
|
EBITDA |
-786.418 |
-428.376 |
-2.688.225 |
1.164.651 |
3.356.618 |
Summary The 2013 financial result structure is a
postive working captial of 130.148 euro, which is in
agreement
with 1 % of the total assets of the company.
The
working capital has diminished with -88.13 % compared to previous year. The
ratio, with
respect
to the total assets of the company has however, declined.
The
deterioration between 2012 and 2013 has mainly been caused by an increase of
the
current
liabilities.
The
current ratio of the company in 2013 was 1.01. When the current ratio is below
1.5, the
company
may have problems meeting its short-term obligations.
The
quick ratio in 2013 of the company was 0.3. A company with a Quick Ratio of
less than 1
cannot
currently pay back its current liabilities.
The
2012 financial result structure is a postive working captial of 1.096.308 euro,
which is in
agreement
with 6 % of the total assets of the company.
The
working capital has increased with 121.72 % compared to previous year. The
ratio, with
respect
to the total assets of the company has however, increased.
The
improvement between 2011 and 2012 has mainly been caused by an increase of the
current
assets.
The current ratio of the company in 2012 was 1.11. When the current
ratio is below 1.5, the
company
may have problems meeting its short-term obligations.
The
quick ratio in 2012 of the company was 0.34. A company with a Quick Ratio of
less than
1 cannot currently pay back its current liabilities.


Financial
statement
Last
annual account 2013
Remark
annual account There is no financial data
published
Type
of annual account Consolidated
Annual
account Brova
B.V.
Huygensweg 36
5482TG SCHIJNDEL
Netherlands
Registration number: 17151716
Balance
sheet
|
Year |
2013 |
2012 |
2011 |
2010 |
2009 |
|
End date |
2013-12-31 |
2012-12-31 |
2011-12-31 |
2010-12-31 |
2009-12-31 |
|
Intangible fixed assets |
1.322.584 |
1.813.581 |
2.304.578 |
2.795.575 |
3.286.572 |
|
Tangible fixed assets |
5.358.131 |
5.072.939 |
6.068.564 |
6.086.611 |
5.000.951 |
|
Financial fixed assets |
830.223 |
4.992 |
4.992 |
10.492 |
43.449 |
|
Fixed assets |
7.510.938 |
6.891.512 |
8.378.134 |
8.892.678 |
8.330.972 |
|
Total stock |
8.422.205 |
7.904.279 |
9.136.331 |
9.510.924 |
8.641.402 |
|
Year |
2013 |
2012 |
2011 |
2010 |
2009 |
|
End date |
2013-12-31 |
2012-12-31 |
2011-12-31 |
2010-12-31 |
2009-12-31 |
|
Accounts receivable |
404.267 |
296.284 |
490.214 |
711.619 |
459.934 |
|
Other receivables |
1.922.375 |
2.134.743 |
5.233.812 |
5.100.143 |
3.415.716 |
|
Total receivables |
2.326.642 |
2.431.027 |
5.724.026 |
5.811.762 |
3.875.650 |
|
Liquid funds |
1.212.985 |
1.030.493 |
752.880 |
535.746 |
4.125.751 |
|
Current assets |
11.961.832 |
11.365.799 |
15.613.237 |
15.858.432 |
16.642.803 |
|
Total assets |
19.472.770 |
18.257.311 |
23.991.371 |
24.751.110 |
24.973.775 |
|
Total equity |
2.294.102 |
3.181.166 |
-882.797 |
2.213.015 |
3.180.131 |
|
Provisions |
2.169.534 |
1.301.654 |
1.465.301 |
1.421.618 |
1.733.472 |
|
Long term interest
yielding debt |
3.177.450 |
425.000 |
1.630.430 |
1.737.767 |
2.949.741 |
|
Financial debts |
|
3.080.000 |
6.659.647 |
6.659.647 |
1.600.000 |
|
Long term liabilities |
3.177.450 |
3.505.000 |
8.290.077 |
8.397.414 |
4.549.741 |
|
Accounts payable |
4.533.536 |
3.485.733 |
6.862.474 |
4.076.924 |
4.108.620 |
|
Other short term
liabilities |
7.298.148 |
6.783.758 |
8.256.316 |
8.642.139 |
11.401.811 |
|
Short term liabilities |
11.831.684 |
10.269.491 |
15.118.790 |
12.719.063 |
15.510.431 |
|
Total short and
long term liabilities |
17.178.668 |
15.076.145 |
24.874.168 |
22.538.095 |
21.793.644 |
|
Total liabilities |
19.472.770 |
18.257.311 |
23.991.371 |
24.751.110 |
24.973.775 |
Summary
The total assets of the company increased
with 6.66 % between 2012 and 2013.
The total asset increase is retrievable in
the fixed asset growth of 8.99 %.
Asset growth is in contrasts with the net
worth decline of -27.88 %. The company's
indebtedness has, therefore, increased with
13.95 %.
In 2013 the assets of the company were 38.57
% composed of fixed assets and 61.43 % by
current assets. The assets are being financed
by an equity of 11.78 %, and total debt of
88.22 %.
The total assets of the company decreased
with -23.9 % between 2011 and 2012.
This total assets decrease has been reflected
in a reduction of non current assets of -17.74
%.
The asset reduction is in contrast with the
equity growth of 460.35 %. Due to this the total
debt decreased with -39.39 %.
In 2012 the assets of the company were 37.75
% composed of fixed assets and 62.25 % by
current assets. The assets are being financed
by an equity of 17.42 %, and total debt of
82.58 %.


Profit
and loss
|
Year |
2013 |
2012 |
2011 |
2010 |
2009 |
|
Revenues |
64.228.585 |
62.748.409 |
72.014.125 |
74.838.584 |
113.780.197 |
|
Net turnover |
64.228.585 |
62.748.409 |
72.014.125 |
74.838.584 |
113.780.197 |
|
Gross margin |
29.905.408 |
30.155.823 |
32.788.179 |
36.336.831 |
51.736.321 |
|
Wages and salaries |
16.260.472 |
16.173.864 |
18.701.841 |
18.406.998 |
24.755.670 |
|
Amorization and depreciation |
1.847.718 |
1.838.404 |
2.160.948 |
2.150.876 |
2.981.768 |
|
Sales |
34.323.177 |
32.592.586 |
39.225.946 |
38.501.753 |
62.043.876 |
|
other operating costs |
14.431.354 |
14.410.335 |
16.774.563 |
16.765.182 |
23.624.033 |
|
Operating expenses |
66.862.721 |
65.015.189 |
76.863.298 |
75.824.809 |
113.405.347 |
|
Operating result |
-2.634.136 |
-2.266.780 |
-4.849.173 |
-986.225 |
374.850 |
|
Financial income |
2.306 |
2.914 |
2.896 |
3.257 |
13.406 |
|
Financial expenses |
390.834 |
394.846 |
445.974 |
441.868 |
867.117 |
|
Financial result |
-388.528 |
-391.932 |
-443.078 |
-438.611 |
-853.711 |
|
Result on ordinary
operations before taxes |
-3.022.664 |
-2.658.712 |
-5.292.251 |
-1.424.836 |
-478.861 |
|
Taxation on the
result of ordinary
activities |
-435.600 |
909.610 |
-709.535 |
-116.516 |
-105.019 |
|
Result of ordinary
activities after taxes |
-2.587.064 |
-3.568.322 |
-4.582.716 |
-1.308.320 |
-373.842 |
|
Result subsidiaries after
taxes |
|
5.641.525 |
1.486.904 |
341.205 |
68.651 |
|
Net result |
-2.587.064 |
2.073.203 |
-3.095.812 |
-967.115 |
-305.191 |
Summary The turnover of the company grew with 2.36 %
between 2012 and 2013.
The
gross profit of the company has remained the same between 2012 and 2013.
The
operating result of the company declined with -16.21 % between 2012 and 2013.
This
evolution
implies an decrease of the company's economic profitability.
The
result of these changes is a reduction of the company's Economic Profitability
of -6.59 %
of
the analysed period, being equal to -15.52 in the year 2013.
This
fall has contributed to a asset turnover decrease, whose index evolved from
-4.07 to a
level
of 3.3.
The
Net Result of the company decreased by -224.79 % between 2012 and 2013.
The
company's Financial Profitability has been negatively affected by the financial
activities in
comparison
to the EBITs behaviour. The result of these variations is a profitability reduction
of
-57.65 % of the analysed period, being -131.76 in the year 2013.
The
company's financial profitability has been positively affected by its financial
structure.
The
turnover of the company decreased by -12.87 % between 2011 and 2012.
The
gross profit of the company decreased by -8.03 % between 2011 and 2012.
The operating result of the company grew with 53.25 % between 2011 and
2012. This
evolution
implies an increase of the company's economic profitability.
The
result of these changes is an increase of the company's Economic Profitability
of 34 % of
the
analysed period, being equal to -14.56 in the year 2012.
This
growth has contributed to the increase in assets turnover, increasing by 14.67
%
reaching
3.44.
The
Net Result of the company increased by 166.97 % between 2011 and 2012.
The
company's Financial Profitability has been positively affected by the financial
activities in
comparison
to the EBITs behaviour. The result of these variations is a profitability
increase of
-113.94
% of the analysed period, being -83.58 in the year 2012.
The company's financial profitability has been positively affected by
its financial structure.

Analysis
Branch
(SBI) REAL ESTATE ACTIVITIES (SBI
code 68)
Region
Noord-Oost-Brabant
Summary In the Netherlands 50896 of
the companies are registered with the SBI code 68
In the region Noord-Oost-Brabant 856 of the
companies are registered with the SBI code 68
In the Netherlands 595 of the bankrupcties
are published within this sector
In the region Noord-Oost-Brabant 7 of the
bankruptcies are published within this sector
The risk of this specific sector in the
Netherlands is normal
The risk of this specific sector in the region Noord-Oost-Brabant is
normal
Publications
Deposits
23-09-2015: De jaarrekening
over 2013 is gepubliceerd.
23-04-2015: De jaarrekening over 2014 is
gepubliceerd.
19-12-2013: De jaarrekening over 2012 is
gepubliceerd.
21-08-2012: De jaarrekening over 2011 is
gepubliceerd.
21-07-2011: De jaarrekening over 2010 is gepubliceerd.
Functions
13-11-2013: Per 30-09-2013 is bestuurder
Ewald Alphonsus Maria Dekkers uit functie
getreden.
13-08-2013: Per 09-08-2013 is bestuurder
Hendrik Johan Martin Duthler in functie getreden.
26-07-2013: Per 23-07-2013 is commissaris Johannes
Martinus Josephus Maria Kessels uit
functie getreden.
26-07-2013: Per 23-07-2013 is commissaris
Petrus Wilhelmus Gerardus de Haas uit functie
getreden.
26-07-2013: Per 23-07-2013 is commissaris
Johannes van Hees uit functie getreden.
02-01-2013: Per 15-12-2012 is commissaris
Johannes Martinus Josephus Maria Kessels in
functie getreden.
14-09-2012: Per 01-07-2012 is commissaris
Petrus Wilhelmus Gerardus de Haas in functie
getreden.
14-09-2012: Per 01-07-2012 is commissaris
Johannes van Hees in functie getreden.
06-07-2012: Per 01-07-2012 is commissaris
Albert Johannes Martens uit functie getreden.
06-07-2012: Per 01-07-2012 is commissaris
Theodorus Johannes Jozef Olierook uit functie
getreden.
15-06-2012: Per 04-06-2012 is bestuurder Jean
Pierre Marinus Seemann in functie getreden.
13-04-2012: Per 01-04-2012 is commissaris
Arnoldus Joseph van Hout uit functie getreden.
Amendments
14-05-2014: Gestort kapitaal gewijzigd in EUR
1.748.000,00.
13-08-2013: Geplaatst kapitaal gewijzigd in
EUR 1.748.000,00 Gestort kapitaal gewijzigd in
EUR 648.000,00.
13-08-2013: Per 9-8-2013 is de bevoegdheid
van Bestuurder Jean Pierre Marinus Seemann
gewijzigd.
13-08-2013: Per 9-8-2013 is de bevoegdheid
van Bestuurder Ewald Alphonsus Maria
Dekkers gewijzigd.
13-08-2013: Per 9-8-2013 statuten gewijzigd.
12-11-2012: Geplaatst kapitaal gewijzigd in EUR 48.000,00 Gestort
kapitaal gewijzigd in EUR 48.000,00.
Company
structure
Relations 7
|
Company |
Registration
number |
|
|
|
|
Brova Holding B.V.
(SCHIJNDEL) |
58391452 |
|
| - -
Brova B.V. (SCHIJNDEL) |
17151716 |
|
| - -
| - -
Purdey Mode B.V.
(SCHIJNDEL) |
08054188 |
|
| - -
| - -
Duthler-Intermode B.V. (Schijndel) |
16041451 |
|
| - -
| - -
Dutch Mode B.V.
(SCHIJNDEL) |
17184537 |
|
| - -
| - -
Hout-Brox B.V. (Schijndel) |
16051373 |
|
| - -
| - -
Brova Retail Services
B.V. (SCHIJNDEL) |
17127038 |
FOREIGN EXCHANGE RATES
|
Currency |
Unit
|
Indian Rupees |
|
US Dollar |
1 |
Rs.66.55 |
|
|
1 |
Rs.100.64 |
|
Euro |
1 |
Rs.70.70 |
INFORMATION DETAILS
|
Analysis Done by
: |
KAS |
|
|
|
|
Report Prepared
by : |
ANK |
RATING EXPLANATIONS
|
RATING |
STATUS |
PROPOSED CREDIT LINE |
|
|
>86 |
Aaa |
Possesses an extremely sound financial base with the strongest
capability for timely payment of interest and principal sums |
Unlimited |
|
71-85 |
Aa |
Possesses adequate working capital. No caution needed for credit
transaction. It has above average (strong) capability for payment of interest
and principal sums |
Large |
|
56-70 |
A |
Financial & operational base are regarded healthy. General
unfavourable factors will not cause fatal effect. Satisfactory capability for
payment of interest and principal sums |
Fairly Large |
|
41-55 |
Ba |
Overall operation is considered normal. Capable to meet normal
commitments. |
Satisfactory |
|
26-40 |
B |
Capability to overcome financial difficulties seems comparatively
below average. |
Small |
|
11-25 |
Ca |
Adverse factors are apparent. Repayment of interest and principal sums
in default or expected to be in default upon maturity |
Limited with
full security |
|
<10 |
C |
Absolute credit risk exists. Caution needed to be exercised |
Credit not
recommended |
|
-- |
NB |
New Business |
-- |
This score serves as a reference to assess
SC’s credit risk and to set the amount of credit to be extended. It is calculated
from a composite of weighted scores obtained from each of the major sections of
this report. The assessed factors and their relative weights (as indicated
through %) are as follows:
Financial
condition (40%) Ownership
background (20%) Payment record
(10%)
Credit history
(10%) Market trend (10%) Operational size
(10%)
This report is issued at your request without any
risk and responsibility on the part of MIRA INFORM PRIVATE LIMITED (MIPL)
or its officials.