MIRA INFORM REPORT
|
Report No. : |
352331 |
|
Report Date : |
30.11.2015 |
IDENTIFICATION DETAILS
|
Name : |
PETROBRAS GLOBAL TRADING B.V. |
|
|
|
|
Registered Office : |
Weena 732, 3014DA Rotterdam |
|
|
|
|
Country : |
Netherlands |
|
|
|
|
Financials (as on) : |
31.12.2014 |
|
|
|
|
Date of Incorporation : |
27.04.2011 |
|
|
|
|
Com. Reg. No.: |
KvK-nummer: 52606171 |
|
|
|
|
Legal Form : |
Besloten Vennootschap |
|
|
|
|
Line of Business : |
|
|
|
|
|
No. of Employee : |
Not Available |
RATING & COMMENTS
|
MIRA’s Rating : |
Ba |
|
RATING |
STATUS |
PROPOSED CREDIT LINE |
|
|
41-55 |
Ba |
Overall operation is considered normal. Capable to meet normal
commitments. |
Satisfactory |
|
Status : |
Good |
|
|
|
|
Payment Behaviour : |
Regular |
|
|
|
|
Litigation : |
Clear |
NOTES :
Any query related to this report can be made
on e-mail : infodept@mirainform.com
while quoting report number, name and date.
ECGC Country Risk Classification List – March 31, 2015
|
Country Name |
Previous Rating (31.12.2014) |
Current Rating (31.03.2015) |
|
Netherlands |
A1 |
A1 |
|
Risk Category |
ECGC
Classification |
|
Insignificant |
A1 |
|
Low |
A2 |
|
Moderate |
B1 |
|
High |
B2 |
|
Very High |
C1 |
|
Restricted |
C2 |
|
Off-credit |
D |
NETHERLANDS - ECONOMIC OVERVIEW
The Netherlands, the sixth-largest economy in the European Union, plays an important role as a European transportation hub, with a persistently high trade surplus, stable industrial relations, and moderate unemployment. Industry focuses on food processing, chemicals, petroleum refining, and electrical machinery. A highly mechanized agricultural sector employs only 2% of the labor force but provides large surpluses for food-processing and underpins the country’s status as the world’s second largest agricultural exporter. The Netherlands is part of the Eurozone, and as such, its monetary policy is controlled by the European Central Bank. The Dutch financial sector is highly concentrated, with four commercial banks possessing over 90% of banking assets. The sector suffered as a result of the global financial crisis and required billions of dollars of government support, but the European Banking Authority completed stringent reviews in 2014 and deemed Dutch banks to be well-capitalized. To address the 2009 and 2010 economic downturns, the government sought to stimulate the domestic economy by accelerating infrastructure programs, offering corporate tax breaks for employers to retain workers, and expanding export credits. The stimulus programs and bank bailouts, however, resulted in a government budget deficit of 5.3% of GDP in 2010 that contrasted sharply with a surplus of 0.7% in 2008. The government of Prime Minister Mark RUTTE has since implemented significant austerity measures to improve public finances and has instituted broad structural reforms in key policy areas, including the labor market, the housing sector, the energy market, and the pension system. As a result, the government budget deficit at the end of 2014 dropped to 1.8% of GDP. Following a protracted recession during which unemployment doubled to 7.4% and household consumption contracted for nearly three consecutive years, the year 2014 saw fragile GDP growth of 0.8 percent and a rise in most economic indicators. Drivers of growth included increased exports and business investments, as well as newly invigorated household consumption.
|
Source
: CIA |
Company
name
PETROBRAS GLOBAL
TRADING B.V.
Summary
|
Company name |
PETROBRAS GLOBAL TRADING B.V. |
|
Operative address |
Weena 732 |
|
|
3014DA Rotterdam |
|
|
Netherlands |
|
Legal form |
Besloten Vennootschap |
|
Registration number |
KvK-nummer: 52606171 |
|
VAT-number |
850518568 |
|
Year |
2014 |
Mutation |
2013 |
Mutation |
2012 |
|
Fixed assets |
28.666.336.233 |
115,73 |
13.288.334.032 |
50,10 |
8.852.797.800 |
|
|
|
|
|
|
|
|
Total receivables |
15.726.144.943 |
28,77 |
12.212.492.514 |
134,92 |
5.198.558.621 |
|
|
|
|
|
|
|
|
Total equity |
13.500.837.583 |
20,41 |
11.212.384.447 |
-2,53 |
11.503.856.709 |
|
Short term
liabilities |
3.205.831.545 |
13,34 |
2.828.517.220 |
159,54 |
1.089.802.222 |
|
|
|
|
|
|
|
|
Net result |
764.661.512 |
73,22 |
441.434.280 |
72,55 |
255.823.868 |
|
|
|
|
|
|
|
|
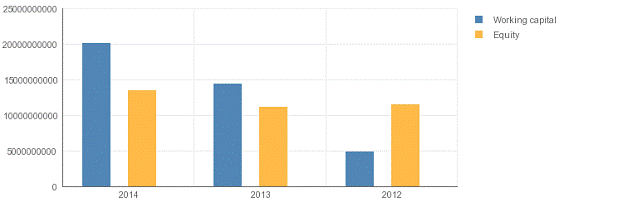
Working capital |
20.141.410.040 |
39,22 |
14.467.102.100 |
194,13 |
4.918.645.014 |
|
|
|
|
|
|
|
|
Quick ratio |
7,03 |
19,56 |
5,88 |
14,84 |
5,12 |
Contact
information
|
Company name |
PETROBRAS GLOBAL TRADING B.V. |
|
Trade names |
PETROBRAS GLOBAL TRADING B.V. |
|
|
|
|
Operative address |
Weena 732 |
|
|
3014DA Rotterdam |
|
|
Netherlands |
|
Correspondence address |
Weena 732 |
|
|
3014DA Rotterdam |
|
|
Netherlands |
|
Telephone number |
0102067078 |
|
Fax number |
0102067095 |
|
Email address |
info@petrobras.com |
Registration
|
Registration number |
KvK-nummer: 52606171 |
|
Branch number |
000022526110 |
|
VAT-number |
850518568 |
|
Status |
Active |
|
First registration company register |
2011-04-27 |
|
Memorandum |
2011-04-27 |
|
Establishment date |
2011-04-27 |
|
Legal form |
Besloten Vennootschap |
|
Last proposed admendment |
2012-05-02 |
|
Issued placed capital |
EUR 11.230.666.600 |
|
Paid up share capital |
EUR 11.230.666.600 |
Activities
|
SBI |
0910: Support activities for petroleum and natural gas extraction |
|
|
46712: Wholesale of liquid and gaseous fuels |
|
|
|
|
Exporter |
No |
|
Importer |
No |
|
|
|
|
Goal |
Het - al dan niet tezamen met anderen - verkrijgen, in eigendom hebben, leasen, huren, exploreren, openen, verkennen, onderzoeken, ontwikkelen, bewerken, verbeteren, in stand houden en beheren van mijnen, olie- en aardgasvelden, vergunningen, reservaten, terreinen en eigendommen, rechten op gebieden op land of op zee die mineralen, olie, aardgas, kolen of andere koolwaterstoffen bevatten of kunnen bevatten en welke zich voor winning daarvan lenen of kunnen lenen. |
Relations
|
Shareholders |
PETROBRAS INTERNATIONAL BRASPETRO B.V. |
|
|
Weena 7224th Floor Tower-A 3014DA Rotterdam Netherlands Registration number: 24339383 Percentage: 100% |
Management
|
Active management |
C.F.J. Looman Cornelis Franciscus Jozef Netherlands Competence: Jointly authorized Function: Manager Starting date: 2011-04-27 Date of birth: 1948-03-22, Schiedam, NL Involved with the following companies: Transpetro International B.V. Weena 7223rd floor 3014DA Rotterdam Netherlands Registration number: 53561767 Function: Manager PETROBRAS INTERNATIONAL BRASPETRO B.V. Weena 7224th Floor Tower-A 3014DA Rotterdam Netherlands Registration number: 24339383 Function: Manager M.A. Zacarias Marcos Antonio Netherlands Competence: Jointly authorized Function: Manager Starting date: 2011-04-27 Date of birth: 1960-05-16, Rio de Janeiro, BR Involved with the following companies: PETROBRAS INTERNATIONAL BRASPETRO B.V. Weena 7224th Floor Tower-A 3014DA Rotterdam Netherlands Registration number: 24339383 Function: Manager Petrobras Netherlands B.V. Weena 722 3014DA Rotterdam Netherlands Registration number: 24320769 Function: Commissaris G. Zappa Guido Netherlands Competence: Jointly authorized Function: Manager Starting date: 2014-10-01 Date of birth: 1954-04-06, Timóteo, BR J. De Lima Castro Campos Jacqueline Netherlands Competence: Jointly authorized Function: Manager Starting date: 2015-07-01 Date of birth: 1960-09-22, Rio de Janeiro, NL |
Employees
|
Total according to the Chamber of Commerce |
NA |
|
|
|
|
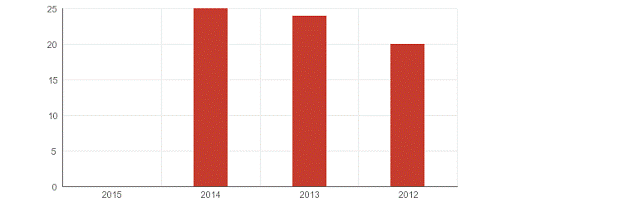
Year |
2015 |
2014 |
2013 |
2012 |
|
Total |
NA |
25 |
24 |
20 |
Payments
Regular
Key
figures
|
Year |
2014 |
2013 |
2012 |
|
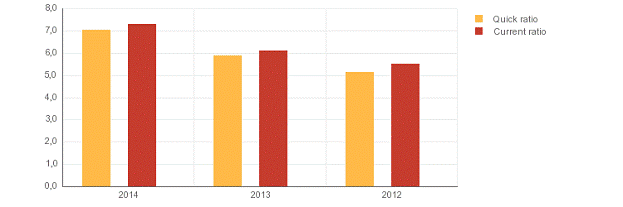
Quick ratio |
7,03 |
5,88 |
5,12 |
|
Current ratio |
7,28 |
6,11 |
5,51 |
|
Working capital/ balance
total |
0,39 |
0,47 |
0,33 |
|
Equity / balance
total |
0,26 |
0,37 |
0,77 |
|
Equity / Fixed
assets |
0,47 |
0,84 |
1,30 |
|
Equity / liabilities |
0,35 |
0,58 |
3,43 |
|
Balance total /
liabilities |
1,35 |
1,58 |
4,43 |
|
Working capital |
20.141.410.040 |
14.467.102.100 |
4.918.645.014 |
|
Equity |
13.500.837.583 |
11.212.384.447 |
11.503.856.709 |
|
Mutation equity |
20,41 |
-2,53 |
|
|
Mutation short term
liabilities |
13,34 |
159,54 |
|
|
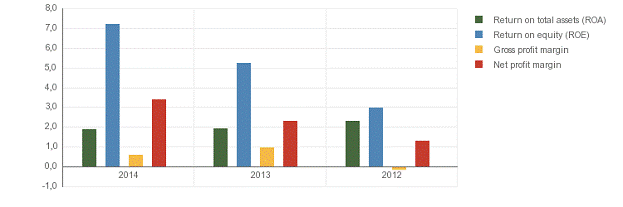
Return on total
assets (ROA) |
1,87 |
1,92 |
2,29 |
|
Return on equity
(ROE) |
7,21 |
5,25 |
2,96 |
|
Gross profit margin |
0,59 |
0,98 |
-0,12 |
|
Net profit margin |
3,41 |
2,31 |
1,29 |
|
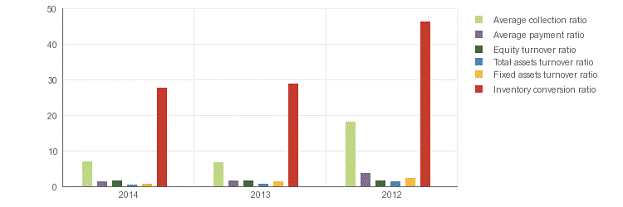
Average collection ratio |
6,99 |
6,75 |
18,24 |
|
Average payment ratio |
1,43 |
1,56 |
3,82 |
|
Equity turnover ratio |
1,66 |
1,70 |
1,73 |
|
Total assets turnover
ratio |
0,43 |
0,62 |
1,34 |
|
Fixed assets turnover
ratio |
0,78 |
1,44 |
2,25 |
|
Inventory conversion ratio |
27,70 |
28,84 |
46,35 |
|
Turnover |
22.414.211.817 |
19.097.708.409 |
19.878.422.720 |
|
Gross margin |
389.433.957 |
465.500.701 |
264.439.148 |
|
Operating result |
131.997.299 |
186.534.701 |
-24.715.023 |
|
Net result after
taxes |
764.661.512 |
441.434.280 |
255.823.868 |
|
Cashflow |
|
|
256.001.222 |
|
Gross profit |
22.414.211.817 |
|
19.878.422.720 |
|
EBIT |
131.997.299 |
186.534.701 |
-24.715.023 |
|
EBITDA |
|
|
-24.537.670 |
Summary
The 2014 financial result structure is a postive working captial of 20.141.410.040
euro, which is in agreement with 39 % of the total assets of the company.
The working capital has increase with 39.22 % compared to previous year.
The ratio with respect to the total assets of the company has however,
declined.
The improvement between 2013 and 2014 has mainly been caused by an
increase of the current assets.
The current ratio of the company in 2014 was 7.28. If the current ratio
exeeds 3.0, the company may not be using its current assets or its short-term
financing facilities efficiently . The quick ratio in 2014 of the company was
7.03. A company with a Quick Ratio of more than 1 can currently pay back its
current liabilities.
The 2013 financial result structure is a postive working captial of
14.467.102.100 euro, which is in agreement with 47 % of the total assets of the
company.
The working capital has increased with 194.13 % compared to previous
year. The ratio, with respect to the total assets of the company has however,
increased.
The improvement between 2012 and 2013 has mainly been caused by an
increase of the current assets.
The current ratio of the company in 2013 was 6.11. If the current ratio
exeeds 3.0, the company may not be using its current assets or its short-term
financing facilities efficiently . The quick ratio in 2013 of the company was
5.88. A company with a Quick Ratio of more than 1 can currently pay back its
current liabilities.
Financial
statement
|
Last annual account |
2014 |
|
Remark annual account |
The company is obliged to file its financial statements. |
|
Type of annual account |
Corporate |
|
Annual account |
PETROBRAS GLOBAL TRADING B.V. Weena 732 3014DA Rotterdam Netherlands Registration number: 52606171 |
Balance
|
Year |
2014 |
2013 |
2012 |
|
End date |
2014-12-31 |
2013-12-31 |
2012-12-31 |
|
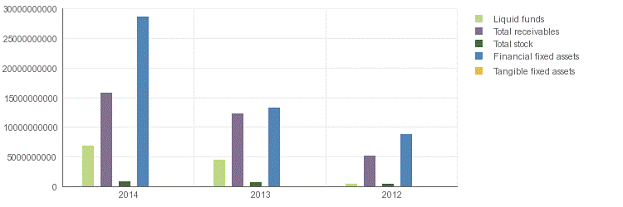
Tangible fixed assets |
211.679 |
232.761 |
295.589 |
|
Financial fixed assets |
28.666.124.554 |
13.288.101.272 |
8.852.502.211 |
|
Fixed assets |
28.666.336.233 |
13.288.334.032 |
8.852.797.800 |
|
Total stock |
809.190.771 |
662.130.392 |
428.903.305 |
|
Accounts receivable |
924.200.186 |
1.478.114.750 |
1.014.096.595 |
|
Other receivables |
14.801.944.757 |
10.734.377.764 |
4.184.462.026 |
|
Total receivables |
15.726.144.943 |
12.212.492.514 |
5.198.558.621 |
|
Liquid funds |
6.811.905.871 |
4.420.996.414 |
380.985.310 |
|
Current assets |
23.347.241.585 |
17.295.619.320 |
6.008.447.236 |
|
Total assets |
52.013.577.818 |
30.583.953.352 |
14.861.245.036 |
|
Issued capital |
11.236.211.405 |
11.214.379.952 |
11.226.410.890 |
|
Share premium reserve |
34.668.462 |
30.520.630 |
31.901.623 |
|
Other reserves |
1.465.296.204 |
-473.950.414 |
-10.279.673 |
|
Non-distributable profit |
764.661.512 |
441.434.280 |
255.823.868 |
|
Total reserves |
2.264.626.178 |
-1.995.504 |
277.445.819 |
|
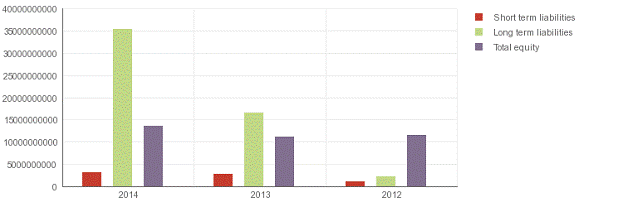
Total equity |
13.500.837.583 |
11.212.384.447 |
11.503.856.709 |
|
Long term interest
yielding debt |
35.306.908.690 |
16.543.051.684 |
2.267.586.105 |
|
Long term liabilities |
35.306.908.690 |
16.543.051.684 |
2.267.586.105 |
|
End date |
2014-12-31 |
2013-12-31 |
2012-12-31 |
|
Accounts payable |
1.130.022.505 |
1.386.916.865 |
1.064.199.674 |
|
Other short term
liabilities |
2.075.809.040 |
1.441.600.356 |
25.602.548 |
|
Short term liabilities |
3.205.831.545 |
2.828.517.220 |
1.089.802.222 |
|
Total short and
long term liabilities |
38.512.740.235 |
19.371.568.904 |
3.357.388.327 |
|
Total liabilities |
52.013.577.818 |
30.583.953.352 |
14.861.245.036 |
Summary
The total assets of the company increased with 70.07 % between 2013 and
2014.
The total asset increase is retrievable in the fixed asset growth of
115.73 %. The asset growth has mainly been financed by a debt increase of 98.81
%. The Net Worth, however, grew with 20.41 %.
In 2014 the assets of the company were 55.11 % composed of fixed assets
and 44.89 % by current assets. The assets are being financed by an equity of
25.96 %, and total debt of 74.04 %.
The total assets of the company increased with 105.8 % between 2012 and
2013. The fixed asset growth of 50.1 % is lower than the total asset growth.
Asset growth is in contrasts with the net worth decline of -2.53 %. The
company's indebtedness has, therefore, increased with 476.98 %.
In 2013 the assets of the company were 43.45 % composed of fixed assets
and 56.55 % by current assets. The assets are being financed by an equity of
36.66 %, and total debt of 63.34 %.
Profit
and loss
|
Year |
2014 |
2013 |
2012 |
|
Revenues |
22.439.073.843 |
19.097.708.409 |
19.888.475.017 |
|
Other operating
income |
24.862.025 |
|
10.052.297 |
|
Net turnover |
22.414.211.817 |
19.097.708.409 |
19.878.422.720 |
|
Gross margin |
389.433.957 |
465.500.701 |
264.439.148 |
|
Wages and
salaries |
|
4.091.074 |
|
|
Amorization and
depreciation |
|
|
177.353 |
|
Sales |
282.298.683 |
18.632.207.708 |
19.613.983.571 |
|
other operating
costs |
|
274.874.925 |
299.029.115 |
|
Operating expenses |
22.307.076.544 |
18.911.173.708 |
19.913.190.040 |
|
Operating result |
131.997.299 |
186.534.701 |
-24.715.023 |
|
Financial income |
2.162.063.013 |
841.076.810 |
473.783.555 |
|
Financial expenses |
1.320.360.933 |
439.032.714 |
108.339.401 |
|
Financial result |
841.702.080 |
402.044.097 |
365.444.154 |
|
Result on
ordinary operations before
taxes |
973.699.379 |
588.578.798 |
340.729.131 |
|
Taxation on
the result of
ordinary |
209.037.867 |
147.144.518 |
84.905.263 |
|
activities |
|
|
|
|
Result of
ordinary activities after
taxes |
764.661.512 |
441.434.280 |
255.823.868 |
|
Net result |
764.661.512 |
441.434.280 |
255.823.868 |
Summary
The turnover of the company grew with 17.37 % between 2013 and 2014.
The gross profit of the company decreased by -16.34 % between 2013 and
2014. The operating result of the company declined with -29.24 % between 2013
and 2014. This evolution implies an decrease of the company's economic
profitability. The result of these changes is a reduction of the company's
Economic Profitability of -2.6 % of the analysed period, being equal to 1.87 in
the year 2014.
This fall has contributed to a asset turnover decrease, whose index
evolved from -30.65 to a level of 0.43.
The Net Result of the company increased by 73.22 % between 2013 and
2014. The company's Financial Profitability has been positively affected by the
financial activities in comparison to the EBITs behaviour. The result of these
variations is a profitability increase of 37.33 % of the analysed period, being
7.21 in the year 2014.
The company's financial structure has slowed down its financial
profitability.
The turnover of the company decreased by -3.93 % between 2012 and 2013.
The gross profit of the company grew with 76.03 % between 2012 and 2013. The
operating result of the company grew with 854.74 % between 2012 and 2013. This
evolution implies an increase of the company's economic profitability. The
result of these changes is a reduction of the company's Economic Profitability
of -16.16 % of the analysed period, being equal to 1.92 in the year 2013.
This fall has contributed to a asset turnover decrease, whose index
evolved from -53.73 to a level of 0.62.
The Net Result of the company increased by 72.55 % between 2012 and
2013. The company's Financial Profitability has been negatively affected by the
financial activities in comparison to the EBITs behaviour. The result of these
variations is a profitability reduction of 77.36 % of the analysed period,
being 5.25 in the year 2013.
The company's financial structure has slowed down its financial
profitability.
Analysis
|
Branch (SBI) |
Mining support activities (SBI code 09) |
|
Region |
Groot Rotterdam |
|
Summary |
In the Netherlands 556 of the companies are registered with the SBI
code 09 |
|
|
In the region Groot Rotterdam 47 of the companies are registered with the SBI code 09 The risk of this specific sector in the Netherlands is Lowest The risk of this specific sector in the region Groot Rotterdam is Lowest |
Publications
|
Deposits |
20-05-2015: De jaarrekening over 2014 is gepubliceerd. 12-06-2014: De jaarrekening over 2013 is gepubliceerd. 01-04-2013: De jaarrekening over 2012 is gepubliceerd. 03-04-2012: De jaarrekening over 2011 is gepubliceerd. |
|
Functions |
18-08-2015: Per 01-07-2015 is bestuurder Jacqueline De Lima Castro Campos in functie getreden. 16-02-2015: Per 06-02-2015 is bestuurder Abilio Paulo Pinheiro Ramos uit functie getreden. 06-10-2014: Per 01-10-2014 is bestuurder Guido Zappa in functie getreden. 06-10-2014: Per 01-10-2014 is bestuurder Newton Vieiralves Sobrinho uit functie getreden. 15-05-2014: Per 01-05-2014 is bestuurder Abilio Paulo Pinheiro Ramos in functie getreden. 15-05-2014: Per 01-05-2014 is bestuurder José Raimundo Brandão Pereira uit functie getreden. 04-01-2012: Per 01-01-2012 is bestuurder Newton Vieiralves Sobrinho in functie getreden. |
|
|
|
|
Mergers |
04-01-2012: Op 30-12-2011 splitsingsakte (afsplitsing) verleden.
Splitsende rechtspersoon: |
|
|
PETROBRAS INTERNATIONAL BRASPETRO B.V., 24339383 Verkrijgende
rechtspersoon: PETROBRAS GLOBAL TRADING B.V., 52606171. |
|
|
|
|
Amendments |
11-05-2012: Geplaatst kapitaal gewijzigd in EUR 11.230.666.600,00
Gestort kapitaal gewijzigd in EUR 11.230.666.600,00. |
|
|
09-05-2012: Geplaatst kapitaal gewijzigd in EUR 10.155.232.600,00
Gestort kapitaal gewijzigd in EUR 10.155.232.600,00. 08-05-2012: Geplaatst kapitaal gewijzigd in EUR 8.327.218.300,00
Gestort kapitaal gewijzigd in EUR 8.327.218.300,00. 08-05-2012: Per 2-5-2012 statuten gewijzigd. 01-05-2012: Geplaatst kapitaal gewijzigd in EUR 6.439.542.600,00
Gestort kapitaal gewijzigd in EUR 6.439.542.600,00. 12-04-2012: Geplaatst kapitaal gewijzigd in EUR 5.985.100.500,00
Gestort kapitaal gewijzigd in EUR 5.985.100.500,00. 28-03-2012: Geplaatst kapitaal gewijzigd in EUR 5.300.273.300,00
Gestort kapitaal gewijzigd in EUR 5.300.273.300,00. 22-03-2012: Geplaatst kapitaal gewijzigd in EUR 1.532.091.900,00
Gestort kapitaal gewijzigd in EUR 1.532.091.900,00. 22-03-2012: Per 16-3-2012 statuten gewijzigd. |
|
Other |
15-05-2012: ...
Datum deponering: 10-05-2012 Soort deponering: Bankverklaring (art. 93a lid 6 BW2 of art.
203a lid 6 BW2). 11-05-2012: ...
... Datum deponering: 08-05-2012 Soort deponering: Bankverklaring (art. 93a lid 6 BW2 of
art. 203a lid 6 BW2). 08-05-2012: ...
Datum deponering: 07-05-2012 Soort deponering: Bankverklaring (art. 93a lid 6 BW2 of art.
203a lid 6 BW2). 29-03-2012: ...
Datum deponering: 27-03-2012 Soort deponering: Bankverklaring (art. 93a lid 6 BW2 of art.
203a lid 6 BW2). 22-03-2012:
Datum deponering: 21-03-2012 Soort deponering: Bankverklaring (art. 93a lid 6 BW2 of art. 203a lid 6 BW2). |
Company
structure
|
Relations |
6 |
|
|
|
|
Company |
Registration |
|
|
number |
|
PETROBRAS INTERNATIONAL BRASPETRO
B.V. (Rotterdam) |
24339383 |
|
| - -
Petrobras Venezuela Investments
& Services B.V.
(ROTTERDAM) |
34242054 |
|
| - -
PETROBRAS GLOBAL TRADING
B.V. (Rotterdam) |
52606171 |
|
| - -
Petroleum Middle East
B.V. (ROTTERDAM) |
34209430 |
|
| - -
Drill Ship International B.V.
(AMSTERDAM) |
34355971 |
|
| - -
PETROBRAS GLOBAL FINANCE
B.V. (ROTTERDAM) |
55810322 |
FOREIGN EXCHANGE RATES
|
Currency |
Unit
|
Indian Rupees |
|
US Dollar |
1 |
Rs.66.75 |
|
|
1 |
Rs.100.68 |
|
Euro |
1 |
Rs.70.88 |
|
|
1 |
Rs. |
Note :
Above are approximate rates obtained from sources believed to be correct
INFORMATION DETAILS
|
Analysis Done by
: |
KAS |
|
|
|
|
Report Prepared
by : |
ASH |
RATING EXPLANATIONS
|
RATING |
STATUS |
PROPOSED CREDIT LINE |
|
|
>86 |
Aaa |
Possesses an extremely sound financial base with the strongest
capability for timely payment of interest and principal sums |
Unlimited |
|
71-85 |
Aa |
Possesses adequate working capital. No caution needed for credit
transaction. It has above average (strong) capability for payment of interest
and principal sums |
Large |
|
56-70 |
A |
Financial & operational base are regarded healthy. General unfavourable
factors will not cause fatal effect. Satisfactory capability for payment of
interest and principal sums |
Fairly Large |
|
41-55 |
Ba |
Overall operation is considered normal. Capable to meet normal
commitments. |
Satisfactory |
|
26-40 |
B |
Capability to overcome financial difficulties seems comparatively
below average. |
Small |
|
11-25 |
Ca |
Adverse factors are apparent. Repayment of interest and principal sums
in default or expected to be in default upon maturity |
Limited with full
security |
|
<10 |
C |
Absolute credit risk exists. Caution needed to be exercised |
Credit not
recommended |
|
-- |
NB |
New Business |
-- |
This score serves as a reference to assess SC’s
credit risk and to set the amount of credit to be extended. It is calculated
from a composite of weighted scores obtained from each of the major sections of
this report. The assessed factors and their relative weights (as indicated
through %) are as follows:
Financial
condition (40%) Ownership
background (20%) Payment
record (10%)
Credit history
(10%) Market trend (10%) Operational size
(10%)
This report is issued at your request without any
risk and responsibility on the part of MIRA INFORM PRIVATE LIMITED (MIPL) or
its officials.