MIRA INFORM REPORT
|
Report No. : |
343380 |
|
Report Date : |
01.10.2015 |
IDENTIFICATION DETAILS
|
Name : |
TTK HEALTHCARE LIMITED |
|
|
|
|
Registered
Office : |
No.6, Cathedral Road, Chennai – 600086, Tamilnadu |
|
Tel. No.: |
91-44-28116106/ 08/ 09/ 10 |
|
|
|
|
Country : |
India |
|
|
|
|
Financials (as
on) : |
31.03.2015 |
|
|
|
|
Date of
Incorporation : |
21.05.1958 |
|
|
|
|
Com. Reg. No.: |
18-003647 |
|
|
|
|
Capital
Investment / Paid-up Capital : |
Rs. 77.660 Million |
|
|
|
|
CIN No.: [Company Identification
No.] |
L24231TN1958PLC003647 |
|
|
|
|
IEC No.: |
Not Available |
|
|
|
|
TAN No.: [Tax Deduction &
Collection Account No.] |
CHET07410E |
|
|
|
|
PAN No.: [Permanent Account No.] |
AABCT3312J |
|
|
|
|
Legal Form : |
A Public Limited Liability Company. The Company’s Shares are Listed on
the Stock Exchanges. |
|
|
|
|
Line of Business
: |
Subject is engaged in Pharmaceuticals, Consumer Products, Medical Devices and Foods Businesses. |
|
|
|
|
No. of Employees
: |
1809 (Approximately) |
RATING & COMMENTS
|
MIRA’s Rating : |
A (64) |
|
RATING |
STATUS |
PROPOSED CREDIT LINE |
|
|
56-70 |
A |
Financial & operational base are regarded healthy. General unfavourable
factors will not cause fatal effect. Satisfactory capability for payment of
interest and principal sums |
Fairly Large |
|
Maximum Credit Limit : |
USD 3380000 |
|
|
|
|
Status : |
Good |
|
|
|
|
Payment Behaviour : |
Regular |
|
|
|
|
Litigation : |
Clear |
|
|
|
|
Comments : |
Subject is part of the reputed TT Krishnamachari Group, a
multi-product conglomerate, incorporated in the year 1958. It is having fine
track record. For the FY 15, the company has recorded increase in its sales turnover
and profit margin, when compared to previous year. It has fine operational
activity marked by satisfactory profit margin of 3.35%. It has adequate
networth position. The rating takes into account the steady operational and financial
performance of the company during the recent past, characterized by
consistent volume and revenue growth across majority of the product
categories, stable margins and healthy capital structure. The rating continue
to derive comfort from the established presence of the company with strong
brand position in key product segment. Trade relations are fair. Business is active. Payments are reported to
be regular and as per commitment. In the view of long track record, the company can be considered for
business dealings at usual trade terms and conditions. |
NOTES :
Any query related to this report can be made
on e-mail : infodept@mirainform.com
while quoting report number, name and date.
ECGC Country Risk Classification List – March 31, 2015
|
Country Name |
Previous Rating (31.12.2014) |
Current Rating (31.03.2015) |
|
India |
A1 |
A1 |
|
Risk Category |
ECGC
Classification |
|
Insignificant |
A1 |
|
Low |
A2 |
|
Moderate |
B1 |
|
High |
B2 |
|
Very High |
C1 |
|
Restricted |
C2 |
|
Off-credit |
D |
EXTERNAL AGENCY RATING
|
Rating Agency Name |
ICRA |
|
Rating |
Fund Based Facilities = “A+” |
|
Rating Explanation |
Adequate degree of safety and low credit risk |
|
Date |
09.04.2015 |
|
Rating Agency Name |
ICRA |
|
Rating |
Non-Fund Based Facilities = “A1” |
|
Rating Explanation |
Very strong degree of safety and carry lowest credit risk |
|
Date |
09.04.2015 |
RBI DEFAULTERS’ LIST STATUS
Subject’s name is not enlisted as a defaulter
in the publicly available RBI Defaulters’ list.
EPF (Employee Provident Fund) DEFAULTERS’ LIST STATUS
Subject’s name is not enlisted as a defaulter
in the publicly available EPF (Employee Provident Fund) Defaulters’ list as of
31-03-2015.
INFORMATION DENIED
Management Non-Cooperative (91-44-28116108/09/10)
LOCATIONS
|
Registered/ Head/ Administrative Office : |
No.6, Cathedral Road, Chennai – 600086, Tamilnadu, India |
|
Tel. No.: |
91-44-28116106/ 08/ 09/ 10 |
|
Fax No.: |
91-44-28114307 |
|
E-Mail : |
skr@ttkhealthcare.com
|
|
Website : |
|
|
|
|
|
Factory 1 : |
No.5, Old Trunk Road, Pallavaram, Chennai – 600 043, Tamilnadu, India. |
|
|
|
|
Factory 2 : |
No.2-B, Hosakote Industrial Area, 8th Kilometer, Hosakote
Chintamani Road, Bangalore – 562 114, Karnataka, India |
|
|
|
|
Factory 3 : |
Site No.A-28, KINFRA International Apparel Parks Limited, St.
Xavier’s Collage P.O., Thumba, Trivandrum – 695 586, Kerala, India |
|
|
|
|
Factory 4 : |
No.290, SIDCO Industrial Estate, Ambattur, Chennai – 600 098, Tamilnadu, India |
|
|
|
|
Factory 5 : |
No.3, Thiruneermalai Main Road, Chromepet, Chennai – 600 044,
Tamilnadu, India |
|
|
|
|
Publications Divisions : |
Plot No.13, 1st Avenue, Mahindra World City, Natham Sub Post, Chengalpet Taluk, Kanchipuram – 603 002, Tamilnadu, India |
|
|
|
|
Depots : |
Located at:
|
DIRECTORS
As on 31.03.2015
|
Name : |
Mr. T.T. Jagannathan |
|
Designation : |
Chairman |
|
|
|
|
Name : |
Mr. T.T. Raghunathan |
|
Designation : |
Executive Vice Chairman |
|
Date of Birth/ Age: |
61 Years |
|
Qualification: |
B. Com. |
|
Experience : |
41 Years |
|
Date of Appointment : |
01.11.2001 |
|
|
|
|
Name : |
Mr. R.K. Tulshan |
|
Designation : |
Director |
|
|
|
|
Name : |
Dr. K.R. Srimurthy |
|
Designation : |
Director |
|
|
|
|
Name : |
Mr. B.N. Bhagwat |
|
Designation : |
Director |
|
|
|
|
Name : |
Mr. K. Shankaran |
|
Designation : |
Director |
|
|
|
|
Name : |
Dr. (Mrs.) Vandana R Walveka |
|
Designation : |
Director |
|
|
|
|
Name : |
Mr. Girish Rao |
|
Designation : |
Director |
|
|
|
|
Name : |
Mr. S Balasubramanian |
|
Designation : |
Director |
|
|
|
|
Name : |
Mr. S Kalyanaraman |
|
Designation : |
Director and Secretary |
KEY EXECUTIVES
|
Name : |
Mr. S. Kalyanaraman |
|
Designation : |
Company Secretary |
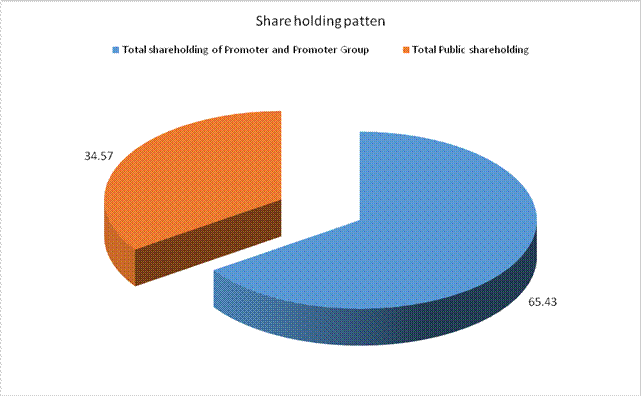
MAJOR SHAREHOLDERS / SHAREHOLDING PATTERN
As on 30.06.2015
|
Category of
Shareholder |
No. of Shares |
Percentage of
Holding |
|
(A) Shareholding
of Promoter and Promoter Group |
||
|
|
|
|
|
|
926835 |
11.93 |
|
|
10080 |
0.13 |
|
|
4144085 |
53.36 |
|
|
4144085 |
53.36 |
|
|
5081000 |
65.43 |
|
|
|
|
|
Total
shareholding of Promoter and Promoter Group (A) |
5081000 |
65.43 |
|
(B) Public
Shareholding |
||
|
|
|
|
|
|
330075 |
4.25 |
|
|
6219 |
0.08 |
|
|
403560 |
5.20 |
|
|
739854 |
9.53 |
|
|
|
|
|
|
132640 |
1.71 |
|
|
|
|
|
|
1131339 |
14.57 |
|
|
641696 |
8.26 |
|
|
11932 |
0.15 |
|
|
27522 |
0.35 |
|
|
27522 |
0.35 |
|
|
1945129 |
25.05 |
|
Total Public
shareholding (B) |
2684983 |
34.57 |
|
Total (A)+(B) |
7765983 |
100.00 |
|
(C) Shares held
by Custodians and against which Depository Receipts have been issued |
|
|
|
|
0 |
0.00 |
|
|
0 |
0.00 |
|
|
0 |
0.00 |
|
Total
(A)+(B)+(C) |
7765983 |
0.00 |
BUSINESS DETAILS
|
Line of Business : |
Subject is engaged in Pharmaceuticals, Consumer Products, Medical Devices and Foods Businesses. |
||||||||||
|
|
|
||||||||||
|
Products : |
|
||||||||||
|
|
|
||||||||||
|
Brand Names : |
Not Available |
||||||||||
|
|
|
||||||||||
|
Agencies Held : |
Not Available |
||||||||||
|
|
|
||||||||||
|
Exports : |
Not Divulged |
||||||||||
|
|
|
||||||||||
|
Imports : |
Not Divulged |
||||||||||
|
|
|
||||||||||
|
Terms : |
Not Divulged |
PRODUCTION STATUS = NOT AVAILABLE
GENERAL INFORMATION
|
Suppliers : |
|
||||||||||||||||||||||||||||||
|
|
|
||||||||||||||||||||||||||||||
|
Customers : |
|
||||||||||||||||||||||||||||||
|
|
|
||||||||||||||||||||||||||||||
|
No. of Employees : |
1809 (Approximately) |
||||||||||||||||||||||||||||||
|
|
|
||||||||||||||||||||||||||||||
|
Bankers : |
|
||||||||||||||||||||||||||||||
|
|
|
||||||||||||||||||||||||||||||
|
Facilities : |
(Rs.
In Million)
|
|
|
|
|
Banking
Relations : |
-- |
|
|
|
|
Statutory Auditors : |
|
|
Name 1 : |
Aiyar and Company Chartered Accountants |
|
Address : |
New No.2 (Old No.184), Rangarajapuram Main Road (1st
Floor), Kodambakkam, Chennai – 600 024, Tamilnadu, India |
|
|
|
|
Name 2 : |
S. Viswanathan Chartered Accountants |
|
Address : |
New No.17 (Old No.8A), Bishop Wallers Avenue (West), Mylapore, Chennai
– 600 004, Tamilnadu, India |
|
|
|
|
Memberships : |
-- |
|
|
|
|
Collaborators : |
-- |
|
|
|
|
Associates/ Others: |
|
CAPITAL STRUCTURE
As on 31.03.2015
Authorised Capital :
|
No. of Shares |
Type |
Value |
Amount |
|
10000000 |
Equity Shares |
Rs.10/- each |
Rs.100.000 million |
|
|
|
|
|
Issued, Subscribed & Paid-up Capital :
|
No. of Shares |
Type |
Value |
Amount |
|
7765983 |
Equity Shares |
Rs.10/- each |
Rs.77.660
million |
|
|
|
|
|
|
Particulars |
31.03.2015 |
|
par value per share: |
10/- |
|
|
|
|
Reconciliation of the number of shares outstanding at the beginning
and at the end of the reporting period |
|
|
Equity shares: |
|
|
(i) No. of shares outstanding at the beginning of the period |
7765983 |
|
(ii) No. of shares issued during the period |
-- |
|
(iii) No. of shares bought back / forfeited during the period |
-- |
|
(iv) No. of shares outstanding at the end of the period |
7765983 |
|
|
|
|
The rights, preferences and restrictions attaching
to each class of shares including restrictions on the distribution of
dividends and the repayment of capital |
The Company
presently has only one class of Equity Shares. Each Shareholder is entitled
to one vote per share and also to dividend as proposed and approved by the
Directors and Members respectively. |
|
|
|
|
Shares in respect of each class in the Company
held by its Holding Company or its ultimate Holding Company including shares
held by or by Subsidiaries or associates of the Holding Company or the
ultimate Holding Company in aggregate |
-- |
|
|
|
|
Shares in the Company held by each shareholder holding more than 5
percent shares specifying the number of shares held |
|
|
T.T. Jagannathan (9.40%) |
730048 |
|
T.T. Krishnamachari and Company represented
by its Partners (53.36%) |
4144085 |
|
|
|
|
shares reserved for issue under options and
contracts / commitments for the sale of shares / disinvestment, including the
terms and amounts |
-- |
|
|
|
|
For the period of five years immediately
preceding the date as at which the Balance Sheet is prepared: |
|
|
· Aggregate number and class of shares allotted as
fully paid up pursuant to contract(s) without payment being received in cash. |
-- |
|
· Aggregate number and class of shares allotted
as fully paid up by way of bonus shares. |
-- |
|
· Aggregate
number and class of shares bought back: |
321514 |
|
|
|
|
Terms of any securities convertible into
equity/preference shares issued along with the earliest date of conversion in
descending order starting from the farthest such date. |
-- |
|
|
|
|
Calls unpaid |
-- |
|
|
|
|
Forfeited shares
(amount originally paid up) |
-- |
FINANCIAL DATA
[all figures are
in Rupees Million]
ABRIDGED
BALANCE SHEET
|
SOURCES
OF FUNDS |
31.03.2015 |
31.03.2014 |
31.03.2013 |
|
|
|
|
|
|
I.
EQUITY AND LIABILITIES |
|
|
|
|
(1)Shareholders' Funds |
|
|
|
|
(a) Share Capital |
77.660 |
77.660 |
77.660 |
|
(b) Reserves & Surplus |
1105.045 |
991.604 |
904.563 |
|
(c) Money received against
share warrants |
0.000 |
0.000 |
0.000 |
|
|
|
|
|
|
(2) Share Application money
pending allotment |
0.000 |
0.000 |
0.000 |
|
Total
Shareholders’ Funds (1) + (2) |
1182.705 |
1069.264 |
982.223 |
|
|
|
|
|
|
(3) Non-Current Liabilities |
|
|
|
|
(a) long-term borrowings |
159.836 |
158.660 |
5.776 |
|
(b) Deferred tax liabilities
(Net) |
22.259 |
29.464 |
26.495 |
|
(c) Other long term
liabilities |
96.564 |
84.181 |
80.290 |
|
(d) long-term provisions |
0.000 |
0.000 |
0.000 |
|
Total
Non-current Liabilities (3) |
278.659 |
272.305 |
112.561 |
|
|
|
|
|
|
(4) Current Liabilities |
|
|
|
|
(a) Short term borrowings |
223.012 |
132.401 |
215.540 |
|
(b) Trade payables |
300.689 |
299.455 |
285.631 |
|
(c) Other current liabilities |
724.733 |
589.527 |
461.053 |
|
(d) Short-term provisions |
42.166 |
36.448 |
36.448 |
|
Total
Current Liabilities (4) |
1290.600 |
1057.831 |
998.672 |
|
|
|
|
|
|
TOTAL |
2751.964 |
2399.400 |
2093.456 |
|
|
|
|
|
|
II.
ASSETS |
|
|
|
|
(1) Non-current assets |
|
|
|
|
(a) Fixed Assets |
|
|
|
|
(i) Tangible assets |
515.776 |
533.562 |
430.759 |
|
(ii) Intangible Assets |
2.986 |
3.131 |
3.622 |
|
(iii) Capital work-in-progress |
456.959 |
19.657 |
3.089 |
|
(iv) Intangible assets under
development |
0.000 |
0.000 |
0.000 |
|
(b) Non-current Investments |
0.000 |
0.000 |
0.000 |
|
(c) Deferred tax assets (net) |
0.000 |
0.000 |
0.000 |
|
(d) Long-term Loan and Advances |
115.245 |
214.317 |
112.321 |
|
(e) Other Non-current assets |
0.000 |
0.000 |
0.000 |
|
Total
Non-Current Assets |
1090.966 |
770.667 |
549.791 |
|
|
|
|
|
|
(2) Current assets |
|
|
|
|
(a) Current investments |
1.337 |
1.337 |
7.681 |
|
(b) Inventories |
373.774 |
339.509 |
270.966 |
|
(c) Trade receivables |
444.126 |
382.991 |
351.049 |
|
(d) Cash and cash equivalents |
772.999 |
840.586 |
837.638 |
|
(e) Short-term loans and
advances |
68.762 |
64.310 |
76.331 |
|
(f) Other current assets |
0.000 |
0.000 |
0.000 |
|
Total
Current Assets |
1660.998 |
1628.733 |
1543.665 |
|
|
|
|
|
|
TOTAL |
2751.964 |
2399.400 |
2093.456 |
PROFIT
& LOSS ACCOUNT
|
|
PARTICULARS |
31.03.2015 |
31.03.2014 |
31.03.2013 |
|
|
SALES |
|
|
|
|
|
Income |
4829.266 |
4161.796 |
3822.983 |
|
|
Other Income |
65.678 |
61.235 |
67.386 |
|
|
TOTAL
(A) |
4894.944 |
4223.031 |
3890.369 |
|
|
|
|
|
|
|
Less |
EXPENSES |
|
|
|
|
|
Cost of Materials Consumed |
313.864 |
255.758 |
203.077 |
|
|
Purchases of Stock-in-Trade |
1906.303 |
1745.072 |
1638.394 |
|
|
Changes in inventories of finished
goods, work-in-progress and Stock-in-Trade |
(25.689) |
(56.266) |
54.447 |
|
|
Employees benefits expense |
722.844 |
606.551 |
529.504 |
|
|
Other expenses |
1616.455 |
1413.638 |
1196.095 |
|
|
TOTAL
(B) |
4533.777 |
3964.753 |
3621.517 |
|
|
|
|
|
|
|
Less |
PROFIT/
(LOSS) BEFORE INTEREST, TAX,
DEPRECIATION AND AMORTISATION (C) |
361.167 |
258.278 |
268.852 |
|
|
|
|
|
|
|
Less |
FINANCIAL
EXPENSES (D) |
36.423 |
29.879 |
25.438 |
|
|
|
|
|
|
|
|
PROFIT
/ (LOSS) BEFORE TAX, DEPRECIATION AND AMORTISATION (C-D) (E) |
324.744 |
228.399 |
243.414 |
|
|
|
|
|
|
|
Less/
Add |
DEPRECIATION/
AMORTISATION (F) |
61.398 |
31.743 |
27.197 |
|
|
|
|
|
|
|
|
PROFIT/ (LOSS)
BEFORE TAX (E-F) (G) |
263.346 |
196.656 |
216.217 |
|
|
|
|
|
|
|
Less |
TAX (H) |
101.794 |
72.769 |
74.183 |
|
|
|
|
|
|
|
|
PROFIT/ (LOSS)
AFTER TAX (G-H) (I) |
161.552 |
123.887 |
142.034 |
|
|
|
|
|
|
|
Add |
PREVIOUS
YEARS’ BALANCE BROUGHT FORWARD (K) |
538.292 |
463.748 |
372.557 |
|
|
|
|
|
|
|
Less |
APPROPRIATIONS |
|
|
|
|
|
Proposed Dividend |
34.947 |
31.064 |
31.064 |
|
|
Provision for tax on Dividend |
7.114 |
5.279 |
5.279 |
|
|
Amount transferred to General Reserve |
20.000 |
13.000 |
14.500 |
|
|
Total
(M) |
62.061 |
49.343 |
50.843 |
|
|
|
|
|
|
|
|
Balance
Carried to the B/S (J+K+L-M) |
637.783 |
538.292 |
463.748 |
|
|
|
|
|
|
|
|
EARNINGS
IN FOREIGN CURRENCY |
33.162 |
32.905 |
47.228 |
|
|
|
|
|
|
|
|
IMPORTS |
|
|
|
|
|
Raw Materials |
20.184 |
47.486 |
37.296 |
|
|
Capital Goods |
92.127 |
10.534 |
9.989 |
|
|
Spares |
0.130 |
0.294 |
0.045 |
|
|
TOTAL
IMPORTS |
112.441 |
58.314 |
47.330 |
|
|
|
|
|
|
|
|
Earnings
/ (Loss) Per Share (Rs.) |
20.8 |
15.95 |
18.29 |
CURRENT MATURITIES OF LONG TERM DEBT DETAILS
|
Particulars |
31.03.2015 |
31.03.2014 |
31.03.2013 |
|
Current Maturities of Long term debt |
30.000 |
20.000 |
0.000 |
|
Cash generated from operations |
519.495 |
165.673 |
323.543 |
QUARTERLY RESULTS
|
PARTICULARS |
1st
Quarter (June
2015) |
|
Audited / Unaudited |
|
|
Net Sales |
1386.610 |
|
Total Expenditure |
1300.490 |
|
PBIDT (Excl OI) |
86.120 |
|
Other Income |
13.420 |
|
Operating Profit |
99.540 |
|
Interest |
7.550 |
|
Exceptional Items |
NA |
|
PBDT |
91.990 |
|
Depreciation |
15.610 |
|
Profit Before Tax |
76.380 |
|
Tax |
29.260 |
|
Provisions and contingencies |
NA |
|
Profit After Tax |
47.120 |
|
Extraordinary Items |
NA |
|
Prior Period Expenses |
NA |
|
Other Adjustments |
NA |
|
Net Profit |
47.120 |
KEY
RATIOS
|
PARTICULARS |
|
31.03.2015 |
31.03.2014 |
31.03.2013 |
|
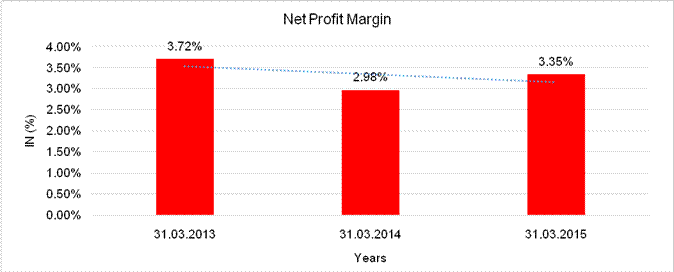
Net Profit Margin (PAT / Sales) |
(%) |
3.35 |
2.98 |
3.72 |
|
|
|
|
|
|
|
Operating Profit Margin (PBIDT/Sales) |
(%) |
7.48 |
6.21 |
7.03 |
|
|
|
|
|
|
|
Return on Total Assets (PBT/Total Assets} |
(%) |
11.47 |
8.26 |
10.34 |
|
|
|
|
|
|
|
Return on Investment (ROI) (PBT/Networth) |
|
0.22 |
0.18 |
0.22 |
|
|
|
|
|
|
|
Debt Equity Ratio (Total Debt /Networth) |
|
0.35 |
0.29 |
0.23 |
|
|
|
|
|
|
|
Current Ratio (Current Asset/Current Liability) |
|
1.29 |
1.54 |
1.55 |
STOCK
PRICES
|
Face Value |
Rs.10/- |
|
Market Value |
Rs.955.25/- |
FINANCIAL ANALYSIS
[all figures are
in Rupees Million]
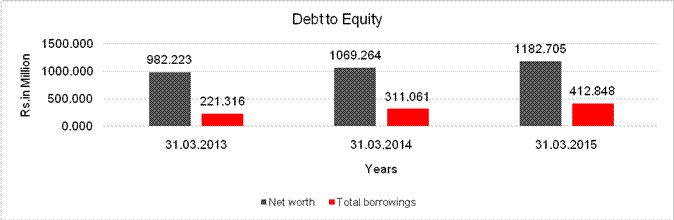
DEBT EQUITY RATIO
|
Particular |
31.03.2013 |
31.03.2014 |
31.03.2015 |
|
|
(Rs.
In Million) |
(Rs.
In Million) |
(Rs.
In Million) |
|
Share Capital |
77.660 |
77.660 |
77.660 |
|
Reserves & Surplus |
904.563 |
991.604 |
1105.045 |
|
Money received against share
warrants |
0.000 |
0.000 |
0.000 |
|
Share Application money pending allotment |
0.000 |
0.000 |
0.000 |
|
Net
worth |
982.223 |
1069.264 |
1182.705 |
|
|
|
|
|
|
long-term borrowings |
5.776 |
158.660 |
159.836 |
|
Short term borrowings |
215.540 |
132.401 |
223.012 |
|
Current maturities of
long-term debts |
0.000 |
20.000 |
30.000 |
|
Total
borrowings |
221.316 |
311.061 |
412.848 |
|
Debt/Equity
ratio |
0.225 |
0.291 |
0.349 |
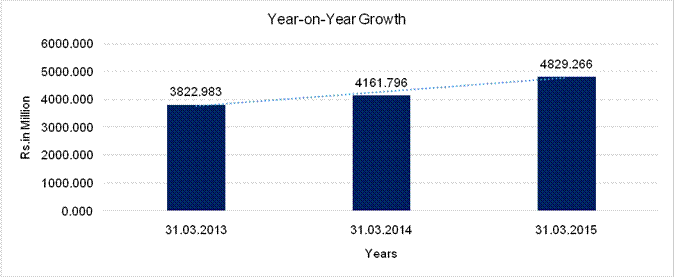
YEAR-ON-YEAR GROWTH
|
Year
on Year Growth |
31.03.2013 |
31.03.2014 |
31.03.2015 |
|
|
(Rs.
In Million) |
(Rs.
In Million) |
(Rs.
In Million) |
|
Sales |
3822.983 |
4161.796 |
4829.266 |
|
|
|
8.863 |
16.038 |
NET PROFIT MARGIN
|
Net
Profit Margin |
31.03.2013 |
31.03.2014 |
31.03.2015 |
|
|
(Rs.
In Million) |
(Rs.
In Million) |
(Rs.
In Million) |
|
Sales |
3822.983 |
4161.796 |
4829.266 |
|
Profit |
142.034 |
123.887 |
161.552 |
|
|
3.72% |
2.98% |
3.35% |
LOCAL AGENCY FURTHER INFORMATION
|
Sr. No. |
Check list by
info agents |
Available in
Report (Yes/No) |
|
1 |
Year of establishment |
Yes |
|
2 |
Constitution of the entity -Incorporation
details |
Yes |
|
3 |
Locality of the entity |
Yes |
|
4 |
Premises details |
No |
|
5 |
Buyer visit details |
-- |
|
6 |
Contact numbers |
No |
|
7 |
Name of the person contacted |
No |
|
8 |
Designation of contact person |
No |
|
9 |
Promoter’s background |
Yes |
|
10 |
Date of Birth of Proprietor / Partners /
Directors |
Yes |
|
11 |
Pan Card No. of Proprietor / Partners |
No |
|
12 |
Voter Id Card No. of Proprietor / Partners |
No |
|
13 |
Type of business |
Yes |
|
14 |
Line of Business |
Yes |
|
15 |
Export/import details (if applicable) |
No |
|
16 |
No. of employees |
No |
|
17 |
Details of sister concerns |
Yes |
|
18 |
Major suppliers |
No |
|
19 |
Major customers |
No |
|
20 |
Banking Details |
Yes |
|
21 |
Banking facility details |
Yes |
|
22 |
Conduct of the banking account |
-- |
|
23 |
Financials, if provided |
Yes |
|
24 |
Capital in the business |
Yes |
|
25 |
Last accounts filed at ROC, if applicable |
Yes |
|
26 |
Turnover of firm for last three years |
Yes |
|
27 |
Reasons for variation <> 20% |
-- |
|
28 |
Estimation for coming financial year |
No |
|
29 |
Profitability for last three years |
Yes |
|
30 |
Major shareholders, if available |
Yes |
|
31 |
External Agency Rating, if available |
Yes |
|
32 |
Litigations that the firm/promoter
involved in |
-- |
|
33 |
Market information |
-- |
|
34 |
Payments terms |
No |
|
35 |
Negative Reporting by Auditors in the
Annual Report |
No |
ANALYSIS OF
PERFORMANCE
Revenue from Operations registered a growth of
about 16% as against the previous year's
figure of about 9%, with a Profit before tax of Rs.263.300 Million. The
previous
year's Profit before tax was Rs.196.700 Million, after considering one-time / non-recurring
expenses amounting to Rs.48.500 Million.
During the year, the Other Income stood
at Rs.65.678 Million as against the previous year's
figure
of Rs.61.235 Million and this was due
to increase in interest earned on Fixed Deposits.
Goods Consumption as a percentage of Revenue from
Operations for the year works out to 45.44% as
against
the previous year's figure of 46.72%.
The reduction is due to higher proportion of Own Branded Goods vis-à-vis Traded Goods in the product mix.
The employee benefits expense was higher due to
regular annual increments / revision in packages and addition
of manpower, particularly at the field level.
The reduction in Power and Fuel expenses was
mainly on account of the commissioning of Briquette based Boiler at
Foods Division resulting in lower consumption of
diesel.
The increase in rates and taxes
was on
account of expenses incurred for
registration of the products of the Company in various overseas countries and also purchase of additional user licenses
for Oracle ERP.
The increase in Advertisement
& Sales Promotion expenses is on account
of enhanced advertisements / higher sales promotional expenses
incurred on various product categories and incentives to field staff.
The loss on obsolescence of
assets Rs.4.546 Million mainly represents the
unusable dies relating to Foods Division.
The higher depreciation is due to adoption of
Schedule II to the Companies Act, 2013.
The addition to Fixed Assets
mainly represents the - (i) stamp duty and registration
charges paid for the Leasehold land acquired at Jaipur for the Foods
Project (Rs.2.110 Million);
(ii)
capital expenditure incurred for the
capacity enhancement, automation of material handling and factory renovation projects undertaken at Hosakote factory
of Foods Division (Rs.30.093 Million); (iii) expenses incurred for the purchase of plant and machinery - for Ortho Division
(Rs.6.816 Million) and for
Pharma Division (Rs.1.205 Million); (iv) expenses
incurred for the procurement of moulds mainly for
CPD
(Rs.1.351 Million); (v) purchase of vehicles (Rs.8.193 Million); and (vi) computer
and software’s (Rs.3.907 Million). Capital
work-in-progress of Rs.4,57.000 Million mainly represents the assets acquired for the Foods Project at Jaipur and
this would be capitalized upon commissioning of
the plant.
The increase in Inventories is in
line
with the enhanced level of operations during the year
and the plan for the current year.
The reduction in Cash and Bank
balances
was on account of utilization of monies
from Fixed Deposits for meeting the capital expenditure relating to Foods Project at Jaipur. The increase
in Trade Receivables is in line with the growth in sales and there were no major overdue outstanding.
The decrease in Loans and
Advances mainly represents adjustment of capital
advances given to various Contractors for the Foods Project at Jaipur upon completion of supply of materials /
provision of services. The increase in Other Current Liabilities mainly
represents the creditors relating to procurement
of capital goods for Jaipur Project of Foods
Division. The increase in Trade Payables is in line with the operations and there
were no major overdue payments to any creditors.
REVIEW OF
PERFORMANCE
During the year the revenue from operations amounted to Rs.4829.300
Million as against the previous year figure of Rs.4161.800 Million, a growth of
16%.
Details of products
included in each of the segments are as below:
- Pharmaceuticals include products for both Human and Veterinary use. It also includes OTC Brands like Woodward's Gripewater distributed by the Consumer Products Division.
- Medical Devices include Artificial Heart Valves, Orthopaedic Implants, etc.
- Consumer Products consists of marketing and distribution of EVA Range of Cosmetics, Good Home Range of Scrubbers, Air Freshners, etc. (Own Brands) and also trading of Branded Condoms.
- Foods comprise of manufacturing and marketing of Food Products.
- "Others" comprise of Printing and Publishing of Maps and Atlases.
MANAGEMENT
DISCUSSION AND ANALYSIS:
INDUSTRY STRUCTURE
AND DEVELOPMENTS
During the year 2014-15, the GDP growth was estimated at around 7.4% as
against the previous year's growth of 6.9%, which is a positive development.
Factors like steep decline in oil prices, increase in forex reserves,
lower rate of inflation and various initiatives by the new Government aimed at
reforms augur well for a positive overall macroeconomic scenario. Further,
clear thrust on investments in infrastructural projects such as power, roads
and ports is likely to provide the much needed impetus to the manufacturing
sector.
The Indian Pharma Market currently valued at around Rs.83,000.000
Million (MAT – Dec. 2014) has posted a smart recovery with a growth of 10.2% as
against the previous year's growth of 6% despite the impact of the introduction
of ceiling prices for the National List of Essential Medicines (NLEM).
The growth was driven by (i) growth in volume of existing brands (4.6%);
(ii) new introductions (2.9%); and (iii) price revisions (2.7%). Chronic
Segment grew at 13.1% vis-à-vis the growth of 9% in Acute Segment. While the
anti-infective segment has almost remained flat, the other therapeutic segments
like anti-diabetic, cardiology, urology and derma reported healthy growth.
SEGMENTWISE
PERFORMANCE:
The Company is engaged in Pharmaceuticals, Consumer Products, Medical
Devices and Foods Businesses. A look at the performance of individual Business
Segments:
Pharmaceutical
Business:
The Ethical Pharma Business of the Company deals in Pharmaceutical
Formulations both Herbal and Allopathic, in various therapeutic segments.
Pharmaceuticals also include Woodward's Gripewater. Since this product is
distributed through the Consumer Products Division of the Company, it is
covered under the head Consumer Products Business.
Ethical Products
Division (EPD) And Ventura Division
During the year EPD and Ventura Division reported a sales turnover of
around Rs.1420.000 Million with a healthy growth, significantly higher than the
market growth. The flagship brands have shown healthy growth. New launches are
also taken up well by the doctors, indicating a promising business opportunity.
In the previous year, the Company started implementing the various
recommendations of M/s Bain and Company and the Company plans to further
intensify the implementation of these initiatives in the current year also.
Ethical Products
Division (EPD) And Ventura Division
During the year under review, EPD and Ventura Division reported a sales
turnover of around Rs.142 crores with a healthy growth, significantly higher
than the market growth. The flagship brands have shown healthy growth. New
launches are also taken up well by the doctors, indicating a promising business
opportunity.
In the previous year, your Company started implementing the various
recommendations of M/s Bain and Company and the Company plans to further
intensify the implementation of these initiatives in the current year also.
Animal Welfare
Division (AWD)
During the year under review, the Animal Welfare Division reported a sales turnover of around Rs.380.000
Million.
All the three sub-divisions viz., Bovianim (Cattle), Gallus (Poultry)
and Companim (Pet Animals) reported healthy growth and this was possible due to
appreciable growth in their flagship brands. Expanded coverage, focused
campaigns with special attention on dairy segment in Bovianim Division,
corporate customers in Gallus Division and improved coverage in Companim
Division and manpower expansion contributed to the good performance in the
financial year. AWD has set its sight on significant growth in the current
financial year as well by leveraging the expanded network, initiating high
intensity campaigns, enhanced focus on low yielding territories, product basket
expansion, farmer / dairy focused approach and operational distinctiveness.
Consumer Products
Business:
The Division reported a sales turnover of around Rs.2240.000 Million.
The overall performance has been satisfactory in what is otherwise considered a
sluggish business environment in the FMCG segment. WGW continued to grow,
though at a slower pace. It was basically weighed down by lack of growth in the
Northern markets. Deodorants as a category had a very difficult year with
deodorants showing 5% volume decline year-on-year. Despite this, EVA continued
to maintain its leadership position. The Company has seen many new initiatives
and relaunches - Mini Deo, in a new formulation and an attractive marketing mix
and Lip Balm were relaunched. EVA exotic, a premium range of Deo's were also
relaunched. The Company also launched Body Lotions during the year. These
initiatives helped EVA to report a decent growth. Good Home, the home care
range, performed satisfactorily. The Condom market had a very challenging year
with the category declining by around 2% and with price control fully in place.
Inspite of this, 'Skore' managed a marginal growth and achieved a market share
in excess of 10%, thus becoming the third largest brand in the market.
Medical Devices
Business:
Heart Valve
Division
The Company's Heart Valve Division reported a sales turnover of around
Rs.130.000 Million during the year under review. There has been a marginal
increase in volumes compared to the previous year. The performance of this
Division continues to be impacted due to stiff competition from imported valves
through price cuts, etc. Efforts are made to increase the volumes. Subject to
regulatory approval, the Vascular Graft and the Improved Heart Valve would
enter the clinical trial phase during the financial year 2015-16.
Ortho Division
During the year, Ortho Division reported a sales turnover of around
Rs.65.000 Million. The surgeons using BP Knee implants expressed satisfaction
over its performance, resulting in steady increase in the number of surgeries
in the domestic market. Leading Orthopaedic Surgeons in Italy have endorsed
your Company's knee implants. Efforts are underway to expand into Europe.
Efforts are also made to strengthen the product basket with the addition of new
products both for domestic and overseas market.
Foods Business:
During the year, the Foods Division achieved a sales turnover of around
Rs.570.000 Million. The performance of this Division has been satisfactory,
with a healthy growth. But for some unanticipated delays, the Jaipur facility
is now almost ready and would commence trial production by the end of the first
quarter of 2015-16. Commercial production is likely to commence during the
second quarter. There has been good progress in setting up a robust sales and
distribution network for handling the enhanced production. The R&D plant is
also expected to be installed by the end of 2015-16. With the entry of new
players, this segment is likely to see considerable competition in the coming
months. The Company would, therefore, clearly focus its efforts on
differentiation through innovative products and marketing initiatives.
STATEMENT
OF UNAUDITED FINANCIAL RESULTS FOR THE FIRST QUARTER ENDED 30TH JUNE
2015
(Rs.
In Million)
|
S. No. |
Particulars |
3 months ended |
|
30.06.2015 |
||
|
Unaudited |
||
|
1. |
Income from Operations |
|
|
|
Net Sales / Income from Operations (Net of Excise Duty) |
1386.464 |
|
|
Other Operating Income |
0.149 |
|
|
Total income from Operations (Net) |
1386.613 |
|
2. |
Expenses |
|
|
|
Cost of materials consumed |
77.874 |
|
|
Purchases of Stock-in-trade |
514.486 |
|
|
Changes in Inventories of finished goods, work-in-progress and stock-in-trade |
30.881 |
|
|
Employee benefits expense |
199.988 |
|
|
Depreciation and amortization expense |
15.606 |
|
|
Marketing Expenses |
259.045 |
|
|
Other expenses |
218.229 |
|
|
Total Expenses |
1316.109 |
|
3. |
Profit/ (Loss) from Operations before Other Income, Finance Costs and Exceptional Items
(1-2) |
70.504 |
|
4. |
Other Income |
13.420 |
|
5. |
Profit / (Loss) from Ordinary Activities before Finance Costs and Exceptional Items
(3±4) |
83.924 |
|
6. |
Finance Costs |
7.552 |
|
7. |
Profit / (Loss) from Ordinary Activities after Finance Costs but before Exceptional Items
(5±6) |
76.372 |
|
8. |
Exceptional Items |
0.00 |
|
9. |
Profit / (Loss) from Ordinary Activities before Tax (7±8) |
76.372 |
|
10. |
Tax Expense |
29.256 |
|
11. |
Net Profit / (Loss) from Ordinary Activities after Tax (9±10) |
47.116 |
|
12 |
Extraordinary Items (Net of Tax Expenses) |
0.00 |
|
13. |
Net Profit / (Loss) for the period (11 ±12) |
47.116 |
|
14. |
Share of Profit / (Loss) of Associates |
NA |
|
15. |
Minority Interest |
NA |
|
16. |
Net Profit / (Loss) after taxes, minority interest and share of
profit / (loss) of associates (13±14±15) |
47.116 |
|
17. |
Paid-up Equity Share Capital (Face Value Rs.10 per share) |
776.60 |
|
18. |
Reserve excluding Revaluation Reserves as per Balance Sheet of previous accounting year |
-- |
|
19. |
Earnings per share |
|
|
|
Basic |
6.07 |
|
|
Diluted |
6.07 |
|
|
|
|
|
A |
PARTICULARS OF SHAREHOLDING |
|
|
1. |
Public Shareholding |
|
|
|
- Number of Shares |
2684983 |
|
|
- Percentage of Shareholding |
34.57% |
|
2. |
Promoters and Promoter Group Shareholding |
|
|
|
Pledged / Encumbered |
|
|
|
- Number of Shares |
-- |
|
|
- Percentage of Shares (as a % of the total shareholding of Promoter and Promoter Group) |
-- |
|
|
- Percentage of Shares (as a % of the total Share Capital of the Company) |
-- |
|
|
Non-encumbered |
|
|
|
- Number of Shares |
5081000 |
|
|
- Percentage of Shares (as a % of the total shareholding of Promoter and Promoter Group) |
100.00% |
|
|
- Percentage of Shares (as a % of the total Share Capital of the Company) |
65.43% |
|
|
Particulars |
3 months ended (30.06.2015) |
|
B |
INVESTOR COMPLAINTS |
|
|
|
Pending at the beginning of the Quarter |
Nil |
|
|
Received during the Quarter |
Nil |
|
|
Disposed of during the Quarter |
N.A. |
|
|
Remaining uresolved at the end of the Quarter |
Nil |
Note:
- The above results have been reviewed by the Audit Committee and approved by the Board of Directors at its Meeting held on August 07, 2015, at Chennai.
- The Statutory Auditors have carried out a Limited Review of the Results for the three months ended 30th June, 2015.
- The previous year's figures have been regrouped and reclassified, wherever necessary to conform to the current year's presentation.
UNAUDITED SEGMENT WIE REVENUE, RESULTS AND
CAPITAL EMPLOYED
(Rs. In Million)
|
Particulars |
3
Month Ended (
Unaudited) |
|
|
30.06.2015 |
|
a.
Information about Primary Business Segments |
|
|
1.
Segment Revenue |
|
|
Pharmaceuticals |
762.691 |
|
Medical Device |
57.747 |
|
Consumer Products |
428.248 |
|
Food |
134.233 |
|
Others |
3.545 |
|
Total |
1386.464 |
|
Less : Inter Segment Revenue |
0.000 |
|
Net
Sales |
1386.464 |
|
|
|
|
2.
Segment Result |
|
|
Pharmaceuticals |
68.498 |
|
Medical Device |
8.116 |
|
Consumer Products |
1.445 |
|
Food |
19.610 |
|
Others |
1.336 |
|
Total |
99.005 |
|
Less : Fiancé Cost |
7.552 |
|
Less : Unallocable Expenses |
15.081 |
|
Total
Profit (+)/Loss (-) from ordinary activities before tax and Exceptional Items |
76.372 |
|
Less
: Exceptional Item |
0.00 |
|
Total
Profit (+)/Loss (-) from ordinary activities before tax and Extraordinary
Items |
76.372 |
|
Extraordinary Item |
0.000 |
|
|
|
|
3. Capital
Employed (Segment Assets-Segment Liabilities) |
|
|
Pharmaceuticals |
80.458 |
|
Medical Device |
125.672 |
|
Consumer Products |
(33.596) |
|
Food |
811.426 |
|
Others |
(3.397) |
|
Total |
980.563 |
|
b.
Information about Secondary Business Segments |
|
|
Unallocable Corporate Assets Unallocable Corporate Liabilities |
713.372 |
|
|
|
|
Total |
1693.935 |
INDEX OF CHARGES:
|
S.No. |
Charge ID |
Date of Charge Creation/Modification |
Charge amount secured |
Charge Holder |
Address |
Service Request Number (SRN) |
|
1 |
10539884 |
19/12/2014 |
200,000,000.00 |
Commonwealth Bank of Australia |
Level 2, Hoechst House, Nariman Point, Mumbai, Maharashtra - 400021, INDIA |
C38790267 |
|
2 |
80042390 |
08/04/2013 * |
272,500,000.00 |
CORPORATION BANK |
NO.49, ARMENIAN STREET, CHENNAI, Tamil Nadu - 600 001, INDIA |
B74123902 |
|
3 |
90373791 |
23/07/1997 |
7,500,000.00 |
INDIAN OVERSEAS BANK |
VEER NARIMAN ROAD, FORT, MUMBAI, Maharashtra, INDIA |
- |
*Date of charge modification
CONTINGENT
LIABILITIES:
(Rs. in million)
|
PARTICULARS |
31.03.2015 |
31.03.2014 |
|
Guarantees against letters of credit opened |
0.000 |
3.025 |
|
Other Guarantees |
17.805 |
14.202 |
|
Disputed Taxes/Claims, not acknowledged as debts |
176.633 |
154.774 |
FIXED ASSETS
Tangible Assets
Freehold Assets:
·
Land
·
Buildings
·
Plant and Equipment
·
Furniture and Fixtures
·
Vehicles
·
Office Equipments
·
Computers
Assets under
lease:
·
Leasehold Land
·
Leasehold Building
·
Vehicles
Intangible Assets
·
Computer Software’s
·
Brand/ Trade Mark
WEB SITE DETAILS
PRESS RELEASES
TTK HEALTHCARE TO MERGE TTK PROTECTIVE DEVICES
TTK Healthcare Ltd (TTKHC), the pharmaceutical arm of TTK
Group, is planning to merge TTK Protective DevicesLtd (TTKPD), the unlisted contraceptive
manufacturing firm and TSL Techno Services Ltd (TSL), into itself.
The company has today issued a notice of postal ballot seeking approval from
the Share holders for a scheme of amalgamation between TTKPD, which was
formerly known as TTK-LIG Ltd, and its wholly owned subsidiary TSL, and TTKHC.
As per the terms of the Scheme, all the assets, rights, liabilities and obligations
of TTKPD and TSL will become the assets, rights, liabilities and obligations of
TTKHC.
It may be noted that the the condom manufacturing subsidiary of TTK was earlier
a joint venture under the name TTK-LIG, manufacturing various brands including
Durex and Kohinoor. Following a litigation between the partners, TTK Group and
Reckitt Benckiser, the latter has taken over the production and sales of these
brands while TTK Group has launched its own condom brand - Skore, under TTKPD.
Explaining the rationale behind the merger, the company said that TTKHC has
close to six decade experience in manufacturing, sourcing, marketing and
distribution of pharmaceutical products as well as consumer products. It has
nationwide presence and the capability to tap global markets.
TTKPD is owner of the state-of-the-art condom manufacturing facilities in
Pallavaram and Virudunagar, in Tamil Nadu and in Puducherry and it has its own
condom technology consisting of product development, process development,
manufacturing processes, condom making machinery, among others. TSL is into
providing consultancy services.
"Hence it is considered that it will be beneficial to all stakeholders if
TTKPD/TSL become part of TTKHC. This can be achieved by merging TTKPD/TSL into
TTKHC," said the notice.
Commenting on the business, mangement synergies on the merger, the company also
said that the shareholders, post-merger, will have interest in a company which
will have a larger business base besides asset and resource base. The interest
of the creditors of either of the companies is better protected, it said.
As per the scheme, nine fully paid equity shares of Rs 10 each of TTKHC for
every two fully paid up equity shares of Rs 10 each held by the shareholders in
TTKPD. No allotment shall be made to the shareholders of TSL, since it is a
wholly owned subsidiary of TTKPD. With the Scheme becoming effective, both
TTKPD and TSL shall be dissolved without being wound up, it added. The Madras
High Court has issued an order giving nod to conduct the postal ballot and
e-voting.
CMT REPORT (Corruption, Money Laundering & Terrorism]
The Public Notice information has been collected from various sources
including but not limited to: The Courts,
1] INFORMATION ON
DESIGNATED PARTY
No exist designating subject or any of its beneficial owners,
controlling shareholders or senior officers as terrorist or terrorist
organization or whom notice had been received that all financial transactions
involving their assets have been blocked or convicted, found guilty or against
whom a judgement or order had been entered in a proceedings for violating
money-laundering, anti-corruption or bribery or international economic or
anti-terrorism sanction laws or whose assets were seized, blocked, frozen or
ordered forfeited for violation of money laundering or international anti-terrorism
laws.
2] Court Declaration :
No exist to suggest that subject is or was
the subject of any formal or informal allegations, prosecutions or other
official proceeding for making any prohibited payments or other improper
payments to government officials for engaging in prohibited transactions or
with designated parties.
3] Asset Declaration :
No records exist to suggest that the property or assets of the subject
are derived from criminal conduct or a prohibited transaction.
4] Record on Financial
Crime :
Charges or conviction
registered against subject: None
5] Records on Violation of
Anti-Corruption Laws :
Charges or
investigation registered against subject: None
6] Records on Int’l
Anti-Money Laundering Laws/Standards :
Charges or
investigation registered against subject: None
7] Criminal Records
No
available information exist that suggest that subject or any of its principals
have been formally charged or convicted by a competent governmental authority
for any financial crime or under any formal investigation by a competent
government authority for any violation of anti-corruption laws or international
anti-money laundering laws or standard.
8] Affiliation with
Government :
No record
exists to suggest that any director or indirect owners, controlling
shareholders, director, officer or employee of the company is a government
official or a family member or close business associate of a Government
official.
9] Compensation Package :
Our market
survey revealed that the amount of compensation sought by the subject is fair
and reasonable and comparable to compensation paid to others for similar
services.
10] Press Report :
No press reports / filings exists on
the subject.
CORPORATE GOVERNANCE
MIRA INFORM as part of its Due Diligence do provide comments on
Corporate Governance to identify management and governance. These factors often
have been predictive and in some cases have created vulnerabilities to credit
deterioration.
Our Governance Assessment focuses principally on the interactions
between a company’s management, its Board of Directors, Shareholders and other
financial stakeholders.
CONTRAVENTION
Subject is not known to have contravened any existing local laws,
regulations or policies that prohibit, restrict or otherwise affect the terms
and conditions that could be included in the agreement with the subject.
FOREIGN EXCHANGE RATES
|
Currency |
Unit
|
Indian Rupees |
|
US Dollar |
1 |
Rs.65.74 |
|
|
1 |
Rs.99.53 |
|
Euro |
1 |
Rs.73.79 |
INFORMATION DETAILS
|
Information
Gathered by : |
KMN |
|
|
|
|
Analysis Done by
: |
AMR |
|
|
|
|
Report Prepared
by : |
ART |
SCORE & RATING EXPLANATIONS
|
SCORE FACTORS |
RANGE |
POINTS |
|
HISTORY |
1~10 |
7 |
|
PAID-UP CAPITAL |
1~10 |
7 |
|
OPERATING SCALE |
1~10 |
8 |
|
FINANCIAL
CONDITION |
|
|
|
--BUSINESS SCALE |
1~10 |
7 |
|
--PROFITABILITY |
1~10 |
7 |
|
--LIQUIDITY |
1~10 |
7 |
|
--LEVERAGE |
1~10 |
7 |
|
--RESERVES |
1~10 |
7 |
|
--CREDIT LINES |
1~10 |
7 |
|
--MARGINS |
-5~5 |
- |
|
DEMERIT POINTS |
|
|
|
--BANK CHARGES |
YES/NO |
YES |
|
--LITIGATION |
YES/NO |
NO |
|
--OTHER ADVERSE INFORMATION |
YES/NO |
NO |
|
MERIT POINTS |
|
|
|
--SOLE DISTRIBUTORSHIP |
YES/NO |
NO |
|
--EXPORT ACTIVITIES |
YES/NO |
NO |
|
--AFFILIATION |
YES/NO |
YES |
|
--LISTED |
YES/NO |
YES |
|
--OTHER MERIT FACTORS |
YES/NO |
YES |
|
DEFAULTER |
|
|
|
--RBI |
YES/NO |
NO |
|
--EPF |
YES/NO |
NO |
|
TOTAL |
|
64 |
This score serves as a reference to assess SC’s
credit risk and to set the amount of credit to be extended. It is calculated
from a composite of weighted scores obtained from each of the major sections of
this report. The assessed factors and their relative weights (as indicated
through %) are as follows:
Financial
condition (40%) Ownership
background (20%) Payment
record (10%)
Credit history
(10%) Market trend (10%) Operational size
(10%)
RATING EXPLANATIONS
|
RATING |
STATUS |
PROPOSED CREDIT LINE |
|
|
>86 |
Aaa |
Possesses an extremely sound financial base with the strongest
capability for timely payment of interest and principal sums |
Unlimited |
|
71-85 |
Aa |
Possesses adequate working capital. No caution needed for credit transaction.
It has above average (strong) capability for payment of interest and
principal sums |
Large |
|
56-70 |
A |
Financial & operational base are regarded healthy. General
unfavourable factors will not cause fatal effect. Satisfactory capability for
payment of interest and principal sums |
Fairly Large |
|
41-55 |
Ba |
Overall operation is considered normal. Capable to meet normal
commitments. |
Satisfactory |
|
26-40 |
B |
Capability to overcome financial difficulties seems comparatively below
average. |
Small |
|
11-25 |
Ca |
Adverse factors are apparent. Repayment of interest and principal sums
in default or expected to be in default upon maturity |
Limited with
full security |
|
<10 |
C |
Absolute credit risk exists. Caution needed to be exercised |
Credit not
recommended |
|
-- |
NB |
New Business |
-- |
This report is issued at your request without any
risk and responsibility on the part of MIRA INFORM PRIVATE LIMITED (MIPL) or
its officials.