MIRA INFORM REPORT
|
Report No. : |
343402 |
|
Report Date : |
03.10.2015 |
IDENTIFICATION DETAILS
|
Name : |
TROUW NUTRITION INTERNATIONAL B.V. |
|
|
|
|
Registered Office : |
Nijverheidsweg 2 3881LA Putten |
|
|
|
|
Country : |
Netherlands |
|
|
|
|
Financials (as on) : |
31.12.2013 |
|
|
|
|
Date of Incorporation : |
05.09.2003 |
|
|
|
|
Com. Reg. No.: |
08118433 |
|
|
|
|
Legal Form : |
Private Company |
|
|
|
|
Line of Business : |
|
|
|
|
|
No. of Employees : |
4 |
RATING & COMMENTS
|
MIRA’s Rating : |
Ba |
|
RATING |
STATUS |
PROPOSED CREDIT LINE |
|
|
41-55 |
Ba |
Overall operation is considered normal. Capable to meet normal
commitments. |
Satisfactory |
|
Status : |
Satisfactory |
|
|
|
|
Payment Behaviour : |
No Complaints |
|
|
|
|
Litigation : |
Clear |
NOTES:
Any query related to this report can be made
on e-mail: infodept@mirainform.com
while quoting report number, name and date.
ECGC Country Risk Classification List – March 31, 2015
|
Country Name |
Previous Rating (31.12.2014) |
Current Rating (31.03.2015) |
|
Netherlands |
A1 |
A1 |
|
Risk Category |
ECGC
Classification |
|
Insignificant |
A1 |
|
Low |
A2 |
|
Moderate |
B1 |
|
High |
B2 |
|
Very High |
C1 |
|
Restricted |
C2 |
|
Off-credit |
D |
NETHERLANDS - ECONOMIC OVERVIEW
The Netherlands, the sixth-largest economy in the European Union, plays an important role as a European transportation hub, with a persistently high trade surplus, stable industrial relations, and moderate unemployment. Industry focuses on food processing, chemicals, petroleum refining, and electrical machinery. A highly mechanized agricultural sector employs only 2% of the labor force but provides large surpluses for food-processing and underpins the country’s status as the world’s second largest agricultural exporter. The Netherlands is part of the Eurozone, and as such, its monetary policy is controlled by the European Central Bank. The Dutch financial sector is highly concentrated, with four commercial banks possessing over 90% of banking assets. The sector suffered as a result of the global financial crisis and required billions of dollars of government support, but the European Banking Authority completed stringent reviews in 2014 and deemed Dutch banks to be well-capitalized. To address the 2009 and 2010 economic downturns, the government sought to stimulate the domestic economy by accelerating infrastructure programs, offering corporate tax breaks for employers to retain workers, and expanding export credits. The stimulus programs and bank bailouts, however, resulted in a government budget deficit of 5.3% of GDP in 2010 that contrasted sharply with a surplus of 0.7% in 2008. The government of Prime Minister Mark RUTTE has since implemented significant austerity measures to improve public finances and has instituted broad structural reforms in key policy areas, including the labor market, the housing sector, the energy market, and the pension system. As a result, the government budget deficit at the end of 2014 dropped to 1.8% of GDP. Following a protracted recession during which unemployment doubled to 7.4% and household consumption contracted for nearly three consecutive years, the year 2014 saw fragile GDP growth of 0.8 percent and a rise in most economic indicators. Drivers of growth included increased exports and business investments, as well as newly invigorated household consumption.
|
Source
: CIA |
Summary
Company name Trouw
Nutrition International B.V.
Operative address Nijverheidsweg 2
3881LA Putten
Netherlands
Legal form Private Company
Registration number KvK-nummer:
08118433
VAT-number 812439466
|
Year |
2013 |
Mutation |
2012 |
Mutation |
2011 |
|
Fixed assets |
1.013.100.000 |
-11,43 |
1.143.900.000 |
9, 53 |
1.044.400.000 |
|
Total receivables |
1.178.100.000 |
13, 19 |
1.040.800.000 |
|
1.031.400.000 |
|
Total equity |
942.200.000 |
-3, 07 |
972.000.000 |
11, 15 |
874.500.000 |
|
Short term liabilities |
1.222.200.000 |
-7, 04 |
1.314.800.000 |
5, 10 |
1.251.000.000 |
|
Net result |
150.801.000 |
-15,09 |
177.600.000 |
35,36 |
131.201.000 |
|
Working capital |
388.900.000 |
8,30 |
359.100.000 |
41,38 |
254.000.000 |
|
Quick ratio |
1,08 |
9, 09 |
0,99 |
2,06 |
0,97 |
Contact
information
Company name Trouw Nutrition
International B.V.
Trade names Trouw Nutrition
International B.V.
TNI Feed
Ingredients
Operative address Nijverheidsweg 2
3881LA Putten
Netherlands
Correspondence address Postbus 40
3880AA Putten
Netherlands
Telephone number 0341371611
Fax number 0341371786
Email address trouw.nutrition@nutreco.com
Website www.trouwnutrition.com
Registration
Registration number KvK-nummer:
08118433
Branch number 000015831043
VAT-number 812439466
Status Active
First registration company register 2003-09-11
Memorandum 2003-09-05
Establishment date 2003-09-05
Legal form Private Company
Issued placed capital EUR 18.000
Paid up share capital EUR 18.000
Activities
SBI 4639:
Non-specialized wholesale of food
Exporter No
Importer No
Goal Production, processing and trade in food products for humans and animals, chemical and other nutrients as well as the import and sale of raw materials, both for its own account and on behalf of third parties, to participate in, to manage and the remote lending services to other businesses as co- holding activities, all in the broadest sense of the word.
Relations
Shareholders Nutreco
International B.V.
Veerstraat 38
5831JN BOXMEER
Netherlands
Registration number: 16074327
Percentage: 100%
Branches Trouw
Nutrition International B.V.
Jellinghausstraat 24
5048AZ TILBURG
Netherlands
Registration number: 08118433
Companies on same address Trouw
Nutrition Nederland B.V.
Registration
number: 08013919
Liability statements Nutreco
N.V.
Veerstraat 38
5831JN BOXMEER
Netherlands
Registration number: 16074305
date of issue: 2004-06-03
Starting date:
2003-01-01
Management
Active management J.J.
Zandbergen Jurriën Jacobus
Netherlands
Competence: Fully authorized
Function: Manager
Starting date: 2013-04-01
Date of birth: 1971-01-18, Heemskerk, NL
Involved with the following companies:
Nutreco Nederland B.V.
Veerstraat 38
5831JN BOXMEER
Netherlands
Registration number: 16058721
Function: Proxy
M. Adorf Martijn
Netherlands
Competence: Fully authorized
Function: Manager
Starting date: 2014-06-01
Date of birth: 1968-06-16, Utrecht, NL
H.A.G. Keurentjes Henricus Augustinus
Gerardus
Netherlands
Competence: Limited authorization
Function: Proxy
Starting date: 2012-08-20
Date of birth: 1962-10-19, Noordoostpolder,
NL
Involved with the following companies:
Nutreco Nederland B.V.
Veerstraat 38
5831JN BOXMEER
Netherlands
Registration number: 16058721
Function: Proxy
E.J. Schutte Ernst Jan
Netherlands
Competence: Limited authorization
Function: Proxy
Starting date: 2013-11-01
Date of birth: 1963-01-07, Leiden, NL
Involved with the following companies:
Nutreco Nederland B.V.
Veerstraat 38
5831JN BOXMEER
Netherlands
Registration number: 16058721
Function: Proxy
A.J. Goodberry Andrew John
Netherlands
Competence: Limited authorization
Function: Proxy
Starting date: 2013-11-01
Date of birth: 1966-04-10, Walton on Thames,
GB
Involved with the following companies:
Nutreco Nederland B.V.
Veerstraat 38
5831JN BOXMEER
Netherlands
Registration number: 16058721
Function: Proxy
R.A. Zandberg Richard Alexander
Netherlands
Competence: Limited authorization
Function: Proxy
Starting date: 2013-11-01
Date of birth: 1969-03-23, Opsterland, NL
Involved with the following companies:
Nutreco Nederland B.V.
Veerstraat 38
5831JN BOXMEER
Netherlands
Registration number: 16058721
Function: Proxy
R.J.F.M. Kemme Roland Johannes Franciscus
Mar
Netherlands
Competence: Limited authorization
Function: Proxy
Starting date: 2013-11-01
Date of birth: 1963-07-09, Vleuten-De Meern,
NL
Involved with the following companies:
Nutreco Nederland B.V.
Veerstraat 38
5831JN BOXMEER
Netherlands
Registration number: 16058721
Function: Proxy
Employees
|
Total according to
the Chamber of Commerce |
4 |
|
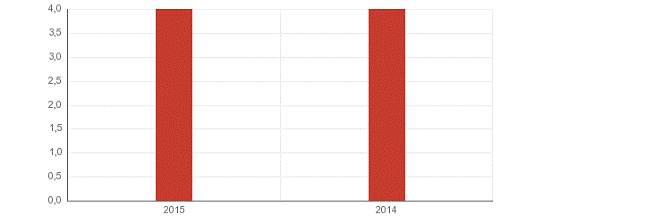
Year |
2015 |
2014 |
|
Total |
4 |
4 |
Payments
Description No Complaints
Key
figures
|
Year |
2013 |
2012 |
2011 |
2010 |
2009 |
|
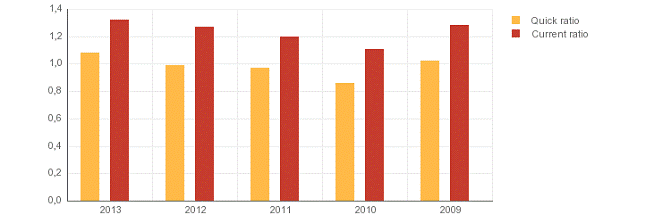
Quick
ratio |
1,08 |
0,99 |
0,97 |
0,86 |
1,02 |
|
Current
ratio |
1,32 |
1,27 |
1,20 |
1,11 |
1,28 |
|
|
|||||
|
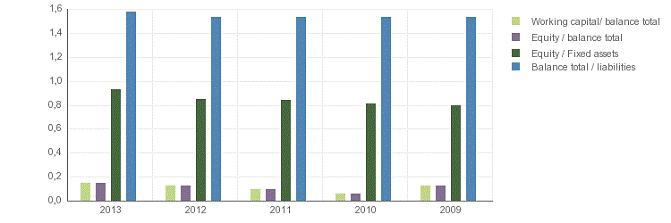
Working
capital/ balance total |
0,15 |
0,13 |
0,10 |
0,06 |
0,13 |
|
Equity
/ balance total |
0,36 |
0,34 |
0,34 |
0,34 |
0,34 |
|
Equity
/ Fixed assets |
0,93 |
0,85 |
0,84 |
0,81 |
0,80 |
|
Equity
/ liabilities |
0,57 |
0,53 |
0,52 |
0,52 |
0,53 |
|
Balance
total / liabilities |
1,58 |
1,53 |
1,53 |
1,53 |
1,53 |
|
|
|||||
|
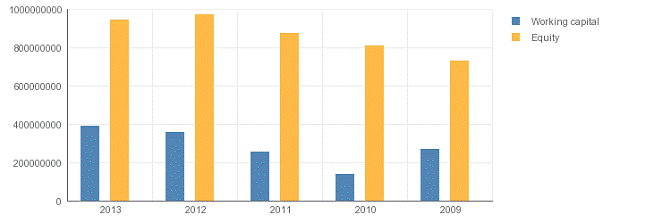
Working
capital |
388.900.000 |
359.100.000 |
254.000.000 |
137.700.000 |
267.800.000 |
|
Equity |
942.200.000 |
972.000.000 |
874.500.000 |
809.400.000 |
730.200.000 |
|
Mutation
equity |
-3,07 |
11,15 |
8,04 |
10,85 |
11,48 |
|
Mutation
short term liabilities |
-7,04 |
5,10 |
2,04 |
30,36 |
-7,99 |
|
|
|||||
|
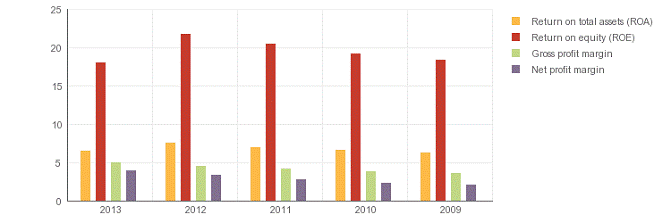
Return
on total assets (ROA) |
6,48 |
7,52 |
7,01 |
6,57 |
6,33 |
|
Return
on equity (ROE) |
18,04 |
21,79 |
20,43 |
19,19 |
18,43 |
|
Gross
profit margin |
5,05 |
4,49 |
4,15 |
3,82 |
3,65 |
|
Net
profit margin |
3,90 |
3,40 |
2,78 |
2,29 |
2,06 |
|
|
|||||
|
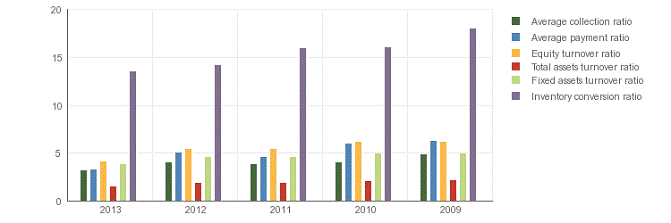
Average
collection ratio |
3,16 |
3,98 |
3,77 |
4,03 |
4,80 |
|
Average
payment ratio |
3,28 |
5,02 |
4,58 |
6,00 |
6,23 |
|
Equity
turnover ratio |
4,10 |
5,38 |
5,40 |
6,10 |
6,18 |
|
Total
assets turnover ratio |
1,47 |
1,86 |
1,85 |
2,09 |
2,12 |
|
Fixed
assets turnover ratio |
3,82 |
4,57 |
4,52 |
4,94 |
4,92 |
|
Inventory
conversion ratio |
13,52 |
14,13 |
15,91 |
15,99 |
17,97 |
|
|
|||||
|
Turnover |
3.867.100.000 |
5.229.100.000 |
4.721.100.000 |
4.939.700.000 |
4.511.700.000 |
|
Operating
result |
195.100.000 |
234.600.000 |
196.100.000 |
188.900.000 |
164.800.000 |
|
Net
result after taxes |
150.801.000 |
177.600.000 |
131.201.000 |
113.001.000 |
93.001.000 |
|
Year |
2013 |
2012 |
2011 |
2010 |
2009 |
|
Gross profit |
3.879.700.000 |
5.239.200.000 |
|
4.946.900.000 |
4.516.000.000 |
|
EBIT |
195.100.000 |
234.600.000 |
196.100.000 |
188.900.000 |
164.800.000 |
Summary
The 2013 financial result structure is a postive working captial of 388.900.000 euro, which is in agreement with 15 % of the total assets of the company.
The working capital has increased with 8.3 % compared to previous year. The ratio, with respect to the total assets of the company has however, increased.
The improvement between 2012 and 2013 has mainly been caused by an increase of the current assets.
The current ratio of the company in 2013 was 1.32. When the current ratio is below 1.5, the company may have problems meeting its short-term obligations.
The quick ratio in 2013 of the company was 1.08. A company with a Quick Ratio of more than 1 can currently pay back its current liabilities.
The 2012 financial result structure is a postive working captial of 359.100.000 euro, which is in agreement with 13 % of the total assets of the company.
The working capital has increased with 41.38 % compared to previous year. The ratio, with respect to the total assets of the company has however, increased.
The improvement between 2011 and 2012 has mainly been caused by an increase of the current assets.
The current ratio of the company in 2012 was 1.27. When the current ratio is below 1.5, the company may have problems meeting its short-term obligations.
The quick ratio in 2012 of the company was 0.99. A company with a Quick Ratio of less than 1 cannot currently pay back its current liabilities.
Financial
statement
Last annual account 2013
Remark annual
account The financial statements shown in the report
relate to the consolidated financial statements of the group.
Type of annual account Consolidated
Annual account Nutreco
N.V.
Veerstraat 38
5831JN BOXMEER
Netherlands
Registration number: 16074305
Balance
|
Year |
2013 |
2012 |
2011 |
2010 |
2009 |
|
End date |
2013-12-31 |
2012-12-31 |
2011-12-31 |
2010-12-31 |
2009-12-31 |
|
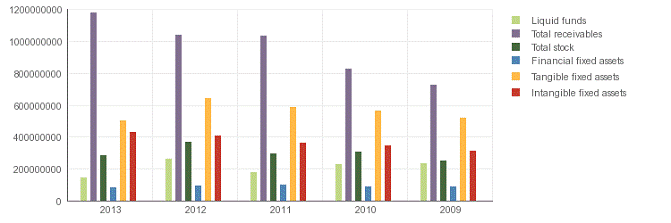
Intangible fixed
assets |
429.400.000 |
408.100.000 |
360.500.000 |
347.300.000 |
310.400.000 |
|
Tangible fixed
assets |
500.100.000 |
639.600.000 |
583.300.000 |
564.600.000 |
517.100.000 |
|
Financial fixed
assets |
83.600.000 |
96.200.000 |
100.600.000 |
88.100.000 |
89.500.000 |
|
Fixed assets |
1.013.100.000 |
1.143.900.000 |
1.044.400.000 |
1.000.000.000 |
917.000.000 |
|
|
|
|
|
|
|
|
Total stock |
286.100.000 |
370.100.000 |
296.800.000 |
309.000.000 |
251.000.000 |
|
Accounts receivable |
611.900.000 |
357.400.000 |
742.000.000 |
601.400.000 |
540.800.000 |
|
Other receivables |
566.200.000 |
683.400.000 |
289.400.000 |
222.500.000 |
183.900.000 |
|
Total
receivables |
1.178.100.000 |
1.040.800.000 |
1.031.400.000 |
823.900.000 |
724.700.000 |
|
Liquid funds |
146.900.000 |
263.000.000 |
176.800.000 |
230.800.000 |
232.600.000 |
|
Current assets |
1.611.100.000 |
1.673.900.000 |
1.505.000.000 |
1.363.700.000 |
1.208.300.000 |
|
Total assets |
2.624.200.000 |
2.817.800.000 |
2.549.400.000 |
2.363.700.000 |
2.125.300.000 |
|
Minority
interests |
19.600.000 |
9.100.000 |
8.700.000 |
10.200.000 |
10.500.000 |
|
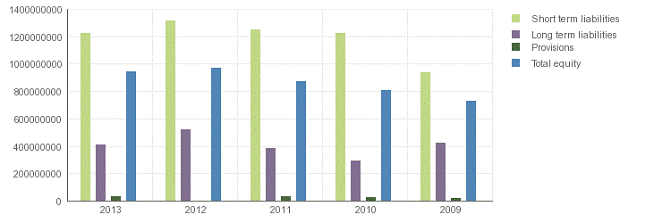
Total equity |
942.200.000 |
972.000.000 |
874.500.000 |
809.400.000 |
730.200.000 |
|
Provisions |
30.200.000 |
|
33.200.000 |
26.000.000 |
19.000.000 |
|
Long term interest yielding debt |
410.000.000 |
521.900.000 |
382.000.000 |
292.100.000 |
425.100.000 |
|
Long term
liabilities |
410.000.000 |
521.900.000 |
382.000.000 |
292.100.000 |
425.100.000 |
|
Accounts payable |
|
1.204.600.000 |
1.044.800.000 |
678.800.000 |
546.900.000 |
|
Other short term liabilities |
|
110.200.000 |
206.200.000 |
547.200.000 |
393.600.000 |
|
Short term
liabilities |
1.222.200.000 |
1.314.800.000 |
1.251.000.000 |
1.226.000.000 |
940.500.000 |
|
Total short and
long term liabilities |
1.662.400.000 |
1.836.700.000 |
1.666.200.000 |
1.544.100.000 |
1.384.600.000 |
|
Total
liabilities |
2.624.200.000 |
2.817.800.000 |
.549.400.000 |
22.363.700.000 |
2.125.300.000 |
Summary
The total assets of the company decreased with -6.87 % between 2012 and 2013.
This downturn is mainly retrievable in the fixed asset decrease of -11.43 %.
Assets reduction is explained by a Net Worth decrease of -3.07 %, and an indebtedness reduction of -9.49 %.
In 2013 the assets of the company were 38.61 % composed of fixed assets and 61.39 % by current assets. The assets are being financed by an equity of 35.9 %, and total debt of 64.1 %.
The total assets of the company increased with 10.53 % between 2011 and 2012.
The fixed asset growth of 9.53 % is lower than the total asset growth.
The asset growth has mainly been financed by a Net Worth increase of 11.15 %. Debt, however, grew with 10.23 %.
In 2012 the assets of the company were 40.6 % composed of fixed assets and 59.4 % by current assets. The assets are being financed by an equity of 34.49 %, and total debt of 65.51 %.
Profit
and loss
|
Year |
2013 |
2012 |
2011 |
2010 |
2009 |
|
Revenues |
3.887.700.000 |
5.248.100.000 |
4.724.500.000 |
4.979.200.000 |
4.552.400.000 |
|
Other
operating income |
8.000.000 |
8.900.000 |
3.400.000 |
32.300.000 |
36.400.000 |
|
Net
turnover |
3.867.100.000 |
5.229.100.000 |
4.721.100.000 |
4.939.700.000 |
4.511.700.000 |
|
|
|||||
|
Operating
expenses |
3.692.600.000 |
5.013.500.000 |
4.528.400.000 |
4.790.300.000 |
4.387.600.000 |
|
Result
in subsidiaries |
3.500.000 |
3.200.000 |
6.600.000 |
2.200.000 |
1.400.000 |
|
Operating
result |
195.100.000 |
234.600.000 |
196.100.000 |
188.900.000 |
164.800.000 |
|
|
|||||
|
Financial
income |
6.200.000 |
6.300.000 |
11.200.000 |
7.500.000 |
6.700.000 |
|
Financial
expenses |
34.800.000 |
32.300.000 |
35.200.000 |
43.300.000 |
38.300.000 |
|
Financial
result |
-28.600.000 |
-26.000.000 |
-24.000.000 |
-35.800.000 |
-31.600.000 |
|
Result
on ordinary operations before taxes |
170.000.000 |
211.800.000 |
178.700.000 |
155.300.000 |
134.600.000 |
|
|
|||||
|
Taxation
on the result of ordinary activities |
42.399.000 |
54.100.000 |
45.499.000 |
39.099.000 |
34.699.000 |
|
Result
of ordinary activities after taxes |
127.601.000 |
157.700.000 |
133.201.000 |
116.201.000 |
99.901.000 |
|
|
|||||
|
Extraordinary
income |
|
20.500.000 |
7.100.000 |
1.000.000 |
2.200.000 |
|
Extraordinary
expense |
100.000 |
600.000 |
9.100.000 |
4.200.000 |
9.100.000 |
|
Extraordinary
result after taxation |
-100.000 |
19.900.000 |
-2.000.000 |
-3.200.000 |
-6.900.000 |
|
Result
subsidiaries after taxes |
23.300.000 |
|
|
|
|
|
Net
result |
150.801.000 |
177.600.000 |
131.201.000 |
113.001.000 |
93.001.000 |
Summary
The turnover of the company decreased by -26.05 % between 2012 and 2013.
The operating result of the company declined with -16.84 % between 2012 and
2013. This evolution implies an decrease of the company's economic
profitability.
The result of these changes is a reduction of the company's Economic
Profitability of -13.83 % of the analysed period, being equal to 2012 % in the
year 2013.
This fall has contributed to a asset turnover decrease, whose index
evolved from -20.97 to a level of 1.47.
The Net Result of the company increased by -15.09 % between 2012 and
2013.
The company's Financial Profitability has been negatively affected by
the financial activities in comparison to the EBITs behaviour. The result of
these variations is a profitability reduction of -17.21 % of the analysed
period, being 18.04 % in the year 2013.
The company's financial profitability has been positively affected by
its financial structure.
The turnover of the company grew with 10.76 % between 2011 and 2012.
The operating result of the company grew with 19.63 % between 2011 and
2012. This evolution implies an increase of the company's economic
profitability.
The result of these changes is an increase of the company's Economic
Profitability of 7.28 %
of the analysed period, being equal to 2011 % in the year 2012.
Despite the growth the asset turnover remained the same at 1.86.
The Net Result of the company decreased by 35.36 % between 2011 and
2012.
The company's Financial Profitability has been negatively affected by
the financial activities in comparison to the EBITs behaviour. The result of
these variations is a profitability reduction of 6.66 % of the analysed period,
being 21.79 % in the year 2012.
The company's financial structure has slowed down its financial
profitability.
Analysis
Branch (SBI) Wholesale trade
(no motor vehicles and motorcycles) (SBI code 46)
Region Veluwe
Summary In the Netherlands
109662 of the companies are registered with the SBI code 46
In the region Veluwe 4703 of the companies
are registered with the SBI code 46
In the Netherlands 2387 of the bankrupcties
are published within this sector
In the region Veluwe 71 of the bankruptcies
are published within this sector
The risk of this specific sector in the Netherlands
is normal
The risk of this specific sector in the
region Veluwe is normal
Publications
Consent statements 07-04-2015: Voor
boekjaar 2014 is een instemmingsverklaring gedeponeerd.
15-04-2014: Voor boekjaar 2013 is een instemmingsverklaring
gedeponeerd.
24-04-2013: Voor boekjaar 2012 is een
instemmingsverklaring gedeponeerd.
12-04-2012: Voor boekjaar 2011 is een
instemmingsverklaring gedeponeerd.
Functions 27-06-2014: Per
01-06-2014 is bestuurder Martijn Adorf in functie getreden.
10-01-2014: Per 01-12-2013 is bestuurder
Harm de Wildt uit functie getreden.
03-12-2013: Per 01-11-2013 is gevolmachtigde
Roland Johannes Franciscus Maria Kemme
in functie getreden.
03-12-2013: Per 01-11-2013 is gevolmachtigde
Andrew John Goodberry in functie getreden.
03-12-2013: Per 01-11-2013 is gevolmachtigde
Richard Alexander Zandberg in functie
getreden.
03-12-2013: Per 01-11-2013 is gevolmachtigde
Ernst Jan Schutte in functie getreden.
03-12-2013: Per 01-11-2013 is gevolmachtigde
Lars Jan Willem van Arensbergen uit functie
getreden.
12-04-2013: Per 01-04-2013 is bestuurder
Jurriën Jacobus Zandbergen in functie getreden.
12-04-2013: Per 01-04-2013 is bestuurder
Jerry Antony Vergeer uit functie getreden.
12-04-2013: Per 01-04-2013 is bestuurder
16015739 Nutreco B.V. uit functie getreden.
27-08-2012: Per 20-08-2012 is gevolmachtigde
Lars Jan Willem van Arensbergen in functie
getreden.
27-08-2012: Per 20-08-2012 is gevolmachtigde
Henricus Augustinus Gerardus Keurentjes in
functie getreden.
05-04-2012: Per 01-03-2012 is gevolmachtigde
Roeland Johan Tjebbes uit functie getreden.
Company
structure
|
Relations |
17 |
|
Company |
Registration |
|
|
number |
|
Nutreco
N.V. (BOXMEER) |
16074305 |
|
| - - Nutreco
Chile Holding B.V. (BOXMEER) |
56544340 |
|
| - - Nutreco
Nederland B.V. (BOXMEER) |
16058721 |
|
| - - | -
- Selko B.V. (TILBURG) |
18025624 |
|
| - - | -
- Trouw Nutrition Nederland B.V. (PUTTEN) |
08013919 |
|
| - - | -
- Sloten B.V. (DEVENTER) |
38024128 |
|
| - - | -
- Trouw Nutrition Hifeed B.V. (BOXMEER) |
38021507 |
|
| - - Nutreco
International B.V. (BOXMEER) |
16074327 |
|
| - - | -
- Nutreco Asia Support B.V. (AMERSFOORT) |
32143371 |
|
| - - | -
- Nutritional Ingredients B.V. (AMERSFOORT) |
32136257 |
|
| - - | -
- Nutreco Investments B.V. (AMERSFOORT) |
53219716 |
|
| - - | -
- Trouw Nutrition International B.V. (Putten) |
08118433 |
|
| - - | -
- Trouw Nutrition Russia B.V. (BOXMEER) |
17190366 |
|
| - - | -
- Nutreco Brasil B.V. (BOXMEER) |
17263185 |
|
| - - | - - Nutreco Procurement B.V. (BOXMEER) |
17221186 |
|
| - - | - - Trouw International B.V. (BOXMEER) |
16054174 |
|
| - - | -
- Nutreco Africa B.V. (BOXMEER) |
61481173 |
FOREIGN EXCHANGE RATES
|
Currency |
Unit
|
Indian Rupees |
|
US Dollar |
1 |
Rs.65.55 |
|
UK Pound |
1 |
Rs.99.17 |
|
Euro |
1 |
Rs.73.08 |
INFORMATION DETAILS
|
Analysis Done by
: |
RAS |
|
|
|
|
Report Prepared
by : |
VNT |
RATING EXPLANATIONS
|
RATING |
STATUS |
PROPOSED CREDIT LINE |
|
|
|
>86 |
Aaa |
Possesses an extremely sound financial base with the strongest
capability for timely payment of interest and principal sums |
Unlimited |
|
|
71-85 |
Aa |
Possesses adequate working capital. No caution needed for credit transaction.
It has above average (strong) capability for payment of interest and
principal sums |
Large |
|
|
56-70 |
A |
Financial & operational base are regarded healthy. General
unfavourable factors will not cause fatal effect. Satisfactory capability for
payment of interest and principal sums |
Fairly Large |
|
|
41-55 |
Ba |
Overall operation is considered normal. Capable to meet normal
commitments. |
Satisfactory |
|
|
26-40 |
B |
Capability to overcome financial difficulties seems comparatively
below average. |
Small |
|
|
11-25 |
Ca |
Adverse factors are apparent. Repayment of interest and principal sums
in default or expected to be in default upon maturity |
Limited with full
security |
|
|
<10 |
C |
Absolute credit risk exists. Caution needed to be exercised |
Credit not
recommended |
|
|
-- |
NB |
New Business |
-- |
|
This score serves as a reference to assess SC’s
credit risk and to set the amount of credit to be extended. It is calculated
from a composite of weighted scores obtained from each of the major sections of
this report. The assessed factors and their relative weights (as indicated
through %) are as follows:
Financial
condition (40%) Ownership
background (20%) Payment
record (10%)
Credit history
(10%) Market trend (10%) Operational size
(10%)
This report is issued at your request without any
risk and responsibility on the part of MIRA INFORM PRIVATE LIMITED (MIPL) or
its officials.