M0IRA INFORM REPORT
|
Report No. : |
343787 |
|
Report Date : |
06.10.2015 |
IDENTIFICATION DETAILS
|
Name : |
SA ETERLA |
|
|
|
|
Registered Office : |
C/ Evarist Arnus, 31 -37 Bajos Local 2. - Barcelona - 08014 –
Barcelona |
|
|
|
|
Country : |
Spain |
|
|
|
|
Financials (as on) : |
27.12.2013 |
|
|
|
|
Date of Incorporation : |
01.04.1980 |
|
|
|
|
Legal Form : |
Public Company |
|
|
|
|
Line of Business : |
Manufacture of other organic basic chemicals |
|
|
|
|
No. of Employee : |
14 |
RATING & COMMENTS
|
MIRA’s Rating : |
B |
|
RATING |
STATUS |
PROPOSED CREDIT LINE |
|
|
26-40 |
B |
Capability to overcome financial difficulties seems comparatively
below average. |
Small |
|
Status : |
Moderate |
|
|
|
|
Payment Behaviour : |
Slow but correct |
|
|
|
|
Litigation : |
Clear |
NOTES :
Any query related to this report can be made
on e-mail : infodept@mirainform.com
while quoting report number, name and date.
ECGC Country Risk Classification List – March 31, 2015
|
Country Name |
Previous Rating (31.12.2014) |
Current Rating (31.03.2015) |
|
Spain |
A1 |
A1 |
|
Risk Category |
ECGC
Classification |
|
Insignificant |
A1 |
|
Low |
A2 |
|
Moderate |
B1 |
|
High |
B2 |
|
Very High |
C1 |
|
Restricted |
C2 |
|
Off-credit |
D |
SPAIN ECONOMIC OVERVIEW
After experiencing a prolonged recession in the wake of the globalFINANCIAL crisis that began in 2008, in 2014 Spain marked the first full year of positive economic growth in seven years, largely due to increased private consumption. At the onset of the global financial crisis Spain's GDP contracted by 3.7% in 2009, ending a 16-year growth trend, and continued contracting through most of 2013. In 2013 the government successfully shored up struggling banks - exposed to the collapse of Spain's depressed real estate and construction sectors - and in January 2014 completed an EU-funded restructuring and recapitalization program.
Until 2014, credit contraction in the private sector, fiscal austerity, and high unemployment weighed on domestic consumption andINVESTMENT. The unemployment rate rose from a low of about 8% in 2007 to more than 26% in 2013, but labor reforms prompted a modest reduction to 23.7% in 2014. High unemployment strained Spain's public finances, as spending on social benefits increased while tax revenues fell. Spain’s budget deficit peaked at 11.4% of GDP in 2010, but Spain gradually reduced the deficit to just under 7% of GDP in 2013-14, slightly above the 6.5% target negotiated between Spain and the EU. Public debt has increased substantially – from 60.1% of GDP in 2010 to more than 97% in 2014.
Exports were resilient throughout the economic downturn and helped to bring Spain's current account into surplus in 2013 for the first time since 1986, where it remained in 2014. Rising labor productivity and an internal devaluation resulting from moderating labor costs and lower inflation have helped to improve foreign investor interest in the economy and positive FDI flows have been restored.
The government's efforts to implement labor, pension, health, tax, and education reforms - aimed at supporting investor sentiment - have become overshadowed by political activity in 2015 in anticipation of the national parliamentary elections in November. Spain’s 2015 budget, published in September 2014, rolls back some recently imposed taxes in advance of the elections and leaves untouched the country’s value-added tax (VAT) regime, which continues to generate significantly lower revenue than the EU average. Spain’s borrowing costs are dramatically lower since their peak in mid-2012, and despite the recent uptic in economic activity, inflation has dropped sharply, from 1.5% in 2013 to nearly flat in 2014.
|
Source
: CIA |
EXECUTIVE
SUMMARY
|
|
|
|
|
|
Name: |
SA
ETERLA |
|
NIF
/ Fiscal code: |
A08586745 |
|
Status: |
ACTIVE |
|
Incorporation
Date: |
01/04/1980 |
|
Register Data |
Register
Section 8 Sheet 30313 |
|
Last Publication in BORME: |
17/12/2013
[Appointments] |
|
Last
Published Account Deposit: |
2013 |
|
Share
Capital: |
1.007.214,40 |
|
|
|
|
Localization: |
C/
EVARIST ARNUS, 31 -37 BAJOS LOCAL 2. - BARCELONA - 08014 - BARCELONA |
|
Telephone
- Fax - Email - Website: |
Telephone.
972 871 287 Email. fabrica@eterla.com Website. www.eterla.net |
|
Number
of Branches |
1 |
|
|
|
|
Activity: |
|
|
NACE: |
2014
- Manufacture of other organic basic chemicals |
|
Registered
Trademarks: |
|
|
Audited
/ Opinion: |
No |
|
Tenders
and Awards: |
|
|
Subsidies: |
0
for a total cost of 0 |
|
|
|
|
Payment
Behaviour: |
According
to the agreed terms |
|
Prospects: |
Consolidation |
|
Industry
situation: |
Maturity |
|
|
|
|
Defaults, Legal Claims and
Insolvency Proceedings : |
|
|
|
|
|
|
|
Number |
Amount
(€) |
Most
Recent Entry |
|
Insolvency
Proceedings, Bankruptcy and Suspension of Payments |
|
Unpublished |
--- |
--- |
|
Defaults
on debt with Financial Institutions and Large Companies |
|
None |
--- |
--- |
|
Judicial
Claims (Notices, Executive Proceedings, Attachments, Auctions, Bad Debt) |
|
4 |
0 |
--- |
|
Proceedings
heard by the Civil Court |
|
Unpublished |
0 |
--- |
|
Proceedings
heard by the Labour Court |
|
Unpublished |
0 |
--- |
|
|
|
Partners: |
|
|
|
JOSECARLOS
RUIZ LARRAMENDI LLOPART |
|
|
|
ANTONIO
QUINTANA ESTRUGA |
|
|
|
MARIAPIA
RUIZ DE LARRAMENDI LLOPART |
|
|
|
ESTEBAN
MENDEZ LLOBELL |
|
|
|
Shares: |
1 |
|
|
Other
Links: |
0 |
|
|
No.
of Active Corporate Bodies: |
SINGLE
ADMINISTRATOR 1 |
|
|
Ratios |
2013 |
2012 |
Change |
|
|
|
|
|
Guarantees: |
|
|
Properties
Registered: |
Company
NO, Administrator NO |
|
Financing
/ Guarantee Sources : |
Sources
NO, Guarantees NO |
|
|
|
|
|
|
|
INVESTIGATION
SUMMARY |
|
|
The
company was established in 1980. It is dedicated to the manufacture and
design of sales stand and other metallic structures. Its activities are
carried out both nationally and internationally. In the consulted references
there are no charges against it, taking into consideration the last figures
that appear in the Public trade Register, we consider that it is convenient
to revise periodically its progress. |
|
|
Interviewed
Person: |
|
|
Enquiry Details |
Identification
|
|
|
Social Denomination: |
SA ETERLA |
|
NIF / Fiscal code: |
A08586745 |
|
Corporate Status: |
ACTIVE |
|
Start of activity: |
1980 |
|
Registered Office: |
C/ EVARIST ARNUS, 31 -37 BAJOS LOCAL 2. |
|
Locality: |
BARCELONA |
|
Province: |
BARCELONA |
|
Postal Code: |
08014 |
|
Telephone: |
972 871 287 |
|
Fax: |
972 871 421 |
|
Website: |
|
|
Email: |
|
|
Interviewed Person: |
Srta.: Sandra Tena |
|
Branch Offices |
|
Address |
Postal Code |
City |
Province |
|
Sant Francesc, au-8 (Pol. Ind. Can Batlle) |
17400 |
Breda |
Girona |
|
|
|
|
NACE: |
2014 |
|
CNAE Obtaining Source: |
2014 |
|
Legal Form: |
THE MANUFACTURE AND COMMERCIALIZATION OF CONSTRUCTION ITEMS (AS A
WHOLE OR AS A PART) WITH MANY METALLIC RIBS. THE PURCHASE, SALE,
REHABILITATION AND NON-FINANCIAL RENT OF STORES. THE PURCHASE, SALE, REHABILITATION
AND NON-FINANCIAL RENT OF RESIDENTIAL BUILDINGS; THE PURCHASE, SALE,
CONDITIONING AND NON-FINANCIAL RENT OF RURAL ESTATE, WITH OR WITHOUT A
RESIDENTIAL BUILDING; |
|
Additional Information: |
Design and manufacture of sale stand and other metallic pieces. |
|
Additional Address: |
Registered office and offices in: C/ EVARIST ARNUS, 31 -37 BAJOS LOCAL
2. 08014 BARCELONA The working center is located in: C/ Sant Francesc, Nau-8
(Pol. Ind. Can Batlle) de Breda (Girona). |
|
Franchise: |
No |
|
Import / export: |
IMPORTS / EXPORTS |
|
Future Perspective: |
Consolidation |
|
Industry situation: |
Maturity |
|
Number
of Employees
|
|
|
|
|
|
|
Year |
No. of employees |
Established |
Incidentals |
|
|
|
2015 |
14 |
|
|
|
The data of employees is from the latest available financial statements
in axesor. Failing that, are estimates data calculated by statistical methods
|
Chronological
Summary
|
|||
|
|
|
|
|
|
|
Year |
Act |
|
|
|
1990 |
Appointments/ Re-elections (1) Cessations/ Resignations/ Reversals (1)
Increase of Capital (2) Statutory Modifications (1) |
|
|
|
1991 |
Accounts deposit (year 1989) |
|
|
|
1992 |
Adaptation to Law (1) Appointments/ Re-elections (1) Capital Reduction
(1) Cessations/ Resignations/ Reversals (1) |
|
|
|
1996 |
Appointments/ Re-elections (1) Cessations/ Resignations/ Reversals (1) |
|
|
|
1997 |
Accounts deposit (year 1993, 1994, 1995) |
|
|
|
1998 |
Capital Reduction (1) |
|
|
|
1999 |
Accounts deposit (year 1996, 1997) Capital Reduction (1) |
|
|
|
2000 |
Accounts deposit (year 1998, 1999) |
|
|
|
2001 |
Accounts deposit (year 2000) |
|
|
|
2002 |
Appointments/ Re-elections (1) Cessations/ Resignations/ Reversals (1) |
|
|
|
2003 |
Accounts deposit (year 2001, 2002) |
|
|
|
2004 |
Accounts deposit (year 2003) Change of Social Purpose (1) |
|
|
|
2005 |
Accounts deposit (year 2004) |
|
|
|
2006 |
Accounts deposit (year 2005) |
|
|
|
2007 |
Accounts deposit (year 2006) |
|
|
|
2008 |
Accounts deposit (year 2007) Appointments/ Re-elections (1) Capital
Reduction (2) Cessations/ Resignations/ Reversals (1) Change of Social
Purpose (1) Change of Social address (1) Statutory Modifications (1) |
|
|
|
2009 |
Accounts deposit (year 2008) |
|
|
|
2010 |
Accounts deposit (year 2009) |
|
|
|
2011 |
Accounts deposit (year 2010) |
|
|
|
2012 |
Accounts deposit (year 2011) |
|
|
|
2013 |
Accounts deposit (year 2012) Appointments/ Re-elections (1)
Cessations/ Resignations/ Reversals (1) |
|
|
|
2014 |
Accounts deposit (year 2013) |
|
|
Breakdown
of Owners' Equity
|
|
|
Registered Capital: |
1.007.214,40 |
|
Paid up capital: |
1.007.214,40 |
|
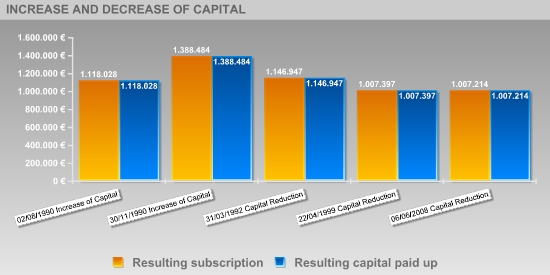
Updated
Evolution of the Subscribed and Paid-in Capital
|
|||||
|
|
|
|
|
|
|
|
|
|||||
|
|
|
|
|
|
|
|
Publishing Date |
Registration Type |
Capital Subscribed |
Paid up capital |
Underwritten result |
Disbursed Result |
|
02/08/1990 |
Increase of Capital |
1.081.967 |
1.081.967 |
1.118.028 |
1.118.028 |
|
30/11/1990 |
Increase of Capital |
270.455 |
270.455 |
1.388.484 |
1.388.484 |
|
31/03/1992 |
Capital Reduction |
-241.536 |
-241.536 |
1.146.947 |
1.146.947 |
|
22/04/1999 |
Capital Reduction |
-139.551 |
-139.551 |
1.007.397 |
1.007.397 |
|
06/06/2008 |
Capital Reduction |
-182 |
-182 |
1.007.214 |
1.007.214 |
|
Active
Social Bodies
|
|
|
|
|
|
Post published |
Social Body's Name |
Appointment Date |
Other Positions in this Company |
|
SINGLE ADMINISTRATOR |
RUIZ DE LARRAMENDI LLOPART JOSE CARLOS |
10/12/2013 |
12 |
|
PROXY |
RUIZ DE LARRAMENDI LLOPART JOSE CARLOS |
12/11/1996 |
12 |
|
Historical
Social Bodies
|
|
|
|
|
|
Social Body's Name |
Post published |
End Date |
Other Positions in this Company |
|
DE LLANZA MOJA ISABEL |
MEMBER OF THE BOARD |
02/08/1990 |
2 |
|
|
SECRETARY |
02/08/1990 |
|
|
LLOPART SOLER MONTSERRAT |
MEMBER OF THE BOARD |
31/03/1992 |
4 |
|
|
MEMBER OF THE BOARD |
12/11/1996 |
|
|
|
PRESIDENT |
31/03/1992 |
|
|
|
PRESIDENT |
12/11/1996 |
|
|
MENDEZ LLOBELL ESTEBAN |
SECRETARY |
28/06/2002 |
4 |
|
|
SECRETARY |
06/06/2008 |
|
|
|
MEMBER OF THE BOARD |
06/06/2008 |
|
|
|
MEMBER OF THE BOARD |
28/06/2002 |
|
|
QUINTANA ESTRUGA ANTONIO |
MEMBER OF THE BOARD |
02/08/1990 |
2 |
|
|
MEMBER OF THE BOARD |
31/03/1992 |
|
|
RUIZ DE LARRAMENDI JOSE CARLOS |
MEMBER OF THE BOARD |
02/08/1990 |
2 |
|
|
PRESIDENT |
02/08/1990 |
|
|
RUIZ DE LARRAMENDI LLOPART JOSE CARLOS |
PROXY |
12/11/1996 |
12 |
|
|
SECRETARY |
12/11/1996 |
|
|
|
MEMBER OF THE BOARD |
12/11/1996 |
|
|
|
MEMBER OF THE BOARD |
28/06/2002 |
|
|
|
PRESIDENT |
28/06/2002 |
|
|
|
PRESIDENT |
06/06/2008 |
|
|
|
MEMBER OF THE BOARD |
06/06/2008 |
|
|
|
SINGLE ADMINISTRATOR |
10/12/2013 |
|
|
|
MEMBER OF THE BOARD |
31/03/1992 |
|
|
|
SECRETARY |
31/03/1992 |
|
|
RUIZ DE LARRAMENDI LLOPART MARIA PIA |
MEMBER OF THE BOARD |
28/06/2002 |
4 |
|
|
MEMBER OF THE BOARD |
06/06/2008 |
|
|
|
MEMBER OF THE BOARD |
31/03/1992 |
|
|
|
MEMBER OF THE BOARD |
12/11/1996 |
|
|
Executive
board
|
||
|
|
|
|
|
Post |
NIF |
Name |
|
ADMINISTRATOR |
|
JOSE CARLOS RUIZ LARRAMENDI LLOPART |
|
MANAGING DIRECTOR |
|
JOSE CARLOS RUIZ LARRAMENDI LLOPART |
Defaults,
Legal Claims and Insolvency Proceedings
|
Section enabling assessment of the degree of compliance of the company
queried with its payment obligations. It provides information on the existence
and nature of all stages of Insolvency and Legal Proceedings published with
reference to the Company in the country's various Official Bulletins and
national newspapers, as well Defaults Registered in the main national credit
bureaus (ASNEF Industrial and RAI ).
> Summary
Chronological summary
|
|
|
Number of Publications |
Amount (_) |
Start date |
End date |
|
Insolvency Proceedings, Bankruptcy and Suspension of Payments |
|
Unpublished |
--- |
--- |
--- |
|
Request/Declaration |
|
0 |
--- |
date |
|
|
Proceedings |
|
--- |
--- |
|
--- |
|
Resolution |
|
--- |
--- |
|
--- |
|
Defaults on debt with Financial Institutions and Large Companies |
Bank and Commercial Delinquency |
None |
0 |
|
|
|
Status: Friendly |
|
--- |
|
|
|
|
Status: Pre-Litigation |
|
--- |
|
|
|
|
Status: Litigation |
|
--- |
|
|
|
|
Status: Non-performing |
|
--- |
|
|
|
|
Status: insolvency proceedings, bankruptcy and suspension of payments |
|
--- |
|
|
|
|
Other status |
|
--- |
|
|
|
|
Legal and Administrative Proceedings |
|
4 |
--- |
04/01/2010 |
30/09/2014 |
|
Notices of defaults and enforcement |
|
4 |
--- |
|
--- |
|
Seizures |
|
--- |
--- |
|
--- |
|
Auctions |
|
--- |
--- |
|
--- |
|
Declarations of insolvency and bad debt |
|
--- |
--- |
|
--- |
|
Proceedings heard by the Civil Court |
|
Unpublished |
--- |
|
|
|
Proceedings heard by the Labour Court |
|
Unpublished |
--- |
|
|
> Basis for
scoring
|
Positive Factors |
Adverse Factors |
|
No irregular payment performance has been detected based on
information obtained from credit bureaus. The current debt represents a 9.60of the financial structure. In
principle, a decrease in this ratio would indicate an improvement in the
short-term financial situation. It presents a limited operating margins. Net margin shows positive,
although adjusted, company costs management as income exceed operating
expenses. Positive Working CapitalThe Company's Working Capital quality is
significant, i.e. much of the Company financing comes from its equity. A
structure is considered optimal if its liquidity level is slightly above its
debt volume as a result of low idleness levels of its financial resources
involved. Debts assumed by the company based on the volume of its own resources
have decreased in the previous financial year. |
Presents legal proceedings. Debts resulting from non-payment to Public
Administrations or from lawsuits filed by individuals before the Courts of
the different jurisdictions have been published in the Official Gazettes. It does not have any financial profitability.. SA ETERLAIt does not
obtain any financial return as a consequence of an investment in its own
resources which, a priori, might deteriorate its financial and economic
situation. Limited capacity to generate cash and cash equivalents through
operating income. In principle, a decrease in this ratio would indicate a worsening
in the Company´s financial situation. No Company's subsidiaries or branches are known. Possible difficulty accessing financing. Uncertainties about economic
recovery will hinder access to credit for new projects or for obtaining the
liquidity necessary for short-term needs. |
LEGAL
CLAIMS
|
|
Summary of Judicial Claims |
|
|
|
|
|
|
|
|
||
|
|
|
No se han publicado |
|
|
|
|
No se han publicado |
|
|
|
|
||
|
|
|
No se han publicado |
|
|
|
|
2 Legal Claims for a total cost of 8.228,22 E |
|
|
|
|
No se han publicado |
|
|
|
|
2 Legal Claims for a total cost of 0,00 E |
|
|
|
|
||
|
|
|
No se han publicado |
|
|
|
|
No se han publicado |
|
|
|
|
||
|
|
|
No se han publicado |
|
|
Incidences Detailed |
|
Incidences with the Social Security |
|
|
|
Last Published Stage: |
EXECUTION NOTIFICATION |
|
Record Number: |
03172009017238113 |
|
Amount of the incidence: |
8.155,01 E |
|
Requested by: |
SEGURIDAD SOCIAL |
|
Published domicile: |
PG CAL BATLLE C/ SAN; BREDA C.P.:17400 (GIRONA) |
|
Source: |
B.O.P. GIRONA Nº12, 2010 PAGINA 18 |
|
|
|
Last Published Stage: |
EXECUTION NOTIFICATION |
|
Record Number: |
03172009017238214 |
|
Amount of the incidence: |
73,21 E |
|
Requested by: |
SEGURIDAD SOCIAL |
|
Published domicile: |
PG CAL BATLLE C/ SAN; BREDA C.P.:17400 (GIRONA) |
|
Source: |
B.O.P. GIRONA Nº12, 2010 PAGINA 18 |
|
Incidences with the Local Administration |
|
|
|
Last Published Stage: |
EXECUTION NOTIFICATION |
|
Record Number: |
14272039154 |
|
Amount of the incidence: |
0,00 E |
|
Requested by: |
ADMINISTRACION LOCAL |
|
Published domicile: |
(DESCONOCIDA) |
|
Source: |
BOLETIN OFICIAL DEL AYUNTAMIENTO DE MADRID Nº7266, 2014 PAGINA 234 |
|
|
|
Last Published Stage: |
EXECUTION NOTIFICATION |
|
Record Number: |
12058029831 |
|
Amount of the incidence: |
0,00 E |
|
Requested by: |
ADMINISTRACION LOCAL |
|
Published domicile: |
(DESCONOCIDA) |
|
Source: |
BOLETIN OFICIAL DEL AYUNTAMIENTO DE MADRID Nº6638, 2012 PAGINA 41 |
|
GUARANTEES |
|
REFERENCES |
|
|
|
|
|
|
Suppliers |
|
|
|
Name |
NIF |
Telephone |
|
|
|
BREDA STIL |
|
|
|
|
Link
List
|
|
PARTICIPATES IN : |
1 Entities |
|
SHAREHOLDERS : |
4 Entities |
> Shareholders
|
Relationship |
Entity |
Province |
Shareholding stake |
|
SHAREHOLDERS |
JOSECARLOS RUIZ LARRAMENDI LLOPART |
|
|
|
|
ANTONIO QUINTANA ESTRUGA |
|
|
|
|
MARIAPIA RUIZ DE LARRAMENDI LLOPART |
|
|
|
|
ESTEBAN MENDEZ LLOBELL |
|
|
|
PARTICIPATES IN |
WHISTESTONE SL |
BARCELONA |
6.13 |
|
Turnover
|
|
|
Total Sales 2013 |
1.174.057,53 |
The sales data is from the latest available financial statements in
axesor. Failing that, are estimates data calculated by statistical methods.
|
Estimated
Balance
|
|
The last figures that appear in the Public Trade Register date back to
(31-12-2013). We can observe that in spite of the fact that the financial
year ended with a slight loss of -620 Euros, the company has accumulated
losses of -650.284 Euros from the previous exercise. In light of the above,
and due to not having the accounts of the last exercise, we do not know to
which extent this situation could vary, and as a consequence, we cannot
include figures in this section of the report, though they are usually
habitual in these kinds of reports. |
|
Financial
Accounts and Balance Sheets
|
Financial Years Presented
|
Ejercicio |
Tipo
de Cuentas Anuales |
Fecha
Presentacion |
|
2013 |
Normales |
August
2014 |
|
2012 |
Normales |
July
2013 |
|
2011 |
Normales |
August
2012 |
|
2010 |
Normales |
August
2011 |
|
2009 |
Normales |
October
2010 |
|
2008 |
Normales |
October
2009 |
|
2007 |
Normales |
August
2008 |
|
2006 |
Normales |
August
2007 |
|
2005 |
Normales |
July
2006 |
|
2004 |
Normales |
September
2005 |
|
2003 |
Normales |
July
2004 |
|
2002 |
Normales |
August
2003 |
|
2001 |
Normales |
August
2003 |
|
2000 |
Normales |
August
2001 |
|
1999 |
Normales |
August
2000 |
|
1998 |
Normales |
May
2000 |
|
1997 |
Normales |
January
1999 |
|
1996 |
Normales |
January
1999 |
|
1995 |
Normales |
September
1997 |
|
1994 |
Normales |
September
1997 |
|
1993 |
Normales |
September
1997 |
|
1989 |
Normales |
December
1990 |
The data in the report regarding the last Company Accounts submitted by the company is taken from the TRADE REGISTER serving the region in which the company's address is located 27/12/2013
> Balance en formato Abreviado de acuerdo al Nuevo Plan General Contable 2007
Information corresponding to the
fiscal year 2013 2012 2011 2010 2009 is taken from
information submitted to the TRADE REGISTER. Data corresponding to fiscal years
before 2013 2012 2011 2010 2009 has been compiled
based on the equivalence criteria stipulated in Act JUS/206/2009. To view
details on the methodology.
|
|
ORIGINAL |
ORIGINAL |
ORIGINAL |
ORIGINAL |
ORIGINAL |
|
|
Assets |
2013 |
2012 |
2011 |
2010 |
2009 |
|
|
A)
NON-CURRENT ASSETS: 11000 |
1.409.722,00 |
1.441.810,00 |
1.535.800,00 |
1.631.490,00 |
1.235.961,00 |
|
|
I. Intangible fixed assets : 11100 |
1.453,00 |
1.453,00 |
1.453,00 |
1.453,00 |
1.453,00 |
|
|
II. Tangible fixed assets : 11200 |
1.171.162,00 |
1.206.134,00 |
1.296.196,00 |
1.388.901,00 |
991.741,00 |
|
|
III. Real estate investment: 11300 |
0,00 |
0,00 |
0,00 |
0,00 |
0,00 |
|
|
IV. Long-term investments in Group companies and associates :
11400 |
82.715,00 |
82.715,00 |
82.715,00 |
82.715,00 |
82.715,00 |
|
|
V. Long-term financial investments: 11500 |
8.843,00 |
6.114,00 |
999,00 |
1.003,00 |
4.052,00 |
|
|
VI. Assets for deferred tax : 11600 |
145.550,00 |
145.395,00 |
154.438,00 |
157.418,00 |
156.000,00 |
|
|
VII. Non-current trade debtors : 11700 |
0,00 |
0,00 |
0,00 |
0,00 |
0,00 |
|
|
B)
CURRENT ASSETS: 12000 |
455.797,00 |
904.861,00 |
792.251,00 |
1.832.409,00 |
1.713.619,00 |
|
|
I. Non-current assets held for sale : 12100 |
0,00 |
0,00 |
0,00 |
0,00 |
0,00 |
|
|
II. Stocks: 12200 |
525.388,00 |
459.862,00 |
459.862,00 |
98.670,00 |
433.020,00 |
|
|
III. Trade debtors and others receivable accounts: 12300 |
522.700,00 |
420.660,00 |
332.389,00 |
1.611.063,00 |
1.269.742,00 |
|
|
1.- Customers for sales and provisions of
services : 12380 |
522.700,00 |
415.168,00 |
318.947,00 |
1.607.495,00 |
1.256.551,00 |
|
|
a) Long-term
receivables from sales and services supplied : 12381 |
0,00 |
0,00 |
0,00 |
0,00 |
0,00 |
|
|
b) Customers for
sales and provisions of services : 12382 |
522.700,00 |
415.168,00 |
318.947,00 |
1.607.495,00 |
1.256.551,00 |
|
|
2.- Called up share capital : 12370 |
0,00 |
0,00 |
0,00 |
0,00 |
0,00 |
|
|
3.- Other accounts receivable :
12390 |
0,00 |
5.492,00 |
13.441,00 |
3.568,00 |
13.191,00 |
|
|
IV. Short-term investments in Group companies and associates:
12400 |
0,00 |
0,00 |
0,00 |
0,00 |
0,00 |
|
|
V. Short-term financial investments : 12500 |
-632.658,00 |
0,00 |
0,00 |
135.494,00 |
10.857,00 |
|
|
VI. Short-term accruals: 12600 |
0,00 |
4.052,00 |
0,00 |
0,00 |
0,00 |
|
|
VII. Cash and other equivalent liquid assets : 12700 |
40.368,00 |
20.287,00 |
0,00 |
-12.818,00 |
0,00 |
|
|
TOTAL
ASSETS (A + B) : 10000 |
1.865.519,00 |
2.346.671,00 |
2.328.050,00 |
3.463.899,00 |
2.949.580,00 |
|
|
|
ORIGINAL |
ORIGINAL |
ORIGINAL |
ORIGINAL |
ORIGINAL |
|
|
Liabilities
and Net Worth |
2013 |
2012 |
2011 |
2010 |
2009 |
|
|
A)
NET WORTH: 20000 |
1.573.840,00 |
1.574.461,00 |
1.623.987,00 |
1.621.047,00 |
1.635.523,00 |
|
|
A1) Shareholders' equity : 21000 |
1.573.840,00 |
1.574.461,00 |
1.623.987,00 |
1.621.047,00 |
1.635.523,00 |
|
|
I. Capital: 21100 |
1.007.397,00 |
1.007.397,00 |
1.007.397,00 |
1.007.397,00 |
1.007.397,00 |
|
|
1.- Registered
capital: 21110 |
1.007.397,00 |
1.007.397,00 |
1.007.397,00 |
1.007.397,00 |
1.007.397,00 |
|
|
2.- (Uncalled
capital) : 21120 |
0,00 |
0,00 |
0,00 |
0,00 |
0,00 |
|
|
II. Share premium: 21200 |
0,00 |
0,00 |
0,00 |
0,00 |
0,00 |
|
|
III. Reserves: 21300 |
1.217.348,00 |
1.217.348,00 |
1.217.497,00 |
1.217.497,00 |
1.217.497,00 |
|
|
IV. (Common stock equity): 21400 |
0,00 |
0,00 |
0,00 |
0,00 |
0,00 |
|
|
V. Profit or loss brought forward:
21500 |
-650.284,00 |
-600.384,00 |
-602.402,00 |
-593.423,00 |
-533.012,00 |
|
|
VI. Other shareholders'
contributions: 21600 |
0,00 |
0,00 |
0,00 |
0,00 |
0,00 |
|
|
VII. Result of the period: 21700 |
-620,00 |
-49.900,00 |
1.495,00 |
-10.424,00 |
-56.360,00 |
|
|
VIII. (Interim dividend): 21800 |
0,00 |
0,00 |
0,00 |
0,00 |
0,00 |
|
|
IX. Other net worth instruments:
21900 |
0,00 |
0,00 |
0,00 |
0,00 |
0,00 |
|
|
A-2) Adjustments due to changes in value: 22000 |
0,00 |
0,00 |
0,00 |
0,00 |
0,00 |
|
|
A-3) Received subsidies, donations and legacies: 23000 |
0,00 |
0,00 |
0,00 |
0,00 |
0,00 |
|
|
B)
NON-CURRENT LIABILITIES: 31000 |
112.599,00 |
126.270,00 |
125.520,00 |
134.562,00 |
152.876,00 |
|
|
I. Long-term provisions: 31100 |
0,00 |
0,00 |
0,00 |
0,00 |
0,00 |
|
|
II. Long-term creditors : 31200 |
-1.908,00 |
11.764,00 |
21.087,00 |
30.130,00 |
38.369,00 |
|
|
1.- Amounts owed to credit institutions:
31220 |
0,00 |
0,00 |
0,00 |
0,00 |
0,00 |
|
|
2.- Creditors from financial leasing :
31230 |
0,00 |
0,00 |
0,00 |
0,00 |
0,00 |
|
|
3.- Other long-term creditors :
31290 |
-1.908,00 |
11.764,00 |
21.087,00 |
30.130,00 |
38.369,00 |
|
|
III. Long-term debts with Group companies and associates:
31300 |
0,00 |
0,00 |
0,00 |
0,00 |
0,00 |
|
|
IV. Liabilities for deferred tax: 31400 |
114.507,00 |
114.507,00 |
104.433,00 |
104.433,00 |
114.507,00 |
|
|
V. Long-term accruals: 31500 |
0,00 |
0,00 |
0,00 |
0,00 |
0,00 |
|
|
VI. Non-current trade creditors : 31600 |
0,00 |
0,00 |
0,00 |
0,00 |
0,00 |
|
|
VII. Special long-term debts : 31700 |
0,00 |
0,00 |
0,00 |
0,00 |
0,00 |
|
|
C)
CURRENT LIABILITIES : 32000 |
179.080,00 |
645.940,00 |
578.543,00 |
1.708.289,00 |
1.161.181,00 |
|
|
I. Liabilities linked to non-current assets held for sale :
32100 |
0,00 |
0,00 |
0,00 |
0,00 |
0,00 |
|
|
II. Short-term provisions: 32200 |
0,00 |
0,00 |
0,00 |
0,00 |
0,00 |
|
|
III. Short-term creditors : 32300 |
23.009,00 |
515.638,00 |
380.344,00 |
564.134,00 |
498.204,00 |
|
|
1.- Amounts owed to credit institutions:
32320 |
31.772,00 |
480.406,00 |
0,00 |
0,00 |
0,00 |
|
|
2.- Creditors from financial leasing :
32330 |
0,00 |
0,00 |
0,00 |
0,00 |
0,00 |
|
|
3.- Other short-term creditors :
32390 |
-8.763,00 |
35.232,00 |
380.344,00 |
564.134,00 |
498.204,00 |
|
|
IV. Short-term debts with Group companies and associates:
32400 |
0,00 |
0,00 |
0,00 |
0,00 |
0,00 |
|
|
V. Trade creditors and other accounts payable: 32500 |
158.101,00 |
130.302,00 |
195.953,00 |
1.144.156,00 |
656.679,00 |
|
|
1.- Suppliers: 32580 |
100.364,00 |
114.197,00 |
110.796,00 |
1.048.476,00 |
532.243,00 |
|
|
a) Long-term debts :
32581 |
0,00 |
0,00 |
0,00 |
0,00 |
0,00 |
|
|
b) Short-term debts :
32582 |
100.364,00 |
114.197,00 |
110.796,00 |
1.048.476,00 |
532.243,00 |
|
|
2.- Other creditors : 32590 |
57.736,00 |
16.105,00 |
85.158,00 |
95.679,00 |
124.436,00 |
|
|
VI. Short-term accruals: 32600 |
-2.030,00 |
0,00 |
2.246,00 |
0,00 |
6.298,00 |
|
|
VII. Special short-term debts : 32700 |
0,00 |
0,00 |
0,00 |
0,00 |
0,00 |
|
|
TOTAL
NET WORTH AND LIABILITIES (A + B + C) : 30000 |
1.865.519,00 |
2.346.671,00 |
2.328.050,00 |
3.463.899,00 |
2.949.580,00 |
|
|
|
ORIGINAL |
ORIGINAL |
ORIGINAL |
ORIGINAL |
ORIGINAL |
|
|
Profit
and Loss |
2013 |
2012 |
2011 |
2010 |
2009 |
|
|
1. Net turnover: 40100 |
1.174.058,00 |
987.355,00 |
0,00 |
1.110.873,00 |
903.433,00 |
|
|
2. Changes in stocks of finished goods and work in progress:
40200 |
65.526,00 |
0,00 |
368.392,00 |
11.200,00 |
57.460,00 |
|
|
3. Works carried out by the company for its assets: 40300 |
0,00 |
0,00 |
0,00 |
0,00 |
0,00 |
|
|
4. Supplies : 40400 |
-648.508,00 |
-668.599,00 |
-367.167,00 |
-940.522,00 |
-600.779,00 |
|
|
5. Other operating income: 40500 |
15,00 |
921,00 |
2.736,00 |
40,00 |
0,00 |
|
|
6. Personnel costs: 40600 |
-381.828,00 |
-326.672,00 |
-276.777,00 |
-340.038,00 |
-287.541,00 |
|
|
7. Other operating costs: 40700 |
-152.057,00 |
-146.723,00 |
-104.142,00 |
-122.854,00 |
-62.350,00 |
|
|
8. Amortisation of fixed assets: 40800 |
-38.768,00 |
-90.061,00 |
-92.705,00 |
-102.640,00 |
-99.835,00 |
|
|
9. Allocation of subsidies of non-financial fixed assets and
other: 40900 |
0,00 |
0,00 |
0,00 |
0,00 |
0,00 |
|
|
10. Excess provisions : 41000 |
0,00 |
0,00 |
0,00 |
0,00 |
0,00 |
|
|
11. Impairment and result of transfers of fixed assets:
41100 |
0,00 |
0,00 |
498.000,00 |
414.000,00 |
0,00 |
|
|
12. Negative difference in combined businesses: 41200 |
0,00 |
0,00 |
0,00 |
0,00 |
0,00 |
|
|
13. Other results : 41300 |
0,00 |
193.567,00 |
0,00 |
0,00 |
14.450,00 |
|
|
A)
OPERATING INCOME (1 + 2 + 3 + 4 + 5 + 6 + 7 + 8 + 9 + 10 + 11 + 12 + 13) :
49100 |
18.437,00 |
-50.212,00 |
28.336,00 |
30.059,00 |
-75.162,00 |
|
|
14. Financial income : 41400 |
386,00 |
110,00 |
0,00 |
18,00 |
16,00 |
|
|
a) Allocation of financial subsidies,
donations and legacies: 41430 |
0,00 |
0,00 |
0,00 |
0,00 |
0,00 |
|
|
b) Other financial income: 41490 |
386,00 |
110,00 |
0,00 |
18,00 |
16,00 |
|
|
15. Financial expenditure: 41500 |
-19.599,00 |
-12.272,00 |
-26.468,00 |
-43.107,00 |
0,00 |
|
|
16. Changes in fair value of financial instruments :
41600 |
0,00 |
0,00 |
0,00 |
0,00 |
0,00 |
|
|
17. Exchange rate differences : 41700 |
0,00 |
0,00 |
0,00 |
0,00 |
0,00 |
|
|
18. Impairment and result for transfers of financial
instruments: 41800 |
0,00 |
0,00 |
0,00 |
0,00 |
0,00 |
|
|
19. Other financial income and expenditure: 42100 |
0,00 |
0,00 |
0,00 |
0,00 |
0,00 |
|
|
a) Incorporation of financial expenditure
to assets: 42110 |
0,00 |
0,00 |
0,00 |
0,00 |
0,00 |
|
|
b) Financial income from arrangement with
creditors: 42120 |
0,00 |
0,00 |
0,00 |
0,00 |
0,00 |
|
|
c) Other income and expenditure:
42130 |
0,00 |
0,00 |
0,00 |
0,00 |
0,00 |
|
|
B)
FINANCIAL REVENUE (14 + 15 + 16 + 17 + 18 + 19) : 49200 |
-19.213,00 |
-12.162,00 |
-26.468,00 |
-43.090,00 |
16,00 |
|
|
C)
NET RESULT BEFORE TAXES (A + B) : 49300 |
-776,00 |
-62.375,00 |
1.868,00 |
-13.031,00 |
-75.146,00 |
|
|
20. Income taxes: 41900 |
155,00 |
12.475,00 |
-374,00 |
2.606,00 |
18.787,00 |
|
|
D)
RESULT OF THE PERIOD (C + 20) : 49500 |
-620,00 |
-49.900,00 |
1.495,00 |
-10.424,00 |
-56.360,00 |
|
> Normal Balance Sheet under the rules of the 1990 General Accounting Plan (repealed since 1st January of 2008)
Information corresponding to the fiscal year 2013 2012 2011 2010 2009 has been compiled based on the equivalence criteria stipulated in Act JUS/206/2009. To view details on the methodology 2013 2012 2011 2010 2009 is taken from information submitted to the TRADE REGISTER.
|
|
EQUIVALENCIA |
EQUIVALENCIA |
EQUIVALENCIA |
EQUIVALENCIA |
EQUIVALENCIA |
|
|
ASSETS |
2013 |
2012 |
2011 |
2010 |
2009 |
|
|
A)
SHAREHOLDERS (PARTNERS) BY UNCALLED SUSCRIBED CAPITAL: |
0,00 |
0,00 |
0,00 |
0,00 |
0,00 |
|
|
B)
FIXED ASSETS: |
1.264.172,00 |
1.296.416,00 |
1.381.362,00 |
1.474.072,00 |
1.079.960,00 |
|
|
I. Formation expenses: |
0,00 |
0,00 |
0,00 |
0,00 |
0,00 |
|
|
II. Intangible fixed assets: |
1.453,00 |
1.453,00 |
1.453,00 |
1.453,00 |
1.453,00 |
|
|
III. Tangible fixed assets: |
1.171.162,00 |
1.206.134,00 |
1.296.196,00 |
1.388.901,00 |
991.741,00 |
|
|
IV. Financial investments: |
91.558,00 |
88.829,00 |
83.714,00 |
83.718,00 |
86.766,00 |
|
|
V. Own shares: |
0,00 |
0,00 |
0,00 |
0,00 |
0,00 |
|
|
VI. Long-term trade receivables: |
0,00 |
0,00 |
0,00 |
0,00 |
0,00 |
|
|
C)
Deferred expenses: |
0,00 |
0,00 |
0,00 |
0,00 |
0,00 |
|
|
D)
CURRENT ASSETS: |
601.347,00 |
1.050.255,00 |
946.689,00 |
1.989.827,00 |
1.869.620,00 |
|
|
I. Called-up share capital (not paid): |
0,00 |
0,00 |
0,00 |
0,00 |
0,00 |
|
|
II. Stocks: |
525.388,00 |
459.862,00 |
459.862,00 |
98.670,00 |
433.020,00 |
|
|
III. Debtors: |
668.249,00 |
566.054,00 |
486.827,00 |
1.768.481,00 |
1.425.742,00 |
|
|
IV. Short-term investments: |
-632.658,00 |
0,00 |
0,00 |
135.494,00 |
10.857,00 |
|
|
V. Short-term treasury shares: |
0,00 |
0,00 |
0,00 |
0,00 |
0,00 |
|
|
VI. Cash at bank and in hand: |
40.368,00 |
20.287,00 |
0,00 |
-12.818,00 |
0,00 |
|
|
VII. Prepayments and accrued income: |
0,00 |
4.052,00 |
0,00 |
0,00 |
0,00 |
|
|
GENERAL
TOTAL (A + B + C + D): |
1.865.519,00 |
2.346.671,00 |
2.328.050,00 |
3.463.899,00 |
2.949.580,00 |
|
MERCANTILE REGISTRY.
|
|
EQUIVALENCIA |
EQUIVALENCIA |
EQUIVALENCIA |
EQUIVALENCIA |
EQUIVALENCIA |
|
|
LIABILITIES |
2013 |
2012 |
2011 |
2010 |
2009 |
|
|
A)
EQUITY: |
1.573.840,00 |
1.574.461,00 |
1.623.987,00 |
1.621.047,00 |
1.635.523,00 |
|
|
I. Subscribed capital: |
1.007.397,00 |
1.007.397,00 |
1.007.397,00 |
1.007.397,00 |
1.007.397,00 |
|
|
II. Share premium: |
0,00 |
0,00 |
0,00 |
0,00 |
0,00 |
|
|
III. Revaluation reserves: |
0,00 |
0,00 |
0,00 |
0,00 |
0,00 |
|
|
IV. Reserves: |
1.217.348,00 |
1.217.348,00 |
1.217.497,00 |
1.217.497,00 |
1.217.497,00 |
|
|
a) Differences for capital adjustment to
euros: |
0,00 |
0,00 |
0,00 |
0,00 |
0,00 |
|
|
b) Remaining Reserves: |
1.217.348,00 |
1.217.348,00 |
1.217.497,00 |
1.217.497,00 |
1.217.497,00 |
|
|
V. Profit or loss brought forward: |
-650.284,00 |
-600.384,00 |
-602.402,00 |
-593.423,00 |
-533.012,00 |
|
|
VI. Profit or loss for the financial year: |
-620,00 |
-49.900,00 |
1.495,00 |
-10.424,00 |
-56.360,00 |
|
|
VII. Interim dividend paid: |
0,00 |
0,00 |
0,00 |
0,00 |
0,00 |
|
|
VIII. Own shares for capital reduction: |
0,00 |
0,00 |
0,00 |
0,00 |
0,00 |
|
|
B)
Deferred income: |
0,00 |
0,00 |
0,00 |
0,00 |
0,00 |
|
|
C)
PROVISIONS FOR LIABILITIES AND CHARGES: |
0,00 |
0,00 |
0,00 |
0,00 |
0,00 |
|
|
D)
LONG TERM LIABILITIES: |
112.599,00 |
126.270,00 |
125.520,00 |
134.562,00 |
152.876,00 |
|
|
E)
SHORT TERM CREDITORS: |
179.080,00 |
645.940,00 |
578.543,00 |
1.708.289,00 |
1.161.181,00 |
|
|
F)
SHORT-TERM PROVISIONS FOR LIABILITIES AND CHARGES: |
0,00 |
0,00 |
0,00 |
0,00 |
0,00 |
|
|
GENERAL
TOTAL (A + B + C + D + E + F): |
1.865.519,00 |
2.346.671,00 |
2.328.050,00 |
3.463.899,00 |
2.949.580,00 |
|
MERCANTILE REGISTRY.
|
|
EQUIVALENCIA |
EQUIVALENCIA |
EQUIVALENCIA |
EQUIVALENCIA |
EQUIVALENCIA |
|
|
DEBIT |
2013 |
2012 |
2011 |
2010 |
2009 |
|
|
A)
CHARGES (A.1 to A.15): |
1.175.079,00 |
1.231.853,00 |
499.242,00 |
1.535.355,00 |
974.259,00 |
|
|
A.1. Operating consumption: |
582.982,00 |
668.599,00 |
-1.225,00 |
929.322,00 |
543.319,00 |
|
|
A.2. Staff Costs: |
381.828,00 |
326.672,00 |
276.777,00 |
340.038,00 |
287.541,00 |
|
|
a) Wages, salaries et
al.: |
305.322,00 |
261.217,00 |
221.320,00 |
271.905,00 |
229.927,00 |
|
|
b) Social security
costs: |
76.506,00 |
65.455,00 |
55.457,00 |
68.133,00 |
57.614,00 |
|
|
A.3. Depreciation expense: |
38.768,00 |
90.061,00 |
92.705,00 |
102.640,00 |
99.835,00 |
|
|
A.4. Variation of trade provisions and
losses of unrecovered receivables: |
0,00 |
0,00 |
0,00 |
0,00 |
0,00 |
|
|
A.5. Other operating charges: |
152.057,00 |
146.723,00 |
104.142,00 |
122.854,00 |
62.350,00 |
|
|
A.I. OPERATING BENEFITS (B.1-A.1-A.2-A.3-A.4-A.5): |
18.437,00 |
0,00 |
0,00 |
0,00 |
0,00 |
|
|
A.6. Financial and similar charges: |
19.599,00 |
12.272,00 |
26.468,00 |
43.107,00 |
0,00 |
|
|
a) Due to liabilities
with companies of the group: |
0,00 |
0,00 |
0,00 |
0,00 |
0,00 |
|
|
b) Due to liabilities
with associated companies: |
0,00 |
0,00 |
0,00 |
0,00 |
0,00 |
|
|
c) Due to other
debts: |
19.599,00 |
12.272,00 |
26.468,00 |
43.107,00 |
0,00 |
|
|
d) Losses from financial
investments: |
0,00 |
0,00 |
0,00 |
0,00 |
0,00 |
|
|
A.7. Financial investment provision
change: |
0,00 |
0,00 |
0,00 |
0,00 |
0,00 |
|
|
A.8. Exchange losses: |
0,00 |
0,00 |
0,00 |
0,00 |
0,00 |
|
|
A.II. POSITIVE FINANCIAL RESULTS (B.2+B.3-A.6-A.7-A.8): |
0,00 |
0,00 |
0,00 |
0,00 |
16,00 |
|
|
A.III. PROFIT FROM ORDINARY ACTIVITIES (A.I+A.II-B.I-B.II):
|
0,00 |
0,00 |
0,00 |
0,00 |
0,00 |
|
|
A.9. Changes in provisions for intangible,
tangible and securities portfolio: |
0,00 |
0,00 |
0,00 |
0,00 |
0,00 |
|
|
A.10. Losses from tangible and intangible
fixed assets and portfolio: |
0,00 |
0,00 |
0,00 |
0,00 |
0,00 |
|
|
A.11. Losses from transactions with own
shares and debentures: |
0,00 |
0,00 |
0,00 |
0,00 |
0,00 |
|
|
A.12. Extraordinary expenses: |
0,00 |
0,00 |
0,00 |
0,00 |
0,00 |
|
|
A.13. Prior year expenses and losses:
|
0,00 |
0,00 |
0,00 |
0,00 |
0,00 |
|
|
A.IV. EXTRAORDINARY PROFIT
(B.4+B.5+B.6+B.7+B.8-A.9-A.10-A.11-A.12-A.13): |
0,00 |
193.567,00 |
498.000,00 |
414.000,00 |
14.450,00 |
|
|
A.V. PROFIT BEFORE TAXES (A.III+A.IV-B.III-B.IV): |
0,00 |
0,00 |
1.868,00 |
0,00 |
0,00 |
|
|
A.14. Corporation Tax: |
-155,00 |
-12.475,00 |
374,00 |
-2.606,00 |
-18.787,00 |
|
|
A.15. Miscellaneous taxes: |
0,00 |
0,00 |
0,00 |
0,00 |
0,00 |
|
|
A.VI. FINANCIAL YEAR RESULT (PROFIT) (A.V-A.14-A.15): |
0,00 |
0,00 |
1.495,00 |
0,00 |
0,00 |
|
MERCANTILE REGISTRY.
|
|
EQUIVALENCIA |
EQUIVALENCIA |
EQUIVALENCIA |
EQUIVALENCIA |
EQUIVALENCIA |
|
|
CREDIT |
2013 |
2012 |
2011 |
2010 |
2009 |
|
|
B)
INCOME ( B.1 to B.8): |
1.174.459,00 |
1.181.953,00 |
500.736,00 |
1.524.931,00 |
917.899,00 |
|
|
B.1. Operating income: |
1.174.072,00 |
988.276,00 |
2.736,00 |
1.110.913,00 |
903.433,00 |
|
|
a) Net total sales:
|
1.174.058,00 |
987.355,00 |
0,00 |
1.110.873,00 |
903.433,00 |
|
|
b) Miscellaneous
operating income: |
15,00 |
921,00 |
2.736,00 |
40,00 |
0,00 |
|
|
B.I. PÉRDIDAS DE EXPLOTACIÓN (A.1+A.2+A.3+A.4+A.5-B.1 ): |
0,00 |
243.780,00 |
469.664,00 |
383.941,00 |
89.613,00 |
|
|
B.2. Financial income: |
386,00 |
110,00 |
0,00 |
18,00 |
16,00 |
|
|
a) Companies of the
group: |
386,00 |
110,00 |
0,00 |
18,00 |
16,00 |
|
|
b) In associated
companies: |
0,00 |
0,00 |
0,00 |
0,00 |
0,00 |
|
|
c) Miscellaneous:
|
0,00 |
0,00 |
0,00 |
0,00 |
0,00 |
|
|
d) Profit on
financial investment: |
0,00 |
0,00 |
0,00 |
0,00 |
0,00 |
|
|
B.3. Exchange gains: |
0,00 |
0,00 |
0,00 |
0,00 |
0,00 |
|
|
B.II. NEGATIVE FINANCIAL RESULTS (A.6+A.7+A.8-B.2-B.3): |
19.213,00 |
12.162,00 |
26.468,00 |
43.090,00 |
0,00 |
|
|
B.III. LOSSES ON ORDINARY ACTIVITIES ( B.I + B.II - A.I - A.II
): |
776,00 |
255.942,00 |
496.132,00 |
427.031,00 |
89.597,00 |
|
|
B.4. Profit on disposal of both tangible
and intangible fixed assets and securities portfolio: |
0,00 |
0,00 |
498.000,00 |
414.000,00 |
0,00 |
|
|
B.5. Profit on transactions with own
shares and debentures: |
0,00 |
0,00 |
0,00 |
0,00 |
0,00 |
|
|
B.6. Capital grants transferred to profit
and loss: |
0,00 |
0,00 |
0,00 |
0,00 |
0,00 |
|
|
B.7. Extraordinary income: |
0,00 |
193.567,00 |
0,00 |
0,00 |
14.450,00 |
|
|
B.8. Income and profit of former financial
years: |
0,00 |
0,00 |
0,00 |
0,00 |
0,00 |
|
|
B.IV. NEGATIVE EXTRAORDINARY RESULTS
(A.9+A.10+A.11+A.12+A.13-B.4-B.5-B.6-B.7-B.8): |
0,00 |
0,00 |
0,00 |
0,00 |
0,00 |
|
|
B.V. LOSSES BEFORE TAXES (B.III+B.IV-A.III-A.IV): |
776,00 |
62.375,00 |
0,00 |
13.031,00 |
75.146,00 |
|
|
B.VI. FINANCIAL YEAR RESULTS (LOSSES) (B.V+A.14+A.15): |
620,00 |
49.900,00 |
0,00 |
10.424,00 |
56.360,00 |
|
MERCANTILE REGISTRY.
|
CASHFLOW
STATEMENT
|
Model: Normal
>
Source of information: Data contained in this section is taken from the
information declared in the Annual Accounts submitted to the Trade Register.
|
1.
Fiscal year result before taxes.: 61100 |
-776,00 |
-62.375,00 |
1.868,00 |
-13.031,00 |
-75.146,00 |
|
|
2.
Results adjustments.: 61200 |
57.981,00 |
102.223,00 |
119.173,00 |
145.730,00 |
99.819,00 |
|
|
a) Fixed Assets Amortization (+).: 61201 |
38.768,00 |
90.061,00 |
92.705,00 |
102.640,00 |
99.835,00 |
|
|
g) Financial income (-).: 61207 |
-386,00 |
-110,00 |
0,00 |
-18,00 |
-16,00 |
|
|
h) Financial Expenses (+). : 61208 |
19.599,00 |
12.272,00 |
26.468,00 |
43.107,00 |
0,00 |
|
|
3.
Changes in current capital equity.: 61300 |
495.068,00 |
-147.746,00 |
106.646,00 |
352.177,00 |
-334.768,00 |
|
|
a) Stock (+/-).: 61301 |
-65.526,00 |
0,00 |
-361.192,00 |
334.350,00 |
15.140,00 |
|
|
d) Debtors and other accounts receivable (+/-). : 61302 |
-102.040,00 |
-88.271,00 |
1.278.674,00 |
-341.321,00 |
-466.847,00 |
|
|
c) Other current assets (+/-). : 61303 |
636.710,00 |
-4.052,00 |
135.494,00 |
-124.637,00 |
-10.857,00 |
|
|
d) Creditors and other accounts payable (+/-). : 61304 |
27.954,00 |
-53.177,00 |
-948.576,00 |
490.082,00 |
123.496,00 |
|
|
e) Other current liabilities (+/-).: 61305 |
-2.030,00 |
-2.246,00 |
2.246,00 |
-6.298,00 |
4.301,00 |
|
|
4.
Other cash flows for operating activities.: 61400 |
-19.213,00 |
-12.162,00 |
-26.468,00 |
-43.090,00 |
16,00 |
|
|
a) Interest payments (-). : 61401 |
-19.599,00 |
-12.272,00 |
-26.468,00 |
-43.107,00 |
0,00 |
|
|
c) Interest collection (+). : 61403 |
386,00 |
110,00 |
0,00 |
18,00 |
16,00 |
|
|
5.
Operating activity cash flows (1 + 2 + 3 + 4) : 61500 |
533.060,00 |
-120.059,00 |
201.220,00 |
441.787,00 |
-310.079,00 |
|
|
6.
Payments for investment (-).: 62100 |
-2.884,00 |
-5.115,00 |
0,00 |
-398.577,00 |
-22.838,00 |
|
|
c) Fixed assets. : 62103 |
0,00 |
0,00 |
0,00 |
-397.160,00 |
0,00 |
|
|
e) Other financial assets. : 62105 |
-2.729,00 |
-5.115,00 |
0,00 |
0,00 |
-4.052,00 |
|
|
h) Other assets. : 62108 |
-155,00 |
0,00 |
0,00 |
-1.417,00 |
-18.787,00 |
|
|
7.
Divestment payment collection (+). : 62200 |
34.973,00 |
99.105,00 |
95.690,00 |
3.048,00 |
151.855,00 |
|
|
a) Companies of the group and affiliates. : 62201 |
0,00 |
0,00 |
0,00 |
0,00 |
52.020,00 |
|
|
c) Fixed assets. : 62203 |
34.973,00 |
90.061,00 |
92.705,00 |
0,00 |
99.835,00 |
|
|
e) Other financial assets. : 62205 |
0,00 |
0,00 |
5,00 |
3.048,00 |
0,00 |
|
|
h) Other assets. : 62208 |
0,00 |
9.043,00 |
2.980,00 |
0,00 |
0,00 |
|
|
8.
Investment activity cash flows (6 + 7) minus Amortization: 62300 |
-6.679,00 |
3.928,00 |
2.984,00 |
-498.169,00 |
29.182,00 |
|
|
9.
Payment collection and payments for equity instruments. : 63100 |
0,00 |
374,00 |
1.446,00 |
-4.052,00 |
0,00 |
|
|
a) Issuance of equity instruments (+). : 63101 |
0,00 |
374,00 |
1.446,00 |
0,00 |
0,00 |
|
|
b) Amortization of assets instruments (-). : 63102 |
0,00 |
0,00 |
0,00 |
-4.052,00 |
0,00 |
|
|
10.
Payment collection and payments for financial liabilities instruments.:
63200 |
-506.300,00 |
136.044,00 |
-192.833,00 |
47.617,00 |
280.897,00 |
|
|
a) Issuance : 63201 |
0,00 |
490.480,00 |
0,00 |
65.930,00 |
295.999,00 |
|
|
2. Debts incurred with credit institutions (+). : 63203 |
0,00 |
480.406,00 |
0,00 |
0,00 |
0,00 |
|
|
5. Other debts (+). : 63206 |
0,00 |
10.074,00 |
0,00 |
65.930,00 |
295.999,00 |
|
|
b) Repayment and amortization of : 63207 |
-506.300,00 |
-354.436,00 |
-192.833,00 |
-18.314,00 |
-15.102,00 |
|
|
2. Debts incurred with credit institutions (-).: 63209 |
-448.634,00 |
0,00 |
0,00 |
0,00 |
0,00 |
|
|
5. Other debts (-). : 63212 |
-57.666,00 |
-354.436,00 |
-192.833,00 |
-18.314,00 |
-15.102,00 |
|
|
11.
Payments from dividends and remunerations from other assets instruments. :
63300 |
0,00 |
0,00 |
0,00 |
0,00 |
0,00 |
|
|
12.
Cash flows for financing activities (9+10+11).: 63400 |
-506.300,00 |
136.418,00 |
-191.387,00 |
43.565,00 |
280.897,00 |
|
|
D)
EFFECT OF EXCHANGE RATE CHANGES: 64000 |
0,00 |
0,00 |
0,00 |
0,00 |
0,00 |
|
|
E)
NET INCREASE/DECREASE OF CASH OR EQUIVALENT ASSETS (+/-5+/-8+/12+/-D) :
65000 |
20.081,00 |
20.287,00 |
12.818,00 |
-12.818,00 |
0,00 |
|
|
Cash or equivalent assets as of beginning of the fiscal year.:
65100 |
20.287,00 |
0,00 |
-12.818,00 |
0,00 |
0,00 |
|
|
Cash or equivalent assets as of end of the fiscal year.:
65200 |
40.368,00 |
20.287,00 |
0,00 |
-12.818,00 |
0,00 |
|
|
FINANCIAL
DIAGNOSIS
|
> Economic-Financial Comparative Analysis
Data used in the following ratios and indicators is taken from the Annual Accounts submitted by the company to the TRADE REGISTER.
> Comparison within the Sector
|
Cash
Flow |
2013 |
2012 |
Variación 2013 - 2012 |
|
|||
|
|
Empresa |
Sector |
Empresa |
Sector |
Empresa |
Sector |
|
|
Cash
Flow over Sales: |
0,02 % |
0,18 % |
0,02 % |
0,17 % |
-16,76 % |
9,37 % |
|
|
EBITDA
over Sales: |
4,87 % |
-1,46 % |
-15,57 % |
7,58 % |
131,30 % |
-119,28 % |
|
|
Cash
Flow Yield: |
0,01 % |
0,04 % |
0,01 % |
0,04 % |
24,51 % |
7,95 % |
|
|
Profitability |
2013 |
2012 |
Variación 2013 - 2012 |
|
|||
|
|
Empresa |
Sector |
Empresa |
Sector |
Empresa |
Sector |
|
|
Operating
economic profitability: |
0,77 % |
-12,17 % |
-10,80 % |
0,51 % |
107,10 % |
-2.468,05 % |
|
|
Total
economic profitability: |
1,01 % |
-3,42 % |
-2,14 % |
-0,03 % |
147,26 % |
-12.346,76 % |
|
|
Financial
profitability: |
-0,04 % |
-11,93 % |
-3,17 % |
-3,94 % |
98,76 % |
-202,70 % |
|
|
Margin:
|
1,57 % |
-24,57 % |
-24,67 % |
0,94 % |
106,37 % |
-2.713,10 % |
|
|
Mark-up:
|
-0,07 % |
-22,24 % |
-25,90 % |
-6,14 % |
99,74 % |
-262,14 % |
|
|
Solvency |
2013 |
2012 |
Variación 2013 - 2012 |
|
|||
|
|
Empresa |
Sector |
Empresa |
Sector |
Empresa |
Sector |
|
|
Liquidity:
|
0,23 |
0,16 |
0,03 |
0,16 |
617,73 |
4,42 |
|
|
Acid
Test: |
-0,39 |
1,21 |
0,68 |
0,86 |
-156,93 |
40,00 |
|
|
Working
Capital / Investment: |
0,15 |
0,09 |
0,11 |
0,08 |
34,44 |
4,84 |
|
|
Solvency:
|
3,36 |
1,70 |
1,63 |
1,43 |
106,53 |
19,06 |
|
|
Indebtedness |
2013 |
2012 |
Variación 2013 - 2012 |
|
|||
|
|
Empresa |
Sector |
Empresa |
Sector |
Empresa |
Sector |
|
|
Indebtedness
level: |
0,19 |
1,05 |
0,49 |
1,07 |
-62,21 |
-1,40 |
|
|
Borrowing
Composition: |
0,63 |
0,98 |
0,20 |
1,22 |
221,65 |
-19,95 |
|
|
Repayment
Ability: |
14,53 |
12,08 |
38,06 |
14,17 |
-61,84 |
-14,74 |
|
|
Warranty:
|
6,40 |
2,10 |
3,04 |
1,94 |
110,46 |
8,65 |
|
|
Generated
resources / Total creditors: |
0,13 |
-0,06 |
0,05 |
0,01 |
151,47 |
-592,59 |
|
|
Efficiency |
2013 |
2012 |
Variación 2013 - 2012 |
|
|||
|
|
Empresa |
Sector |
Empresa |
Sector |
Empresa |
Sector |
|
|
Productivity:
|
1,15 |
0,95 |
0,53 |
1,30 |
117,18 |
-27,44 |
|
|
Turnover
of Collection Rights : |
2,25 |
2,94 |
2,35 |
3,64 |
-4,39 |
-19,15 |
|
|
Turnover
of Payment Entitlements: |
5,48 |
2,35 |
6,26 |
2,35 |
-12,45 |
-0,04 |
|
|
Stock
rotation: |
2,20 |
2,48 |
2,68 |
2,20 |
-17,90 |
12,49 |
|
|
Assets
turnover: |
0,49 |
0,50 |
0,44 |
0,55 |
11,46 |
-9,38 |
|
|
Borrowing
Cost: |
6,72 |
3,34 |
1,59 |
2,83 |
322,82 |
18,08 |
|
>
Trend of indicators under the General Accounting Plan of 2007 (2013, 2012,
2011, 2010, 2009)
|
Cash
Flow |
2013 |
2012 |
2011 |
2010 |
2009 |
|
|
Cash
Flow over Sales: |
0,02 % |
0,02 % |
|
-0,01 % |
0,00 % |
|
|
EBITDA
over Sales: |
4,87 % |
-15,57 % |
|
-25,32 % |
1,13 % |
|
|
Cash
Flow Yield: |
0,01 % |
0,01 % |
0,01 % |
0,00 % |
0,00 % |
|
|
Profitability |
2013 |
2012 |
2011 |
2010 |
2009 |
|
|
Operating
economic profitability: |
0,77 % |
-10,80 % |
1,26 % |
0,93 % |
-3,14 % |
|
|
Total
economic profitability: |
1,01 % |
-2,14 % |
1,22 % |
0,87 % |
-2,55 % |
|
|
Financial
profitability: |
-0,04 % |
-3,17 % |
0,09 % |
-0,64 % |
-3,45 % |
|
|
Margin:
|
1,57 % |
-24,67 % |
1.035,58 % |
2,71 % |
-9,92 % |
|
|
Mark-up:
|
-0,07 % |
-25,90 % |
68,28 % |
-1,17 % |
-9,92 % |
|
|
Solvency |
2013 |
2012 |
2011 |
2010 |
2009 |
|
|
Liquidity:
|
0,23 |
0,03 |
0,00 |
-0,01 |
0,00 |
|
|
Acid
Test: |
-0,39 |
0,68 |
0,57 |
1,01 |
1,10 |
|
|
Working
Capital / Investment: |
0,15 |
0,11 |
0,09 |
0,04 |
0,24 |
|
|
Solvency:
|
3,36 |
1,63 |
1,64 |
1,16 |
1,61 |
|
|
Indebtedness |
2013 |
2012 |
2011 |
2010 |
2009 |
|
|
Indebtedness
level: |
0,19 |
0,49 |
0,43 |
1,14 |
0,80 |
|
|
Borrowing
Composition: |
0,63 |
0,20 |
0,22 |
0,08 |
0,13 |
|
|
Repayment
Ability: |
14,53 |
38,06 |
54,93 |
-143,77 |
53,26 |
|
|
Warranty:
|
6,40 |
3,04 |
3,31 |
1,88 |
2,24 |
|
|
Generated
resources / Total creditors: |
0,13 |
0,05 |
0,13 |
0,05 |
0,03 |
|
|
Efficiency |
2013 |
2012 |
2011 |
2010 |
2009 |
|
|
Productivity:
|
1,15 |
0,53 |
-0,36 |
0,17 |
1,04 |
|
|
Turnover
of Collection Rights : |
2,25 |
2,35 |
0,01 |
0,69 |
0,71 |
|
|
Turnover
of Payment Entitlements: |
5,48 |
6,26 |
4,29 |
0,94 |
1,10 |
|
|
Stock
rotation: |
2,20 |
2,68 |
1,03 |
15,15 |
2,29 |
|
|
Assets
turnover: |
0,49 |
0,44 |
0,00 |
0,34 |
0,32 |
|
|
Borrowing
Cost: |
6,72 |
1,59 |
3,76 |
2,34 |
0,00 |
|
COMPARATIVE
SECTORIAL BALANCE
|
Sector-based
Comparison under the rules of the New General Accounting Plan.
|
|
Variación - |
|
|
|
Empresa |
Sector |
|
|
Variación - |
|
|
|
Empresa |
Sector |
|
|
Variación - |
|
|
|
Empresa |
Sector |
News
-----
Public Tenders and Works Won
No Public Tenders assigned to the
name of the company.
Research
Summary
|
The company was established in 1980. It is dedicated to the
manufacture and design of sales stand and other metallic structures. Its activities
are carried out both nationally and internationally. In the consulted
references there are no charges against it, taking into consideration the
last figures that appear in the Public trade Register, we consider that it is
convenient to revise periodically its progress. |
FOREIGN EXCHANGE RATES
|
Currency |
Unit
|
Indian Rupees |
|
US Dollar |
1 |
Rs.65.29 |
|
|
1 |
Rs.99.31 |
|
Euro |
1 |
Rs.73.39 |
INFORMATION DETAILS
|
Analysis Done by
: |
RAS |
|
|
|
|
Report Prepared
by : |
ANK |
RATING EXPLANATIONS
|
RATING |
STATUS |
PROPOSED CREDIT LINE |
|
|
>86 |
Aaa |
Possesses an extremely sound financial base with the strongest
capability for timely payment of interest and principal sums |
Unlimited |
|
71-85 |
Aa |
Possesses adequate working capital. No caution needed for credit
transaction. It has above average (strong) capability for payment of interest
and principal sums |
Large |
|
56-70 |
A |
Financial & operational base are regarded healthy. General unfavourable
factors will not cause fatal effect. Satisfactory capability for payment of
interest and principal sums |
Fairly Large |
|
41-55 |
Ba |
Overall operation is considered normal. Capable to meet normal
commitments. |
Satisfactory |
|
26-40 |
B |
Capability to overcome financial difficulties seems comparatively
below average. |
Small |
|
11-25 |
Ca |
Adverse factors are apparent. Repayment of interest and principal sums
in default or expected to be in default upon maturity |
Limited with full
security |
|
<10 |
C |
Absolute credit risk exists. Caution needed to be exercised |
Credit not
recommended |
|
-- |
NB |
New Business |
-- |
This score serves as a reference to assess SC’s
credit risk and to set the amount of credit to be extended. It is calculated
from a composite of weighted scores obtained from each of the major sections of
this report. The assessed factors and their relative weights (as indicated
through %) are as follows:
Financial
condition (40%) Ownership
background (20%) Payment
record (10%)
Credit history
(10%) Market trend (10%) Operational size
(10%)
This report is issued at your request without any
risk and responsibility on the part of MIRA INFORM PRIVATE LIMITED (MIPL)
or its officials.