MIRA INFORM REPORT
|
Report No. : |
343911 |
|
Report Date : |
07.10.2015 |
IDENTIFICATION DETAILS
|
Name : |
PERMESS B.V. |
|
|
|
|
Registered Office : |
Enterseweg 7 7471SB Goor |
|
|
|
|
Country : |
Netherlands |
|
|
|
|
Financials (as on) : |
31.12.2014 |
|
|
|
|
Date of Incorporation : |
27.11.1964 |
|
|
|
|
Com. Reg. No.: |
06032392 |
|
|
|
|
Legal Form : |
Private company |
|
|
|
|
Line of Business : |
Manufacture of other textiles. |
|
|
|
|
No. of Employees : |
42 |
RATING & COMMENTS
|
MIRA’s Rating : |
Ba |
|
RATING |
STATUS |
PROPOSED CREDIT LINE |
|
|
41-55 |
Ba |
Overall operation is considered normal. Capable to meet normal
commitments. |
Satisfactory |
|
Status : |
Satisfactory |
|
|
|
|
Payment Behaviour : |
Slow but correct |
|
|
|
|
Litigation : |
Clear |
NOTES:
Any query related to this report can be made
on e-mail: infodept@mirainform.com
while quoting report number, name and date.
ECGC Country Risk Classification List – March 31, 2015
|
Country Name |
Previous Rating (31.12.2014) |
Current Rating (31.03.2015) |
|
Netherlands |
A1 |
A1 |
|
Risk Category |
ECGC Classification |
|
Insignificant |
A1 |
|
Low |
A2 |
|
Moderate |
B1 |
|
High |
B2 |
|
Very High |
C1 |
|
Restricted |
C2 |
|
Off-credit |
D |
NETHERLANDS - ECONOMIC OVERVIEW
The Netherlands, the sixth-largest economy in the European Union, plays an important role as a European transportation hub, with a persistently high trade surplus, stable industrial relations, and moderate unemployment. Industry focuses on food processing, chemicals, petroleum refining, and electrical machinery. A highly mechanized agricultural sector employs only 2% of the labor force but provides large surpluses for food-processing and underpins the country’s status as the world’s second largest agricultural exporter. The Netherlands is part of the Eurozone, and as such, its monetary policy is controlled by the European Central Bank. The Dutch financial sector is highly concentrated, with four commercial banks possessing over 90% of banking assets. The sector suffered as a result of the global financial crisis and required billions of dollars of government support, but the European Banking Authority completed stringent reviews in 2014 and deemed Dutch banks to be well-capitalized. To address the 2009 and 2010 economic downturns, the government sought to stimulate the domestic economy by accelerating infrastructure programs, offering corporate tax breaks for employers to retain workers, and expanding export credits. The stimulus programs and bank bailouts, however, resulted in a government budget deficit of 5.3% of GDP in 2010 that contrasted sharply with a surplus of 0.7% in 2008. The government of Prime Minister Mark RUTTE has since implemented significant austerity measures to improve public finances and has instituted broad structural reforms in key policy areas, including the labor market, the housing sector, the energy market, and the pension system. As a result, the government budget deficit at the end of 2014 dropped to 1.8% of GDP. Following a protracted recession during which unemployment doubled to 7.4% and household consumption contracted for nearly three consecutive years, the year 2014 saw fragile GDP growth of 0.8 percent and a rise in most economic indicators. Drivers of growth included increased exports and business investments, as well as newly invigorated household consumption.
|
Source
: CIA |
Summary
Company
name Permess
B.V.
Operative
address Enterseweg 7
7471SB Goor
Netherlands
Legal
form Private Company
Registration
number KvK-nummer: 06032392
VAT-number
001887531
|
Year |
2014 |
Mutation |
2013 |
Mutation |
2012 |
|
|
Fixed
assets |
5.632.000 |
37,03 |
4.109.957 |
202,98 |
1.356.533 |
|
|
Total
receivables |
7.641.000 |
6,89 |
7.148.695 |
13,42 |
6.302.904 |
|
|
Total
equity |
5.087.000 |
9,05 |
4.664.782 |
10,66 |
4.215.520 |
|
|
Short term
liabilities |
9.062.000 |
28,23 |
7.067.183 |
-8,14 |
7.693.020 |
|
|
Net result |
385.000 |
-48,20 |
743.251 |
19,79 |
620.445 |
|
|
Working
capital |
5.296.000 |
-21,81 |
6.773.311 |
13,98 |
5.942.366 |
|
|
Quick
ratio |
0,85 |
-16,67 |
1,02 |
22,89 |
0,83 |
|
Contact
information
Company
name Permess B.V.
Trade
names Permess B.V.
Operative
address Enterseweg 7
7471SB Goor
Netherlands
Correspondence
address Postbus 177
7470AD Goor
Netherlands
Telephone
number 0547280000
Fax
number 0547280200
Email
address info@permess.nl
Website
www.permess.nl
| www.permess.eu | www.permess.com
Registration
Registration
number KvK-nummer: 06032392
Branch
number 000017709873
VAT-number
001887531
Status
Active
First
registration company register 1964-11-30
Memorandum
1964-11-27
Establishment
date 1964-11-27
Legal
form Private Company
Legal
person since 1972-11-06
Last
proposed admendment 2006-01-24
Issued
placed capital EUR 2.043.000
Paid
up share capital EUR 2.043.000
Activities
SBI
1399: Manufacture of other
textiles n.e.c.
Exporter
No
Importer
No
Goal Het fabriceren van en
handelen in gecoate textielproducten Beheermaatschappij
Relations
Shareholders
PMQ
Holding B.V.
Enterseweg 7
7471SB GOOR
Netherlands
Registration number:
08141166
Percentage: 100%
Companies on same address Multistiq
International Coating B.V.
Registration
number: 06040033
Personeelsvereniging T.W.
Packaging Twente B.V. "Pevasco" Goor
Registration number:
40650580
EMAX Labels Solutions
Holding B.V.
Registration number:
08140897
PMQ Holding B.V.
Registration number:
08141166
RPC Packaging Europe B.V.
Registration number:
10044214
Exploitatie Maatschappij
PMQ1 B.V.
Registration number: 58782524
Liability statements PMQ
Holding B.V.
Enterseweg 7
7471SB GOOR
Netherlands
Registration number:
08141166
date of issue: 2006-03-10
Starting date: 2006-12-02
Bank
details
Accounts ABN
Amro Bank NV
Account number:
59.06.35.646
BIC: ABNANL2A
ABN Amro Bank NV
Account number:
46.54.64.548
BIC: ABNANL2A
Management
Active management E.J.
Berenpas Evert Jan
Netherlands
Competence: Fully
authorized
Function: Manager
Starting date: 2002-11-01
Date of birth: 1958-10-04,
Emmen, NL
Involved with the following
companies:
Multistiq International
Coating B.V.
Enterseweg 7
7471SB GOOR
Netherlands
Registration number:
06040033
Function: Manager
M.U. de Beurs Mark Udo
Netherlands
Competence: Fully authorized
Function: Manager
Starting date: 2005-12-14
Date of birth: 1962-08-18,
Rheden, NL
Involved with the following
companies:
Multistiq International
Coating B.V.
Enterseweg 7
7471SB GOOR
Netherlands
Registration number:
06040033
Function: Manager
A.A. Broens Albertus Antony
Netherlands
Competence: Limited
authorization
Function: Proxy
Starting date: 1989-07-01
Date of birth: 1956-10-31,
Hellendoorn, NL
Involved with the following
companies:
Multistiq International
Coating B.V.
Enterseweg 7
7471SB GOOR
Netherlands
Registration number:
06040033
Function: Proxy
G.H.M. Broekkamp Gerhardus
Hermanus Maria
Netherlands
Competence: Limited
authorization
Function: Proxy
Starting date: 2008-07-01
Date of birth: 1949-05-06, Ambt Delden, NL
Employees
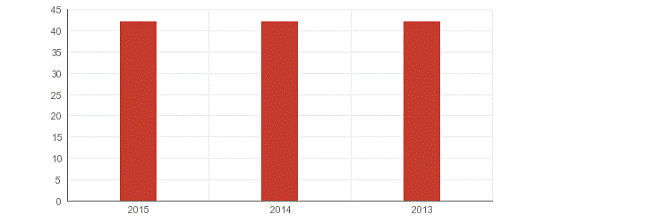
Total according to the Chamber of Commerce 42
Year 2015 2014 2013
Total 42 42 42
Key
figures
|
Year |
2014 |
2013 |
2012 |
2011 |
2010 |
|
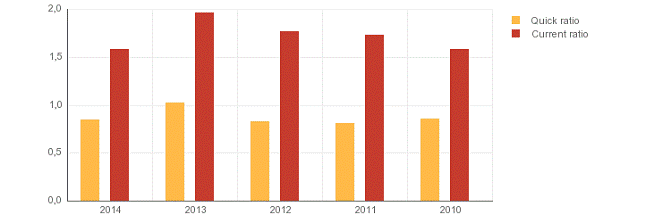
Quick ratio |
0,85 |
1,02 |
0,83 |
0,81 |
0,86 |
|
Current ratio |
1,58 |
1,96 |
1,77 |
1,73 |
1,58 |
|
Working capital/ balance total |
0,26 |
0,38 |
0,40 |
0,39 |
0,34 |
|
Equity / balance total |
0,25 |
0,26 |
0,28 |
0,24 |
0,21 |
|
Equity / Fixed assets |
0,90 |
1,13 |
3,11 |
2,86 |
3,49 |
|
Equity / liabilities |
0,34 |
0,35 |
0,39 |
0,31 |
0,26 |
|
Balance total / liabilities |
1,34 |
1,35 |
1,39 |
1,31 |
1,26 |
|
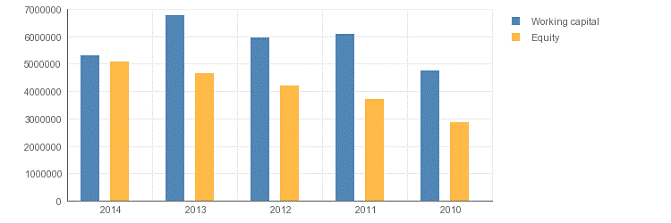
Working capital |
5.296.000 |
6.773.311 |
5.942.366 |
6.080.171 |
4.750.571 |
|
Equity |
5.087.000 |
4.664.782 |
4.215.520 |
3.705.373 |
2.874.754 |
|
Mutation equity |
9,05 |
10,66 |
13,77 |
28,89 |
60,44 |
|
Mutation short term liabilities |
28,23 |
-8,14 |
-7,33 |
0,66 |
4,41 |
|
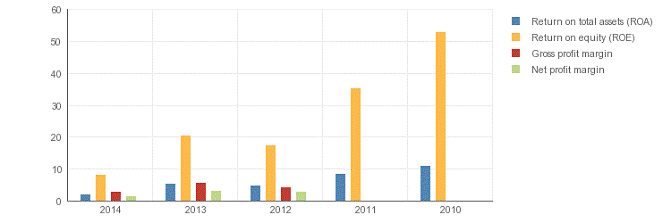
Return on total assets (ROA) |
2,06 |
5,29 |
4,84 |
8,32 |
10,99 |
|
Return on equity (ROE) |
8,10 |
20,35 |
17,22 |
35,19 |
52,86 |
|
Gross profit margin |
2,68 |
5,62 |
4,25 |
|
|
|
Net profit margin |
1,51 |
3,06 |
2,67 |
|
|
|
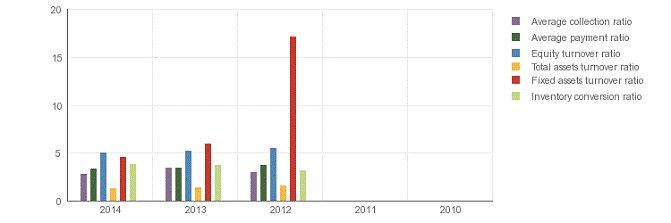
Average collection ratio |
2,82 |
3,44 |
3,02 |
|
|
|
Average payment ratio |
3,35 |
3,40 |
3,69 |
|
|
|
Equity turnover ratio |
5,02 |
5,21 |
5,52 |
|
|
|
Total assets turnover ratio |
1,28 |
1,35 |
1,55 |
|
|
|
Fixed assets turnover ratio |
4,54 |
5,91 |
17,15 |
|
|
|
Inventory conversion ratio |
3,84 |
3,68 |
3,20 |
|
|
|
Turnover |
25.561.000 |
24.292.386 |
23.260.652 |
|
|
|
Gross margin |
|
|
|
10.415.338 |
10.179.101 |
|
Operating result |
684.000 |
1.366.034 |
988.180 |
1.821.936 |
1.993.425 |
|
Net result after taxes |
385.000 |
743.251 |
620.445 |
940.663 |
1.095.910 |
|
Cashflow |
|
|
|
1.180.830 |
1.325.422 |
|
EBIT |
684.000 |
1.366.034 |
988.180 |
1.821.936 |
1.993.425 |
|
EBITDA |
|
|
|
2.062.103 |
2.222.937 |
Summary
The 2014 financial result structure is a
postive working captial of 5.296.000 euro, which is in
agreement with 26 % of the total assets of the
company.
The working capital has diminished with
-21.81 % compared to previous year. The ratio, with
respect to the total assets of the company
has however, declined.
The deterioration between 2013 and 2014 has
mainly been caused by an increase of the
current liabilities.
The current ratio of the company in 2014 was
1.58. A company with a current ratio between
1.5 and 3.0 generally indicates good
short-term financial strength.
The quick ratio in 2014 of the company was
0.85. A company with a Quick Ratio of less than
1 cannot currently pay back its current
liabilities.
The 2013 financial result structure is a
postive working captial of 6.773.311 euro, which is in
agreement with 38 % of the total assets of
the company.
The working capital has increase with 13.98 %
compared to previous year. The ratio with
respect to the total assets of the company
has however, declined.
The improvement between 2012 and 2013 has
mainly been caused by an increase of the
current assets.
The current ratio of the company in 2013 was 1.96. A company with a
current ratio between
1.5 and 3.0 generally indicates good
short-term financial strength.
The quick ratio in 2013 of the company was
1.02. A company with a Quick Ratio of more than
1 can currently pay back its current liabilities.
Financial
statement
Last
annual account 2014
Remark annual account The financial statements shown in the report
relate to the consolidated financial statements of the group.
Type
of annual account Consolidated
Annual
account PMQ Holding
B.V.
Enterseweg 7
7471SB GOOR
Netherlands
Registration number: 08141166
Balance
sheet
|
Year |
2014 |
2013 |
2012 |
2011 |
2010 |
|
End date |
2014-12-31 |
2013-12-31 |
2012-12-31 |
2011-12-31 |
2010-12-31 |
|
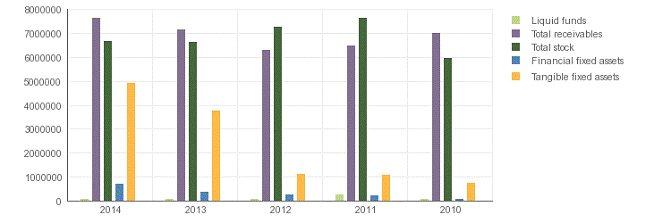
Tangible fixed assets |
4.920.000 |
3.755.244 |
1.103.636 |
1.078.761 |
736.668 |
|
Financial fixed assets |
712.000 |
354.713 |
252.897 |
217.910 |
86.790 |
|
Fixed assets |
5.632.000 |
4.109.957 |
1.356.533 |
1.296.671 |
823.458 |
|
Total stock |
6.652.000 |
6.606.025 |
7.266.236 |
7.639.027 |
5.938.409 |
|
Year |
2014 |
2013 |
2012 |
2011 |
2010 |
|
End date |
2014-12-31 |
2013-12-31 |
2012-12-31 |
2011-12-31 |
2010-12-31 |
|
Accounts receivable |
|
|
|
6.104.998 |
|
|
Other receivables |
|
|
|
375.047 |
|
|
Total receivables |
7.641.000 |
7.148.695 |
6.302.904 |
6.480.045 |
6.982.069 |
|
Liquid funds |
65.000 |
85.774 |
66.246 |
262.916 |
77.467 |
|
Current assets |
14.358.000 |
13.840.494 |
13.635.386 |
14.381.988 |
12.997.945 |
|
Total assets |
19.990.000 |
17.950.451 |
14.991.919 |
15.678.659 |
13.821.403 |
|
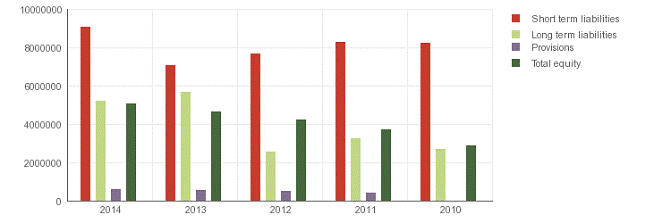
Total equity |
5.087.000 |
4.664.782 |
4.215.520 |
3.705.373 |
2.874.754 |
|
Provisions |
618.000 |
553.486 |
529.379 |
403.643 |
|
|
Long term interest yielding debt |
5.223.000 |
5.665.000 |
2.554.000 |
1.269.826 |
479.275 |
|
Financial debts |
|
|
|
1.998.000 |
2.220.000 |
|
Long term liabilities |
5.223.000 |
5.665.000 |
2.554.000 |
3.267.826 |
2.699.275 |
|
Accounts payable |
|
|
|
1.430.252 |
|
|
Other short term liabilities |
|
|
|
6.871.565 |
|
|
Short term liabilities |
9.062.000 |
7.067.183 |
7.693.020 |
8.301.817 |
8.247.374 |
|
Total short and long term liabilities |
14.903.000 |
13.285.669 |
10.776.399 |
11.973.286 |
10.946.649 |
|
Total liabilities |
19.990.000 |
17.950.451 |
14.991.919 |
15.678.659 |
13.821.403 |
Summary
The total assets of the company increased with
11.36 % between 2013 and 2014.
The total asset increase is retrievable in
the fixed asset growth of 37.03 %.
The asset growth has mainly been financed by
a debt increase of 12.17 %. The Net Worth,
however, grew with 9.05 %.
In 2014 the assets of the company were 28.17
% composed of fixed assets and 71.83 % by
current assets. The assets are being financed
by an equity of 25.45 %, and total debt of
74.55 %.
The total assets of the company increased
with 19.73 % between 2012 and 2013.
The total asset increase is retrievable in
the fixed asset growth of 202.98 %.
The asset growth has mainly been financed by
a debt increase of 23.28 %. The Net Worth,
however, grew with 10.66 %.
In 2013 the assets of the company were 22.9 %
composed of fixed assets and 77.1 % by
current assets. The assets are being financed
by an equity of 25.99 %, and total debt of
74.01 %.
Profit
and loss
|
Year |
2014 |
2013 |
2012 |
2011 |
2010 |
|
Revenues |
25.495.000 |
24.135.551 |
22.928.219 |
|
|
|
Other operating income |
-66.000 |
-156.835 |
-332.433 |
|
|
|
Net turnover |
25.561.000 |
24.292.386 |
23.260.652 |
|
|
|
Gross margin |
|
|
|
10.415.338 |
10.179.101 |
|
Wages and salaries |
|
|
|
3.907.240 |
4.004.676 |
|
Amorization and depreciation |
|
|
|
240.167 |
229.512 |
|
other operating costs |
|
|
|
4.445.995 |
3.951.488 |
|
Operating expenses |
24.811.000 |
22.769.517 |
21.940.039 |
8.593.402 |
8.185.676 |
|
Operating result |
684.000 |
1.366.034 |
988.180 |
1.821.936 |
1.993.425 |
|
Financial income |
123.000 |
|
51.707 |
|
|
|
Financial expenses |
395.000 |
416.537 |
313.829 |
518.056 |
|
|
Financial result |
-272.000 |
-416.537 |
-262.122 |
-518.056 |
-473.941 |
|
Result on ordinary operations before taxes |
412.000 |
949.497 |
726.058 |
1.303.880 |
1.519.484 |
|
Taxation on the result of ordinary activities |
93.000 |
313.859 |
138.435 |
430.818 |
413.723 |
|
Result of ordinary activities after taxes |
319.000 |
635.638 |
587.623 |
873.062 |
1.105.761 |
|
Result subsidiaries after taxes |
66.000 |
107.613 |
32.822 |
67.601 |
-9.851 |
|
Net result |
385.000 |
743.251 |
620.445 |
940.663 |
1.095.910 |
Summary The turnover of the company
grew with 5.22 % between 2013 and 2014.
The
operating result of the company declined with -49.93 % between 2013 and 2014.
This
evolution
implies an decrease of the company's economic profitability.
The
result of these changes is a reduction of the company's Economic Profitability
of -61.06
% of
the analysed period, being equal to 2013 % in the year 2014.
This
fall has contributed to a asset turnover decrease, whose index evolved from
-5.19 to a
level
of 1.28.
The Net
Result of the company increased by -48.2 % between 2013 and 2014.
The
company's Financial Profitability has been negatively affected by the financial
activities in
comparison
to the EBITs behaviour. The result of these variations is a profitability
reduction
of
-60.2 % of the analysed period, being 8.1 % in the year 2014.
The
company's financial profitability has been positively affected by its financial
structure.
The
turnover of the company grew with 4.44 % between 2012 and 2013.
The
operating result of the company grew with 38.24 % between 2012 and 2013. This
evolution
implies an increase of the company's economic profitability.
The result of these changes is an increase of the company's Economic Profitability of 9.3 %
of the
analysed period, being equal to 2012 % in the year 2013.
Despite
the growth the assets turnover decreased, whose index evolved with -12.9 % to a
level
of 1.35.
The Net
Result of the company decreased by 19.79 % between 2012 and 2013.
The
company's Financial Profitability has been positively affected by the financial
activities in
comparison
to the EBITs behaviour. The result of these variations is a profitability
increase of
18.18 %
of the analysed period, being 20.35 % in the year 2013.
The company's financial structure has slowed down its financial profitability.
Analysis
Branch
(SBI) MANUFACTURE OF TEXTILES
(SBI code 13)
Region
Twente
Summary
In the Netherlands 2146 of
the companies are registered with the SBI code 13
In the region Twente 127 of the companies are
registered with the SBI code 13
In the Netherlands 34 of the bankrupcties are
published within this sector
In the region Twente 3 of the bankruptcies
are published within this sector
The risk of this specific sector in the
Netherlands is normal
The risk of this specific sector in the region Twente is normal
Publications
Consent
statements 30-07-2015: Voor boekjaar 2014
is een instemmingsverklaring gedeponeerd.
25-03-2014: Voor boekjaar 2013 is een
instemmingsverklaring gedeponeerd.
27-02-2014: Voor boekjaar 2012 is een
instemmingsverklaring gedeponeerd.
08-06-2012: Voor boekjaar 2011 is een instemmingsverklaring gedeponeerd.
Company
structure
Relations
4
Company
Registration
number
PMQ
Holding B.V. (GOOR)
08141166
|
- - Multistiq International Coating B.V. (GOOR) 06040033
|
- - Permess B.V. (Goor) 06032392
|
- - Exploitatie Maatschappij PMQ1 B.V. (GOOR) 58782524
FOREIGN EXCHANGE RATES
|
Currency |
Unit
|
Indian Rupees |
|
US Dollar |
1 |
Rs.65.39 |
|
UK Pound |
1 |
Rs.99.05 |
|
Euro |
1 |
Rs.73.19 |
INFORMATION DETAILS
|
Analysis Done by
: |
KIN |
|
|
|
|
Report Prepared
by : |
ANK |
RATING EXPLANATIONS
|
RATING |
STATUS |
PROPOSED CREDIT LINE |
|
|
|
>86 |
Aaa |
Possesses an extremely sound financial base with the strongest
capability for timely payment of interest and principal sums |
Unlimited |
|
|
71-85 |
Aa |
Possesses adequate working capital. No caution needed for credit
transaction. It has above average (strong) capability for payment of interest
and principal sums |
Large |
|
|
56-70 |
A |
Financial & operational base are regarded healthy. General unfavourable
factors will not cause fatal effect. Satisfactory capability for payment of
interest and principal sums |
Fairly Large |
|
|
41-55 |
Ba |
Overall operation is considered normal. Capable to meet normal
commitments. |
Satisfactory |
|
|
26-40 |
B |
Capability to overcome financial difficulties seems comparatively
below average. |
Small |
|
|
11-25 |
Ca |
Adverse factors are apparent. Repayment of interest and principal sums
in default or expected to be in default upon maturity |
Limited with full
security |
|
|
<10 |
C |
Absolute credit risk exists. Caution needed to be exercised |
Credit not
recommended |
|
|
-- |
NB |
New Business |
-- |
|
This score serves as
a reference to assess SC’s credit risk and to set the amount of credit to be extended.
It is calculated from a composite of weighted scores obtained from each of the
major sections of this report. The assessed factors and their relative weights
(as indicated through %) are as follows:
Financial
condition (40%) Ownership background
(20%) Payment record
(10%)
Credit history
(10%) Market trend (10%) Operational size
(10%)
This report is issued at your request without any
risk and responsibility on the part of MIRA INFORM PRIVATE LIMITED (MIPL)
or its officials.