MIRA INFORM REPORT
|
Report No. : |
344757 |
|
Report Date : |
09.10.2015 |
IDENTIFICATION DETAILS
|
Name : |
AUROBINDO PHARMA LIMITED |
|
|
|
|
Registered
Office : |
Plot No. 2, Maithri Vihar, Behind Maithri Vanam, Ameerpet,
Hyderabad – 500 038, Telangana |
|
Tel. No.: |
91-40-66725000 |
|
|
|
|
Country : |
India |
|
|
|
|
Financials (as
on) : |
31.03.2015 |
|
|
|
|
Date of
Incorporation : |
26.12.1986 |
|
|
|
|
Com. Reg. No.: |
36-015190 |
|
|
|
|
Capital Investment
/ Paid-up Capital : |
Rs. 292.000 Million |
|
|
|
|
CIN No.: [Company Identification
No.] |
L24239TG1986PLC015190 |
|
|
|
|
IEC No.: |
Not Available |
|
|
|
|
TAN No.: [Tax Deduction &
Collection Account No.] |
HYDA01477A |
|
|
|
|
PAN No.: [Permanent Account No.] |
Not Available |
|
|
|
|
Legal Form : |
A Public Limited Liability Company. The Company’s Shares are Listed on
the Stock Exchanges. |
|
|
|
|
Line of Business
: |
Manufacturing and Marketing Bulk Drugs, Formulations, Tablets and Capsules,
Syrups and Injectable. |
|
|
|
|
No. of Employees
: |
Information declined by the management |
RATING & COMMENTS
|
MIRA’s Rating : |
A (60) |
|
RATING |
STATUS |
PROPOSED CREDIT LINE |
|
|
56-70 |
A |
Financial & operational base are regarded healthy. General
unfavourable factors will not cause fatal effect. Satisfactory capability for
payment of interest and principal sums |
Fairly Large |
|
Status : |
Good |
|
|
|
|
Payment Behaviour : |
Regular |
|
|
|
|
Litigation : |
Exists |
|
|
|
|
Comments : |
Subject is a Hyderabad based company incorporated on 26th
December, 1986. It is a well-established company having a fine track record. The company possesses a healthy financial profile marked by strong
networth base, healthy cash accruals and moderate gearing. Directors are reported to be experienced and respectable businessmen. The rating also take into consideration, an acceptable share price of Rs.
757.20/- recorded by the company as against a face value of Rs. 1.00 as on
October 9, 2015. Trade relations are fair. Business is active. Payment terms are
reported to be regular and as per commitments. In view of strong distribution network in the US and Europe, the
company can be considered good for business dealings at usual trade terms and
conditions. |
NOTES :
Any query related to this report can be made
on e-mail : infodept@mirainform.com
while quoting report number, name and date.
ECGC Country Risk Classification List – March 31, 2015
|
Country Name |
Previous Rating (31.12.2014) |
Current Rating (31.03.2015) |
|
India |
A1 |
A1 |
|
Risk Category |
ECGC
Classification |
|
Insignificant |
A1 |
|
Low |
A2 |
|
Moderate |
B1 |
|
High |
B2 |
|
Very High |
C1 |
|
Restricted |
C2 |
|
Off-credit |
D |
EXTERNAL AGENCY RATING
|
Rating Agency Name |
FITCH RATING |
|
Rating |
Long Term Issuer Rating = “IND Aa” |
|
Rating Explanation |
Have high degree of safety and very low credit risk |
|
Date |
23rd January, 2015 |
|
Rating Agency Name |
FITCH RATING |
|
Rating |
Short Term = “IND A1+” |
|
Rating Explanation |
Have very strong degree of safety and carry low credit risk |
|
Date |
23rd January, 2015 |
RBI DEFAULTERS’ LIST STATUS
Subject’s name is not enlisted as a defaulter
in the publicly available RBI Defaulters’ list.
EPF (Employee Provident Fund) DEFAULTERS’ LIST STATUS
Subject’s name is not enlisted as a defaulter
in the publicly available EPF (Employee Provident Fund) Defaulters’ list as of
31-03-2015.
INFORMATION DENIED
Management non co-operative (Tel. No. 91-40-66725000)
LOCATIONS
|
Registered Office/
Corporate Office : |
Plot No. 2, Maithri Vihar, Behind Maithri Vanam, Ameerpet, Hyderabad – 500 038, Telangana, India |
|
Tel. No.: |
91-40-23741083 / 23741084 / 23744919 / 66725000 / 66725401 / 23736370 |
|
Fax No.: |
91-40-23746833 / 23741080 / 23748112 / 23747340 |
|
E-Mail : |
|
|
Website : |
|
|
|
|
|
Corporate Office : |
Water Mark Building, Plot No.11, Survey No.9, Kondapur, Hitech City, Hyderabad - 500 084, Telangana, India. |
|
Tel. No.: |
91-40-66725000 |
|
Fax No.: |
91-40-23741080 / 23746833 |
|
|
|
|
Factory 1 : |
Survey No.379,385,386,388 to 396 and 269, Borpatla, Hatnoor Mandal, Medak District, 502 296, Telangana, India |
|
|
|
|
Factory 2 : |
Plot No.103/A and 104/A, SVCIE, Industrial Development Area, Bollaram, Jinnaram (Mandal) Medak District, 500 092, Telangana, India |
|
|
|
|
Factory 3 : |
Survey No.313 and 314 Bachupally, Quthubullapur Mandal, Range Reddy District, 500 090, Telangana, India |
|
|
|
|
Factory 4 : |
Plot No.4 in Survey No.151 and Plot Nos.34 to 48 in Survey No. part of 146, 150, 151, 152, 153 and 154 situated in Phase-III, SPIIC, EPIP, IDA, Pashamylaram, Patancheru Mandal, Medak District, 502 307, Telangana, India |
|
|
|
|
Factory 5 : |
Plot No.68 to 70, 73 to 91, 95, 96, 260 and 261 Industrial Development Area, Chemical Zone, Pashamylaram, Patancheru Mandal, Medak District, 502 307, Telangana, India |
|
|
|
|
Factory 6 : |
Survey No. 329/39 and 329/47, Chitkul Village, Patancheru Mandal, Medak District, 502 307, Telangana, India |
|
|
|
|
Factory 7 : |
Survey No. 411/P, 425/P, 434/P, 435/P and 458/P, Plot No.S1(Part), Special Economic Zone (Pharma), APIIC, Green Industrial Park, Polepally Village, Jedcherla Mandal, Mahaboob Nagar, 509 302, Telangana, India |
|
|
|
|
Factory 8 : |
Survey No.10 and 13, Gaddapothram, Industrial Development Area - Kazipally Industrial Area, Jinnaram Mandal, Medak District, 502 319, Telangana, India |
|
|
|
|
Factory 9 : |
Survey No.369, 370 371 and 374, Gundlamachanoor, Hatnoora Mandal, Medak District, 502 296, Telangana, India |
|
|
|
|
Factory 10 : |
Survey No.61-66, Industrial Development Area, Pydibhimavaram, Ranasthalam Mandal, Srikakulam, 532 409, Telangana, India |
|
|
|
|
Factory 11 : |
Survey No.314, Bachupally, Quthubullapur Mandal, Range Reddy District, 500 090, Telangana, India |
|
|
|
|
Factory 12 : |
JN Pharma City, Road No.10,11 and 19, 20, E Bonangi Village, Parawada, Visakhapatnam District, 531 021, Telangana, India |
|
|
|
|
Factory 13 : |
1128, RIICO
Phase-III, Bhiwadi, 301 019, Rajasthan, India (Sub-leased to Auronext Pharma Private
Limited, a subsidiary of the Company) |
|
|
|
|
APLRC – I |
Survey No.313 and 314 Bachupally, Quthubullapur Mandal, Ranga Reddy District - 500 090, Telangana, India |
|
|
|
|
APLRC - II |
Survey No.71 and 72, 502203, Telangana, India |
DIRECTORS
AS ON 31.03.2014
|
Name : |
Mr. K. Ragunathan |
|
Designation : |
Non-executive Director |
|
Date of Birth/Age : |
51 Years |
|
Experience : |
29 years |
|
|
|
|
Name : |
Mr. K. Nityananda Reddy |
|
Designation : |
Managing Director |
|
Date of Birth/Age : |
56 Years |
|
Qualification : |
Masters Degree in Science (Organic Chemistry) |
|
|
|
|
Name : |
Mr. N. Govindarajan, |
|
Designation : |
Managing Director |
|
Date of Birth/Age : |
46 Years |
|
Experience : |
21 years |
|
Qualification : |
B.E. (Mechanical) |
|
|
|
|
Name : |
Dr. M. Sivakumaran |
|
Designation : |
Whole-Time Director |
|
Date of Birth/Age : |
71 Years |
|
Qualification : |
Masters Degree in Science |
|
Experience : |
41 years |
|
|
|
|
Name : |
Mr. M. Madan Mohan Reddy |
|
Designation : |
Whole-Time Director |
|
Date of Birth/Age : |
54 Years |
|
Qualification : |
Masters Degree in Science (Organic
Chemistry) |
|
|
|
|
Name : |
Mr. P.V. Ramprasad Reddy |
|
Designation : |
Non-Executive Director and Promoter pf the Company |
|
Date of Birth/Age : |
56 Years |
|
Qualification : |
Post-Graduate |
|
|
|
|
Name : |
Mr. P. Sarath Chandra
Reddy |
|
Designation : |
Non-Executive Director |
|
Date of Birth/Age : |
29 Yeas |
|
Qualification : |
Graduate in Business Administration |
|
|
|
|
Name : |
Mr. M. Sitarama Murthy |
|
Designation : |
Non-Executive Director |
|
Date of Birth/Age : |
71 Years |
|
Qualification : |
Masters in Electronics |
|
|
|
|
Name : |
Dr. D. Rajagopala Reddy |
|
Designation : |
Non-Executive Director |
|
Date of Birth/Age : |
55 Years |
|
Qualification : |
Master's Degree in Science |
|
|
|
|
Name : |
Dr. C. Channa Reddy |
|
Designation : |
Non-Executive Director |
|
Date of Birth/Age : |
70 Years |
KEY EXECUTIVES
|
Name : |
Mr. Sudhir B Singhi (upto June 30, 2014) |
|
Designation : |
Chief Financial Officer |
|
|
|
|
Name : |
Mr. Subramanian Santhanam (From July 1, 2014) |
|
Designation : |
Chief Financial Officer |
|
|
|
|
Name : |
Mr. A. Mohan Rami Reddy |
|
Designation : |
Company Secretary |
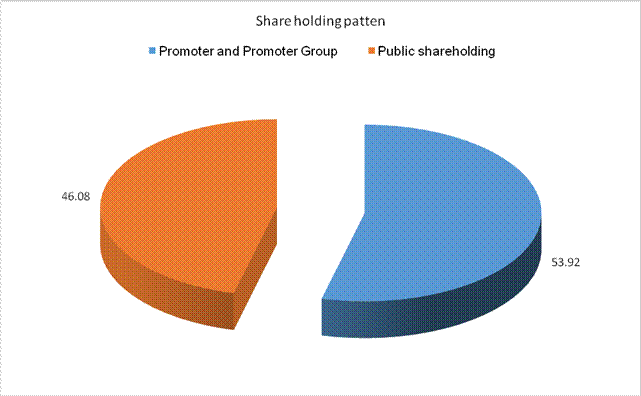
SHAREHOLDING PATTERN
AS ON 30.06.2015
|
Category of
Shareholder |
No. of Shares |
% of Holdings |
|
(A) Shareholding
of Promoter and Promoter Group |
||
|
|
|
|
|
|
139733428 |
47.86 |
|
|
8692358 |
2.98 |
|
|
148425786 |
50.83 |
|
|
|
|
|
|
9000000 |
3.08 |
|
|
9000000 |
3.08 |
|
Total
shareholding of Promoter and Promoter Group (A) |
157425786 |
53.92 |
|
(B) Public
Shareholding |
||
|
|
|
|
|
|
17969172 |
6.15 |
|
|
207366 |
0.07 |
|
|
95451 |
0.03 |
|
|
86112572 |
29.49 |
|
|
104384561 |
35.75 |
|
|
|
|
|
|
4547466 |
1.56 |
|
|
|
|
|
|
16624141 |
5.69 |
|
|
7247523 |
2.48 |
|
|
1752798 |
0.60 |
|
|
1331337 |
0.46 |
|
|
406858 |
0.14 |
|
|
14603 |
0.01 |
|
|
30171928 |
10.33 |
|
Total Public
shareholding (B) |
134556489 |
46.08 |
|
Total (A)+(B) |
291982275 |
100.00 |
|
(C) Shares held by
Custodians and against which Depository Receipts have been issued |
|
|
|
|
0 |
0.00 |
|
|
0 |
0.00 |
|
|
0 |
0.00 |
|
Total
(A)+(B)+(C) |
291982275 |
0.00 |
BUSINESS DETAILS
|
Line of Business : |
Manufacturing and Marketing Bulk Drugs, Formulations, Tablets and
Capsules, Syrups and Injectable. |
|
|
|
|
Products : |
Not Divulged |
|
|
|
|
Brand Names : |
Not Available |
|
|
|
|
Agencies Held : |
Not Available |
|
|
|
|
Exports : |
Not Divulged |
|
|
|
|
Imports : |
Not Divulged |
|
|
|
|
Terms : |
Not Divulged |
GENERAL INFORMATION
|
Suppliers : |
Not Divulged
|
||||||||||||||||||||||||||||||
|
|
|
||||||||||||||||||||||||||||||
|
Customers : |
Not Divulged
|
||||||||||||||||||||||||||||||
|
|
|
||||||||||||||||||||||||||||||
|
No. of Employees : |
Information declined by the management |
||||||||||||||||||||||||||||||
|
|
|
||||||||||||||||||||||||||||||
|
Bankers : |
A/c No.: 2000191000409 |
||||||||||||||||||||||||||||||
|
|
|
||||||||||||||||||||||||||||||
|
Facilities : |
(Rs.
In Million)
|
||||||||||||||||||||||||||||||
|
Auditors : |
|
|
|
|
|
Statutory
Auditors : |
|
|
Name : |
S R Batliboi and Company Chartered Accountants |
|
Address : |
Oval Office, 18 iLabs Centre, Hi-tech City, Madhapur, Hyderabad – 500081, Andhra Pradesh, India |
|
Internal
Auditors : |
|
|
Name : |
KPMG Chartered Accountants |
|
Address : |
1st Floor, Lodha Excelus, Apollo Mills Compound, N M Joshi
Marg, Mahalakshmi, Mumbai – 400011, Maharashtra, India |
|
|
|
|
Memberships : |
-- |
|
|
|
|
Collaborators : |
-- |
|
|
|
|
Subsidiaries : |
|
|
|
|
|
Joint ventures : |
Novagen Pharma (Pty) Limited, South Africa (Joint Venture of a Subsidiary) |
|
|
|
|
Enterprises over
which key management personnel or their relatives exercise significant
influence : |
|
CAPITAL STRUCTURE
AS ON 31.03.3015
Authorised Capital :
|
No. of Shares |
Type |
Value |
Amount |
|
|
|
|
|
|
660,000,000 |
Equity Shares |
Rs.1/- each |
Rs. 660.000 Million |
|
1,000,000 |
Preference Shares |
Rs. 100/- each |
Rs. 100.000 Million |
|
|
Total |
|
Rs. 760.000 Million |
Issued, Subscribed & Paid-up Capital :
|
No. of Shares |
Type |
Value |
Amount |
|
|
|
|
|
|
291,982,275 |
Equity Shares |
Rs.1/- each |
Rs. 292.000
Million |
|
|
|
|
|
A) Reconciliation of
the equity shares outstanding at the beginning and at the end of the year
|
|
As at March 31,
2015 |
|
|
Numbers |
Value |
|
|
Equity Shares |
|
|
|
At the beginning of the year |
291,457,021 |
291.500 |
|
Issued during the year under Employee Stock Option Plan |
525,254 |
0.500 |
|
Outstanding at the
end of the year |
291,982,275 |
292.000 |
B) Terms/rights
attached to equity shares
The Company has only one class of equity shares having a par values of Rs. 1 per share. Each holder of equity shares is entitled to one vote per share.
The Company declares and pays dividends in Indian rupees. The dividend proposed by the Board of Directors is subject to the approval of shareholders in the ensuing Annual General Meeting.
During the year ended March 31, 2015, the amount of dividend per share recognized as distribution to equity shareholders was Rs. 4.5 (March 31, 2014: Rs. 3) including interim dividend of Rs. 4.5 (March 31, 2014: Rs. 3).
In the event of liquidation of the Company, the holders of
equity shares will be entitled to receive remaining assets of the Company,
after distribution of all preferential amounts. However, no such preferential
amounts exist currently. The distribution will be in proportion to the number
of equity shares held by the shareholders.
C) Details of
shareholders holding more than 5% equity shares in the Company
|
|
As at Mach 31, 2015 |
|
|
Numbers |
% holding |
|
|
Mr. P.V. Ramprasad Reddy |
9000000 |
3.08 |
|
Mrs. P. Suneela Rani |
100661990 |
34.48 |
|
Total |
109661900 |
|
As per of the Company, including its register of shareholders/members and other declarations received from shareholders regarding beneficial interest, the above shareholding represents both legal and beneficial ownerships of shares.
AS ON 27.08.2014
Authorised Capital: Rs. 760.000 Million
Issued, Subscribed & Paid-up Capital: Rs. 583.965
Million
FINANCIAL DATA
[all figures are
in Rupees Million]
ABRIDGED
BALANCE SHEET
|
SOURCES OF FUNDS |
31.03.2015 |
31.03.2014 |
31.03.2012 |
|
I.
EQUITY
AND LIABILITIES |
|
|
|
|
(1)Shareholders' Funds |
|
|
|
|
(a) Share Capital |
292.000 |
291.500 |
291.200 |
|
(b) Reserves & Surplus |
53303.400 |
39832.400 |
29099.900 |
|
(c) Money
received against share warrants |
0.000 |
0.000 |
0.000 |
|
|
|
|
|
|
(2) Share Application money pending
allotment |
0.000 |
0.000 |
0.000 |
|
Total
Shareholders’ Funds (1) + (2) |
53595.400 |
40123.900 |
29391.100 |
|
|
|
|
|
|
(3)
Non-Current Liabilities |
|
|
|
|
(a) long-term borrowings |
6871.600 |
10323.100 |
10410.600 |
|
(b) Deferred tax liabilities (Net) |
2103.400 |
2052.500 |
679.400 |
|
(c) Other long term
liabilities |
0.000 |
0.000 |
0.000 |
|
(d) long-term
provisions |
226.500 |
83.000 |
85.000 |
|
Total Non-current
Liabilities (3) |
9201.500 |
12458.600 |
11175.000 |
|
|
|
|
|
|
(4)
Current Liabilities |
|
|
|
|
(a) Short
term borrowings |
22093.700 |
17825.500 |
17339.000 |
|
(b) Trade
payables |
11460.400 |
12361.600 |
9012.700 |
|
(c) Other
current liabilities |
5047.600 |
1923.900 |
680.400 |
|
(d) Short-term
provisions |
860.200 |
1061.800 |
647.500 |
|
Total Current
Liabilities (4) |
39461.900 |
33172.800 |
27679.600 |
|
|
|
|
|
|
TOTAL |
102258.800 |
85755.300 |
68245.700 |
|
|
|
|
|
|
II.
ASSETS |
|
|
|
|
(1) Non-current
assets |
|
|
|
|
(a) Fixed
Assets |
|
|
|
|
(i)
Tangible assets |
21900.100 |
19379.400 |
20119.100 |
|
(ii)
Intangible Assets |
0.000 |
0.000 |
0.000 |
|
(iii)
Capital work-in-progress |
2271.900 |
2038.900 |
1663.400 |
|
(iv)
Intangible assets under development |
0.000 |
0.000 |
0.000 |
|
(b) Non-current Investments |
9931.100 |
8725.900 |
7079.400 |
|
(c) Deferred tax assets (net) |
0.000 |
0.000 |
0.000 |
|
(d) Long-term Loan and Advances |
4189.400 |
4636.000 |
2891.000 |
|
(e) Other
Non-current assets |
285.500 |
163.300 |
185.800 |
|
Total Non-Current
Assets |
38578.000 |
34943.500 |
31938.700 |
|
|
|
|
|
|
(2)
Current assets |
|
|
|
|
(a)
Current investments |
196.400 |
0.300 |
0.400 |
|
(b)
Inventories |
21450.500 |
17118.100 |
14317.300 |
|
(c) Trade
receivables |
37089.400 |
29701.200 |
17305.900 |
|
(d) Cash
and cash equivalents |
111.300 |
97.200 |
1145.700 |
|
(e)
Short-term loans and advances |
4008.500 |
3147.300 |
2759.800 |
|
(f) Other
current assets |
824.700 |
747.700 |
777.900 |
|
Total
Current Assets |
63680.800 |
50811.800 |
36307.000 |
|
|
|
|
|
|
TOTAL |
102258.800 |
85755.300 |
68245.700 |
PROFIT
& LOSS ACCOUNT
|
|
PARTICULARS |
31.03.2015 |
31.03.2014 |
31.03.2012 |
|
|
SALES |
|
|
|
|
|
Income |
80951.000 |
71107.100 |
54251.000 |
|
|
Other Income |
672.200 |
748.000 |
265.100 |
|
|
TOTAL |
81623.200 |
71855.100 |
54516.100 |
|
|
|
|
|
|
|
Less |
EXPENSES |
|
|
|
|
|
Cost of Materials Consumed |
39203.300 |
34223.400 |
30536.400 |
|
|
Purchases of Stock-in-Trade |
157.600 |
968.900 |
780.900 |
|
|
Changes in inventories of
finished goods, work-in-progress and Stock-in-Trade |
(1590.900) |
(357.500) |
(1210.800) |
|
|
Employees benefits expense |
6687.500 |
5142.100 |
4314.200 |
|
|
Other expenses |
13989.300 |
11935.500 |
10249.700 |
|
|
TOTAL |
58446.800 |
51912.400 |
44670.400 |
|
|
|
|
|
|
|
Less |
PROFIT
BEFORE INTEREST, TAX, DEPRECIATION AND AMORTISATION |
23176.400 |
19942.700 |
9845.700 |
|
|
|
|
|
|
|
Less |
FINANCIAL
EXPENSES |
1321.400 |
2888.400 |
2500.600 |
|
|
|
|
|
|
|
|
PROFIT
BEFORE TAX, DEPRECIATION AND AMORTISATION |
21855.000 |
17054.300 |
7345.100 |
|
|
|
|
|
|
|
Less/ Add |
DEPRECIATION/
AMORTISATION |
2451.500 |
1859.700 |
1713.900 |
|
|
|
|
|
|
|
|
PROFIT BEFORE
TAX |
19403.500 |
15194.600 |
5631.200 |
|
|
|
|
|
|
|
Less |
TAX |
4240.000 |
3473.700 |
671.300 |
|
|
|
|
|
|
|
|
PROFIT AFTER TAX
|
15163.500 |
11720.900 |
4959.900 |
|
|
|
|
|
|
|
|
EARNINGS IN
FOREIGN CURRENCY |
|
|
|
|
|
Export Earnings |
62514.100 |
53269.000 |
38710.100 |
|
|
TOTAL EARNINGS |
62514.100 |
53269.000 |
38710.100 |
|
|
|
|
|
|
|
|
IMPORTS |
|
|
|
|
|
Raw Materials |
21210.500 |
20877.900 |
17845.800 |
|
|
Stores & Spares |
185.100 |
111.200 |
84.400 |
|
|
Capital Goods |
1210.800 |
388.200 |
349.100 |
|
|
TOTAL IMPORTS |
22606.400 |
21377.300 |
18279.300 |
|
|
|
|
|
|
|
|
Earnings Per
Share (Rs.) |
|
|
|
|
|
- Basic |
52.01 |
40.24 |
17.04 |
|
|
- Diluted |
51.97 |
40.20 |
17.02 |
CURRENT MATURITIES
OF LONG TERM DEBT DETAILS
|
Particulars |
31.03.2015 |
31.03.2014 |
31.03.2012 |
|
Current Maturities of Long term debt |
3882.000 |
1103.000 |
70.300 |
|
Cash generated from operations |
10163.200 |
6670.700 |
3940.900 |
|
Net cash flow from (used in) operation |
5904.100 |
3280.300 |
2748.700 |
QUARTERLY RESULTS
(Rs.
In Million)
|
PARTICULARS |
30.06.2015 Unaudited |
|
Net Sales |
22196.200 |
|
Total Expenditure |
16256.700 |
|
PBIDT (Excl OI) |
5939.500 |
|
Other Income |
247.500 |
|
Operating Profit |
6187.000 |
|
Interest |
150.400 |
|
Exceptional Items |
NA |
|
PBDT |
6036.600 |
|
Depreciation |
631.500 |
|
Profit Before Tax |
5405.100 |
|
Tax |
1344.900 |
|
Provisions and contingencies |
NA |
|
Profit After Tax |
4060.200 |
|
Extraordinary Items |
NA |
|
Prior Period Expenses |
NA |
|
Other Adjustments |
NA |
|
Net Profit |
4060.200 |
KEY
RATIOS
|
PARTICULARS |
|
31.03.2015 |
31.03.2014 |
31.03.2012 |
|
Net Profit Margin (PAT / Sales) |
(%) |
18.73 |
16.48 |
9.14 |
|
|
|
|
|
|
|
Operating Profit Margin (PBIDT/Sales) |
(%) |
28.63 |
28.05 |
18.15 |
|
|
|
|
|
|
|
Return on Total Assets (PBT/Total Assets} |
(%) |
21.55 |
20.26 |
9.46 |
|
|
|
|
|
|
|
Return on Investment (ROI) (PBT/Networth) |
|
0.36 |
0.38 |
0.19 |
|
|
|
|
|
|
|
Debt Equity Ratio (Total Debt /Networth) |
|
0.54 |
0.70 |
0.94 |
|
|
|
|
|
|
|
Current Ratio (Current Asset/Current Liability) |
|
1.61 |
1.53 |
1.31 |
STOCK
PRICES
|
Face Value |
Rs. 1.00/- |
|
Market Value |
Rs. 757.20/- |
FINANCIAL ANALYSIS
[all figures are
in Rupees Million]
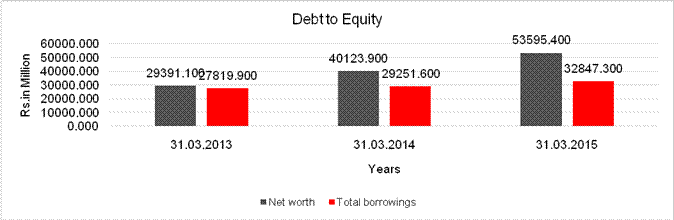
DEBT EQUITY RATIO
|
Particular |
31.03.2013 |
31.03.2014 |
31.03.2015 |
|
|
(Rs.
In Million) |
(Rs.
In Million) |
(Rs.
In Million) |
|
Share Capital |
291.200 |
291.500 |
292.000 |
|
Reserves & Surplus |
29099.900 |
39832.400 |
53303.400 |
|
Share Application money
pending allotment |
0.000 |
0.000 |
0.000 |
|
Net
worth |
29391.100 |
40123.900 |
53595.400 |
|
|
|
|
|
|
long-term borrowings |
10410.600 |
10323.100 |
6871.600 |
|
Short term borrowings |
17339.000 |
17825.500 |
22093.700 |
|
Current Maturities of Long
Term Debt |
70.300 |
1103.000 |
3882.000 |
|
Total
borrowings |
27819.900 |
29251.600 |
32847.300 |
|
Debt/Equity
ratio |
0.947 |
0.729 |
0.613 |
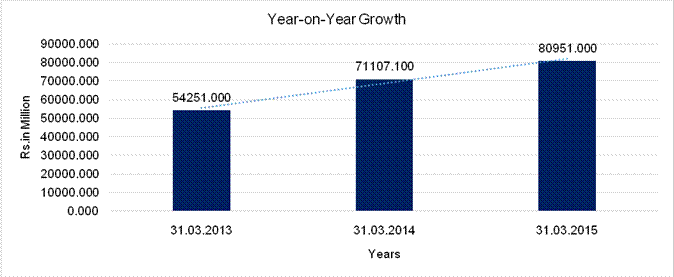
YEAR-ON-YEAR GROWTH
|
Year
on Year Growth |
31.03.2013 |
31.03.2014 |
31.03.2015 |
|
|
(Rs.
In Million) |
(Rs.
In Million) |
(Rs.
In Million) |
|
Sales |
54251.000 |
71107.100 |
80951.000 |
|
|
|
31.071 |
13.844 |
NET PROFIT MARGIN
|
Net
Profit Margin |
31.03.2013 |
31.03.2014 |
31.03.2015 |
|
|
(Rs.
In Million) |
(Rs.
In Million) |
(Rs.
In Million) |
|
Sales |
54251.000 |
71107.100 |
80951.000 |
|
Profit |
4959.900 |
11720.900 |
15163.500 |
|
|
9.14% |
16.48% |
18.73% |
LOCAL AGENCY FURTHER INFORMATION
|
Sr. No. |
Check list by
info agents |
Available in
Report (Yes/No) |
|
1 |
Year of establishment |
Yes |
|
2 |
Constitution of the entity -Incorporation
details |
Yes |
|
3 |
Locality of the entity |
Yes |
|
4 |
Premises details |
No |
|
5 |
Buyer visit details |
---- |
|
6 |
Contact numbers |
Yes |
|
7 |
Name of the person contacted |
No |
|
8 |
Designation of contact person |
No |
|
9 |
Promoter’s background |
No |
|
10 |
Date of Birth of Proprietor / Partners /
Directors |
No |
|
11 |
Pan Card No. of Proprietor / Partners |
No |
|
12 |
Voter Id Card No. of Proprietor / Partners |
No |
|
13 |
Type of business |
Yes |
|
14 |
Line of Business |
Yes |
|
15 |
Export/import details (if applicable) |
No |
|
16 |
No. of employees |
No |
|
17 |
Details of sister concerns |
Yes |
|
18 |
Major suppliers |
No |
|
19 |
Major customers |
No |
|
20 |
Banking Details |
Yes |
|
21 |
Banking facility details |
Yes |
|
22 |
Conduct of the banking account |
----- |
|
23 |
Financials, if provided |
Yes |
|
24 |
Capital in the business |
Yes |
|
25 |
Last accounts filed at ROC, if applicable |
Yes |
|
26 |
Turnover of firm for last three years |
Yes |
|
27 |
Reasons for variation <> 20% |
----- |
|
28 |
Estimation for coming financial year |
No |
|
29 |
Profitability for last three years |
Yes |
|
30 |
Major shareholders, if available |
Yes |
|
31 |
External Agency Rating, if available |
Yes |
|
32 |
Litigations that the firm/promoter
involved in |
Yes |
|
33 |
Market information |
----- |
|
34 |
Payments terms |
No |
|
35 |
Negative Reporting by Auditors in the
Annual Report |
No |
LITIGATION DETAILS
|
ITTA
255/2015
ITTASR 4523/2010
CASE IS:PENDING PETITIONER THE COMMR OF
INCOME TAX-I, HYDERABAD V/s AUROBINDO
PHARMA LIMITED, HYDERABAD PET. ADV.:
PRASAD (SC FOR INCOME TAX)
RES. ADV.: SUBJECT: Income
Tax Tribunal Appeals
DISTRICT: HYDERABAD ------------------------------------------------------------------------------------------------------------------------------------------------------- FILING DATE:
29.11.2010
POSTING STATGE: FOR ADMISSION REG. DATE : 13.07.2015
LISTING DATE : 08.10.2015 STATUS :------------ HON’BLE
JUDGE(S): G. CHANDRAIAH CHALLA KODANDA RAM |
ECONOMIC BACKGROUND
The growth rate in GDP at constant market prices in 2012-13 was 5.1%, which increased to 6.9% in 2013-14 and it is expected to further increase to 7.4% in 2014-15 (according to advanced estimates). Growth at market prices for 2015-16 is expected to be 8.1-to 8.5%. The Economic Survey says that expectation for such a growth rate is due to a number of reforms that have already been undertaken and more that are being planned for.
The decline in inflation by over 600 basis points since late 2013 and reduction of current account deficit from a peak of 6.7% of GDP in the third quarter of 2012-13 to about 1% in the ensuing fiscal year has made India an attractive investment destination.
The expected high growth rate in a favorable environment, has created a historic moment of opportunity to propel India into a double-digit growth trajectory.
The International Monetary Fund has forecast India's growth to strengthen from 7.2% in 2014 to 7.5% in both 2015 and 2016, overtaking China's growth - for the first time since 1999 - that it projected will slow down to 6.8%.
The World Bank too projected India's growth to accelerate to 7.5% in 2015, but added that on the back of significant acceleration of investment, growth could even reach 8% in 2017-18. The country is attempting to shift from consumption to investment-led growth, at a time when China is undergoing the opposite transition, the Bank said in its bi-annual South Asia Economic Focus report.
Several initiatives taken by the government are expected to favourably impact the Indian economy and provide impetus to industries from 2015-16 and beyond.
INDUSTRY PERSPECTIVE
Globally, the pharmaceutical industry is estimated to have had revenues of USD 1 trillion in 2014, about 2.1% higher than revenues of USD 980.1 billion achieved in 2013. North America (the US and Canada) contributed 41% of sales, while Europe contributed 27.4%. Nominal spending on medicines reached USD 373.9 billion in the US in 2014, up 13.1% year over year, the highest growth level since 2001 when growth was 17.0%, according to a recent analysis by the IMS Institute for Healthcare Informatics, with a record volume of 4.3 billion prescriptions filled.
The direction of the US market is critical for the overall performance of the global pharmaceutical industry since US is the largest single national pharmaceutical market in the world. The year 2014 saw recovery in this market, which reached its highest growth rate since 2001. The year 2014 was also a landmark year with a major change in US healthcare policy with the implementation of the Affordable Care Act
The 10 largest pharmaceutical companies straddle over one-third of the industry, several with sales of more than USD 10 billion a year and profit margins of about 30%. Six are based in the United States and four in Europe. It is estimated that North and South America, Europe and Japan will continue to account for a full 85% of the global pharmaceuticals market well into the 21st century. According to World Health Organization (WHO), companies currently spend one-third of all sales revenue on marketing their products - roughly twice what they spend on research and development.
According to WHO, expenditure on medicines accounts for a major proportion of health costs in developing countries. Equally, access to treatment is heavily dependent on the availability of affordable medicines without compromising on drug safety, quality or efficacy. It is estimated that one-third of the developing world's people are unable to receive or purchase essential medicines on a regular basis. The provision of access to medicines depends on four factors:
- Rational selection and use
of medicines
- Affordable prices
- Sustainable financing
- Reliable health and supply
systems.
Access to affordably priced drugs continues to be an important area of work being undertaken by all stakeholders. For instance, WHO has initiated several steps both with individual companies and countries to extend availability of drugs at affordable prices. The strategies to increase affordability of medicines include:
- Reducing taxes, tariffs
and margins, and developing pricing policies
- Generic medicines
- Good procurement practices
- Equity pricing and competition
for single-source products. Equity pricing policies ensure that, from the
point of view of the community and the individual, the price of a drug is
fair, equitable, and affordable
- Differential pricing
(sometimes also called tiered pricing). The sale of the same good to
different buyers at different prices, with the aim of improving the
affordability of drugs while generating revenue for the pharmaceutical
industry. For instance, differential pricing has reduced the cost of many
antiretroviral HIV/AIDS therapies by up to 90% in low-income countries,
although they continue to be sold at market price in developed countries
- Price information and
therapeutic substitution
- Promotion of competition,
use of safeguards compatible with the agreement on Trade-Related Aspects
of Intellectual Property Rights (TRIPS), such as parallel importation and
compulsory licensing.
OVERVIEW
Risk management at Aurobindo is an enterprise-wide function and a holistic approach has been adopted based on COSO Enterprise Risk Management (ERM) Framework. The framework encompasses practices relating to identification, assessment, monitoring and mitigation of various risks towards achievement of business objectives.
The ERM at Aurobindo is aimed at dealing with uncertainty and to minimize adverse risk impact on business objectives and enables the Company to leverage business opportunities effectively. Aurobindo relentlessly endeavours not only to minimize risks but convert them into business opportunities that allow it to maximize returns for shareholders from diverse situations.
Aurobindo has aligned risk management process with every
part of the critical business processes to ensure that the processes are
designed and operated effectively towards the achievement of business objectives.
Risks are identified and assessed across all key business functions in a
holistic manner rather than in silos. Aurobindo's core values and ethics also
provide the platform for the Company's risk management practices.
PERFORMANCE REVIEW
The Company delivered financially satisfactory results by executing on core strategies and setting the stage for long term growth. The revenue from operations was Rs. 80951.000 million on a standalone basis, an increase of 13.8% over 2013-14. On a standalone basis, the EBITDA for 2014-15 was Rs. 23176.400 million, an increase of 16.2% over the previous year.
Profit before tax was increased toRs.19403.500 million from Rs. 15194.600 million in the previous year. This 27.7% increase was achieved by ramping up the volumes, improving productivity and saving on finance costs. Profit after tax was higher by 29.4% for the year at Rs. 15163.500 as compared to Rs. 11720.900 million in the previous fiscal. Diluted earnings per share on standalone basis is `51.97 as compared to `40.20 in the previous year.
Members will be pleased to know that the Company did well at the consolidated level, as well. In 2014-15, the consolidated revenues increased by 49.6% to Rs. 121205.200 million. EBITDA for the year grew 23.4% and was Rs. 26603.300 million as compared to Rs. 21552.100 million in 2013-14 and diluted earnings per share grew by 34.3% to `54.0 reflecting strong execution and continued momentum in the business.
The Company made the necessary long term investments to advance the geographical reach of formulations, to grow both in the US and Europe. The performance in 2014-15 was driven by competitive edge of the products across the portfolio. Over the financial year, formulation sales grew by 42% in the US and 375% in Europe, complimented by the acquisition of commercial operations from Actavis across seven Western European countries with effect from April 1, 2014.
Formulations in the US contributed 50.5% to the overall formulations revenues in the year under review and share of Europe has increased to 33.4% in 2014-15 from 12.5% in the previous year, demonstrating the focus on both the markets.
Formulation sales across all geographies grew by 77.7% to Rs. 95586.000 million as compared Rs. 53785.000 million in 2013-14. Formulations business constituted 77.9% of the revenues while active ingredients make the balance 22.1%.
In the US, Aurobindo Pharma continued to deliver strong revenue growth with its customer relationships and increased market penetration of existing products.
While sales of several generic products have been raised through the year, the growth has been more skewed towards controlled substances and non-institutional business. The injectable business in the US continued to outperform and grew by 88.7% over fiscal 2013-14.
In addition to the US, THE Company is now present in over 150 countries with growing visibility in advanced markets such as France, Germany, Spain and Italy
Aurobindo has delivered to expectations in Europe. The revenues from Europe stood at Rs. 31947.000 million, significantly growing over the previous year. This has been primarily on account of the acquisition of the products from Actavis in Western European markets. Presently, France is the biggest market in Europe for Aurobindo followed by Germany, Netherlands, Spain, UK and Portugal. A concerted effort is being made to create an impact in Western Europe, and reach a critical mass.
Aurobindo has been supporting several multilateral agencies to provide cost effective treatment of HIV/AIDS patients. The Company started executing a few notable tenders and stepped up deliveries across regions, of triple combination products. Anti-retroviral formulations sales increased by about 14.7% over the previous year. The Company's products are estimated to have targeted treatment of over 2 million HIV/AIDs affected people across 110 countries.
In the emerging markets such as Africa, CIS, Latin America and MENA (Middle East and North Africa), there was a major shift from tenders/generics to more sustainable and better valued branded generics, especially in the high value therapy areas of cardiovasculars and neuro-psychiatry ailments. Close customer interaction helped gain traction in markets such as Malaysia, Myanmar, Philippines, Vietnam and Cambodia.
Proportion of revenue from active ingredients came down from 34.7% to about 22.1%, since there was an exponential growth in the formulations business, as compared to the API business. The Company sees opportunities for growth of API business. Hence, the manufacturing capacities of API are being further expanded.
During the year, The Company completed the acquisition of the assets of nutritional supplement maker Natrol LLC, which was acquired for a consideration of Rs. 8344.000 million. Natrol manufactures and sells quality nutritional supplements in the US and select international markets. It offers branded products including vitamins, minerals, and supplements; diet and weight management products; sports nutrition products; and products for hair, skin, and nails. This acquisition is a strategic move to gain an entry for Aurobindo into the growing nutraceutical segment
The US based Natrol is a leading 35 year old nutraceuticals manufacturer with established brands and was acquired with all the manufacturing assets, personnel and commercial infrastructure including the well established brands of Natrol along with an agreement to take on certain liabilities. The due approval was obtained from authorities and the acquisition was completed on December 4, 2014. In the consolidated financial statements, the financials of the acquired entity have been integrated effective that date.
OUTLOOK
Marketing efforts are focused on ramping up revenues across all the geographies. The Company will build on its customer touch points and relationships to reach higher volume of niche and differentiated products.
There have been several new launches in 2014-15 and it is expected that there will a further thrust to improve the presence in both US and Europe. The market share of the injectable side of the business is expected to expand with increased supplies from both US and India. API volumes are being raised to cater to the opportunities for in-house formulations. External volume sales of API will address the needs of high value products. Overall, the emphasis will be both on the revenues as well as the bottom line.
Manufacturing costs will continue to remain a focus area. Aurobindo has a good foundation of reliable sourcing and cost effective manufacturing systems and is exploring further ways of reducing costs and strengthening competitiveness
Capacity utilization is improving at all production units. The Company has an enviable product basket with a large portfolio of regulatory approvals. Aurobindo will capitalize on its inherent strengths, some of which are iterated below:
- Cost effective vertically
integrated manufacturing systems
- Current Good Manufacturing
Practices (cGMP) and regulatory compliant facilities producing
high-quality APIs and finished dosage formulations
- Best-in class, best-in
cost, large manufacturing capacity
- High visibility in API and
generics
- Strong financial position
with ability to scale up
- Highly skilled
professionals with expertise and competence to deliver on development,
product processes and regulatory standards
- Access to new technologies
The Company has set a vision to build businesses that impact their respective addressable markets, are respected for customer centric products and services, meet industry benchmarks in productivity of resources, are recognized for quality and compliance standards and in the ultimate analysis, create societal wealth for all stakeholders.
In financial terms, the objective is to lower volatility, strive for higher predictable and calibrated growth, and improve EBITDA margin and Return on Investment higher than industry average. The target is to stay cash flow positive, improve the quality of the balance sheet, lower the leverage, reduce interest outgo and expand earnings year-on-year.
UNSECURED LOAN
|
Particulars |
As
on 31.03.2015 |
As
on 31.03.2014 |
|
LONG TERM
BORROWING |
|
|
|
Deferred sales tax loan |
413.300 |
537.000 |
|
SHORT TERM
BORROWING |
|
|
|
Buyers credit |
784.600 |
25.100 |
|
Packing credit loans |
12677.400 |
7884.500 |
|
|
|
|
|
Total |
13875.300 |
8446.600 |
|
|
|
|
INDEX OF CHARGES
|
S.No. |
Charge ID |
Date of Charge Creation/Modification |
Charge amount secured |
Charge Holder |
Address |
Service Request Number (SRN) |
|
1 |
10402714 |
20/02/2015 * |
1,640,000,000.00 |
DBS Bank Ltd |
Salarpuria Windsor,
No.3, Ulsoor Road, Bengaluru, INDIA |
C47353040 |
|
2 |
10359357 |
25/05/2012 |
1,560,000,000.00 |
IFCI Limited |
IFCI Tower, 5-9-13,
Taramandal Complex, Saifabad, INDIA |
B41106147 |
|
3 |
10359358 |
25/05/2012 |
1,300,000,000.00 |
IFCI Limited |
IFCI Tower, 5-9-13,
Taramandal Complex, Saifabad, INDIA |
B41106543 |
|
4 |
10269583 |
22/09/2011 * |
379,750,000.00 |
Axis Bank Limited |
TRISHUL 3RD FLOOR OPP SAMARTHESHWAR TEMPLE, LAW GARDEN ELLISBRIDGE, AHMEDABAD, Gujarat - 380006, INDIA |
B22085377 |
|
5 |
10265641 |
28/12/2010 |
1,856,000,000.00 |
ING Bank N V |
Singapore Branch, 9
Raffles Place,#19-02 Republic Singapore, - 048619, SINGAPORE |
B03586161 |
|
6 |
10262723 |
28/12/2010 |
2,250,000,000.00 |
IFCI Limited |
IFCI TOWER, 5-9-13, Taramandal Complex, Safifabad, Hyderabad, Andhra Pradesh - 500004, INDIA |
B03928439 |
|
7 |
10266490 |
28/12/2010 |
1,645,000,000.00 |
IFCI Limited |
IFCI TOWER, 5-9-13, Taramandal Complex, Safifabad, Hyderabad, Andhra Pradesh - 500004, INDIA |
B05139555 |
|
8 |
10215595 |
19/03/2014 * |
2,050,000,000.00 |
ICICI Bank Limited |
ICICI Bank Tower, Plot No.12, Nanakram Guda, 6th Floor, Tower II, North Wing, Hyderabad, Andhra Pradesh - 500032, INDIA |
C03655834 |
|
9 |
10044936 |
25/08/2014 * |
1,640,000,000.00 |
HDFC BANK LIMITED |
HDFC BANK HOUSESENAPATI BAPAT MARG, LOWER PAREL W, MUMBAI, Maharashtra - 400013, INDIA |
C21711395 |
|
10 |
10030551 |
19/05/2015 * |
3,300,000,000.00 |
IDBI Bank Limited |
5-9-89/1 & 2,
Chapel Road, PB No.370, Hyderabad, INDIA |
C56036817 |
* Date of charge modification
STATEMENT OF STANDALONE UNAUDITED FINANCIAL RESULTS
FOR THE QUARTER ENDED 30TH JUNE 2015
(Rs. in million)
|
Sr. No. |
Particulars |
Quarter Ended |
|
30.06.2015 |
||
|
Unaudited |
||
|
Part I |
|
|
|
1. |
Income from Operations |
|
|
|
a) Net Sales / Income
from Operations |
21631.400 |
|
|
b) Other Operating Income |
564.800 |
|
|
Total Income from
Operations (net) |
22196.200 |
|
2. |
Expenditure |
|
|
|
a) Cost of materials consumed |
11051.500 |
|
|
b) Purchase of
stock-in-trade |
0.900 |
|
|
c) Changes in inventories of finished goods,
work-in-progress and stock-in-trade |
(523.100) |
|
|
d) Employee benefits
expense |
1918.200 |
|
|
e) Depreciation and
amortisation expense |
631.500 |
|
|
f) Power and Fuel Charges |
0.000 |
|
|
g) Other expenses |
3759.400 |
|
|
Total Expenses |
16838.400 |
|
3. |
Profit/ (Loss) from Operations before Other
Income, Exchange gain/(loss), Finance costs and Exceptional items (1-2) |
5357.800 |
|
4. |
Other Income |
247.500 |
|
5. |
Profit /(Loss) from Ordinary activities before finance costs and
Exceptional items (3+4a+4b) |
5605.300 |
|
6. |
Finance
Costs |
150.400 |
|
7. |
Foreign
exchange |
49.800 |
|
8. |
Profit
/ (Loss) from ordinary activities after Finance costs but before Exceptional
items (5-6) |
5405.100 |
|
9. |
Exceptional
items |
-- |
|
10. |
Profit/
(Loss) from ordinary activities before tax (7+8) |
5405.100 |
|
11. |
Tax
expenses |
1344.900 |
|
12. |
Net
Profit / (Loss) from ordinary activities after tax (9-10) |
4060.200 |
|
13. |
Extraordinary items |
-- |
|
14. |
Net Profit / (Loss) for the period (11+12) |
4060.200 |
|
15. |
Paid-up equity share
capital (Face Value of Rs. 10 per share) |
292.000 |
|
16. |
Reserve excluding
Revaluation reserve |
|
|
17. |
Earnings Per Share (EPS)
before and after extraordinary items (of Rs. 10/- each) a) Basic b) Diluted |
13.91 13.90 |
|
|
|
|
|
Part II |
|
|
|
A. |
PARTIULARS
OF SHAREHOLDINGS |
|
|
|
Public Shareholding |
|
|
|
- Number of Shares |
134556489 |
|
|
- Percentage of
Shareholding |
46.08 |
|
|
Promoters and Promoter Group Shareholding |
|
|
|
a) Pledged/Encumbered |
|
|
|
- Number of Shares |
8523000 |
|
|
- Percentage of Shares (as
a % of the Total Shareholding of promoter and promoter group) |
5.41 |
|
|
- Percentage of Shares
(as a % of the Total Share Capital of the Company) |
2.92 |
|
|
b) Non Encumbered |
|
|
|
- Number of Shares |
148902786 |
|
|
- Percentage of Shares (as
a % of the Total Shareholding of Promoter and Promoter Group) |
94.59 |
|
|
- Percentage of Shares
(as a % of the Total Share Capital of the Company) |
51.00 |
|
PARTICULARS |
For the quarter ended 30th June 2015 |
|
B INVESTORS
COMPLAINTS |
|
|
Pending at
the beginning of the quarter |
Nil |
|
Received
during the quarter |
6 |
|
Disposed
during the quarter |
6 |
|
Remaining
unresolved at the end of the quarter |
Nil |
Note:
1. The above unaudited financial results as reviewed by the Audit Committee have been approved by the Board at its meeting held on August 12, 2015. A Limited Review of the above stand alone financial results has been carried out by the Statutory Auditors.
2. The consolidated financial results have been prepared in accordance with AS - 21 on 'Consolidated Financial Statement' and AS-27 'Financial Reporting of interests in Joint Ventures' and includes financial results of all Subsidiaries and a Joint Venture.
3. The Company's operations fall within a single primary business segment viz. 'Pharmaceutical Products'.
4. Sales of standalone for the current quarter, include exports Rs. 177,669 lakhs (Quarter ended June 30, 2014 Rs.1597.820 million.
5. Foreign exchange (gain)/loss for standalone and consolidated includes exchange difference of Rs. 6,424 lakhs, Rs. Nil lakhs, Rs. 104.900 million, for three months ended June 30, 2015, March 31, 2015, and June 30, 2014 respectively and Rs. 755.600 million for the year ended March 31, 2015 arising from foreign currency borrowings to the extent that they are regarded as an adjustment to finance cost as per para 4(e) of "AS 16" on Borrowing costs.
6. The Board of Directors at their meeting held on September 12, 2013 decided to transfer its injectable unit of the Company on a going concern basis comprising assets and liabilities pertaining to the said unit to its wholly owned subsidiary Curepro Parenterals Limited w.e.f. April 1, 2014. The same is subject to requisite consent, approval or permission of the statutory or regulatory authorities. Pending such approvals, no effect of this scheme has been given in the above results.
7. Aurobindo Pharma (Australia} Pty Limited and its subsidiary Aurobindo Parma NZ Limited ceased to be step down subsidiaries of the Company w.e.f 10th April, 2015.
8. The Company on July 22, 2015, has allotted 291,982,275 equity shares of Re. 1/- each to the shareholders of the Company as Bonus shares in the ratio of 1:1. Consequent to the aforesaid allotment, the paid up equity share capital of the Company has increased from 291,982,275 Equity Shares of Re. 1/- each to 583,964,550 Equity Shares of Re. 1/- each.
9. The figures of quarter ended March 31, 2015 are the balancing figures between audited figures in respect of the full financial year ended March 31st and unaudited published year to date figures upto the third quarter ended December 31st. The unaudited consolidated results published year to date figures upto the third quarter ended December 31st were not subject to limited review and the unaudited standalone results were subject to limited review.
10. During the previous year, on December 4, 2014, Company's USA subsidiary Aurobindo Pharma USA Inc. has acquired Natrol LLC, USA. The above Consolidated results for the quarter ended June 30, 2015 and for the quarter ended and year ended March 31, 2015 includes financial results of operations of Natrol LLC, USA from December 4, 2014. The corresponding figures of the quarter ended June 30, 2014 are not comparable.
11. The Board has approved an interim dividend @50% i.e. Re.0.50 (Paise fifty only) per equity share of Re. 1/- (Rupee One only) for the year 2015-16.
12. Previous period figures have been regrouped/rearranged wherever considered necessary to conform to the current period presentation.
CONTINGENT
LIABILITIES:
(Rs. in million)
|
PARTICULARS |
31.03.2015 |
|
Outstanding bank guarantees |
718.500 |
|
Corporate guarantees for loans taken by 100% subsidiaries |
3,090.700 |
|
Claims arising from disputes not acknowledged as debts -
indirect taxes (excise duty and service tax) |
272.400 |
|
Claims arising from disputes not acknowledged as debts -
direct taxes |
308.800 |
|
Claims against the Company not acknowledged as debts - other
duties/claims |
150.300 |
|
Bills discounted with banks |
1048.500 |
|
|
|
|
Total |
5589.200 |
FIXED ASSETS
- Leasehold
Land
- Freehold Land
- Plant and
Machinery
- Furniture and
Fixture
- Vehicles
- Office
Equipment
CMT REPORT (Corruption, Money Laundering & Terrorism]
The Public Notice information has been collected from various sources
including but not limited to: The Courts, India Prisons Service,
Interpol, etc.
1] INFORMATION ON
DESIGNATED PARTY
No exist designating subject or any of its beneficial owners,
controlling shareholders or senior officers as terrorist or terrorist
organization or whom notice had been received that all financial transactions
involving their assets have been blocked or convicted, found guilty or against
whom a judgement or order had been entered in a proceedings for violating
money-laundering, anti-corruption or bribery or international economic or
anti-terrorism sanction laws or whose assets were seized, blocked, frozen or
ordered forfeited for violation of money laundering or international
anti-terrorism laws.
2] Court Declaration :
No records exist to suggest that subject is
or was the subject of any formal or informal allegations, prosecutions or other
official proceeding for making any prohibited payments or other improper
payments to government officials for engaging in prohibited transactions or
with designated parties.
3] Asset Declaration :
No records exist to suggest that the property or assets of the subject
are derived from criminal conduct or a prohibited transaction.
4] Record on Financial
Crime :
Charges or conviction
registered against subject: None
5] Records on Violation of
Anti-Corruption Laws :
Charges or
investigation registered against subject: None
6] Records on Int’l Anti-Money
Laundering Laws/Standards :
Charges or
investigation registered against subject: None
7] Criminal Records
No
available information exist that suggest that subject or any of its principals
have been formally charged or convicted by a competent governmental authority
for any financial crime or under any formal investigation by a competent
government authority for any violation of anti-corruption laws or international
anti-money laundering laws or standard.
8] Affiliation with
Government :
No record
exists to suggest that any director or indirect owners, controlling
shareholders, director, officer or employee of the company is a government
official or a family member or close business associate of a Government
official.
9] Compensation Package :
Our market
survey revealed that the amount of compensation sought by the subject is fair
and reasonable and comparable to compensation paid to others for similar
services.
10] Press Report :
No press reports / filings exists on
the subject.
CORPORATE GOVERNANCE
MIRA INFORM as part of its Due Diligence do provide comments on
Corporate Governance to identify management and governance. These factors often
have been predictive and in some cases have created vulnerabilities to credit
deterioration.
Our Governance Assessment focuses principally on the interactions
between a company’s management, its Board of Directors, Shareholders and other
financial stakeholders.
CONTRAVENTION
Subject is not known to have contravened any existing local laws, regulations
or policies that prohibit, restrict or otherwise affect the terms and
conditions that could be included in the agreement with the subject.
FOREIGN EXCHANGE RATES
|
Currency |
Unit
|
Indian Rupees |
|
US Dollar |
1 |
Rs. 65.16 |
|
UK Pound |
1 |
Rs. 99.78 |
|
Euro |
1 |
Rs. 73.33 |
INFORMATION DETAILS
|
Information
Gathered by : |
SUV |
|
|
|
|
Analysis Done by
: |
RAS |
|
|
|
|
Report Prepared
by : |
JYO |
SCORE & RATING EXPLANATIONS
|
SCORE FACTORS |
RANGE |
POINTS |
|
HISTORY |
1~10 |
6 |
|
PAID-UP CAPITAL |
1~10 |
7 |
|
OPERATING SCALE |
1~10 |
7 |
|
FINANCIAL
CONDITION |
|
|
|
--BUSINESS SCALE |
1~10 |
7 |
|
--PROFITABILITY |
1~10 |
7 |
|
--LIQUIDITY |
1~10 |
6 |
|
--LEVERAGE |
1~10 |
6 |
|
--RESERVES |
1~10 |
7 |
|
--CREDIT LINES |
1~10 |
7 |
|
--MARGINS |
-5~5 |
-- |
|
DEMERIT POINTS |
|
|
|
--BANK CHARGES |
YES/NO |
YES |
|
--LITIGATION |
YES/NO |
YES |
|
--OTHER ADVERSE INFORMATION |
YES/NO |
NO |
|
MERIT POINTS |
|
|
|
--SOLE DISTRIBUTORSHIP |
YES/NO |
NO |
|
--EXPORT ACTIVITIES |
YES/NO |
NO |
|
--AFFILIATION |
YES/NO |
YES |
|
--LISTED |
YES/NO |
YES |
|
--OTHER MERIT FACTORS |
YES/NO |
YES |
|
DEFAULTER |
|
|
|
--RBI |
YES/NO |
NO |
|
--EPF |
YES/NO |
NO |
|
TOTAL |
|
60 |
This score serves as a reference to assess SC’s
credit risk and to set the amount of credit to be extended. It is calculated
from a composite of weighted scores obtained from each of the major sections of
this report. The assessed factors and their relative weights (as indicated
through %) are as follows:
Financial
condition (40%) Ownership
background (20%) Payment
record (10%)
Credit history
(10%) Market trend (10%) Operational size
(10%)
RATING EXPLANATIONS
|
RATING |
STATUS |
PROPOSED CREDIT LINE |
|
|
>86 |
Aaa |
Possesses an extremely sound financial base with the strongest
capability for timely payment of interest and principal sums |
Unlimited |
|
71-85 |
Aa |
Possesses adequate working capital. No caution needed for credit
transaction. It has above average (strong) capability for payment of interest
and principal sums |
Large |
|
56-70 |
A |
Financial & operational base are regarded healthy. General
unfavourable factors will not cause fatal effect. Satisfactory capability for
payment of interest and principal sums |
Fairly Large |
|
41-55 |
Ba |
Overall operation is considered normal. Capable to meet normal
commitments. |
Satisfactory |
|
26-40 |
B |
Capability to overcome financial difficulties seems comparatively below
average. |
Small |
|
11-25 |
Ca |
Adverse factors are apparent. Repayment of interest and principal sums
in default or expected to be in default upon maturity |
Limited with
full security |
|
<10 |
C |
Absolute credit risk exists. Caution needed to be exercised |
Credit not
recommended |
|
-- |
NB |
New Business |
-- |
This report is issued at your request without any
risk and responsibility on the part of MIRA INFORM PRIVATE LIMITED (MIPL) or
its officials.