MIRA INFORM REPORT
|
Report No. : |
345133 |
|
Report Date : |
15.10.2015 |
IDENTIFICATION DETAILS
|
Name : |
THAI TOKAI CARBON PRODUCT CO., LTD. |
|
|
|
|
Formerly Known As : |
THAI CARBON PRODUCT CO., LTD |
|
|
|
|
Registered Office : |
9th Floor, Harindhorn Tower, 54 North Sathorn Road, Silom, Bangrak, Bangkok 10500 |
|
|
|
|
Country : |
Thailand |
|
|
|
|
Financials (as on) : |
31.12.2014 |
|
|
|
|
Date of Incorporation : |
19.10.1989 |
|
|
|
|
Com. Reg. No.: |
0105532100151 |
|
|
|
|
Legal Form : |
Private Limited Company |
|
|
|
|
Line of Business : |
Manufacturer, Distributor and Exporter of Carbon Black. |
|
|
|
|
No. of Employees : |
230 |
RATING & COMMENTS
|
MIRA’s Rating : |
Ba |
|
RATING |
STATUS |
PROPOSED CREDIT LINE |
|
|
41-55 |
Ba |
Overall operation is considered normal. Capable to meet normal
commitments. |
Satisfactory |
|
Status : |
Satisfactory |
|
|
|
|
Payment Behaviour : |
Slow but correct |
|
|
|
|
Litigation : |
Clear |
NOTES:
Any query related to this report can be made
on e-mail: infodept@mirainform.com
while quoting report number, name and date.
ECGC Country Risk Classification List – March 31, 2015
|
Country Name |
Previous Rating (31.12.2014) |
Current Rating (31.03.2015) |
|
Thailand |
A2 |
A2 |
|
Risk Category |
ECGC
Classification |
|
Insignificant |
A1 |
|
Low |
A2 |
|
Moderate |
B1 |
|
High |
B2 |
|
Very High |
C1 |
|
Restricted |
C2 |
|
Off-credit |
D |
THAILAND - ECONOMIC OVERVIEW
With a well-developed infrastructure, a free-enterprise
economy, and generally pro-investment policies Thailand has historically had a
strong economy due in part to competitive industrial and agriculture exports -
mostly electronics, agricultural commodities, automobiles and parts, and
processed foods. The economy experienced slow growth and declining exports in
2014, in part due to domestic political turmoil and sluggish global demand.
With full employment, Thailand attracts an estimated 2-4 million migrant
workers from neighboring countries, and faces labor shortages. Following the
May 2014 coup d’tat, tourism decreased 6-7% but is beginning to recover. The
household debt to GDP ratio is over 80%. The Thai government in 2013 implemented
a nation-wide 300 baht ($10) per day minimum wage policy and deployed new tax
reforms designed to lower rates on middle-income earners. The Thai baht has
remained stable.
|
Source
: CIA |
Company
Name
THAI TOKAI CARBON PRODUCT CO., LTD.
SUMMARY
BUSINESS
ADDRESS : 9th FLOOR,
HARINDHORN TOWER,
54
NORTH
SATHORN ROAD, SILOM,
BANGRAK,
BANGKOK 10500, THAILAND
TELEPHONE : [66] 2266-3232
FAX :
[66] 2266-3230
E-MAIL
ADDRESS : kitti.t@tcp.co.th
winai@tcp.co.th
REGISTRATION
ADDRESS : SAME AS BUSINESS ADDRESS
ESTABLISHED : 1989
REGISTRATION
NO. : 0105532100151
TAX
ID NO. : 3101762808
CAPITAL REGISTERED : BHT. 800,000,000
CAPITAL PAID-UP : BHT.
800,000,000
SHAREHOLDER’S PROPORTION : JAPANESE :
100%
FISCAL YEAR CLOSING DATE : DECEMBER 31
LEGAL
STATUS : PRIVATE LIMITED
COMPANY
EXECUTIVE : MR.
HIROSHI TAKAHASHI, JAPANESE
MANAGING DIRECTOR
NO.
OF STAFF : 230
LINES
OF BUSINESS : CARBON BLACK
MANUFACTURER, DISTRIBUTOR AND EXPORTER
CORPORATE
PROFILE
OPERATING
TREND : STABLE
PRESENT
SITUATION : OPERATING NORMALLY
REPUTATION : FAIR
WITH NORMAL BUSINESS
ENGAGEMENT
MANAGEMENT
STANDARD : MANAGEMENT WITH
FAIR PERFORMANCE
HISTORY
The subject
was established on
October 19, 1989 as a
private limited company
under the originally registered name “Thai Carbon
Product Co., Ltd.” by Japanese groups.
On October 2, 2000,
its name was
changed to THAI TOKAI CARBON
PRODUCT CO., LTD.
Its business objective
is to manufacture
and distribute carbon
black for tire
industry of both
domestic and international
markets. It currently
employs approximately 230
staff.
The
subject’s registered address
is 9th Floor, Harindhorn
Tower, 54 North
Sathorn Rd., Silom,
Bangrak, Bangkok 10500,
and this is
the subject’s current
operation address.
THE
BOARD OF DIRECTOR
|
Name |
|
Nationality |
Age |
|
|
|
|
|
|
Mr. Somkiat Hatthakosol |
[x] |
Thai |
65 |
|
Mr. Masafumi Tsuji |
[x] |
Japanese |
52 |
|
Mr. Chalalak Boonnag |
|
Thai |
68 |
|
Mr. Tomio Fukuzumi |
|
Japanese |
50 |
|
Mr. Shunji Yamamoto |
|
Japanese |
53 |
|
Mr. Samart Vijitpavan |
[x] |
Thai |
55 |
|
Mr. Hiroshi Takahashi |
[x] |
Japanese |
52 |
|
Mr. Toru Araki |
|
Japanese |
51 |
AUTHORIZED
PERSON
Any of the
mentioned directors [x]
can sign on
behalf of the
subject with company’s
affixed.
MANAGEMENT
Mr. Hiroshi Takahashi is
the Managing Director.
He is Japanese
nationality with the
age of 52
years old.
Mr. Toru Araki is
the Deputy Managing
Director/Factory Manager.
He is Japanese
nationality with the
age of 51
years old.
Mr. Kitti Tankittibutr is
the Marketing Manager.
He is Thai
nationality.
BUSINESS
OPERATIONS
The subject is
engaged in manufacturing
and distributing carbon
black, the reinforcing
agent in the
production of tyres,
and also used
to produce wiper
ribbons, floor mats, engine
mounts and hosed
for all types
of vehicles, as
well as being
an essential element
in paint, printing ink,
plastic compound, floor mats,
electric conductors, and
a broad range
of rubber products.
PRODUCTION CAPACITY
61,000 tons per
annum
PURCHASE
70% of raw
material and chemical
are imported from
U.S.A., Japan, Republic
of China and
Germany, the remaining
30% is purchased
from local suppliers.
MAJOR SUPPLIERS
PTT
Public Company Limited : Thailand
Tokai
Carbon Co., Ltd. : Japan
Tokai
Carbon [Shanghai] Co.,
Ltd. : Republic
of China
Mitsubishi
Corporation : Japan
SALES
60% of the
products is sold
locally by wholesale
to manufacturers and
end-users, the remaining
40% is exported
to Malaysia, Indonesia,
Vietnam, India, Singapore, Republic
of China, Korea,
Taiwan, Philippines, France,
Spain and Japan.
MAJOR CUSTOMERS
Michelin Siam Co.,
Ltd. : Thailand
Thai Bridgestone Co.,
Ltd. : Thailand
Deestone Co., Ltd. : Thailand
Sumitomo Rubber [Thailand]
Co., Ltd. : Thailand
Otani Tire Co.,
Ltd. : Thailand
Micro Inks Ltd. : India
SUBSIDIARY
AND AFFILIATED COMPANY
The subject is
not found to have
any subsidiary or
affiliated company here
in Thailand.
LITIGATION
Bankruptcy and Receivership
There are no
litigation on bankruptcy
and receivership cases
filed against the
subject found at
Legal Execution Department
for the past
five years.
Others
There are no
legal suits filed
against the subject
according the past
two years.
CREDIT
Sales are by
cash or on
the credits term
of 30-60 days.
Local bills are
paid by cash
or on the
credits term of
30-60 days.
Imports are by
L/C at sight
or T/T.
Exports are against
T/T.
BANKING
Bangkok Bank Public
Co., Ltd.
Bank of Tokyo-Mitsubishi UFJ
Ltd.
The Siam Commercial
Bank Public Co.,
Ltd.
Kasikornbank
Public Co., Ltd.
EMPLOYMENT
The
subject employs approximately
230 staff.
LOCATION
DETAILS
The
premise is rented
for administrative office
at the heading
address. Premise is
located in a
prime commercial area.
Factory
is located at
42/2 Moo 1,
Sukhumvit Rd., KM. 124.5,
Thungsukhla, Sriracha, Chonburi
20230. Tel : [66]
38 352-487 Fax
: [66] 38
352-246-7
COMMENT
The subject was established itself as a
prominent carbon black manufacturer.
Its product has
been renowned for reliability and
uncompromising standards of international quality supplying
the products to
leading local tire
manufacturers and overseas.
FINANCIAL
INFORMATION
The
capital was registered
at Bht. 1,000,000 divided
into 10,000 shares
of Bht. 100
each.
The
capital was increased
later as following:
Bht. 200,000,000
on October 15,
1990
Bht. 300,000,000
on June 29,
1992
Bht. 600,000,000
on February 6,
1995
Bht. 800,000,000
on November 16,
1995
The
latest registered capital
was increased to Bht. 800 million, divided
into 8,000,000 shares
of Bht. 100
each with fully
paid.
THE
SHAREHOLDERS LISTED WERE
[as
at March 5,
2015]
|
NAME |
HOLDING |
% |
|
|
|
|
|
Tokai Carbon Co.,
Ltd. Nationality: Japanese Address : Aoyama
Building, 2-3 Kita- Aoyama 1-Chome,
Minato-ku, Tokyo, Japan |
6,614,815 |
82.69 |
|
Mitsubishi Corporation Nationality: Japanese Address : 3-1
Marunouchi 2-Chome, Chiyoda-ku, Tokyo, Japan |
985,185 |
12.31 |
|
Thai Bridgestone Co.,
Ltd. Nationality: Japanese Address : 990 Rama
4 Rd., Silom, Bangrak, Bangkok |
400,000 |
5.00 |
Total Shareholders : 3
Share Structure [as
at March 5,
2015]
|
Nationality |
Shareholders |
No. of Share |
% Shares |
|
|
|
|
|
|
Thai |
- |
- |
- |
|
Foreign - Japanese |
3 |
8,000,000 |
100.00 |
|
Total |
3 |
8,000,000 |
100.00 |
NAME OF AUDITOR & CERTIFIED PUBLIC
ACCOUNTANT NO.
Mr. Bunyarit Thanomcharoen No.
7900
BALANCE
SHEET [BAHT]
The latest financial figures published
as at December
31, 2014, 2013 & 2012 were:
ASSETS
|
Current Assets |
2014 |
2013 |
2012 |
|
|
|
|
|
|
Cash and Cash Equivalents |
143,679,779 |
72,616,778 |
20,947,110 |
|
Trade Accounts Receivable
|
874,983,212 |
862,427,530 |
975,852,217 |
|
Inventories |
1,778,641,545 |
1,502,721,248 |
2,054,823,987 |
|
Refundable Value Added Tax |
232,805,137 |
203,519,417 |
216,510,144 |
|
Other Current Assets
|
12,973,273 |
9,886,183 |
13,061,300 |
|
|
|
|
|
|
Total Current Assets
|
3,043,082,946 |
2,651,171,156 |
3,281,194,758 |
|
|
|
|
|
|
Fixed Assets |
1,923,256,523 |
2,312,083,345 |
2,772,457,563 |
|
Deferred Sub-lease Prepayments for Land |
16,162,360 |
18,261,666 |
20,360,972 |
|
Deposits |
8,747,897 |
8,721,907 |
8,787,690 |
|
Total Assets |
4,991,249,726 |
4,990,238,074 |
6,082,800,983 |
LIABILITIES &
SHAREHOLDERS’ EQUITY [BAHT]
|
Current
Liabilities |
2014 |
2013 |
2012 |
|
|
|
|
|
|
Short-term Loan from Financial Institutions |
1,830,000,000 |
1,943,152,341 |
2,237,638,012 |
|
Trade Accounts Payable
|
452,693,926 |
261,248,319 |
521,802,306 |
|
Current Portion of
Long-term Loans |
- |
- |
300,000,000 |
|
Accrued Income Tax |
- |
- |
39,065,340 |
|
Other Current Liabilities |
29,306,748 |
32,234,358 |
36,880,681 |
|
|
|
|
|
|
Total Current Liabilities |
2,312,000,674 |
2,236,635,018 |
3,135,386,339 |
|
|
|
|
|
|
Employee Benefits Obligation |
18,675,585 |
17,927,165 |
15,784,172 |
|
Total Liabilities |
2,330,676,259 |
2,254,562,183 |
3,151,170,511 |
|
|
|
|
|
|
Shareholders' Equity |
|
|
|
|
|
|
|
|
|
Share capital : Baht 100
par value authorized, issued
and fully paid share
capital 8,000,000 shares |
800,000,000 |
800,000,000 |
800,000,000 |
|
|
|
|
|
|
Capital Paid |
800,000,000 |
800,000,000 |
800,000,000 |
|
Retained Earnings: Appropriated for Statutory
Reserve |
80,000,000 |
80,000,000 |
80,000,000 |
|
Unappropriated |
1,780,573,467 |
1,855,675,891 |
2,051,630,472 |
|
Total Shareholders' Equity |
2,660,573,467 |
2,735,675,891 |
2,931,630,472 |
|
Total Liabilities &
Shareholders' Equity |
4,991,249,726 |
4,990,238,074 |
6,082,800,983 |
PROFIT
& LOSS ACCOUNT
|
Revenue |
2014 |
2013 |
2012 |
|
|
|
|
|
|
Sales Income |
5,214,404,472 |
4,601,410,164 |
5,064,188,230 |
|
Other Income |
23,544,940 |
1,232,886 |
6,194,898 |
|
Total Revenues |
5,237,949,412 |
4,602,643,050 |
5,070,383,128 |
|
Expenses |
|
|
|
|
|
|
|
|
|
Cost of Goods
Sold |
4,994,117,935 |
4,210,227,185 |
4,392,055,810 |
|
Selling Expenses |
144,613,367 |
113,562,416 |
114,490,207 |
|
Administrative Expenses |
71,800,971 |
88,382,849 |
72,564,823 |
|
Depreciation from Non-operating Assets |
53,273,229 |
255,851,691 |
- |
|
Total Expenses |
5,263,805,502 |
4,668,024,141 |
4,579,110,840 |
|
|
|
|
|
|
Profit / [Loss] before Financial Cost & Income
Tax |
[25,856,090] |
[65,381,091] |
491,272,288 |
|
Financial Costs |
[49,246,334] |
[62,573,490] |
[52,814,594] |
|
Profit / [Loss] before Income
Tax |
[75,102,424] |
[127,954,581] |
438,457,694 |
|
Income Tax |
- |
- |
[102,752,455] |
|
|
|
|
|
|
Net Profit / [Loss] |
[75,102,424] |
[127,954,581] |
335,705,239 |
FINANCIAL
ANALYSIS
|
ITEM |
UNIT |
2014 |
2013 |
2012 |
|
|
|
|
|
|
|
LIQUIDITY RATIO |
|
|
|
|
|
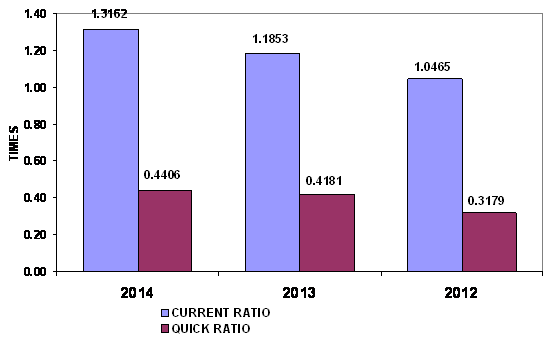
CURRENT RATIO |
TIMES |
1.32 |
1.19 |
1.05 |
|
QUICK RATIO |
TIMES |
0.44 |
0.42 |
0.32 |
|
|
|
|
|
|
|
ACTIVITY RATIO |
|
|
|
|
|
FIXED ASSETS TURNOVER |
TIMES |
2.71 |
1.99 |
1.83 |
|
TOTAL ASSETS TURNOVER |
TIMES |
1.04 |
0.92 |
0.83 |
|
INVENTORY CONVERSION PERIOD |
DAYS |
129.99 |
130.28 |
170.77 |
|
INVENTORY TURNOVER |
TIMES |
2.81 |
2.80 |
2.14 |
|
RECEIVABLES CONVERSION PERIOD |
DAYS |
61.25 |
68.41 |
70.33 |
|
RECEIVABLES TURNOVER |
TIMES |
5.96 |
5.34 |
5.19 |
|
PAYABLES CONVERSION PERIOD |
DAYS |
33.09 |
22.65 |
43.36 |
|
CASH CONVERSION CYCLE |
DAYS |
158.16 |
176.04 |
197.74 |
|
|
|
|
|
|
|
PROFITABILITY
RATIO |
|
|
|
|
|
COST OF GOODS SOLD |
% |
95.78 |
91.50 |
86.73 |
|
SELLING & ADMINISTRATION |
% |
4.15 |
4.39 |
3.69 |
|
INTEREST |
% |
0.94 |
1.36 |
1.04 |
|
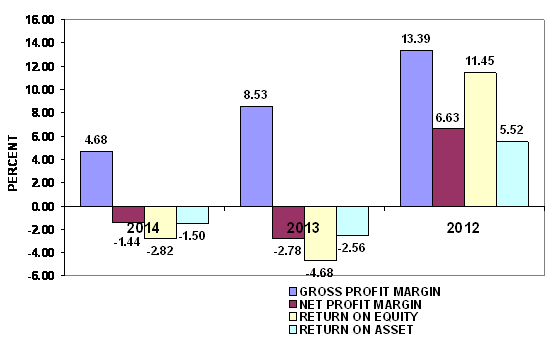
GROSS PROFIT MARGIN |
% |
4.68 |
8.53 |
13.39 |
|
NET PROFIT MARGIN BEFORE EX. ITEM |
% |
(0.50) |
(1.42) |
9.70 |
|
NET PROFIT MARGIN |
% |
(1.44) |
(2.78) |
6.63 |
|
RETURN ON EQUITY |
% |
(2.82) |
(4.68) |
11.45 |
|
RETURN ON ASSET |
% |
(1.50) |
(2.56) |
5.52 |
|
EARNING PER SHARE |
BAHT |
(9.39) |
(15.99) |
41.96 |
|
|
|
|
|
|
|
LEVERAGE RATIO |
|
|
|
|
|
DEBT RATIO |
TIMES |
0.47 |
0.45 |
0.52 |
|
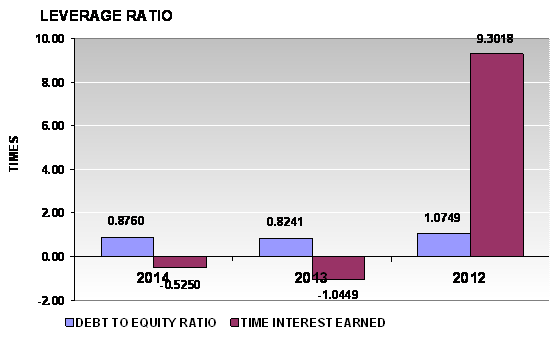
DEBT TO EQUITY RATIO |
TIMES |
0.88 |
0.82 |
1.07 |
|
TIME INTEREST EARNED |
TIMES |
(0.53) |
(1.04) |
9.30 |
|
|
|
|
|
|
|
ANNUAL GROWTH |
|
|
|
|
|
SALES GROWTH |
% |
13.32 |
(9.14) |
|
|
OPERATING PROFIT |
% |
(60.45) |
(113.31) |
|
|
NET PROFIT |
% |
41.31 |
(138.12) |
|
|
FIXED ASSETS |
% |
(16.82) |
(16.61) |
|
|
TOTAL ASSETS |
% |
0.02 |
(17.96) |
|
ANNUAL
GROWTH: SATISFACTORY
An annual sales growth is 13.32%. Turnover has increased from THB
PROFITABILITY :
RISKY
PROFITABILITY
RATIO
|
Gross Profit Margin |
4.68 |
Deteriorated |
Industrial
Average |
19.01 |
|
Net Profit Margin |
(1.44) |
Deteriorated |
Industrial
Average |
0.84 |
|
Return on Assets |
(1.50) |
Deteriorated |
Industrial
Average |
0.74 |
|
Return on Equity |
(2.82) |
Deteriorated |
Industrial
Average |
1.35 |
Gross Profit Margin used to assess a firm's financial health by
revealing the proportion of money left over from revenues after accounting for the
cost of goods sold. Gross profit margin serves as the source for paying
additional expenses and future savings. The company's figure is 4.68%. When
compared with the industry average, the ratio of the company was lower. This
indicated that company may have problems with control over its costs.
Net Profit Margin is the indicator of the company's efficiency in that
net profit takes into consideration all expenses of the company. A low profit
margin indicates a low margin of safety, higher risk that a decline in sales
will erase profits and result in a net loss. The company's figure is -1.44%.
When compared with the industry average, the ratio of the company was lower.
Return on Assets measures how efficiently profits are being generated
from the assets employed in the business when compared with the ratios of firms
in a similar business. A low ratio in comparison with industry averages
indicates an inefficient use of business assets. When compared with the
industry average, it was lower, the company's figure is -1.5%.
Return on Equity indicates how profitable a company is by comparing its
net income to its average shareholders' equity, ROE measures how much the
shareholders earned for their investment in the company. When compared with the
industry average, it was lower, the company's figure is -2.82%.
Trend of the
average competitors in the same industry for last 5 years
Return on Assets Downtrend
Return on Equity Downtrend
LIQUIDITY :
ACCEPTABLE
LIQUIDITY RATIO
|
Current Ratio |
1.32 |
Impressive |
Industrial
Average |
1.19 |
|
Quick Ratio |
0.44 |
|
|
|
|
Cash Conversion Cycle |
158.16 |
|
|
|
The Current Ratio is to ascertain whether a company's short-term assets
are readily available to pay off its short-term liabilities. The company's
figure is 1.32 times in 2014, increased from 1.19 times, then it is generally
considered to have good short-term financial strength. When compared with the
industry average, the ratio of the company was higher, indicated that company
was an efficient operator in a dominant position within its industry.
The Quick Ratio is a liquidity indicator that further refines the
current ratio by measuring the amount of the most liquid current assets there
are to cover current liabilities. The company's figure is 0.44 times in 2014,
increased from 0.42 times, then the company has not enough current assets that
presumably can be quickly converted to cash for pay financial obligations.
The Cash Conversion Cycle measures the number of days a company's cash
is tied up in the production and sales process of its operations and the
benefit from payment terms from its creditors. It meant the company could
survive when no cash inflow was received from sale for 159 days.
Trend of the
average competitors in the same industry for last 5 years
Current Ratio Downtrend
LEVERAGE :
SATISFACTORY
LEVERAGE RATIO
|
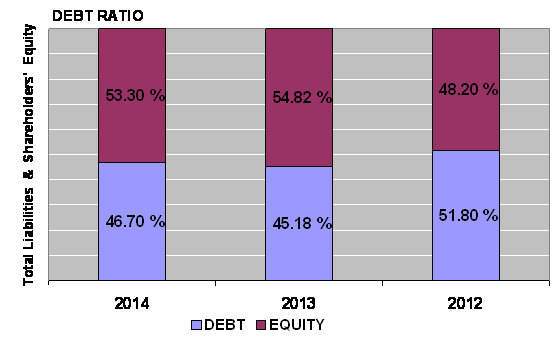
Debt Ratio |
0.47 |
Impressive |
Industrial
Average |
0.52 |
|
Debt to Equity Ratio |
0.88 |
Impressive |
Industrial
Average |
1.09 |
|
Times Interest Earned |
(0.53) |
Risky |
Industrial
Average |
- |
Debt to Equity Ratio a measurement of how much suppliers, lenders,
creditors and obligors have committed to the company versus what the shareholders
have committed. A lower the percentage means that the company is using less
leverage and has a stronger equity position.
Times Interest Earned measuring a company's ability to meet its debt
obligations. Ratio is -0.53 lower than 1, so the company is not generating
enough cash from EBIT to meet its interest obligations.
Debt Ratio shows the proportion of a company's assets which are financed
through debt. The company's figure is 0.47 less than 0.5, most of the company's
assets are financed through equity.
Trend of the
average competitors in the same industry for last 5 years
Debt Ratio Uptrend
Times Interest Earned Stable
ACTIVITY :
IMPRESSIVE

ACTIVITY RATIO
|
Fixed Assets Turnover |
2.71 |
Impressive |
Industrial
Average |
- |
|
Total Assets Turnover |
1.04 |
Impressive |
Industrial
Average |
0.88 |
|
Inventory Conversion Period |
129.99 |
|
|
|
|
Inventory Turnover |
2.81 |
Acceptable |
Industrial
Average |
4.47 |
|
Receivables Conversion Period |
61.25 |
|
|
|
|
Receivables Turnover |
5.96 |
Impressive |
Industrial
Average |
3.70 |
|
Payables Conversion Period |
33.09 |
|
|
|
The company's Account Receivable Ratio is calculated as 5.96 and
Inventory Turnover in Days Ratio indicates the liquidity of inventory.
It estimates the number of days that it will take to sell the current
inventory. Inventory is particularly sensitive to change in business
activities. The inventory turnover in is 130 days at the end of 2013, same
number of days
as in 2014. And Inventory turnover has increased
from 2.8 times in year 2013 to 2.81 times in year 2014.
The company's Total Asset Turnover is calculated as 1.04 times and 0.92
times in 2014 and 2013 respectively. This ratio is determined by dividing total
assets into total sales turnover. The ratio measures the activity of the assets
and the ability of the firm to generate sales through the use of the assets.
Trend of the
average competitors in the same industry for last 5 years
Fixed Assets Turnover Stable
Total Assets Turnover Downtrend
Inventory Turnover Downtrend
Receivables Turnover Downtrend
FOREIGN EXCHANGE RATES
|
Currency |
Unit
|
Indian Rupees |
|
US Dollar |
1 |
Rs.65.11 |
|
|
1 |
Rs.99.50 |
|
Euro |
1 |
Rs.74.24 |
INFORMATION DETAILS
|
Analysis Done by
: |
KAS |
|
|
|
|
Report Prepared
by : |
NIT |
RATING EXPLANATIONS
|
RATING |
STATUS |
PROPOSED CREDIT LINE |
|
|
|
>86 |
Aaa |
Possesses an extremely sound financial base with the strongest
capability for timely payment of interest and principal sums |
Unlimited |
|
|
71-85 |
Aa |
Possesses adequate working capital. No caution needed for credit
transaction. It has above average (strong) capability for payment of interest
and principal sums |
Large |
|
|
56-70 |
A |
Financial & operational base are regarded healthy. General unfavourable
factors will not cause fatal effect. Satisfactory capability for payment of
interest and principal sums |
Fairly Large |
|
|
41-55 |
Ba |
Overall operation is considered normal. Capable to meet normal
commitments. |
Satisfactory |
|
|
26-40 |
B |
Capability to overcome financial difficulties seems comparatively
below average. |
Small |
|
|
11-25 |
Ca |
Adverse factors are apparent. Repayment of interest and principal sums
in default or expected to be in default upon maturity |
Limited with full
security |
|
|
<10 |
C |
Absolute credit risk exists. Caution needed to be exercised |
Credit not
recommended |
|
|
-- |
NB |
New Business |
-- |
|
This score serves as a reference to assess SC’s
credit risk and to set the amount of credit to be extended. It is calculated
from a composite of weighted scores obtained from each of the major sections of
this report. The assessed factors and their relative weights (as indicated
through %) are as follows:
Financial
condition (40%) Ownership
background (20%) Payment
record (10%)
Credit history
(10%) Market trend (10%) Operational size
(10%)
This report is issued at your request without any
risk and responsibility on the part of MIRA INFORM PRIVATE LIMITED (MIPL) or
its officials.