MIRA INFORM REPORT
|
Report No. : |
346007 |
|
Report Date : |
20.10.2015 |
IDENTIFICATION DETAILS
|
Name : |
ZEE LEARN LIMITED |
|
|
|
|
Registered
Office : |
Continental Building, 135, Dr. Annie Besant Road, Worli ,
Mumbai- 400018, Maharashtra |
|
Tel. No.: |
91-22-24831234 |
|
|
|
|
Country : |
India |
|
|
|
|
Financials (as
on) : |
31.03.2015 |
|
|
|
|
Date of
Incorporation : |
04.01.2010 |
|
|
|
|
Com. Reg. No.: |
11-198405 |
|
|
|
|
Capital
Investment / Paid-up Capital : |
Rs.320.001 Million |
|
|
|
|
CIN No.: [Company Identification
No.] |
L80301MH2010PLC198405 |
|
|
|
|
TAN No.: [Tax Deduction &
Collection Account No.] |
Not Available |
|
|
|
|
PAN No.: [Permanent Account No.] |
AAACZ3977E |
|
|
|
|
Legal Form : |
A Public Limited Liability Company. The Company’s Shares are Listed on
the Stock Exchanges. |
|
|
|
|
Line of Business
: |
Providing Educational Services. |
|
|
|
|
No. of Employees
: |
Information declined by the management |
RATING & COMMENTS
|
MIRA’s Rating : |
Ba (50) |
|
RATING |
STATUS |
PROPOSED CREDIT LINE |
|
|
41-55 |
Ba |
Overall operation is considered normal. Capable to meet normal
commitments. |
Satisfactory |
|
Maximum Credit Limit : |
USD 6700000 |
|
|
|
|
Status : |
Satisfactory |
|
|
|
|
Payment Behaviour : |
Usually correct |
|
|
|
|
Litigation : |
Clear |
|
|
|
|
Comments : |
ZEE LEARN LIMITED is a part of Essel Group was incorporated in the
year 2010. It is an established company having satisfactory track. Subject is a leading child Development and Education company in India. The rating takes into consideration company’s healthy net worth base
along with comfortable liquidity position and decent profit margin indicators
of the company. The rating further derives strength from well-established promoter
group with a long established track record in media entertainment industry. Trade relations are reported as fair. Business is active. Payment
terms are reported as usually correct and as per commitments. The company can be considered normal for business dealings at usual
trade terms and conditions. |
NOTES :
Any query related to this report can be made
on e-mail : infodept@mirainform.com
while quoting report number, name and date.
ECGC Country Risk Classification List – March 31, 2015
|
Country Name |
Previous Rating (31.12.2014) |
Current Rating (31.03.2015) |
|
India |
A1 |
A1 |
|
Risk Category |
ECGC
Classification |
|
Insignificant |
A1 |
|
Low |
A2 |
|
Moderate |
B1 |
|
High |
B2 |
|
Very High |
C1 |
|
Restricted |
C2 |
|
Off-credit |
D |
EXTERNAL AGENCY RATING
|
Rating Agency Name |
CARE |
|
Rating |
Long Term Non-Convertible Debenture = AA (SO) |
|
Rating Explanation |
High degree of safety and carry low credit risk. |
|
Date |
May 12, 2015 |
RBI DEFAULTERS’ LIST STATUS
Subject’s name is not enlisted as a defaulter
in the publicly available RBI Defaulters’ list.
EPF (Employee Provident Fund) DEFAULTERS’ LIST STATUS
Subject’s name is not enlisted as a defaulter
in the publicly available EPF (Employee Provident Fund) Defaulters’ list as of
31-03-2015.
INFORMATION DECLINED
Management Non-Cooperative (Tel No.:91-22-24831234)
LOCATIONS
|
Registered Office : |
Continental Building, 135, Dr. Annie Besant Road, Worli ,
Mumbai- 400018, Maharashtra, India |
|
Tel. No.: |
91-22-24831234 |
|
Fax No.: |
91-22-24900302 |
|
E-Mail : |
|
|
Website : |
|
|
|
|
|
Corporate Office : |
6th Floor, Link road, Andheri (West), Mumbai – 400053,
Maharashtra, India |
|
Tel. No.: |
91-22-40343900 |
|
Fax No.: |
91-22-26743422 |
DIRECTORS
As on 31.03.2015
|
Name : |
Mr. Subodh Kumar |
|
Designation : |
Chairman |
|
|
|
|
Name : |
Mr. Surjit Banga |
|
Designation : |
Independent Director |
|
Address : |
A/1101 Serenity Heights, Mindspace, Malad (West), Mumbai - 400064, Maharashtra, India |
|
Date of Appointment : |
01.09.2010 |
|
DIN No.: |
00001637 |
|
|
|
|
Name : |
Dr. Manish Agarwal |
|
Designation : |
Independent Director |
|
|
|
|
Name : |
Mr. Himanshu Mody |
|
Designation : |
Non-Executive Director |
|
Address : |
1201/B Gardenia Building, Vasant Valley, Film City Road, Malad East, Mumbai -400097, Maharashtra, India |
|
Date of Appointment : |
04.01.2010 |
|
DIN No.: |
00686830 |
|
|
|
|
Name : |
Mr. Sangeeta Pandit |
|
Designation : |
Independent Director |
|
Address : |
Madhav Vilas, Top Floor,, 8, Setalwad Road, Off Nepean Sea Road, Mumbai - 400026, Maharashtra, India |
|
Date of Appointment : |
01.12.2013 |
|
DIN No.: |
06748608 |
|
|
|
|
Name : |
Mr. Manish Agarwal |
|
Designation : |
Director |
|
Address : |
Ullas, 1st Floor, 17, Laburnum Road (Next To Mani Bhavan), Gamdevi, Mumbai, 400007, Maharashtra, India |
|
Date of Appointment : |
01.12.2013 |
|
DIN No.: |
02069969 |
KEY EXECUTIVES
|
Name : |
Mr. K. Venkate Satya Seshasai |
|
Designation : |
Chief Executive Officer |
|
Address : |
A- 22,Sunset Heights, Nargis Dutt Road, Pali Hill, Bandra West , Mumbai- 400 050, Mumbai, 400050, Maharashtra, India |
|
Date of Appointment : |
29.05.2014 |
|
PAN No.: |
ANCPK4044K |
|
|
|
|
Name : |
Mr. Samir Raval |
|
Designation : |
Company Secretary |
|
|
|
|
Name : |
Ms. Hemangi Shailesh Patil |
|
Designation : |
Secretary |
|
Address : |
201-B, Srushti Chs, G.D.Amberkar Marg, Bhoiwada Naka, Parel, Mumbai, 400012, Maharashtra, India |
|
Date of Appointment : |
16.06.2015 |
|
PAN No.: |
AINPD9642E |
|
|
|
|
Name : |
Ms. Sindu Aven |
|
Designation : |
Head - Academics |
|
|
|
|
Name : |
Mr. Sukhvinder Singh Bindra |
|
Designation : |
Business Head - Kidzee |
|
|
|
|
Name : |
Mr. Mayank Jain |
|
Designation : |
Business Head Managed Schools |
|
|
|
|
Name : |
Mr. Umesh Pradhan |
|
Designation : |
Manager And Chief Financial Officer |
|
Address : |
B- 2/503, Swastik Residency, Opp Rutu Enclave,, Near Muchalla College, Ghodbunder Road, Thane, 400607, Maharashtra, India |
|
Date of Appointment : |
01.04.2013 |
|
PAN No.: |
AAIPP5186A |
|
|
|
|
Name : |
Mr. Abhinav Upadhyay |
|
Designation : |
Head - Marketing And Innovation |
|
|
|
|
Name : |
Mr. Vivek Bhanot |
|
Designation : |
Head - Strategic Acquisition Team |
|
|
|
|
Name : |
Mr. Nitish Menon |
|
Designation : |
Business Head Mlzs Partner Schools |
|
|
|
|
Name : |
Mr. Vikash Kar |
|
Designation : |
Head - Human Resources |
|
|
|
|
Name : |
Mr. Brijesh Jadia |
|
Designation : |
Head - Supply chain |
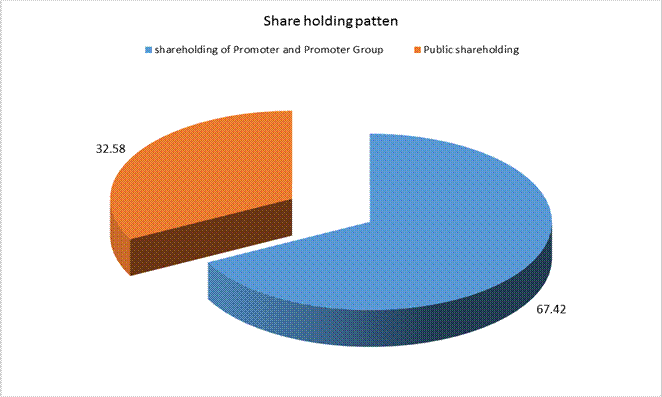
MAJOR SHAREHOLDERS / SHAREHOLDING PATTERN
As on 30.09.2015
|
Category of
Shareholder |
Total No. of
Shares |
Total Shareholding
as a % of Total No. of Shares |
|
|
||
|
(A)
Shareholding of Promoter and Promoter Group |
||
|
|
|
|
|
|
729089 |
0.25 |
|
|
190766475 |
65.19 |
|
|
191495564 |
65.44 |
|
|
|
|
|
|
5797315 |
1.98 |
|
|
5797315 |
1.98 |
|
Total
shareholding of Promoter and Promoter Group (A) |
197292879 |
67.42 |
|
(B)
Public Shareholding |
||
|
|
|
|
|
|
274 |
0.00 |
|
|
71306 |
0.02 |
|
|
19218 |
0.01 |
|
|
74404738 |
25.43 |
|
|
74495536 |
25.46 |
|
|
|
|
|
|
9612831 |
3.28 |
|
|
|
|
|
|
9587477 |
3.28 |
|
|
1101265 |
0.38 |
|
|
549262 |
0.19 |
|
|
123 |
0.00 |
|
|
88 |
0.00 |
|
|
536277 |
0.18 |
|
|
12774 |
0.00 |
|
|
20850835 |
7.13 |
|
Total
Public shareholding (B) |
95346371 |
32.58 |
|
Total
(A)+(B) |
292639250 |
100.00 |
|
(C) Shares
held by Custodians and against which Depository Receipts have been issued |
0 |
0.00 |
|
|
0 |
0.00 |
|
|
27509770 |
0.00 |
|
|
27509770 |
0.00 |
|
Total
(A)+(B)+(C) |
320149020 |
0.00 |
BUSINESS DETAILS
|
Line of Business : |
Providing Educational Services. |
|
|
|
|
Products / Services : |
Educational Services |
|
|
|
|
Brand Names : |
Not Divulged |
|
|
|
|
Agencies Held : |
Not Divulged |
|
|
|
|
Exports : |
Not Divulged |
|
|
|
|
Imports : |
Not Divulged |
|
|
|
|
Terms : |
Not Divulged |
PRODUCTION STATUS NOT AVAILABLE
GENERAL INFORMATION
|
Suppliers : |
|
||||||||||||||||||
|
|
|
||||||||||||||||||
|
Customers : |
|
||||||||||||||||||
|
|
|
||||||||||||||||||
|
No. of Employees : |
Information declined by the management |
||||||||||||||||||
|
|
|
||||||||||||||||||
|
Bankers : |
|
||||||||||||||||||
|
|
|
||||||||||||||||||
|
Facilities : |
|
|
Auditors : |
|
|
Name : |
MGB And company LLP Chartered Accountant |
|
Address : |
Peninsula Business Park, Tower B, 19th Flor, Lower Parel,
Mumbai, Maharashtra, India |
|
PAN N Income-tax PAN of auditor or auditor's firm : |
AAYFM6965C |
|
|
|
|
Memberships : |
Not Available |
|
|
|
|
Collaborators : |
Not Available |
|
|
|
|
Related Party : |
CIN NO: U92130MH1996PTC10048
CIN NO: L92132MH1982PLC028767
CIN
NO: U72900MH2006PTC164508
CIN NO: U74990MH2010PLC198648
CIN NO: U45207MH2007PTC173440
CIN NO: U74140MH2002PTC136737
CIN NO: L92100MH1999PLC121506
|
|
|
|
|
Subsidiaries : |
CIN NO: U72900MH2006PTC165215 |
CAPITAL STRUCTURE
After 31.03.2015
Authorised Capital : Rs. 1000.000 Million
Issued, Subscribed & Paid-up Capital : Rs. 320.149
Million
As on 31.03.2015
Authorised Capital :
|
No. of Shares |
Type |
Value |
Amount |
|
|
|
|
|
|
1000000000 |
Equity Shares |
Rs.1/- each |
Rs.1000.000 Million |
|
|
|
|
|
Issued, Subscribed & Paid-up Capital :
|
No. of Shares |
Type |
Value |
Amount |
|
|
|
|
|
|
320001097 |
Equity Shares |
Rs.1/- each |
Rs.320.001
Million |
|
|
|
|
|
Reconciliation of
number of Equity shares and Share capital
|
|
2015 Number of
equity shares |
Rs. in Million |
|
At the beginning of the year |
319331644 |
319.332 |
|
Add : Allotted on exercise of Employee Stock Option |
669453 |
0.669 |
|
Add : Issue of Shares pursuant to Global Depository Receipts |
-- |
-- |
|
Outstanding at the end of the year |
320001097 |
320.001 |
a)
Terms/ rights attached to equity shares
The Company has
only one class of equity shares having a par value of Rs. 1 each. Each holder
of equity shares is entitled to one vote per share , however the holders of
global depository receipts (GDR's) do not have voting rights in respect of the
equity shares represented by the GDRs till the shares are held by custodian.
The Company declares and pays dividend in Indian Rupees. The final dividend
proposed by the Board of Directors is subject to the approval of the
shareholders in the ensuing Annual General Meeting.
In the event of
liquidation of the company, the holders of equity shares will be entitled to
receive remaining assets of the company after distribution of preferential
amounts. The distribution will be in proportion to thr number of equity shares
held by the shareholders.
(c) The Company has
not issued any bonus shares or bought back equity shares during the five years
preceding 31 March, 2014. Details of aggregate number of, shares issued for
consideration other than cash during the five years preceding 31 March, 2014 is
as under:
|
|
2015 |
2013 |
|
Pursuant to the Composite Scheme of Arrangement-Amalgamation |
262,238,599 |
262,238,599 |
(d) Details of Shareholders holding more than 5 % of the aggregate
shares in the Company
|
Name of the
Shareholders |
2014 Number of equity
shares |
% of Shareholding |
|
Jayneer Capital Private Limited |
77,975,375 |
24.42% |
|
Asian Satellite Broadcast Private Limited. |
63,052,512 |
19.75% |
|
Deutsche Bank Trust Company Americas |
41,179,770 |
7.37% |
|
Orange Mauritius Investments Limited |
23,546,529 |
7.37% |
e) Employees Stock
Option Scheme (ESOP):
The Company has instituted
an Employee Stock Option Plan (ZLL ESOP 2010) as approved by the Board of
Directors and Shareholders in 2010 for issuance of stock options convertible
into equivalent number of equity shares not exceeding the aggregate of 5% of
the issued and paid up capital of the Company i.e upto 6,136,930 equity shares
of Rs. 1 each to the employees of the Company as well as that of its subsidiary
and also to non-executive directors including Independent Directors of the
Company at the market price determined as per the SEBI (ESOS) Guidelines, 1999.
The said Scheme is administered by the Remuneration Committee of the Board.
During the year
ended 31st March, 2015, the Company issued 1,961,750 stock options. The
options granted under the Scheme shall vest not less than one year and not more
than five years from the date of grant of options. The options granted vests in
the ratio of 50:35:15 at the expiry of one, two and three years from the date
of grant and once vested, these would be exercisable at any time within a
period of four years and the equity shares arising on exercise of options shall
not be subject to any lock in. Upon exercise of 669,453 (414,625) options,
equivalent number of equity shares were issued and allotted during the year
ended 31 March, 2015.
The options were
granted to the employees/independent directors at an exercise price, being the
latest market price as per the SEBI (ESOS) Guidelines 1999. In view of this,
there being no intrinsic value on the date of grant (being the excess of market
price of share under the Scheme over the exercise price of the option) the
company is not required to account the accounting value of options as per the
SEBI guidelines.
FINANCIAL DATA
[all figures are
in Rupees Million]
ABRIDGED
BALANCE SHEET
|
SOURCES
OF FUNDS |
31.03.2015 |
31.03.2014 |
31.03.2013 |
|
|
|
|
|
|
I.
EQUITY AND LIABILITIES |
|
|
|
|
(1)Shareholders' Funds |
|
|
|
|
(a) Share Capital |
320.001 |
319.332 |
263.010 |
|
(b) Reserves & Surplus |
2024.407 |
1920.325 |
933.928 |
|
(c) Money received against
share warrants |
0.000 |
0.000 |
0.000 |
|
|
|
|
|
|
(2) Share Application money
pending allotment |
0.000 |
0.000 |
0.000 |
|
Total
Shareholders’ Funds (1) + (2) |
2344.408 |
2239.657 |
1196.938 |
|
|
|
|
|
|
(3) Non-Current Liabilities |
|
|
|
|
(a) long-term borrowings |
468.000 |
859.600 |
575.000 |
|
(b) Deferred tax liabilities
(Net) |
0.000 |
0.000 |
0.000 |
|
(c) Other long term
liabilities |
2.960 |
7.139 |
12.204 |
|
(d) long-term provisions |
14.722 |
14.446 |
4.244 |
|
Total
Non-current Liabilities (3) |
485.682 |
881.185 |
591.448 |
|
|
|
|
|
|
(4) Current Liabilities |
|
|
|
|
(a) Short term borrowings |
293.691 |
0.000 |
0.000 |
|
(b) Trade payables |
131.885 |
87.163 |
96.139 |
|
(c) Other current liabilities |
842.556 |
716.275 |
1462.947 |
|
(d) Short-term provisions |
4.264 |
4.391 |
4.020 |
|
Total
Current Liabilities (4) |
1272.396 |
807.829 |
1563.106 |
|
|
|
|
|
|
TOTAL |
4102.486 |
3928.671 |
3351.492 |
|
|
|
|
|
|
II.
ASSETS |
|
|
|
|
(1) Non-current assets |
|
|
|
|
(a) Fixed Assets |
|
|
|
|
(i) Tangible assets |
21.885 |
57.107 |
139.888 |
|
(ii) Intangible Assets |
72.410 |
87.435 |
34.856 |
|
(iii) Capital work-in-progress |
0.000 |
0.000 |
0.000 |
|
(iv) Intangible assets under
development |
35.786 |
27.306 |
268.877 |
|
(b) Non-current Investments |
3322.192 |
1060.105 |
1060.105 |
|
(c) Deferred tax assets (net) |
0.000 |
0.000 |
0.000 |
|
(d) Long-term Loan and Advances |
90.908 |
75.050 |
878.231 |
|
(e) Other Non-current assets |
33.760 |
37.423 |
0.046 |
|
Total
Non-Current Assets |
3576.941 |
1344.426 |
2382.003 |
|
|
|
|
|
|
(2) Current assets |
|
|
|
|
(a) Current investments |
37.713 |
1003.593 |
0.000 |
|
(b) Inventories |
274.109 |
192.416 |
103.997 |
|
(c) Trade receivables |
70.127 |
102.714 |
99.506 |
|
(d) Cash and cash equivalents |
99.259 |
141.160 |
130.667 |
|
(e) Short-term loans and
advances |
26.277 |
1130.973 |
629.672 |
|
(f) Other current assets |
18.060 |
13.389 |
5.647 |
|
Total
Current Assets |
525.545 |
2584.245 |
969.489 |
|
|
|
|
|
|
TOTAL |
4102.486 |
3928.671 |
3351.492 |
PROFIT
& LOSS ACCOUNT
|
|
PARTICULARS |
31.03.2015 |
31.03.2014 |
31.03.2013 |
|
|
SALES |
|
|
|
|
|
Revenue from Operations |
1215.825 |
1191.754 |
1000.776 |
|
|
Other Income |
47.338 |
31.809 |
6.232 |
|
|
TOTAL
(A) |
1263.163 |
1223.563 |
1007.008 |
|
|
|
|
|
|
|
Less |
EXPENSES |
|
|
|
|
|
Operating Cost |
344.419 |
384.228 |
340.006 |
|
|
Employees benefits expense |
249.513 |
312.685 |
331.094 |
|
|
Other expenses |
372.500 |
391.169 |
414.284 |
|
|
TOTAL
(B) |
966.432 |
1088.082 |
1085.384 |
|
|
|
|
|
|
|
PROFIT/
(LOSS) BEFORE INTEREST, TAX,
DEPRECIATION AND AMORTISATION (C) |
296.731 |
135.481 |
(78.376) |
|
|
|
|
|
|
|
|
Less |
FINANCIAL
EXPENSES (D) |
132.484 |
82.330 |
56.405 |
|
|
|
|
|
|
|
|
PROFIT
/ (LOSS) BEFORE TAX, DEPRECIATION AND AMORTISATION (C-D) (E) |
164.247 |
53.151 |
(134.781) |
|
|
|
|
|
|
|
Less/
Add |
DEPRECIATION/
AMORTISATION (F) |
68.021 |
66.416 |
64.200 |
|
|
|
|
|
|
|
|
PROFIT/ (LOSS)
BEFORE TAX (E-F) (G) |
96.226 |
(13.265) |
(198.981) |
|
|
|
|
|
|
|
Less |
TAX (H) |
0.000 |
0.000 |
13.254 |
|
|
|
|
|
|
|
|
PROFIT/ (LOSS)
AFTER TAX (G-H) (I) |
96.226 |
(13.265) |
(212.235) |
|
|
|
|
|
|
|
|
Earnings
/ (Loss) Per Share (Rs.) |
0.3 |
(0.04) |
(0.81) |
CURRENT MATURITIES OF LONG TERM DEBT DETAILS
|
Particulars |
31.03.2015 |
31.03.2014 |
31.03.2013 |
|
Current Maturities of debentures and term loan |
391.600 |
235.400 |
175.000 |
|
Cash generated from operations |
312.378 |
(246.793) |
(387.480) |
|
Net cash flow from operating activity |
300.003 |
(256.919) |
(397.893) |
KEY
RATIOS
|
PARTICULARS |
|
31.03.2015 |
31.03.2014 |
31.03.2013 |
|
Net Profit Margin (PAT / Sales) |
(%) |
7.91 |
(1.11) |
(21.21) |
|
|
|
|
|
|
|
Operating Profit Margin (PBIDT/Sales) |
(%) |
24.41 |
11.37 |
(7.83) |
|
|
|
|
|
|
|
Return on Total Assets (PBT/Total Assets} |
(%) |
12.92 |
(0.47) |
(9.84) |
|
|
|
|
|
|
|
Return on Investment (ROI) (PBT/Networth) |
|
0.04 |
(0.01) |
(0.17) |
|
|
|
|
|
|
|
Debt Equity Ratio (Total Debt /Networth) |
|
0.49 |
0.49 |
0.63 |
|
|
|
|
|
|
|
Current Ratio (Current Asset/Current Liability) |
|
0.41 |
3.20 |
0.62 |
STOCK
PRICES
|
Face Value |
Rs.1.00/- |
|
Market Value |
Rs.32.65/- |
FINANCIAL ANALYSIS
[all figures are
in Rupees Million]
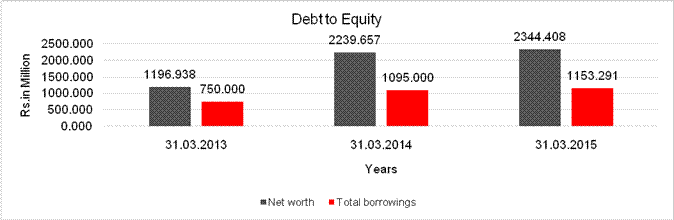
DEBT EQUITY RATIO
|
Particular |
31.03.2013 |
31.03.2014 |
31.03.2015 |
|
|
(Rs.
In Million) |
(Rs.
In Million) |
(Rs.
In Million) |
|
Share Capital |
263.010 |
319.332 |
320.001 |
|
Reserves & Surplus |
933.928 |
1920.325 |
2024.407 |
|
Money received against share
warrants |
0.000 |
0.000 |
0.000 |
|
Share Application money pending allotment |
0.000 |
0.000 |
0.000 |
|
Net
worth |
1196.938 |
2239.657 |
2344.408 |
|
|
|
|
|
|
long-term borrowings |
575.000 |
859.600 |
468.000 |
|
Short term borrowings |
0.000 |
0.000 |
293.691 |
|
Current Maturities of debentures and term
loan |
175.000 |
235.400 |
391.600 |
|
Total
borrowings |
750.000 |
1095.000 |
1153.291 |
|
Debt/Equity
ratio |
0.627 |
0.489 |
0.492 |
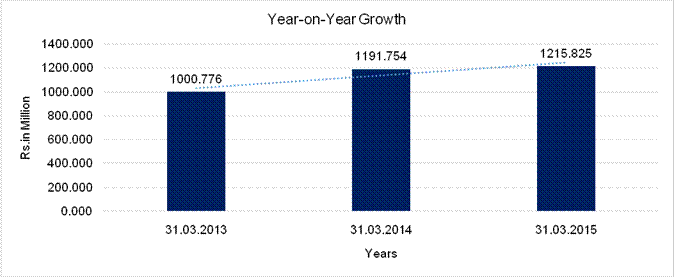
YEAR-ON-YEAR GROWTH
|
Year
on Year Growth |
31.03.2013 |
31.03.2014 |
31.03.2015 |
|
|
(Rs.
In Million) |
(Rs.
In Million) |
(Rs.
In Million) |
|
Sales |
1000.776 |
1191.754 |
1215.825 |
|
|
|
19.083 |
2.020 |
NET PROFIT MARGIN
|
Net
Profit Margin |
31.03.2013 |
31.03.2014 |
31.03.2015 |
|
|
(Rs.
In Million) |
(Rs.
In Million) |
(Rs.
In Million) |
|
Sales |
1000.776 |
1191.754 |
1215.825 |
|
Profit |
(212.235) |
(13.265) |
96.226 |
|
|
(21.21%) |
(1.11%) |
7.91% |
LOCAL AGENCY FURTHER INFORMATION
|
Sr. No. |
Check list by
info agents |
Available in
Report (Yes/No) |
|
1 |
Year of establishment |
Yes |
|
2 |
Constitution of the entity -Incorporation
details |
Yes |
|
3 |
Locality of the entity |
Yes |
|
4 |
Premises details |
No |
|
5 |
Buyer visit details |
-- |
|
6 |
Contact numbers |
Yes |
|
7 |
Name of the person contacted |
Yes |
|
8 |
Designation of contact person |
Yes |
|
9 |
Promoter’s background |
Yes |
|
10 |
Date of Birth of Proprietor / Partners /
Directors |
Yes |
|
11 |
Pan Card No. of Proprietor / Partners |
No |
|
12 |
Voter Id Card No. of Proprietor / Partners |
No |
|
13 |
Type of business |
Yes |
|
14 |
Line of Business |
Yes |
|
15 |
Export/import details (if applicable) |
No |
|
16 |
No. of employees |
No |
|
17 |
Details of sister concerns |
Yes |
|
18 |
Major suppliers |
No |
|
19 |
Major customers |
No |
|
20 |
Banking Details |
Yes |
|
21 |
Banking facility details |
Yes |
|
22 |
Conduct of the banking account |
-- |
|
23 |
Financials, if provided |
Yes |
|
24 |
Capital in the business |
Yes |
|
25 |
Last accounts filed at ROC, if applicable |
Yes |
|
26 |
Turnover of firm for last three years |
Yes |
|
27 |
Reasons for variation <> 20% |
-- |
|
28 |
Estimation for coming financial year |
No |
|
29 |
Profitability for last three years |
Yes |
|
30 |
Major shareholders, if available |
Yes |
|
31 |
External Agency Rating, if available |
Yes |
|
32 |
Litigations that the firm/promoter
involved in |
-- |
|
33 |
Market information |
-- |
|
34 |
Payments terms |
No |
|
35 |
Negative Reporting by Auditors in the
Annual Report |
No |
BUSINESS OVERVIEW
The Company is a leading education company, founded with the purpose of ''Improving Human Capital''. The company has contributed in the field of education across age groups, all the while maintaining its core values of integrity, ownership, leadership, trust and continuous learning. They believe that every child has a unique and infinite potential and they are committed to help children realize their capabilities. Linder its Portfolio, Zee Learn is currently operating over 1350 pre- schools and 87 K-12 schools, through its leading brands, Kidzee and Mount Litera Zee School respectively. By the current financial year end Kidzee has reached to over 4,10,000 students and MLZS has reached to about 30,500 students through its network of school chain.
In order to cater the need to develop skills of youth population, the company is looking to explore vocational courses outside the traditional curriculum. Zee Institute of Media Arts (ZIMA) provides diploma courses in TV and film making courses and Zee Institute of Creative Art (ZICA) provides diploma courses in 2D and 3D animation.
MANAGEMENT DISCUSSION
AND ANALYSIS
Education is the key to progress. It empowers the individual and enables a nation. The most precious of all resources available to any country is its children and it is incumbent upon themto ensure that their children get all the opportunities they need for their physical as well as intellectual growth. A good education system must enable the child to grow intellectually and blossom into an enlightened citizen. The role of education in facilitating social and economic progress is well recognized. It opens up opportunities leading to both individual and group entitlements.
Zee Learn Limited (ZLL) (BSE Code: 533287 and NSE Code: ZEELEARN) with its PAN India presence in Pre-Schools and K-12 schools is all poised to leverage its position to take advantage of the changing dynamics of education sector. Zee Learn is all set to provide quality education in line with the new government’s vision of making India a knowledge superpower by equipping the students with necessary skills and knowledge. The company is uniquely positioned to capitalize on the growth of the education sector in India with its deep capabilities in content and curriculum creation, education infrastructure management and educational technology.
ECONOMY OVERVIEW
In July 2013, India was teetering on the edge of macroeconomic crisis with double digit inflation, a high and rising current account deficit (CAD), and a falling rupee as investor sentiment turned sour in the aftermath of the Fed's taper decision to signal the end of its quantitative easing. India was grouped with Brazil, Indonesia, Turkey, and South Africa to constitute the Fragile (Famous) Five amongst the emerging market countries (EMs).
Nearly 18 months on, the landscape has vastly changed. Macro-economic stability has returned, reforms are being undertaken, the external environment has moved in India's favour, and above all, a new Government has come into power with a relatively unencumbered political mandate for decisive economic change, a mandate that markets have enthusiastically embraced. The changing fortunes of India have been nothing short of dramatically positive. Inflation has declined by over 6 percentage points since late 2013, and the current account deficit has shriveled from a peak of 6.7 percent of GDP (in Q3, 2012-13) to an estimated 1.0 percent in the last fiscal year. Foreign portfolio flows (of US$ 38.4 billion since April 2014) have stabilized the rupee, exerting downward pressure on long-term interest rates, reflected in the yield on 10-year government securities, and contributed to the surge in equity prices (31 percent since April in rupee terms, and even more in US dollars, ranking it the highest amongst emerging markets).
In its Economic and Social Survey of Asia and Pacific, The UN Economic and Social Commission for Asia and the Pacific (ESCAP) projected economic growth a shade higher at 8.2 per cent for 2016-17 than in the current financial year. India's economy is officially estimated to have grown 7.4 per cent in 2014-15.
INDIAN EDUCATION
INDUSTRY
The Education sector in India is poised at a crucial stage in its growth. India’s demographic advantage of having a large population of youth, coupled with low gross enrolment ratios, presents a huge opportunity to education sector players. At the same time, the growth of the Indian economy and upward movement of income levels is boosting spend on Education, which already accounts for the second-highest share of wallet for middle-class households.
Over the last two decades, India has remarkably transformed its higher education landscape. It has created widespread access to low-cost high-quality university education for students of all levels. With well-planned expansion and a student-centric learning-driven model of education, India has not only bettered its enrolment numbers but has dramatically enhanced its learning outcomes. A differentiated three-tiered university system - where each tier has a distinct strategic objective - has enabled universities to build on their strengths and cater across different categories of educational needs.
Further, with the effective use of technology, India has been able to resolve the longstanding tension between excellence and equity. India has\ also undertaken large-scale reforms to better faculty-student ratios by making teaching an attractive career path, expanding capacity for doctoral students at research universities and delinking educational qualifications from teaching eligibility.
In Budget 2015, the Government of India allocated USD23.6 billion for the education sector compared to USD22.8 billion in the previous budget. This presents a huge opportunity for the education sector. Of this, USD11.3 billion has been earmarked for general education while USD4.7 billion has been allocated for Sarva Siksha Abhiyan
INDUSTRY SEGMENT
OVERVIEW
The education market in India, which is presently worth around Rs.5.9 trillion ($92.98 billion), is poised for some major growth in the years to come, as by 2020, India will have the world’s largest tertiary-age population, and second largest graduate talent pipeline globally. Presently, higher education contributes 59.7 per cent of the market size, school education 38.1 per cent, pre-school segment 1.6 per cent, and technology and multi-media the remaining 0.6 per cent.
Due to the growth advantages, this sector has also received number of INVESTMENTS from several foreign organisations. In the period from April 2000- November, 2014, the education sector in India attracted FDI equity to the tune of $974.81 million, according to the Department of Industrial Policies and Promotion (DIPP).
OUTLOOK
Various government initiatives are being adopted to boost the growth of distance education market, besides focusing on new education techniques, such as E-learning and M-learning. The Government of India has taken several steps including opening of IIT’s and IIM’s in new locations as well as allocating educational grants for research scholars in most government institutions. Furthermore, with online modes of education being used by several educational organizations, the higher education sector in India is set for some major changes and developments in the years to come.
In recent years, India has undertaken massive structural and systemic changes that have started to yield encouraging results. The country has been touted to have the best-in-class post-secondary education system at present. Some of the significant factors that have contributed to this growth includes: expansion of a differentiated university system with a three-tiered formalized structure, transition to a learner-centered paradigm of education, intensive use of technology and reforms in governance.
Moreover, the Government of India has taken several steps including opening of IIT’s and IIM’s in new locations as well as allocating educational grants for research scholars in most government institutions. Furthermore, with online modes of education being used by several educational organizations, the higher education sector in India is set for some major changes and developments in the years to come.
BUSINESS OVERVIEW
The year FY15 was a landmark year for Kidzee as it continued its growth story and for the first time, the company added more than 500 pre-school franchisee partners. A leader in the Early Childhood Development and Education (ECDE) domain for over a decade now, Kidzee has nurtured over 450,000 children till date, thus truly standing for India’s Favourite Preschool.
Kidzee’s proprietary curriculum places the child at the centre and designs everything around the developmental requirements of the child. The overriding principle ‘What’s Right For Child’ (WRFC) governs everything that they do at Kidzee and serves as a filter to deliver only what is in the best interest of the child. Being committed to the cause of Child Abuse Prevention, Kidzee continues to empower the child and educate all stakeholders to prevent incidence of child abuse in any form under the ‘I Care’ initiative.
Standalone Net profit stood at Rs.96.230 Million for the year ended March 31, 2015 against the loss of (Rs.13.270 Million) for the corresponding year ending March 31, 2014. Standalone Revenue from operations for the year ending March 31, 2015 stood at Rs.1215.830 Million, up against Rs.1191.750 Million for the corresponding year ending March 31, 2014. EBITDA from operations for the year ending March 31, 2015 stood at Rs.249.39 Million, up against Rs.103.670 Million for the corresponding quarter ending March 31, 2014.
Consolidated Net profit stood at Rs.98.930 Million for the year ended March 31, 2015 against the loss of (Rs.19.380) Million for the corresponding year ending March 31, 2014. Consolidated Revenue from operations for the year ending March 31, 2015 stood at Rs.1277.830 Million, up against Rs.1213.190 Million for the corresponding year ending March 31, 2014. EBITDA from operations for the year ending March 31, 2015 stood at Rs.306.080 Million, up against Rs.121.510 Million for the corresponding quarter ending March 31, 2014.
STANDALONE FINANCIAL
PERFORMANCE
FINANCIAL YEAR 2015
COMPARED TO FINANCIAL YEAR 2014
INCOME
Their total income increased by 2 per cent to Rs.1215.800 Million in FY 15 from Rs.1191.700 Million in FY 14. Revenue from Kidzee and MLZS business grew by 22% in FY15 to Rs.1075.600 Million vis-à-vis Rs.882.200 Million during FY14. However, top line growth looks muted on account of transferring the operations of servicing educational content of Television channel ZeeQ to their group company and due to planned reduction in non-core businesses.
OTHER INCOME
The Company earned other income of Rs.47.300 Million in FY15 up from Rs.31.800 Million in FY14 largely on account of Liabilities/Excess provision written back during the year and Premium on Redemption of Preference shares.
EXPENDITURE
Total expenditure decreased by 6 per cent to Rs.1166.900 Million in FY15 from Rs.1236.800 Million in FY 14 largely on account of planned reduction of non-core business and transfer of operations of servicing educational content of Television channel ZeeQ resulting in lower cost of goods sold and employees expenses.
COST OF GOODS SOLD
AND OPERATIONAL EXPENSES
Cost of goods sold and operational expenses decreased by 10 per cent to Rs.344.400 Million in FY15 from Rs.384.200 Million in FY14.
EMPLOYEE BENEFITS
EXPENSES
Employee benefits expenses decreased by 20 per cent to Rs.249.500 Million in FY15 from Rs.312.700 Million in FY14.
OTHER EXPENSES
Other expenses decreased by 5 per cent to Rs.372.500 Million in FY15 from Rs.391.200 Million in FY14 mainly on account of reduction in travelling and conveyance expenses, legal and professional charges and Provision for doubtful debts and advances.
FINANCE COSTS
The increase in finance costs by 61 per cent from Rs.82.300 Million in FY14 to Rs.132.500 Million in FY15 is on account of interest charged on loans for the full year during FY15 as against charged on pro rata basis during FY14.
DEPRECIATION AND
AMORTISATION EXPENSES
Depreciation and amortisation expenses increased marginally by 2 per cent to Rs.68.000 Million in FY15 from Rs.66.400 Million in FY14.
UNSECURED LOAN
|
Unsecured Loan |
31.03.2015 (Rs.
in Million) |
31.03.2014 (Rs.
in Million) |
|
Short-term
borrowings |
|
|
|
Incorporated Deposits |
293.691 |
0.000 |
|
Includes Interest of Rs. 70.391 Million (Previous Year Rs. Nill) |
|
|
|
Total |
293.691 |
0.000 |
INDEX
OF CHARGES
|
S.No. |
Charge ID |
Date of Charge Creation/Modification |
Charge amount secured |
Charge Holder |
Address |
Service Request Number (SRN) |
|
1 |
10565827 |
31/03/2015 |
650,000,000.00 |
IDBI TRUSTEESHIP SERVICES LIMITED |
Asian Bldg., Ground Floor, 17, R.Kamani Marg, Ballard Estate, MUMBAI, Maharashtra
- 400001, INDIA |
C50654235 |
|
2 |
10543486 |
23/12/2014 |
2,678,800,000.00 |
Axis Trustee Services Limited |
Axis House, 2nd Flr, Bombay Dyeing Mills Compound, |
C40675753 |
|
3 |
10542732 |
22/12/2014 |
50,000,000.00 |
YES BANK LIMITED |
9TH FLOOR, NEHRU CENTRE, DISCOVERY OF INDIA, DR. |
C40305385 |
|
4 |
10471048 |
30/12/2013 |
530,000,000.00 |
YES BANK LIMITED |
9TH FLOOR, NEHRU CENTRE, DISCOVERY OF INDIA, DR. |
B93837151 |
UNAUDITED FINANCIAL
RESULTS (PROVISIONAL) FOR THE QUARTER ENDED JUNE 30, 2015
(Rs. In Million)
|
|
|
Particulars |
Quarter ended
30.06.2015 |
|
1 |
|
Income from
Operations |
|
|
|
|
Sales/Income from Operations (Gross) |
357.922 |
|
|
Total Income from
Operations (Net) |
357.922 |
|
|
2 |
Expenses |
|
|
|
|
a) |
Purchase of Education goods and television content |
87.605 |
|
|
b) |
Changes in inventories of finished goods, work-in-progress and
stock-in-trade |
(2.743) |
|
|
c) |
Operating Costs |
5.561 |
|
|
d) |
Employee benefit expenses |
61.707 |
|
|
e) |
Depreciation and amortization expense |
15.443 |
|
|
f) |
Marketing, Advertisement and Publicity expenses |
46.838 |
|
|
g) |
Other expenses |
76.943 |
|
|
Total Expenses |
291.354 |
|
|
|
|
|
|
|
3 |
|
Profit /(Loss) from
operations before other income, finance costs and exceptional items |
66.568 |
|
4 |
Other Income |
5.856 |
|
|
5 |
Profit /(Loss) from
ordinary activities before finance costs and exceptional items |
72.424 |
|
|
6 |
Finance Costs |
32.845 |
|
|
7 |
Profit /(Loss) from
ordinary activities after finance costs but before exceptional items |
39.579 |
|
|
8 |
Exceptional Items |
-- |
|
|
9 |
Profit /(Loss) from
ordinary activities before tax |
39.579 |
|
|
10 |
Tax Expense |
-- |
|
|
11 |
Net Profit /(Loss)
from ordinary activities after tax |
39.579 |
|
|
12 |
Paid up equity share capital (Eq. shares of Rs.10/- each) |
320.086 |
|
|
13 |
Reserve excluding revaluation reserves |
|
|
|
14 |
|
Earnings per share (before/after extraordinary items) of Rs.10/- each |
|
|
|
|
Basic & Diluted |
0.12 |
|
|
|
|
|
|
A |
|
PARTICULARS OF
SHAREHOLDING |
|
|
1 |
|
Public Shareholding |
|
|
|
|
- No. of Shares |
122793606 |
|
|
|
- Percentage of Shareholding |
38.36% |
|
2 |
|
Promoters and promoter group shareholding |
|
|
|
|
a) Pledged/Encumbered |
|
|
|
|
- Number of shares |
123651122 |
|
|
|
- Percentage of shares ( as a % of the total shareholding of the promoter and promoter group) |
62.67% |
|
|
|
- Percentage of shares (as a % of the total share capital of the Company) |
38.63% |
|
|
|
b) Non- encumbered |
|
|
|
|
- Number of shares |
73641757 |
|
|
|
- Percentage of shares ( as a % of the total shareholding of the promoter and promoter group) |
37.33% |
|
|
|
- Percentage of shares (as a % of the total share capital of the Company) |
23.01% |
|
Particulars |
Quarter Ended 30.06.2015 |
|
Pending at the beginning of the quarter |
Nil |
|
Received during the quarter |
Nil |
|
Disposed of during the quarter |
Nil |
|
Remaining unresolved at the end of the
quarter |
Nil |
Note :
Note :
1. The above results were reviewed by the Audit Committee and thereafter approved by the Board of Directors In its meeting held on 30 July, 2015.
2. As the Company's business activity falls within a single primary business
segment viz "Educational Services", the disclosure requirements of
Accounting Standards (AS-17) "Segment Reporting" is not applicable.
3. The Statutory Auditors have carried out a "Limited Review" of the
above standalone financial results for the quarter ended 30 June, 2015.
4. During the quarter, the Company has issued and allotted 85,388 Equity shares
to eligible employees under the Employee Stock Option Scheme 2010.
5. On 28 June 2015, a fire occurred in one of the warehouses of the company at
Bhiwandi, Mumbai and the inventory of educational material lying at the said
Warehouse, amounting to Rs.141.661 Million got completely destroyed. The
company has lodged the claim with the Insurance company for the loss incurred.
Pending settlement of insurance claim, the loss is accounted as "Claim
Receivable" under Other current assets amounting to Rs.141.661 Milion. On
settlement of the claim by the insurance company, the difference in loss
claimed and the actual claim received, if any, will be charged to Statement of
Profit &. Loss account.
6. Tax expense (Current tax, deferred tax and MAT) will be reviewed and
provided at the year end.
7. Previous period / year’s figures have been regrouped, wherever necessary.
CONTINGENT
LIABILITIES:
(Rs. in million)
|
PARTICULARS |
31.03.2015 |
31.03.2014 |
|
i) |
|
|
|
a) Claims against the company not acknowledged as debts |
12.380 |
5.427 |
|
b) Disputes Direct Tax |
1.651 |
1.651 |
|
c) Disputes Indirect Taxes |
40.276 |
30.407 |
|
d) Corporate guarantee to wholly owned Subsidiary to the extent loans
availed/outstanding Rs. 2522.300 Million (Previous year Rs. 1664.752 Million
) |
2678.800 |
3613.900 |
ii) The company has entered into warehousing arrangement
for its inventories for its educational goods and equipments with a service
provider. During the year, there was a dispute with the service provider and
company has issued termination letter giving three months notice as per terms
of the contact. However, the service provider stopped rendering the services
during the notice period and refused to give the inventory of the Company. On
approaching the court, the Company obtained the custody of the inventory and
filed a claim for damaged of Rs. 600.000 Million with interest against the
service provider, which is under arbitration.
FIXED ASSETS
Tangible Assets
- Freehold Land
- Leasehold
Assets Improvement
- Equipments
- Computer
- Furniture and
Fixture
Intangible Assets
Content Development- Software’s
CMT REPORT (Corruption, Money Laundering & Terrorism]
The Public Notice information has been collected from various sources
including but not limited to: The Courts,
1] INFORMATION ON
DESIGNATED PARTY
No exist designating subject or any of its beneficial owners,
controlling shareholders or senior officers as terrorist or terrorist
organization or whom notice had been received that all financial transactions
involving their assets have been blocked or convicted, found guilty or against
whom a judgement or order had been entered in a proceedings for violating
money-laundering, anti-corruption or bribery or international economic or
anti-terrorism sanction laws or whose assets were seized, blocked, frozen or
ordered forfeited for violation of money laundering or international
anti-terrorism laws.
2] Court Declaration :
No records exist to suggest that subject is
or was the subject of any formal or informal allegations, prosecutions or other
official proceeding for making any prohibited payments or other improper
payments to government officials for engaging in prohibited transactions or
with designated parties.
3] Asset Declaration :
No records exist to suggest that the property or assets of the subject
are derived from criminal conduct or a prohibited transaction.
4] Record on Financial
Crime :
Charges or conviction
registered against subject: None
5] Records on Violation of
Anti-Corruption Laws :
Charges or
investigation registered against subject: None
6] Records on Int’l
Anti-Money Laundering Laws/Standards :
Charges or
investigation registered against subject: None
7] Criminal Records
No
available information exist that suggest that subject or any of its principals
have been formally charged or convicted by a competent governmental authority
for any financial crime or under any formal investigation by a competent
government authority for any violation of anti-corruption laws or international
anti-money laundering laws or standard.
8] Affiliation with
Government :
No record
exists to suggest that any director or indirect owners, controlling
shareholders, director, officer or employee of the company is a government
official or a family member or close business associate of a Government
official.
9] Compensation Package :
Our market
survey revealed that the amount of compensation sought by the subject is fair
and reasonable and comparable to compensation paid to others for similar
services.
10] Press Report :
No press reports / filings exists on
the subject.
CORPORATE GOVERNANCE
MIRA INFORM as part of its Due Diligence do provide comments on
Corporate Governance to identify management and governance. These factors often
have been predictive and in some cases have created vulnerabilities to credit
deterioration.
Our Governance Assessment focuses principally on the interactions
between a company’s management, its Board of Directors, Shareholders and other
financial stakeholders.
CONTRAVENTION
Subject is not known to have contravened any existing local laws,
regulations or policies that prohibit, restrict or otherwise affect the terms
and conditions that could be included in the agreement with the subject.
FOREIGN EXCHANGE RATES
|
Currency |
Unit
|
Indian Rupees |
|
US Dollar |
1 |
Rs.64.96 |
|
|
1 |
Rs.100.55 |
|
Euro |
1 |
Rs.73.99 |
INFORMATION DETAILS
|
Information
Gathered by : |
SVA |
|
|
|
|
Analysis Done by
: |
DIV |
|
|
|
|
Report Prepared
by : |
SUJ |
SCORE & RATING EXPLANATIONS
|
SCORE FACTORS |
RANGE |
POINTS |
|
HISTORY |
1~10 |
5 |
|
PAID-UP CAPITAL |
1~10 |
5 |
|
OPERATING SCALE |
1~10 |
6 |
|
FINANCIAL
CONDITION |
|
|
|
--BUSINESS SCALE |
1~10 |
5 |
|
--PROFITABILITY |
1~10 |
6 |
|
--LIQUIDITY |
1~10 |
5 |
|
--LEVERAGE |
1~10 |
5 |
|
--RESERVES |
1~10 |
7 |
|
--CREDIT LINES |
1~10 |
5 |
|
--MARGINS |
-5~5 |
-- |
|
DEMERIT POINTS |
|
|
|
--BANK CHARGES |
YES/NO |
YES |
|
--LITIGATION |
YES/NO |
NO |
|
--OTHER ADVERSE INFORMATION |
YES/NO |
NO |
|
MERIT POINTS |
|
|
|
--SOLE DISTRIBUTORSHIP |
YES/NO |
NO |
|
--EXPORT ACTIVITIES |
YES/NO |
NO |
|
--AFFILIATION |
YES/NO |
YES |
|
--LISTED |
YES/NO |
YES |
|
--OTHER MERIT FACTORS |
YES/NO |
YES |
|
DEFAULTER |
|
|
|
--RBI |
YES/NO |
NO |
|
--EPF |
YES/NO |
NO |
|
TOTAL |
|
50 |
This score serves as a reference to assess
SC’s credit risk and to set the amount of credit to be extended. It is
calculated from a composite of weighted scores obtained from each of the major
sections of this report. The assessed factors and their relative weights (as
indicated through %) are as follows:
Financial
condition (40%) Ownership
background (20%) Payment
record (10%)
Credit history
(10%) Market trend (10%) Operational size
(10%)
RATING EXPLANATIONS
|
RATING |
STATUS |
PROPOSED CREDIT LINE |
|
|
>86 |
Aaa |
Possesses an extremely sound financial base with the strongest
capability for timely payment of interest and principal sums |
Unlimited |
|
71-85 |
Aa |
Possesses adequate working capital. No caution needed for credit transaction.
It has above average (strong) capability for payment of interest and
principal sums |
Large |
|
56-70 |
A |
Financial & operational base are regarded healthy. General
unfavourable factors will not cause fatal effect. Satisfactory capability for
payment of interest and principal sums |
Fairly Large |
|
41-55 |
Ba |
Overall operation is considered normal. Capable to meet normal
commitments. |
Satisfactory |
|
26-40 |
B |
Capability to overcome financial difficulties seems comparatively below
average. |
Small |
|
11-25 |
Ca |
Adverse factors are apparent. Repayment of interest and principal sums
in default or expected to be in default upon maturity |
Limited with
full security |
|
<10 |
C |
Absolute credit risk exists. Caution needed to be exercised |
Credit not
recommended |
|
-- |
NB |
New Business |
-- |
This report is issued at your request without any
risk and responsibility on the part of MIRA INFORM PRIVATE LIMITED (MIPL) or
its officials.