MIRA
INFORM REPORT
|
Report No. : |
345868 |
|
Report Date : |
23.10.2015 |
IDENTIFICATION DETAILS
|
Name : |
N & N FOODS COMPANY LIMITED |
|
|
|
|
Registered Office : |
5/7-8, 5/10 Moo 4, |
|
|
|
|
Country : |
|
|
|
|
|
Financials (as on) : |
31.03.2015 |
|
|
|
|
Date of Incorporation : |
03.01.1990 |
|
|
|
|
Com. Reg. No.: |
0105533000649 |
|
|
|
|
Legal Form : |
Private Limited Company |
|
|
|
|
Line of Business : |
Manufacturer & Exporter of Frozen Food Products. |
|
|
|
|
No. of Employees : |
700 |
RATING & COMMENTS
|
MIRA’s Rating : |
Ba |
|
RATING |
STATUS |
PROPOSED CREDIT LINE |
|
|
41-55 |
Ba |
Overall operation is considered normal. Capable to meet normal
commitments. |
Satisfactory |
|
Status : |
Satisfactory |
|
|
|
|
Payment Behaviour : |
No Complaints |
|
|
|
|
Litigation : |
Clear |
NOTES:
Any query related to this report can be made
on e-mail: infodept@mirainform.com
while quoting report number, name and date.
ECGC Country Risk Classification List – March 31, 2015
|
Country Name |
Previous Rating (31.12.2014) |
Current Rating (31.03.2015) |
|
Thailand |
A2 |
A2 |
|
Risk Category |
ECGC
Classification |
|
Insignificant |
A1 |
|
Low |
A2 |
|
Moderate |
B1 |
|
High |
B2 |
|
Very High |
C1 |
|
Restricted |
C2 |
|
Off-credit |
D |
Company name
N & N
FOODS COMPANY LIMITED
SUMMARY
BUSINESS ADDRESS : 5/7-8, 5/10 MOO
4, SAI SETTHAKIJ
ROAD, T.
NADEE, A. MUANG, SAMUTSAKORN 74000, THAILAND
TELEPHONE : [66] 34
425-279, 34 826-338,
34 426-952
FAX :
[66] 34
426-951, 34 423-537
E-MAIL
ADDRESS : khaesuda@nnfoods.co.th
REGISTRATION
ADDRESS : SAME
AS BUSINESS ADDRESS
ESTABLISHED
: 1990
REGISTRATION
NO. : 0105533000649
TAX
ID NO. : 3101787139
CAPITAL REGISTERED : BHT. 50,000,000
CAPITAL PAID-UP : BHT.
50,000,000
SHAREHOLDER’S PROPORTION : JAPANESE :
96.40%
THAI
: 3.60%
FISCAL YEAR CLOSING DATE : MARCH
31
LEGAL
STATUS : PRIVATE LIMITED
COMPANY
EXECUTIVE : MR. SHINJI KAWAGUCHI,
JAPANESE
MANAGING DIRECTOR
NO.
OF STAFF : 700
LINES
OF BUSINESS : FROZEN FOOD
PRODUCTS
MANUFACTURER & EXPORTER
CORPORATE PROFILE
OPERATING
TREND : STABLE
PRESENT
SITUATION : OPERATING NORMALLY
REPUTATION : GOOD
WITH NORMAL BUSINESS
ENGAGEMENT
MANAGEMENT
STANDARD : MANAGEMENT WITH
FAIR PERFORMANCE
HISTORY
The
subject was established
on January 3,
1990 as a
private limited company
under the registered
name N & N FOODS
COMPANY LIMITED. by Thai and Japanese groups. Its
business objective is to manufacture
and export various
kinds of frozen food products. It currently
employs approximately 700 staff.
The subject is a subsidiary of
Maruha Nichiro Corporation,
in Japan.
The
subject’s registered address
is 5/7-8, 5/10
Moo 4, Sai
Setthakij Rd., T. Nadee,
A.
Muang, Samutsakorn 74000,
and this is
the subject’s current
operation address.
THE BOARD OF DIRECTOR
|
Name |
|
Nationality |
Age |
|
|
|
|
|
|
Mr. Hiroaki Onishi |
|
Japanese |
57 |
|
Mr. Hiroshi Soeda |
[x] |
Japanese |
45 |
|
Mr. Nobuyuki Morita |
[x] |
Japanese |
55 |
|
Mr. Hideo Kikuchi |
|
Japanese |
59 |
|
Mr. Shinji Kawaguchi |
[x] |
Japanese |
59 |
AUTHORIZED PERSON
Any of the
mentioned directors [x] can
sign on behalf
of the subject
with company’s affixed.
MANAGEMENT
Mr. Shinji Kawaguchi
is the Managing
Director.
He is Japanese
nationality with the
age of 59
years old.
BUSINESS OPERATIONS
The subject is
engaged in manufacturing and exporting
various kinds of Japanese
foods and frozen
seafood products, consist
of 5 main products
as follows:
1. Breaded
Products
- Breaded
shrimp
- Breaded
shrimp patties
- Breaded
skewers
- Breaded
cream croquette
- Breaded
pork
2. Fried Products
- Kakiage
- Shrimp
fritter
- Shrimp
tempura
3. Baked Products
- Takoyaki
- Okonomiyaki
4. Wreped products
- Shrimp
stick roll
- Spring
roll
5. Other Products
- Ebi
chili & tomato base sauce
- Dim
sum products
- Shrimp
gyoza/shrimp toast
- Gyoza
[Japanese style]
- Shaomai
[Japanese style]
- Chimaki
[Japanese style]
PRODUCTION CAPACITY
30 tons per day
PURCHASE
80% of raw
materials is purchased
from local suppliers,
the remaining 20%
is imported from
Japan, India, Myanmar, Vietnam,
Australia and Republic
of China.
MAJOR
SUPPLIER
Narong
Seafood Co., Ltd.
EXPORT
100% of the
products is exported
to Japan, Singapore,
Indonesia, India, Hong
Kong, Republic of
China, Malaysia, U.S.A.,
and the countries
in Europe.
SUBSIDIARY AND AFFILIATED COMPANY
The subject is
not found to
have any subsidiary
or affiliated company
here in Thailand.
LITIGATION
Bankruptcy and Receivership
There are no
litigation on bankruptcy
and receivership cases
filed against the
subject found at
Legal Execution Department
for the past
five years.
Others
There are no
legal suits filed
against the subject
according to the past
two years.
CREDIT
Local bills are
paid by cash
or on the
credits term of
30-60 days.
Imports are by
L/C or T/T.
Exports are against
T/T.
BANKING
Mizuho
Corporate Bank Ltd.
[Bangkok
Branch, 48 North
Sathorn Road, Silom,
Bangrak, Bangkok]
Siam
Commercial Bank Public
Co., Ltd.
Bangkok
Bank Public Co.,
Ltd.
EMPLOYMENT
The
subject employs approximately
700 staff.
LOCATION DETAILS
The
premise is rented
for administrative office,
factory and warehouse
on 42,072 square
meters of land,
at the heading
address. Premise is
located in provincial, on the
outskirts of Bangkok.
COMMENT
The
subject’s sales revenue
and net profit as
of March 31,
2015 were decreased
comparing to the
same period of
the previous year.
However, the subject
would have an
advantage from a
weakness of Thai
baht against other
currencies at the
moment which is
favourable to the
exporter. Generally, frozen
food products is
still promising for
export markets.
FINANCIAL INFORMATION
The
capital was registered at Bht. 50,000,000 divided into 50,000 shares
of Bht. 1,000 each
with fully paid.
THE SHAREHOLDERS LISTED WERE
[as
at July 10,
2015]
|
NAME |
HOLDING |
% |
|
|
|
|
|
Maruha Nichiro Corporation Nationality: Japanese Address : 2-20-3
Chome Toyotsu, Koto-ku,
Tokyo, Japan
|
48,198 |
96.40 |
|
Narong Seafood Co.,
Ltd. Nationality: Thai Address
: 5/4-6 Moo
4, Sai Setthakij Rd., T.
Nadee, A.
Muang, Samutsakorn |
1,796 |
3.59 |
|
Mrs. Wanida Piboontanapattana Nationality: Thai Address : 50/122
Moo 14, T. Bangkaew, A. Bangplee,
Samutprakarn |
3 |
|
|
Mr. Viroj Limsanit Nationality: Thai Address : 236/61
Nanglinchee Rd., Bangpongpang,
Yannawa, Bangkok |
1 |
= 0.01 |
|
Mr. Nobuyuki Morita Nationality: Japanese Address : 5-2-1
Taishomashi Omuta-City,
Fukuoka, Japan |
1 |
|
|
Mr. Hiroshi Soeda Nationality: Japanese Address : Japan |
1 |
|
Total Shareholders : 6
Share Structure [as
at July 10,
2015]
|
Nationality |
Shareholders |
No. of Share |
% Shares |
|
|
|
|
|
|
Thai |
3 |
1,800 |
3.60 |
|
Foreign - Japanese |
3 |
48,200 |
96.40 |
|
Total |
6 |
50,000 |
100.00 |
NAME OF AUDITOR & CERTIFIED PUBLIC ACCOUNTANT NO.
Ms. Bongkot Amsa-ngiem No. 3684
BALANCE SHEET [BAHT]
The latest financial figures published
as at March
31, 2015, 2014
& 2013 were:
ASSETS
|
Current Assets |
2015 |
2014 |
2013 |
|
|
|
|
|
|
Cash and Cash Equivalents |
148,805,396 |
149,632,394 |
46,038,752 |
|
Trade Accounts Receivable
|
27,748,692 |
35,894,993 |
52,425,074 |
|
Other Receivable |
18,403,908 |
23,426,788 |
28,033,287 |
|
Inventories |
103,320,507 |
77,397,106 |
148,079,665 |
|
Other Current Assets
|
590,716 |
628,040 |
614,046 |
|
|
|
|
|
|
Total Current Assets
|
298,869,219 |
286,979,321 |
275,190,824 |
|
|
|
|
|
|
Fixed Assets |
142,664,582 |
148,262,628 |
152,599,340 |
|
Intangible Assets |
1,820,030 |
30 |
40,679 |
|
Other Non-current Assets |
913,984 |
1,440,490 |
1,067,325 |
|
Total Assets |
444,267,815 |
436,682,469 |
428,898,168 |
LIABILITIES &
SHAREHOLDERS’ EQUITY [BAHT]
|
Current
Liabilities |
2015 |
2014 |
2013 |
|
|
|
|
|
|
Trade Accounts Payable
|
22,818,305 |
16,671,002 |
29,559,502 |
|
Other Payable |
11,295,361 |
11,596,406 |
17,031,050 |
|
Accrued Income Tax |
2,413,458 |
3,217,249 |
1,208,642 |
|
Current Portion of
Financial Lease Contract Liabilities |
310,649 |
290,427 |
750,499 |
|
|
|
|
|
|
Total Current Liabilities |
36,837,773 |
31,775,084 |
48,549,693 |
|
Financial Lease Contract Liabilities |
418,902 |
729,552 |
1,019,979 |
|
Employee Benefits Obligation |
10,188,666 |
13,099,584 |
12,915,997 |
|
Total Liabilities |
47,445,341 |
45,604,220 |
62,485,669 |
|
|
|
|
|
|
Shareholders' Equity |
|
|
|
|
|
|
|
|
|
Share capital : Baht 1,000
par value authorized and
issued share capital
50,000 shares |
50,000,000 |
50,000,000 |
50,000,000 |
|
|
|
|
|
|
Capital Paid |
50,000,000 |
50,000,000 |
50,000,000 |
|
Retained Earnings: Appropriated for statutory
reserve |
5,000,000 |
5,000,000 |
5,000,000 |
|
Unappropriated |
341,822,474 |
336,078,249 |
311,412,499 |
|
Total Shareholders' Equity |
396,822,474 |
391,078,249 |
366,412,499 |
|
Total Liabilities & Shareholders' Equity |
444,267,815 |
436,682,469 |
428,898,168 |
PROFIT & LOSS ACCOUNT
|
Revenue |
2015 |
2014 |
2013 |
|
|
|
|
|
|
Sales Income |
701,178,777 |
755,872,424 |
869,947,034 |
|
Investment Income |
742,473 |
659,023 |
172,652 |
|
Gain on Exchange Rate |
5,087,434 |
69,696,165 |
33,089,469 |
|
Other Income |
6,822,940 |
3,051,711 |
4,427,227 |
|
Total Revenues |
713,831,624 |
829,279,323 |
907,636,382 |
|
Expenses |
|
|
|
|
|
|
|
|
|
Cost of Goods
Sold |
637,050,576 |
727,497,553 |
810,025,946 |
|
Selling Expenses |
19,112,953 |
24,697,008 |
28,268,694 |
|
Administrative Expenses |
43,763,812 |
47,541,363 |
58,587,310 |
|
Total Expenses |
699,927,341 |
799,735,924 |
896,881,950 |
|
Profit / [Loss] before Income
Tax |
13,904,283 |
29,543,399 |
10,754,432 |
|
Income Tax |
[3,160,058] |
[4,877,649] |
[2,344,612] |
|
|
|
|
|
|
Net Profit / [Loss] |
10,744,225 |
24,665,750 |
8,409,820 |
FINANCIAL ANALYSIS
|
ITEM |
UNIT |
2015 |
2014 |
2013 |
|
|
|
|
|
|
|
LIQUIDITY RATIO |
|
|
|
|
|
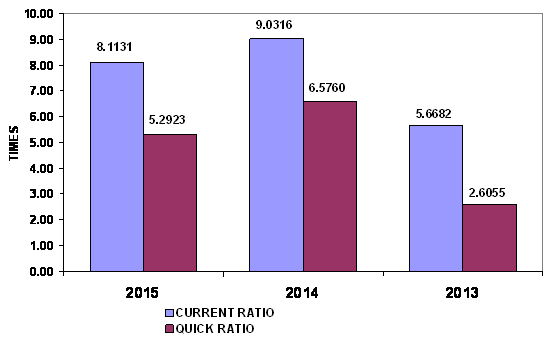
CURRENT RATIO |
TIMES |
8.11 |
9.03 |
5.67 |
|
QUICK RATIO |
TIMES |
5.29 |
6.58 |
2.61 |
|
|
|
|
|
|
|
ACTIVITY RATIO |
|
|
|
|
|
FIXED ASSETS TURNOVER |
TIMES |
4.91 |
5.10 |
5.70 |
|
TOTAL ASSETS TURNOVER |
TIMES |
1.58 |
1.73 |
2.03 |
|
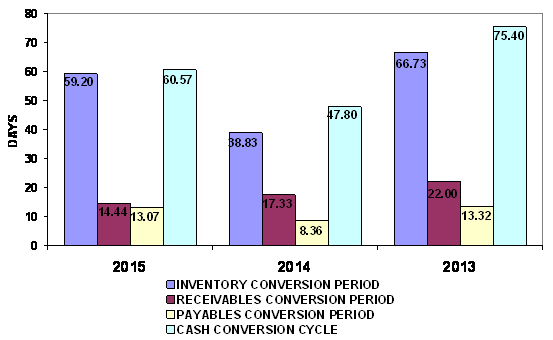
INVENTORY CONVERSION PERIOD |
DAYS |
59.20 |
38.83 |
66.73 |
|
INVENTORY TURNOVER |
TIMES |
6.17 |
9.40 |
5.47 |
|
RECEIVABLES CONVERSION PERIOD |
DAYS |
14.44 |
17.33 |
22.00 |
|
RECEIVABLES TURNOVER |
TIMES |
25.27 |
21.06 |
16.59 |
|
PAYABLES CONVERSION PERIOD |
DAYS |
13.07 |
8.36 |
13.32 |
|
CASH CONVERSION CYCLE |
DAYS |
60.57 |
47.80 |
75.40 |
|
|
|
|
|
|
|
PROFITABILITY
RATIO |
|
|
|
|
|
COST OF GOODS SOLD |
% |
90.85 |
96.25 |
93.11 |
|
SELLING & ADMINISTRATION |
% |
8.97 |
9.56 |
9.98 |
|
INTEREST |
% |
- |
- |
- |
|
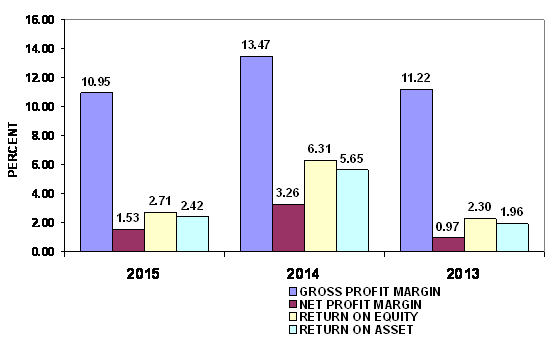
GROSS PROFIT MARGIN |
% |
10.95 |
13.47 |
11.22 |
|
NET PROFIT MARGIN BEFORE EX. ITEM |
% |
1.98 |
3.91 |
1.24 |
|
NET PROFIT MARGIN |
% |
1.53 |
3.26 |
0.97 |
|
RETURN ON EQUITY |
% |
2.71 |
6.31 |
2.30 |
|
RETURN ON ASSET |
% |
2.42 |
5.65 |
1.96 |
|
EARNING PER SHARE |
BAHT |
214.88 |
493.32 |
168.20 |
|
|
|
|
|
|
|
LEVERAGE RATIO |
|
|
|
|
|
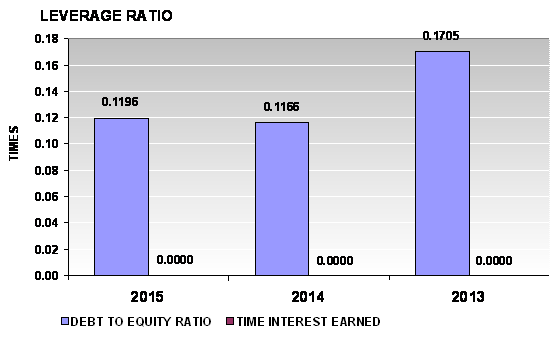
DEBT RATIO |
TIMES |
0.11 |
0.10 |
0.15 |
|
DEBT TO EQUITY RATIO |
TIMES |
0.12 |
0.12 |
0.17 |
|
TIME INTEREST EARNED |
TIMES |
- |
- |
- |
|
|
|
|
|
|
|
ANNUAL GROWTH |
|
|
|
|
|
SALES GROWTH |
% |
(7.24) |
(13.11) |
|
|
OPERATING PROFIT |
% |
(52.94) |
174.71 |
|
|
NET PROFIT |
% |
(56.44) |
193.30 |
|
|
FIXED ASSETS |
% |
(3.78) |
(2.84) |
|
|
TOTAL ASSETS |
% |
1.74 |
1.81 |
|
ANNUAL GROWTH :
RISKY
An annual sales growth is -7.24%. Turnover has decreased from THB
PROFITABILITY :
RISKY
PROFITABILITY
RATIO
|
Gross Profit Margin |
10.95 |
Deteriorated |
Industrial
Average |
70.16 |
|
Net Profit Margin |
1.53 |
Deteriorated |
Industrial
Average |
3.84 |
|
Return on Assets |
2.42 |
Deteriorated |
Industrial
Average |
5.16 |
|
Return on Equity |
2.71 |
Deteriorated |
Industrial
Average |
12.38 |
Gross Profit Margin used to assess a firm's financial health by revealing
the proportion of money left over from revenues after accounting for the cost
of goods sold. Gross profit margin serves as the source for paying additional
expenses and future savings. The company's figure is 10.95%. When compared with
the industry average, the ratio of the company was lower. This indicated that
company may have problems with control over its costs.
Net Profit Margin is the indicator of the company's efficiency in that net
profit takes into consideration all expenses of the company. A low profit
margin indicates a low margin of safety, higher risk that a decline in sales
will erase profits and result in a net loss. The company's figure is 1.53%.
When compared with the industry average, the ratio of the company was lower.
Return on Assets measures how efficiently profits are being generated
from the assets employed in the business when compared with the ratios of firms
in a similar business. A low ratio in comparison with industry averages
indicates an inefficient use of business assets. When compared with the
industry average, it was lower, the
company's figure is 2.42%.
Return on Equity indicates how profitable a company is by comparing its
net income to its average shareholders' equity, ROE measures how much the
shareholders earned for their investment in the company. When compared with the
industry average, it was lower, the company's figure is 2.71%.
Trend of the average
competitors in the same industry for last 5 years
Return on Assets Uptrend
Return on Equity Uptrend
LIQUIDITY :
IMPRESSIVE
LIQUIDITY RATIO
|
Current Ratio |
8.11 |
Impressive |
Industrial
Average |
1.23 |
|
Quick Ratio |
5.29 |
|
|
|
|
Cash Conversion Cycle |
60.57 |
|
|
|
The Current Ratio is to ascertain whether a company's short-term assets
are readily available to pay off its short-term liabilities. The company's figure
is 8.11 times in 2015, decrease from 9.03 times, then it is generally
considered to have good short-term financial strength. When compared with the
industry average, the ratio of the company was higher, indicated that company
was an efficient operator in a dominant position within its industry.
The Quick Ratio is a liquidity indicator that further refines the
current ratio by measuring the amount of the most liquid current assets there
are to cover current liabilities. The company's figure is 5.29 times in 2015,
decrease from 6.58 times, although excluding inventory so the company still
have good short-term financial strength.
The Cash Conversion Cycle measures the number of days a company's cash
is tied up in the production and sales process of its operations and the
benefit from payment terms from its creditors. It meant the company could
survive when no cash inflow was received from sale for 61 days.
Trend of the
average competitors in the same industry for last 5 years
Current Ratio Uptrend
LEVERAGE :
EXCELLENT
LEVERAGE RATIO
|
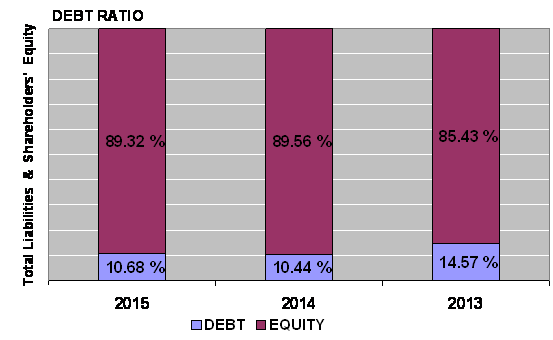
Debt Ratio |
0.11 |
Impressive |
Industrial
Average |
0.51 |
|
Debt to Equity Ratio |
0.12 |
Impressive |
Industrial
Average |
1.05 |
|
Times Interest Earned |
- |
|
Industrial
Average |
- |
Debt to Equity Ratio a measurement of how much suppliers, lenders,
creditors and obligors have committed to the company versus what the
shareholders have committed. A lower the percentage means that the company is
using less leverage and has a stronger equity position.
Debt Ratio shows the proportion of a company's assets which are financed
through debt. The company's figure is 0.11 less than 0.5, most of the company's
assets are financed through equity.
Trend of the average
competitors in the same industry for last 5 years
Debt Ratio Downtrend
Times Interest Earned Stable
ACTIVITY :
EXCELLENT
ACTIVITY RATIO
|
Fixed Assets Turnover |
4.91 |
Impressive |
Industrial
Average |
- |
|
Total Assets Turnover |
1.58 |
Impressive |
Industrial
Average |
1.27 |
|
Inventory Conversion Period |
59.20 |
|
|
|
|
Inventory Turnover |
6.17 |
Impressive |
Industrial
Average |
3.68 |
|
Receivables Conversion Period |
14.44 |
|
|
|
|
Receivables Turnover |
25.27 |
Impressive |
Industrial
Average |
2.27 |
|
Payables Conversion Period |
13.07 |
|
|
|
The company's Account Receivable Ratio is calculated as 25.27 and
Inventory Turnover in Days Ratio indicates the liquidity of inventory.
It estimates the number of days that it will take to sell the current
inventory. Inventory is particularly sensitive to change in business
activities. The inventory turnover in days has increased from 39 days at the
end of 2014 to 59 days at the end of 2015. This represents a negative trend.
And Inventory turnover has decreased from 9.4 times in year 2014 to 6.17 times
in year 2015.
The company's Total Asset Turnover is calculated as 1.58 times and 1.73
times in 2015 and 2014 respectively. This ratio is determined by dividing total
assets into total sales turnover. The ratio measures the activity of the assets
and the ability of the firm to generate sales through the use of the assets.
Trend of the
average competitors in the same industry for last 5 years
Fixed Assets Turnover Stable
Total Assets Turnover Downtrend
Inventory Turnover Downtrend
Receivables Turnover Downtrend
FOREIGN EXCHANGE RATES
|
Currency |
Unit
|
Indian Rupees |
|
US Dollar |
1 |
Rs.64.89 |
|
|
1 |
Rs.100.39 |
|
Euro |
1 |
Rs.73.52 |
INFORMATION DETAILS
|
Analysis Done by
: |
KAR |
|
|
|
|
Report Prepared
by : |
NIT |
RATING EXPLANATIONS
|
RATING |
STATUS |
PROPOSED CREDIT LINE |
|
|
|
>86 |
Aaa |
Possesses an extremely sound financial base with the strongest capability
for timely payment of interest and principal sums |
Unlimited |
|
|
71-85 |
Aa |
Possesses adequate working capital. No caution needed for credit
transaction. It has above average (strong) capability for payment of interest
and principal sums |
Large |
|
|
56-70 |
A |
Financial & operational base are regarded healthy. General
unfavourable factors will not cause fatal effect. Satisfactory capability for
payment of interest and principal sums |
Fairly Large |
|
|
41-55 |
Ba |
Overall operation is considered normal. Capable to meet normal
commitments. |
Satisfactory |
|
|
26-40 |
B |
Capability to overcome financial difficulties seems comparatively
below average. |
Small |
|
|
11-25 |
Ca |
Adverse factors are apparent. Repayment of interest and principal sums
in default or expected to be in default upon maturity |
Limited with
full security |
|
|
<10 |
C |
Absolute credit risk exists. Caution needed to be exercised |
Credit not
recommended |
|
|
-- |
NB |
New Business |
-- |
|
This score serves as a reference to assess SC’s credit risk
and to set the amount of credit to be extended. It is calculated from a
composite of weighted scores obtained from each of the major sections of this
report. The assessed factors and their relative weights (as indicated through
%) are as follows:
Financial
condition (40%) Ownership
background (20%) Payment
record (10%)
Credit history
(10%) Market trend
(10%) Operational
size (10%)
This report is issued at your request without any
risk and responsibility on the part of MIRA INFORM PRIVATE LIMITED (MIPL)
or its officials.