MIRA INFORM REPORT
|
Report No. : |
346775 |
|
Report Date : |
28.10.2015 |
IDENTIFICATION DETAILS
|
Name : |
MAKILA
PROCESS SL |
|
|
|
|
Registered Office : |
C/ San Miguel De
Salinas, 12 1º G. - Torrevieja - 03185 - Alicante |
|
|
|
|
Country : |
Spain |
|
|
|
|
Financials (as on) : |
2014 |
|
|
|
|
Date of Incorporation : |
22.10.2008 |
|
|
|
|
Legal Form : |
Private Company |
|
|
|
|
Line of Business : |
Agents involved
in the sale of food, beverages and tobacco. |
|
|
|
|
No. of Employee : |
Not Available |
RATING & COMMENTS
|
MIRA’s Rating : |
Ba |
|
RATING |
STATUS |
PROPOSED CREDIT LINE |
|
|
41-55 |
Ba |
Overall operation is considered normal. Capable to meet normal
commitments. |
Satisfactory |
|
Status : |
Satisfactory |
|
|
|
|
Payment Behaviour : |
Slow but correct |
|
|
|
|
Litigation : |
Exist |
NOTES :
Any query related to this report can be made
on e-mail : infodept@mirainform.com
while quoting report number, name and date.
SPAIN - ECONOMIC OVERVIEW
After experiencing a prolonged recession in the wake of the global financial crisis that began in 2008, in 2014 Spain marked the first full year of positive economic growth in seven years, largely due to increased private consumption. At the onset of the global financial crisis Spain's GDP contracted by 3.7% in 2009, ending a 16-year growth trend, and continued contracting through most of 2013. In 2013 the government successfully shored up struggling banks - exposed to the collapse of Spain's depressed real estate and construction sectors - and in January 2014 completed an EU-funded restructuring and recapitalization program.
Until 2014, credit contraction in the private sector, fiscal austerity, and high unemployment weighed on domestic consumption and investment. The unemployment rate rose from a low of about 8% in 2007 to more than 26% in 2013, but labor reforms prompted a modest reduction to 23.7% in 2014. High unemployment strained Spain's public finances, as spending on social benefits increased while tax revenues fell. Spain’s budget deficit peaked at 11.4% of GDP in 2010, but Spain gradually reduced the deficit to just under 7% of GDP in 2013-14, slightly above the 6.5% target negotiated between Spain and the EU. Public debt has increased substantially – from 60.1% of GDP in 2010 to more than 97% in 2014.
Exports were resilient throughout the economic downturn and helped to bring Spain's current account into surplus in 2013 for the first time since 1986, where it remained in 2014. Rising labor productivity and an internal devaluation resulting from moderating labor costs and lower inflation have helped to improve foreign investor interest in the economy and positive FDI flows have been restored.
The government's efforts to implement labor, pension, health, tax, and education reforms - aimed at supporting investor sentiment - have become overshadowed by political activity in 2015 in anticipation of the national parliamentary elections in November. Spain’s 2015 budget, published in September 2014, rolls back some recently imposed taxes in advance of the elections and leaves untouched the country’s value-added tax (VAT) regime, which continues to generate significantly lower revenue than the EU average. Spain’s borrowing costs are dramatically lower since their peak in mid-2012, and despite the recent uptic in economic activity, inflation has dropped sharply, from 1.5% in 2013 to nearly flat in 2014.
|
Source
: CIA |
Company
name
MAKILA PROCESS SL
|
EXECUTIVE
SUMMARY
|
|
|
|
|
|
Name: |
MAKILA
PROCESS SL |
|
NIF /
Fiscal code: |
B54379318 |
|
Status: |
ACTIVE |
|
Incorporation
Date: |
22/10/2008 |
|
Register Data |
Register
Section 8 Sheet 114825 |
|
Last Publication in BORME: |
01/06/2015
[Increase of Capital] |
|
Last
Published Account Deposit: |
2014 |
|
Share
Capital: |
143.000 |
|
|
|
|
Localization: |
C/ SAN
MIGUEL DE SALINAS, 12 1º G. - TORREVIEJA - 03185 - ALICANTE |
|
Telephone
- Fax - Email - Website: |
Telephone.
968 672 632 / 966 743 938 Website. makilaprocess.es |
|
|
|
|
Activity: |
|
|
NACE: |
4617 -
Agents involved in the sale of food, beverages and tobacco |
|
Registered
Trademarks: |
|
|
Audited
/ Opinion: |
No |
|
Tenders
and Awards: |
|
|
Subsidies: |
0 for a
total cost of 0 |
|
Quality
Certificate: |
No |
|
|
|
|
Scoring and Risk: |
|
|
Payment
Behaviour: |
According
to the agreed terms |
|
Prospects: |
Consolidation |
|
Industry
situation: |
Maturity |
|
|
|
|
Defaults, Legal Claims and Insolvency
Proceedings : |
|
|
|
|
|
|
|
Number |
Amount
(€) |
Most
Recent Entry |
|
Insolvency
Proceedings, Bankruptcy and Suspension of Payments |
|
Unpublished |
--- |
--- |
|
Defaults
on debt with Financial Institutions and Large Companies |
|
None |
--- |
--- |
|
Judicial
Claims (Notices, Executive Proceedings, Attachments, Auctions, Bad Debt) |
|
1 |
0 |
--- |
|
Proceedings
heard by the Civil Court |
|
Unpublished |
0 |
--- |
|
Proceedings
heard by the Labour Court |
|
Unpublished |
0 |
--- |
|
|
|
Partners: |
|
|
|
MARIA
JOSEFA LOPEZ GOMEZ |
100 % |
|
|
Shares: |
0 |
|
|
Other
Links: |
0 |
|
|
No. of
Active Corporate Bodies: |
SINGLE
ADMINISTRATOR 1 |
|
|
Ratios |
2014 |
2013 |
Change |
|
|
|
|
|
Guarantees: |
|
|
Properties
Registered: |
Company
NO, Administrator NO |
|
Financing
/ Guarantee Sources : |
Sources
NO, Guarantees NO |
|
|
|
|
INVESTIGATION SUMMARY |
|
|
This company
was incorporated in 2008 and it''s engaged in packaging of alimentary
products. It''s turnover increased by 56,81 % in 2014 vs. the previous year.
It presents a positive working capital, therefore the company would nbe able
to meet short term payment commitments. |
|
|
Interviewed
Person: |
|
|
Enquiry
Details
|
|
|
Business address regime: |
Alquiler |
|
Identification
|
|
|
Social Denomination: |
MAKILA
PROCESS SL |
|
NIF / Fiscal code: |
B54379318 |
|
Corporate Status: |
ACTIVE |
|
Start of activity: |
2008 |
|
Registered Office: |
C/ SAN
MIGUEL DE SALINAS, 12 1º G. |
|
Locality: |
TORREVIEJA |
|
Province: |
ALICANTE |
|
Postal Code: |
03185 |
|
Telephone: |
968 672
632 / 966 743 938 |
|
Fax: |
968 674
875 |
|
Website: |
makilaprocess.es |
|
Interviewed Person: |
Empleada |
|
Activity
|
|
|
NACE: |
4617 |
|
Legal Form: |
INTERMEDIATION
OF ALL KINF OF ALIMENTARY AND CHEMICAL PRODUCTS, AS WELL AS MANUFACTURE, PACKAGING
AND SALE OF TINNED VEGETABLES, JUICES AND CHEMICAL PRODUCTS. |
|
Additional Information: |
It''''''''''''''''s
engaged in packaging and distribution of alimentary products. |
|
Additional Address: |
Registered
office and offices C/ SAN MIGUEL DE SALINAS, 12 1º G. 03185 TORREVIEJA (
ALICANTE ) , AVD PEDRO GUILLEN , 1 30600 ARCHENA ( MURCIA ). |
|
Import / export: |
EXPORT |
|
Future Perspective: |
Consolidation |
|
Industry situation: |
Maturity |
|
Chronological
Summary
|
|||
|
|
|
|
|
|
|
Year |
Act |
|
|
|
2008 |
Appointments/
Re-elections (1) Company Formation (1) Declaration of Sole Propietorship (1) |
|
|
|
2009 |
Accounts
deposit (year 2008) |
|
|
|
2010 |
Accounts
deposit (year 2009) |
|
|
|
2011 |
Accounts
deposit (year 2010) |
|
|
|
2012 |
Accounts
deposit (year 2011) Change of Social Denomination (1) |
|
|
|
2013 |
Accounts
deposit (year 2012) |
|
|
|
2014 |
Accounts
deposit (year 2013) |
|
|
|
2015 |
Accounts
deposit (year 2014) Increase of Capital (1) |
|
|
Breakdown
of Owners' Equity
|
|
|
Registered Capital: |
143.000 |
|
Paid up capital: |
143.000 |
|
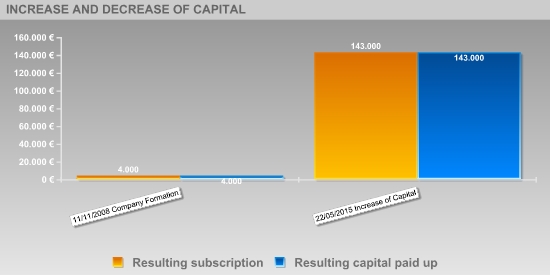
Updated
Evolution of the Subscribed and Paid-in Capital
|
|||||
|
|
|
|
|
|
|
|
|
|||||
|
|
|
|
|
|
|
|
Publishing
Date |
Registration
Type |
Capital
Subscribed |
Paid up
capital |
Underwritten
result |
Disbursed
Result |
|
11/11/2008 |
Company
Formation |
4.000 |
4.000 |
4.000 |
4.000 |
|
22/05/2015 |
Increase
of Capital |
139.000 |
139.000 |
143.000 |
143.000 |
|
Active
Social Bodies
|
|
|
|
|
|
Post
published |
Social
Body's Name |
Appointment
Date |
Other
Positions in this Company |
|
SINGLE
PARTNER |
LOPEZ
GOMEZ MARIA JOSEFA |
11/11/2008 |
2 |
|
SINGLE
ADMINISTRATOR |
LOPEZ
GOMEZ MARIA JOSEFA |
11/11/2008 |
2 |
|
Executive
board
|
||
|
|
|
|
|
Post |
NIF |
Name |
|
ADMINISTRATOR |
|
MARIA
JOSEFA LOPEZ GOMEZ |
|
DIRECTOR/GENERAL
MANAGER |
|
MARIA
JOSEFA LOPEZ GOMEZ |
Defaults,
Legal Claims and Insolvency Proceedings
|
|
|
|
|
Section enabling
assessment of the degree of compliance of the company queried with its payment
obligations. It provides information on the existence and nature of all stages
of Insolvency and Legal Proceedings published with reference to the Company in
the country's various Official Bulletins and national newspapers, as well
Defaults Registered in the main national credit bureaus (ASNEF Industrial and
RAI ).
>
Summary
Chronological
summary
|
|
|
Number
of Publications |
Amount
(_) |
Start
date |
End date |
|
Insolvency
Proceedings, Bankruptcy and Suspension of Payments |
|
Unpublished |
--- |
--- |
--- |
|
Request/Declaration |
|
0 |
--- |
date |
|
|
Proceedings |
|
--- |
--- |
|
--- |
|
Resolution |
|
--- |
--- |
|
--- |
|
Defaults
on debt with Financial Institutions and Large Companies |
Bank and
Commercial Delinquency |
None |
0 |
|
|
|
Status:
Friendly |
|
--- |
|
|
|
|
Status:
Pre-Litigation |
|
--- |
|
|
|
|
Status:
Litigation |
|
--- |
|
|
|
|
Status:
Non-performing |
|
--- |
|
|
|
|
Status:
insolvency proceedings, bankruptcy and suspension of payments |
|
--- |
|
|
|
|
Other
status |
|
--- |
|
|
|
|
Legal
and Administrative Proceedings |
|
1 |
--- |
10/11/2014 |
10/11/2014 |
|
Notices
of defaults and enforcement |
|
1 |
--- |
|
--- |
|
Seizures |
|
--- |
--- |
|
--- |
|
Auctions |
|
--- |
--- |
|
--- |
|
Declarations
of insolvency and bad debt |
|
--- |
--- |
|
--- |
|
Proceedings
heard by the Civil Court |
|
Unpublished |
--- |
|
|
|
Proceedings
heard by the Labour Court |
|
Unpublished |
--- |
|
|
> Basis
for scoring
|
Adverse
Factors |
|
|
No irregular
payment performance has been detected based on information obtained from
credit bureaus. The
current debt represents a 41.37of the financial structure. In principle, a
decrease in this ratio would indicate an improvement in the short-term
financial situation. High
financial profitability. Net return from the company's main activity
performed using its own equity is high. This income return has decreased in
comparison with the previous financial year. It
presents a limited operating margins. Net margin shows positive, although
adjusted, company costs management as income exceed operating expenses. Positive
Working CapitalThe Company's Working Capital quality is significant, i.e.
much of the Company financing comes from its equity. A structure is considered
optimal if its liquidity level is slightly above its debt volume as a result
of low idleness levels of its financial resources involved. |
Presents
legal proceedings. Debts resulting from non-payment to Public Administrations
or from lawsuits filed by individuals before the Courts of the different
jurisdictions have been published in the Official Gazettes. MAKILA
PROCESS SL it presents an excessive indebtedness that may compromise their
balance sheet. No
Company's subsidiaries or branches are known. Although
it is in a new stage of Consolidationit is part of a group distinguished by a
downturn in the market. Private
consumption continues to have, in spite of some signs of improvement, very
low rates , thus showing great weakness. |
The
information contained in the latest annual statements has led to a Scoring
review for the company.
Probability
of default
|
|
|
|
|
>
Estimated Probability of Default for the next 12 months: 2.621 %
|
Sector in
which comparison is carried out: 461 Wholesale
on a fee or contract basis |
|
Relative
Position:
|
The company's
comparative analysis with the rest of the companies that comprise the sector,
shows the company holds a better position with regard to the probability of
non-compliance.
The 65.00%
of the companies of the sector MAKILA PROCESS SL belongs to show a higher
probability of non-compliance.
The
probability of the company's non-compliance with its payment obligations within
deadlines estimated by our qualifications models is 2.621%.
In the
event they fail to comply with the payment, the seriousness of the loss will
depend on factors such as the promptness of the commencement of the charging
management, the existence of executive documents which match the credit or the
existence of guarantees and free debt assets under the name of the debtor.
Therefore, the probability of non-compliance should not be solely interpreted
as the total loss of the owed amount.
|
Result of query submitted to the
R.A.I. (Spanish Bad Debt Register) on |
LEGAL
CLAIMS
|
|
|
|
|
|
Summary
of Judicial Claims |
|
|
|
|
|
|
|
|
||
|
|
|
No
se han publicado |
|
|
|
|
No
se han publicado |
|
|
|
|
||
|
|
|
No
se han publicado |
|
|
|
|
No
se han publicado |
|
|
|
|
No
se han publicado |
|
|
|
|
|
|
|
|
|
||
|
|
|
No
se han publicado |
|
|
|
|
No
se han publicado |
|
|
|
|
||
|
|
|
No
se han publicado |
|
|
Incidences
Detailed |
|
Incidences
with the Local Administration |
|
|
|
Last
Published Stage: |
EXECUTION
NOTIFICATION |
|
Amount
of the incidence: |
0,00 E |
|
Requested
by: |
ADMINISTRACION
LOCAL |
|
Published
domicile: |
(DESCONOCIDA) |
|
Source: |
B.O.P.
MURCIA Nº268, 2014 PAGINA 42320 |
|
Link
List
|
|
|
|
|
|
SHAREHOLDERS: |
1 Entities |
>
Shareholders
|
Relationship |
Entity |
Province |
Shareholding
stake |
|
SHAREHOLDERS |
MARIA
JOSEFA LOPEZ GOMEZ |
|
100 |
|
Turnover
|
|
|
Total Sales 2014 |
2.118.866,51 |
The sales
data is from the latest available financial statements. Failing that, are
estimates data calculated by statistical methods.
|
Financial
Accounts and Balance Sheets
|
|
|
|
|
Financial Years Presented
|
Ejercicio |
Tipo de
Cuentas Anuales |
Fecha
Presentacion |
|
2014 |
Normales |
July
2015 |
|
2013 |
Normales |
July
2014 |
|
2012 |
Normales |
September
2013 |
|
2011 |
Normales |
August
2012 |
|
2010 |
Normales |
August
2011 |
|
2009 |
Normales |
September
2010 |
|
2008 |
Normales |
November
2009 |
The data in the report regarding the last
Company Accounts submitted by the company is taken from the TRADE REGISTER
serving the region in which the company's address is located 31/12/2014
>
Balance en formato Pyme de acuerdo al Nuevo Plan General Contable 2007
Information corresponding to the
fiscal year 2014 2013 2012 2011 is taken from information
submitted to the TRADE REGISTER. Data corresponding to fiscal years before
2014 2013 2012 2011 has been compiled based on the
equivalence criteria stipulated in Act JUS/206/2009. Where the provisions of
the Act did not establish relevant equivalence criteria. To view details on the
methodology.
|
|
ORIGINAL |
ORIGINAL |
ORIGINAL |
ORIGINAL |
|
Assets |
2014 |
2013 |
2012 |
2011 |
|
A)
NON-CURRENT ASSETS: 11000 |
266.098,00 |
168.243,00 |
156.720,00 |
129,00 |
|
I. Intangible fixed assets : 11100 |
0,00 |
0,00 |
0,00 |
0,00 |
|
II. Tangible fixed assets : 11200 |
251.034,00 |
163.608,00 |
155.744,00 |
0,00 |
|
III. Real estate investment: 11300 |
0,00 |
0,00 |
0,00 |
0,00 |
|
IV. Long-term investments in Group companies and associates :
11400 |
0,00 |
0,00 |
0,00 |
0,00 |
|
V. Long-term financial investments: 11500 |
15.004,00 |
4.575,00 |
915,00 |
0,00 |
|
VI. Assets for deferred tax : 11600 |
60,00 |
60,00 |
60,00 |
129,00 |
|
VII. Non-current trade debtors : 11700 |
0,00 |
0,00 |
0,00 |
0,00 |
|
B)
CURRENT ASSETS: 12000 |
508.313,00 |
188.396,00 |
174.603,00 |
400,00 |
|
I. Stocks : 12200 |
230.874,00 |
136.270,00 |
105.706,00 |
0,00 |
|
II. Trade debtors and others receivable accounts : 12300 |
163.555,00 |
24.491,00 |
57.084,00 |
390,00 |
|
1. Trade debtors / accounts receivable:
12380 |
88.272,00 |
4.481,00 |
12.152,00 |
0,00 |
|
a) Long-term
receivables from sales and services supplied : 12381 |
0,00 |
0,00 |
0,00 |
0,00 |
|
b) Customers for sales
and provisions of services : 12382 |
88.272,00 |
4.481,00 |
12.152,00 |
0,00 |
|
2. Called up share capital: 12370 |
0,00 |
0,00 |
0,00 |
0,00 |
|
3. Other accounts receivable : 12390 |
75.283,00 |
20.010,00 |
44.932,00 |
390,00 |
|
III. Short-term investment in Group companies and associates:
12400 |
0,00 |
0,00 |
0,00 |
0,00 |
|
IV. Short-term financial investments : 12500 |
0,00 |
0,00 |
0,00 |
0,00 |
|
V. Short-term accruals : 12600 |
24.192,00 |
0,00 |
0,00 |
0,00 |
|
VI. Cash and other equivalent liquid assets : 12700 |
89.693,00 |
27.634,00 |
11.813,00 |
10,00 |
|
TOTAL
ASSETS (A + B) : 10000 |
774.411,00 |
356.639,00 |
331.323,00 |
529,00 |
|
|
ORIGINAL |
ORIGINAL |
ORIGINAL |
ORIGINAL |
|
Liabilities
and Net Worth |
2014 |
2013 |
2012 |
2011 |
|
A) NET
WORTH: 20000 |
181.246,00 |
37.491,00 |
13.749,00 |
3.614,00 |
|
A-1)
Shareholders' equity: 21000 |
181.246,00 |
37.491,00 |
13.749,00 |
3.614,00 |
|
I. Capital: 21100 |
4.000,00 |
4.000,00 |
4.000,00 |
4.000,00 |
|
1. Registered capital : 21110 |
4.000,00 |
4.000,00 |
4.000,00 |
4.000,00 |
|
2. (Uncalled capital): 21120 |
0,00 |
0,00 |
0,00 |
0,00 |
|
II. Share premium: 21200 |
0,00 |
0,00 |
0,00 |
0,00 |
|
III. Reserves: 21300 |
12.674,00 |
9.749,00 |
0,00 |
0,00 |
|
IV. (Common stock equity): 21400 |
0,00 |
0,00 |
0,00 |
0,00 |
|
V. Profit or loss brought forward: 21500 |
-68,00 |
0,00 |
-386,00 |
-283,00 |
|
VI. Other shareholders' contributions: 21600 |
139.000,00 |
0,00 |
0,00 |
0,00 |
|
VII. Result of the period: 21700 |
25.641,00 |
23.743,00 |
10.134,00 |
-102,00 |
|
VIII. (Interim dividend): 21800 |
0,00 |
0,00 |
0,00 |
0,00 |
|
A-2)
Changes in net worth : 22000 |
0,00 |
0,00 |
0,00 |
0,00 |
|
A-3)
Received subsidies, donations and legacies: 23000 |
0,00 |
0,00 |
0,00 |
0,00 |
|
B)
NON-CURRENT LIABILITIES: 31000 |
272.770,00 |
226.006,00 |
149.903,00 |
0,00 |
|
I. Long-term provisions: 31100 |
0,00 |
0,00 |
0,00 |
0,00 |
|
II. Long-term creditors : 31200 |
272.770,00 |
226.006,00 |
149.903,00 |
0,00 |
|
1. Amounts owed to credit institutions:
31220 |
123.846,00 |
105.558,00 |
114.503,00 |
0,00 |
|
2. Creditors from financial leasing :
31230 |
46.124,00 |
0,00 |
0,00 |
0,00 |
|
3. Other long-term creditors : 31290 |
102.800,00 |
120.449,00 |
35.400,00 |
0,00 |
|
III. Long-term debts with Group companies and associates:
31300 |
0,00 |
0,00 |
0,00 |
0,00 |
|
IV. Liabilities for deferred tax: 31400 |
0,00 |
0,00 |
0,00 |
0,00 |
|
V. Long-term accruals: 31500 |
0,00 |
0,00 |
0,00 |
0,00 |
|
VI. Non-current trade creditors : 31600 |
0,00 |
0,00 |
0,00 |
0,00 |
|
VII. Special long-term debts : 31700 |
0,00 |
0,00 |
0,00 |
0,00 |
|
C)
CURRENT LIABILITIES : 32000 |
320.395,00 |
93.141,00 |
167.671,00 |
-3.085,00 |
|
I. Short-term provisions: 32200 |
0,00 |
0,00 |
0,00 |
0,00 |
|
II. Short-term creditors : 32300 |
211.976,00 |
12.859,00 |
93.275,00 |
0,00 |
|
1. Amounts owed to credit institutions:
32320 |
211.976,00 |
-3,00 |
93.275,00 |
0,00 |
|
2. Creditors from financial leasing :
32330 |
0,00 |
12.862,00 |
0,00 |
0,00 |
|
3. Other short-term creditors :
32390 |
0,00 |
0,00 |
0,00 |
0,00 |
|
III. Short-term amounts owed to group and associated companies:
32400 |
0,00 |
0,00 |
0,00 |
0,00 |
|
IV. Trade creditors and other accounts payable: 32500 |
108.419,00 |
80.282,00 |
74.395,00 |
-3.085,00 |
|
1. Suppliers: 32580 |
71.526,00 |
61.452,00 |
33.454,00 |
6.566,00 |
|
a) Long-term debts :
32581 |
0,00 |
0,00 |
0,00 |
0,00 |
|
b) Short-term debts :
32582 |
71.526,00 |
61.452,00 |
33.454,00 |
6.566,00 |
|
2. Other creditors: 32590 |
36.893,00 |
18.830,00 |
40.942,00 |
-9.651,00 |
|
V. Short-term accruals : 32600 |
0,00 |
0,00 |
0,00 |
0,00 |
|
VI. Special short-term debts : 32700 |
0,00 |
0,00 |
0,00 |
0,00 |
|
TOTAL
NET WORTH AND LIABILITIES (A + B + C) : 30000 |
774.411,00 |
356.639,00 |
331.323,00 |
529,00 |
|
|
ORIGINAL |
ORIGINAL |
ORIGINAL |
ORIGINAL |
|
Profit and
Loss |
2014 |
2013 |
2012 |
2011 |
|
1. Net turnover: 40100 |
2.118.867,00 |
1.351.213,00 |
1.735.251,00 |
0,00 |
|
2. Changes in stocks of finished goods and work in progress:
40200 |
0,00 |
0,00 |
0,00 |
0,00 |
|
3. Works carried out by the company for its assets: 40300 |
0,00 |
0,00 |
0,00 |
0,00 |
|
4. Supplies : 40400 |
-1.810.074,00 |
-1.185.925,00 |
-1.634.222,00 |
0,00 |
|
5. Other operating income: 40500 |
0,00 |
0,00 |
4.913,00 |
0,00 |
|
6. Personnel costs: 40600 |
-64.932,00 |
-29.675,00 |
-15.539,00 |
0,00 |
|
7. Other operating costs: 40700 |
-226.139,00 |
-94.246,00 |
-59.564,00 |
-139,00 |
|
8. Amortisation of fixed assets: 40800 |
-4.352,00 |
-2.610,00 |
-2.613,00 |
0,00 |
|
9. Allocation of subsidies of non-financial fixed assets and
other: 40900 |
0,00 |
0,00 |
0,00 |
0,00 |
|
10. Excess provisions : 41000 |
0,00 |
0,00 |
0,00 |
0,00 |
|
11. Impairment and result of transfers of fixed assets:
41100 |
0,00 |
0,00 |
0,00 |
0,00 |
|
12. Other results : 41300 |
39.355,00 |
536,00 |
-564,00 |
0,00 |
|
A)
OPERATING INCOME (1 + 2 + 3 + 4 + 5 + 6 + 7 + 8 + 9 + 10 + 11 + 12) : 49100 |
52.724,00 |
39.293,00 |
27.660,00 |
-139,00 |
|
13. Financial income : 41400 |
0,00 |
0,00 |
0,00 |
2,00 |
|
a) Allocation of financial subsidies,
donations and legacies: 41430 |
0,00 |
0,00 |
0,00 |
0,00 |
|
b) Other financial income: 41490 |
0,00 |
0,00 |
0,00 |
2,00 |
|
14. Financial expenditure : 41500 |
-16.382,00 |
-6.501,00 |
-14.148,00 |
0,00 |
|
15. Changes in fair value of financial instruments :
41600 |
0,00 |
0,00 |
0,00 |
0,00 |
|
16. Exchange rate differences: 41700 |
243,00 |
0,00 |
0,00 |
0,00 |
|
17. Impairment and result for transfers of financial
instruments : 41800 |
0,00 |
0,00 |
0,00 |
0,00 |
|
18. Other financial income and expenditure: 42100 |
0,00 |
0,00 |
0,00 |
0,00 |
|
a) Incorporation of financial expenditure
to assets: 42110 |
0,00 |
0,00 |
0,00 |
0,00 |
|
b) Financial income from arrangement with
creditors: 42120 |
0,00 |
0,00 |
0,00 |
0,00 |
|
c) Other income and expenditure:
42130 |
0,00 |
0,00 |
0,00 |
0,00 |
|
B)
FINANCIAL REVENUE ( 13 + 14 + 15 + 16 + 17 +18 ) : 49200 |
-16.139,00 |
-6.501,00 |
-14.148,00 |
2,00 |
|
C) NET
RESULT BEFORE TAXES ( A + B ) : 49300 |
36.585,00 |
32.792,00 |
13.513,00 |
-137,00 |
|
19. Income taxes : 41900 |
-10.945,00 |
-9.050,00 |
-3.378,00 |
34,00 |
|
D) RESULT
OF THE PERIOD ( C + 19 ) : 49500 |
25.641,00 |
23.743,00 |
10.134,00 |
-102,00 |
|
CASHFLOW
STATEMENT
|
|
|
|
|
Model: Normal
>
Source of information: Data contained in this section is taken from the information
declared in the Annual Accounts submitted to the Trade Register.
|
|
2014 |
2013 |
2012 |
2011 |
|
1.
Fiscal year result before taxes.: 61100 |
36.585,00 |
32.792,00 |
13.513,00 |
-137,00 |
|
2.
Results adjustments.: 61200 |
20.734,00 |
9.111,00 |
16.761,00 |
-2,00 |
|
a) Fixed Assets Amortization (+).: 61201 |
4.352,00 |
2.610,00 |
2.613,00 |
0,00 |
|
g) Financial income (-).: 61207 |
0,00 |
0,00 |
0,00 |
-2,00 |
|
h) Financial Expenses (+). : 61208 |
16.382,00 |
6.501,00 |
14.148,00 |
0,00 |
|
3.
Changes in current capital equity.: 61300 |
-240.667,00 |
-1.134,00 |
-88.298,00 |
-3.441,00 |
|
a) Stock (+/-).: 61301 |
-94.604,00 |
-30.563,00 |
-105.706,00 |
0,00 |
|
d) Debtors and other accounts receivable (+/-). : 61302 |
-139.063,00 |
32.592,00 |
-56.694,00 |
-390,00 |
|
c) Other current assets (+/-). : 61303 |
-24.192,00 |
0,00 |
0,00 |
0,00 |
|
d) Creditors and other accounts payable (+/-). : 61304 |
17.193,00 |
-3.163,00 |
74.103,00 |
-3.051,00 |
|
4. Other
cash flows for operating activities.: 61400 |
-16.382,00 |
-6.501,00 |
-14.148,00 |
2,00 |
|
a) Interest payments (-). : 61401 |
-16.382,00 |
-6.501,00 |
-14.148,00 |
0,00 |
|
c) Interest collection (+). : 61403 |
0,00 |
0,00 |
0,00 |
2,00 |
|
5.
Operating activity cash flows (1 + 2 + 3 + 4) : 61500 |
-199.730,00 |
34.269,00 |
-72.172,00 |
-3.578,00 |
|
6.
Payments for investment (-).: 62100 |
-97.855,00 |
-11.524,00 |
-156.659,00 |
-129,00 |
|
c) Fixed assets. : 62103 |
-87.426,00 |
-7.864,00 |
-155.744,00 |
0,00 |
|
e) Other financial assets. : 62105 |
-10.429,00 |
-3.660,00 |
-915,00 |
0,00 |
|
h) Other assets. : 62108 |
0,00 |
0,00 |
0,00 |
-129,00 |
|
7.
Divestment payment collection (+). : 62200 |
0,00 |
0,00 |
68,00 |
0,00 |
|
h) Other assets. : 62208 |
0,00 |
0,00 |
68,00 |
0,00 |
|
8.
Investment activity cash flows (6 + 7) minus Amortization: 62300 |
-102.207,00 |
-14.134,00 |
-159.204,00 |
-129,00 |
|
9.
Payment collection and payments for equity instruments. : 63100 |
118.114,00 |
0,00 |
0,00 |
3.717,00 |
|
a) Issuance of equity instruments (+). : 63101 |
118.114,00 |
0,00 |
0,00 |
3.717,00 |
|
10.
Payment collection and payments for financial liabilities instruments.:
63200 |
245.880,00 |
-4.313,00 |
243.179,00 |
0,00 |
|
a) Issuance : 63201 |
276.391,00 |
97.911,00 |
243.179,00 |
0,00 |
|
2. Debts incurred with credit institutions (+). : 63203 |
230.268,00 |
0,00 |
207.779,00 |
0,00 |
|
4. Special characteristic debts (+). : 63205 |
46.124,00 |
12.862,00 |
0,00 |
0,00 |
|
5. Other debts (+). : 63206 |
0,00 |
85.049,00 |
35.400,00 |
0,00 |
|
b) Repayment and amortization of : 63207 |
-30.511,00 |
-102.224,00 |
0,00 |
0,00 |
|
2. Debts incurred with credit institutions (-).: 63209 |
0,00 |
-102.224,00 |
0,00 |
0,00 |
|
4. Special characteristic debts (-). : 63211 |
-12.862,00 |
0,00 |
0,00 |
0,00 |
|
5. Other debts (-). : 63212 |
-17.649,00 |
0,00 |
0,00 |
0,00 |
|
11.
Payments from dividends and remunerations from other assets instruments. :
63300 |
0,00 |
0,00 |
0,00 |
0,00 |
|
12. Cash
flows for financing activities (9+10+11).: 63400 |
363.995,00 |
-4.313,00 |
243.179,00 |
3.717,00 |
|
D) EFFECT
OF EXCHANGE RATE CHANGES: 64000 |
0,00 |
0,00 |
0,00 |
0,00 |
|
E) NET
INCREASE/DECREASE OF CASH OR EQUIVALENT ASSETS (+/-5+/-8+/12+/-D) :
65000 |
62.058,00 |
15.821,00 |
11.802,00 |
10,00 |
|
Cash or equivalent assets as of beginning of the fiscal year.:
65100 |
27.634,00 |
11.813,00 |
10,00 |
0,00 |
|
Cash or equivalent assets as of end of the fiscal year.:
65200 |
89.693,00 |
27.634,00 |
11.813,00 |
10,00 |
|
FINANCIAL
DIAGNOSIS
|
|
|
|
|
>
Economic-Financial Comparative Analysis
Data
used in the following ratios and indicators is taken from the Annual Accounts
submitted by the company to the TRADE REGISTER.
>
Comparison within the Sector
|
Cash
Flow |
2014 |
2013 |
Variación
2014 - 2013 |
|||
|
|
Empresa |
Sector |
Empresa |
Sector |
Empresa |
Sector |
|
Cash
Flow over Sales: |
0,03 % |
0,00 % |
0,01 % |
0,01 % |
150,13 % |
-55,57 % |
|
EBITDA
over Sales: |
0,84 % |
5,39 % |
3,06 % |
4,39 % |
-72,68 % |
22,82 % |
|
Cash
Flow Yield: |
0,08 % |
0,00 % |
0,04 % |
0,00 % |
80,64 % |
|
|
Profitability |
2014 |
2013 |
Variación
2014 - 2013 |
|||
|
|
Empresa |
Sector |
Empresa |
Sector |
Empresa |
Sector |
|
Operating
economic profitability: |
1,76 % |
2,82 % |
11,01 % |
1,65 % |
-84,01 % |
71,26 % |
|
Total
economic profitability: |
6,84 % |
2,95 % |
11,02 % |
1,50 % |
-37,92 % |
97,21 % |
|
Financial
profitability: |
14,15 % |
2,79 % |
63,33 % |
0,05 % |
-77,66 % |
5.044,29
% |
|
Margin:
|
0,63 % |
2,81 % |
2,87 % |
1,71 % |
-78,00 % |
64,61 % |
|
Mark-up:
|
-0,13 % |
2,08 % |
2,39 % |
0,24 % |
-105,48
% |
784,13 % |
|
Solvency |
2014 |
2013 |
Variación
2014 - 2013 |
|||
|
|
Empresa |
Sector |
Empresa |
Sector |
Empresa |
Sector |
|
Liquidity:
|
0,28 |
0,29 |
0,30 |
0,26 |
-5,65 |
10,99 |
|
Acid
Test: |
0,79 |
1,11 |
0,56 |
1,10 |
41,24 |
1,41 |
|
Working
Capital / Investment: |
0,24 |
0,20 |
0,27 |
0,21 |
-9,15 |
-3,11 |
|
Solvency:
|
1,59 |
1,73 |
2,02 |
1,76 |
-21,58 |
-1,53 |
|
Indebtedness |
2014 |
2013 |
Variación
2014 - 2013 |
|||
|
|
Empresa |
Sector |
Empresa |
Sector |
Empresa |
Sector |
|
Indebtedness
level: |
3,27 |
1,00 |
8,51 |
1,03 |
-61,55 |
-2,96 |
|
Borrowing
Composition: |
0,85 |
0,69 |
2,43 |
0,73 |
-64,91 |
-5,94 |
|
Repayment
Ability: |
9,56 |
217,59 |
20,17 |
103,97 |
-52,62 |
109,27 |
|
Warranty:
|
1,31 |
2,01 |
1,12 |
1,98 |
16,83 |
1,55 |
|
Generated
resources / Total creditors: |
0,05 |
0,07 |
0,08 |
0,06 |
-38,77 |
32,59 |
|
Efficiency |
2014 |
2013 |
Variación
2014 - 2013 |
|||
|
|
Empresa |
Sector |
Empresa |
Sector |
Empresa |
Sector |
|
Productivity:
|
1,27 |
1,25 |
2,39 |
1,20 |
-46,83 |
3,88 |
|
Turnover
of Collection Rights : |
12,96 |
4,57 |
55,17 |
4,36 |
-76,52 |
4,73 |
|
Turnover
of Payment Entitlements: |
18,78 |
3,03 |
15,95 |
2,92 |
17,78 |
3,58 |
|
Stock
rotation: |
9,12 |
4,71 |
9,63 |
4,21 |
-5,31 |
11,93 |
|
Assets
turnover: |
2,79 |
1,00 |
3,84 |
0,96 |
-27,30 |
4,04 |
|
Borrowing
Cost: |
2,76 |
2,04 |
2,04 |
2,14 |
35,59 |
-4,80 |
> Trend
of indicators under the General Accounting Plan of 2007 (2014, 2013, 2012,
2011)
|
Cash
Flow |
2014 |
2013 |
2012 |
2011 |
|
Cash
Flow over Sales: |
0,03 % |
0,01 % |
0,01 % |
|
|
EBITDA
over Sales: |
0,84 % |
3,06 % |
1,78 % |
|
|
Cash
Flow Yield: |
0,08 % |
0,04 % |
0,04 % |
0,02 % |
|
Profitability |
2014 |
2013 |
2012 |
2011 |
|
Operating
economic profitability: |
1,76 % |
11,01 % |
8,54 % |
-26,25 % |
|
Total
economic profitability: |
6,84 % |
11,02 % |
8,35 % |
-25,81 % |
|
Financial
profitability: |
14,15 % |
63,33 % |
73,71 % |
-2,83 % |
|
Margin:
|
0,63 % |
2,87 % |
1,62 % |
|
|
Mark-up:
|
-0,13 % |
2,39 % |
0,81 % |
|
|
Solvency |
2014 |
2013 |
2012 |
2011 |
|
Liquidity:
|
0,28 |
0,30 |
0,07 |
0,00 |
|
Acid
Test: |
0,79 |
0,56 |
0,41 |
-0,13 |
|
Working
Capital / Investment: |
0,24 |
0,27 |
0,02 |
6,59 |
|
Solvency:
|
1,59 |
2,02 |
1,04 |
-0,17 |
|
Indebtedness |
2014 |
2013 |
2012 |
2011 |
|
Indebtedness
level: |
3,27 |
8,51 |
23,10 |
-0,85 |
|
Borrowing
Composition: |
0,85 |
2,43 |
0,89 |
0,00 |
|
Repayment
Ability: |
9,56 |
20,17 |
26,91 |
-296,95 |
|
Warranty:
|
1,31 |
1,12 |
1,04 |
-0,17 |
|
Generated
resources / Total creditors: |
0,05 |
0,08 |
0,04 |
0,03 |
|
Efficiency |
2014 |
2013 |
2012 |
2011 |
|
Productivity:
|
1,27 |
2,39 |
2,98 |
|
|
Turnover
of Collection Rights : |
12,96 |
55,17 |
30,48 |
0,00 |
|
Turnover
of Payment Entitlements: |
18,78 |
15,95 |
22,77 |
-0,04 |
|
Stock
rotation: |
9,12 |
9,63 |
16,20 |
|
|
Assets
turnover: |
2,79 |
3,84 |
5,27 |
0,00 |
|
Borrowing
Cost: |
2,76 |
2,04 |
4,45 |
0,00 |
COMPARATIVE
SECTORIAL BALANCE
|
|
|
|
|
Sector-based Comparison under the rules of
the New General Accounting Plan.
|
|
Variación
- |
|
|
|
Empresa |
Sector |
|
|
Variación
- |
|
|
|
Empresa |
Sector |
|
|
Variación
- |
|
|
|
Empresa |
Sector |
|
Public
Tenders and Works Won
|
|
|
|
|
No Public Tenders assigned to the name of
the company.
|
Research
Summary
|
|
This company was incorporated in
2008 and it''s engaged in packaging of alimentary products. It''s turnover increased
by 56,81 % in 2014 vs. the previous year. It presents a positive working
capital, therefore the company would nbe able to meet short term payment
commitments. |
|
Sources
|
|
Registry of Commerce's Official Gazette.
Own and external data bases Company References |
FOREIGN EXCHANGE RATES
|
Currency |
Unit
|
Indian Rupees |
|
US Dollar |
1 |
Rs.64.96 |
|
|
1 |
Rs.99.73 |
|
Euro |
1 |
Rs.71.84 |
INFORMATION DETAILS
|
Analysis Done by
: |
KIN |
|
|
|
|
Report Prepared
by : |
ASH |
RATING EXPLANATIONS
|
RATING |
STATUS |
PROPOSED CREDIT LINE |
|
|
>86 |
Aaa |
Possesses an extremely sound financial base with the strongest
capability for timely payment of interest and principal sums |
Unlimited |
|
71-85 |
Aa |
Possesses adequate working capital. No caution needed for credit
transaction. It has above average (strong) capability for payment of interest
and principal sums |
Large |
|
56-70 |
A |
Financial & operational base are regarded healthy. General
unfavourable factors will not cause fatal effect. Satisfactory capability for
payment of interest and principal sums |
Fairly Large |
|
41-55 |
Ba |
Overall operation is considered normal. Capable to meet normal
commitments. |
Satisfactory |
|
26-40 |
B |
Capability to overcome financial difficulties seems comparatively
below average. |
Small |
|
11-25 |
Ca |
Adverse factors are apparent. Repayment of interest and principal sums
in default or expected to be in default upon maturity |
Limited with
full security |
|
<10 |
C |
Absolute credit risk exists. Caution needed to be exercised |
Credit not
recommended |
|
-- |
NB |
New Business |
-- |
This score serves as a reference to assess
SC’s credit risk and to set the amount of credit to be extended. It is calculated
from a composite of weighted scores obtained from each of the major sections of
this report. The assessed factors and their relative weights (as indicated
through %) are as follows:
Financial
condition (40%) Ownership
background (20%) Payment record
(10%)
Credit history
(10%) Market trend (10%) Operational size
(10%)
This report is issued at your request without any
risk and responsibility on the part of MIRA INFORM PRIVATE LIMITED (MIPL)
or its officials.