MIRA INFORM REPORT
|
Report No. : |
338988 |
|
Report Date : |
08.09.2015 |
IDENTIFICATION DETAILS
|
Name : |
KIROS JEWELS SL |
|
|
|
|
Registered Office : |
C/ Serrano, 92. - Madrid - 28006 - Madrid |
|
|
|
|
Country : |
Spain |
|
|
|
|
Financials (as on) : |
2013 |
|
|
|
|
Date of Incorporation : |
21.12.2004 |
|
|
|
|
Legal Form : |
Private Company |
|
|
|
|
Line of Business : |
Wholesale of
watches and jewellery. |
|
|
|
|
No. of Employees : |
Not Available |
RATING & COMMENTS
|
MIRA’s Rating : |
Ba |
|
RATING |
STATUS |
PROPOSED CREDIT LINE |
|
|
41-55 |
Ba |
Overall operation is considered normal. Capable to meet normal
commitments. |
Satisfactory |
|
Status : |
Satisfactory |
|
|
|
|
Payment Behaviour : |
No Complaints |
|
|
|
|
Litigation : |
Clear |
NOTES:
Any query related to this report can be made
on e-mail: infodept@mirainform.com
while quoting report number, name and date.
ECGC Country Risk Classification List – March 31, 2015
|
Country Name |
Previous Rating (31.12.2014) |
Current Rating (31.03.2015) |
|
Spain |
A1 |
A1 |
|
Risk Category |
ECGC
Classification |
|
Insignificant |
A1 |
|
Low |
A2 |
|
Moderate |
B1 |
|
High |
B2 |
|
Very High |
C1 |
|
Restricted |
C2 |
|
Off-credit |
D |
SPAIN - ECONOMIC OVERVIEW
After experiencing a prolonged recession in the wake of the global financial crisis that began in 2008, in 2014 Spain marked the first full year of positive economic growth in seven years, largely due to increased private consumption. At the onset of the global financial crisis Spain's GDP contracted by 3.7% in 2009, ending a 16-year growth trend, and continued contracting through most of 2013. In 2013 the government successfully shored up struggling banks - exposed to the collapse of Spain's depressed real estate and construction sectors - and in January 2014 completed an EU-funded restructuring and recapitalization program.
Until 2014, credit contraction in the private sector, fiscal austerity, and high unemployment weighed on domestic consumption and investment. The unemployment rate rose from a low of about 8% in 2007 to more than 26% in 2013, but labor reforms prompted a modest reduction to 23.7% in 2014. High unemployment strained Spain's public finances, as spending on social benefits increased while tax revenues fell. Spain’s budget deficit peaked at 11.4% of GDP in 2010, but Spain gradually reduced the deficit to just under 7% of GDP in 2013-14, slightly above the 6.5% target negotiated between Spain and the EU. Public debt has increased substantially – from 60.1% of GDP in 2010 to more than 97% in 2014.
Exports were resilient throughout the economic downturn and helped to bring Spain's current account into surplus in 2013 for the first time since 1986, where it remained in 2014. Rising labor productivity and an internal devaluation resulting from moderating labor costs and lower inflation have helped to improve foreign investor interest in the economy and positive FDI flows have been restored.
The government's efforts to implement labor, pension, health, tax, and education reforms - aimed at supporting investor sentiment - have become overshadowed by political activity in 2015 in anticipation of the national parliamentary elections in November. Spain’s 2015 budget, published in September 2014, rolls back some recently imposed taxes in advance of the elections and leaves untouched the country’s value-added tax (VAT) regime, which continues to generate significantly lower revenue than the EU average. Spain’s borrowing costs are dramatically lower since their peak in mid-2012, and despite the recent uptic in economic activity, inflation has dropped sharply, from 1.5% in 2013 to nearly flat in 2014.
|
Source
: CIA |
EXECUTIVE
SUMMARY
|
Name: |
KIROS
JEWELS SL |
|
NIF
/ Fiscal code: |
B14705826 |
|
Status: |
ACTIVE |
|
Incorporation
Date: |
21/12/2004 |
|
Register Data |
Register
Section 8 Sheet 396700 |
|
Last Publication in BORME: |
11/03/2015
[Miscellaneous Concepts] |
|
Last
Published Account Deposit: |
2013 |
|
Share
Capital: |
215.000 |
|
Localization: |
C/
SERRANO, 92. - MADRID - 28006 - MADRID |
|
Telephone
- Fax - Email - Website: |
Telephone.
913 234 199 Email. madrid@kirosjewels.com Website. www.kirosjewels.com |
|
Activity: |
|
|
NACE: |
4648
- Wholesale of watches and jewellery |
|
Registered
Trademarks: |
|
|
Audited
/ Opinion: |
No |
|
Tenders
and Awards: |
|
|
Subsidies: |
0
for a total cost of 0 |
|
Quality
Certificate: |
No |
|
|
|
|
Payment
Behaviour: |
No
Complaints |
|
Prospects: |
Face
recession |
|
Industry
situation: |
Maturity |
|
Defaults, Legal Claims and
Insolvency Proceedings : |
|
|
|
|
Number |
Amount
(€) |
Most
Recent Entry |
|
Insolvency
Proceedings, Bankruptcy and Suspension of Payments |
Unpublished |
--- |
--- |
|
Defaults
on debt with Financial Institutions and Large Companies |
None |
--- |
--- |
|
Judicial
Claims (Notices, Executive Proceedings, Attachments, Auctions, Bad Debt) |
None |
0 |
--- |
|
Proceedings
heard by the Civil Court |
Unpublished |
0 |
--- |
|
Proceedings
heard by the Labour Court |
Unpublished |
0 |
--- |
|
|
|
Partners: |
|
|
|
ANLO
BUSINESS SL |
100
% |
|
|
Shares: |
0 |
|
|
Other
Links: |
0 |
|
|
No.
of Active Corporate Bodies: |
SINGLE
ADMINISTRATOR 1 |
|
|
Ratios |
2013 |
2012 |
Change |
|
|
|
|
|
Guarantees: |
|
|
Properties
Registered: |
Company
NO, Administrator NO |
|
Financing
/ Guarantee Sources : |
Sources
NO, Guarantees NO |
|
|
|
|
INVESTIGATION
SUMMARY |
|
|
The
corporation was established in 2005. It is dedicated to the manufacture of jewelry
items. Its invoivcing has decreased with a percentage of 30,63 % in 2013 in
comparison to the previous year. Complies regularly with its payment
obligations. |
|
Enquiry
Details
|
Business address regime: |
Rent |
Identification
|
Social Denomination: |
KIROS JEWELS SL |
|
NIF / Fiscal code: |
B14705826 |
|
Corporate Status: |
ACTIVE |
|
Start of activity: |
2005 |
|
Registered Office: |
C/ SERRANO, 92. |
|
Locality: |
MADRID |
|
Province: |
MADRID |
|
Postal Code: |
28006 |
|
Telephone: |
913 234 199 |
|
Website: |
www.kirosjewels.com |
|
Email: |
madrid@kirosjewels.com |
Activity
|
NACE: |
4648 |
|
CNAE Obtaining
Source: |
4648 |
|
Legal Form: |
MANUFACTURING AND SALE, IMPORTATION AND EXPORTATION OF JEWELRY ITEMS, PRECIOUS AND SEMIPRECIOUS STONES. SALE, IMPORTATION AND EXPORTATION OF DECORATIVE FIGURES, AND PRESENTS. PURCHASE AND SALE, RENTING OR EXPLOITATION OF ALL KIND OF REAL ESTATES OR RUSTIC OR URBAN KIND. PURCHASE AND SALE, IMPORTATION AND EXPORTATION OF CLOTHES, HEADDRESS AND SHOES, FURNITURE FOR HOMES AND SPORTS ITEMS. PURCHASE AND SALE, IMPORTATION AND EXPORTATION OF FOOD AND BEVERAGES. |
|
Additional
Information: |
It is dedicated to the manufacture, exportation of jewelry items for jewelry designers. |
|
Additional
Address: |
C/ SERRANO, 92 28006 MADRID , registered office and offices in rent. |
|
Import / export: |
IMPORTS / EXPORTS |
|
Future
Perspective: |
Face recession |
|
Industry
situation: |
Maturity |
Chronological
Summary
|
Year |
Act |
|
2005 |
Accounts deposit (year 2004) Appointments/ Re-elections (1) Company Formation (1) |
|
2006 |
Change of Social address (1) Increase of Capital (1) |
|
2007 |
Accounts deposit (year 2005) |
|
2008 |
Accounts deposit (year 2006) Change of Social address (1) Declaration of Sole Propietorship (1) |
|
2009 |
Accounts deposit (year 2007) Appointments/ Re-elections (1) |
|
2010 |
Accounts deposit (year 2008) |
|
2011 |
Accounts deposit (year 2009) |
|
2012 |
Accounts deposit (year 2010) |
|
2013 |
Accounts deposit (year 2011) Change of Social Purpose (1) |
|
2014 |
Accounts deposit (year 2012, 2013) Appointments/ Re-elections (1) Cessations/ Resignations/ Reversals (1) Change of Social Denomination (1) |
|
2015 |
Change of Social address (1) Declaration of Sole Propietorship (1) Loss of the sole propietorship condition (1) Other Concepts/ Events (1) |
Main
Historic Changes
|
Concept |
Publication |
Act |
Date |
|
Corporate Purpose Changes: |
FABRICACION Y VENTA, IMPORTACION Y EXPORTACION DE ARTÍCULOS DE
JOYERIA, PIEDRAS PRECIOSAS Y SEMIPRECIOSAS. VENTA, IMPORTACION Y EXPORTACION
DE FIGURAS DECORATIVAS, ARTÍCULOS DE REGALO. COMPRAVENTA, ARRENDAMIENTO O
EXPLOTACION DE TODA CLASE DE BIENES INMUEBLES, DE NATURALEZA RUSTICA O URBANA |
Company Formation |
10/02/2005 |
Breakdown
of Owners' Equity
|
Registered Capital: |
215.000 |
|
Paid up capital: |
215.000 |
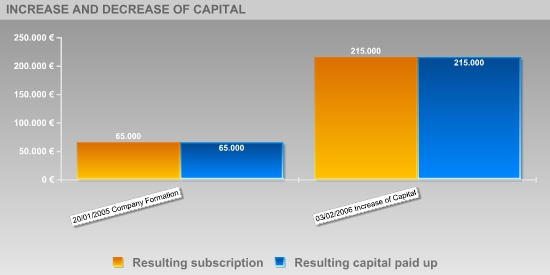
Updated
Evolution of the Subscribed and Paid-in Capital
|
Publishing Date |
Registration Type |
Capital Subscribed |
Paid up capital |
Underwritten result |
Disbursed Result |
|
20/01/2005 |
Company Formation |
65.000 |
65.000 |
65.000 |
65.000 |
|
03/02/2006 |
Increase of Capital |
150.000 |
150.000 |
215.000 |
215.000 |
Active
Social Bodies
|
Post published |
Social Body's Name |
Appointment Date |
Other Positions in this Company |
|
SINGLE PARTNER |
ANLO BUSINESS SL |
04/03/2015 |
1 |
|
SINGLE ADMINISTRATOR |
JAIN MANISH |
20/01/2005 |
2 |
|
PROXY |
ROOPANI ROOPANI PAWAN |
26/06/2014 |
1 |
Historical
Social Bodies
|
Social Body's Name |
Post published |
End Date |
Other Positions in this Company |
|
JAIN MANISH |
SINGLE PARTNER |
04/03/2015 |
2 |
|
RUIZ MAESO ARANZAZU |
PROXY |
26/06/2014 |
1 |
Executive
board
|
Post |
NIF |
Name |
|
ADMINISTRATOR |
|
MANISH JAIN |
|
DIRECTOR/GENERAL MANAGER |
|
MANISH JAIN |
|
MANAGING DIRECTOR |
|
ARANZAZU RUIZ MAESO |
Defaults,
Legal Claims and Insolvency Proceedings
Section enabling assessment of the degree of compliance of the company queried with its payment obligations. It provides information on the existence and nature of all stages of Insolvency and Legal Proceedings published with reference to the Company in the country's various Official Bulletins and national newspapers, as well Defaults Registered in the main national credit bureaus (ASNEF Industrial and RAI ).
> Summary
Chronological summary
|
|
|
Number
of Publications |
Amount
(_) |
Start
date |
End
date |
|
Insolvency
Proceedings, Bankruptcy and Suspension of Payments |
|
Unpublished |
--- |
--- |
--- |
|
Request/Declaration |
|
0 |
--- |
date |
|
|
Proceedings |
|
--- |
--- |
|
--- |
|
Resolution |
|
--- |
--- |
|
--- |
|
Defaults
on debt with Financial Institutions and Large Companies |
Bank
and Commercial Delinquency |
None |
0 |
|
|
|
Status:
Friendly |
|
--- |
|
|
|
|
Status:
Pre-Litigation |
|
--- |
|
|
|
|
Status:
Litigation |
|
--- |
|
|
|
|
Status:
Non-performing |
|
--- |
|
|
|
|
Status:
insolvency proceedings, bankruptcy and suspension of payments |
|
--- |
|
|
|
|
Other
status |
|
--- |
|
|
|
|
Legal
and Administrative Proceedings |
|
Unpublished |
--- |
|
|
|
Notices
of defaults and enforcement |
|
--- |
--- |
|
--- |
|
Seizures |
|
--- |
--- |
|
--- |
|
Auctions |
|
--- |
--- |
|
--- |
|
Declarations
of insolvency and bad debt |
|
--- |
--- |
|
--- |
|
Proceedings
heard by the Civil Court |
|
Unpublished |
--- |
|
|
|
Proceedings
heard by the Labour Court |
|
Unpublished |
--- |
|
|
> Details
> Basis for scoring
|
Positive Factors |
Adverse Factors |
|
No judicial claims have been detected in the Official Gazettes,
regarding any Entity's outstanding debts with the Tax Bureau or Social
Security administrations, as submitted by Courts of the various court
jurisdictions. No irregular payment performance has been detected based on
information obtained from credit bureaus. Adequate level of financial autonomy. The financial autonomy of the
entity represents the 32.94 %. In principle, an increase in this ratio would
indicate an improvement in the corporate's balace sheets. High financial profitability. Net return from the company's main
activity performed using its own equity is high. This income return has
decreased in comparison with the previous financial year. It presents a limited operating margins. Net margin shows positive,
although adjusted, company costs management as income exceed operating
expenses. |
The current debt represents a 62.55% of the financial structure. In
principle, a decrease in this ratio would indicate an improvement in the
short-term financial situation. No Company's subsidiaries or branches are known. Although it is in a new stage of Consolidationit is part of a group
distinguished by a downturn in the market. Private consumption continues to have, in spite of some signs of
improvement, very low rates , thus showing great weakness. |
Probability
of default
> Estimated Probability of Default for the next 12 months: 1.981 %
|
Sector in which comparison is carried out: 464 Wholesale of household goods |
|
|
Relative Position:
|
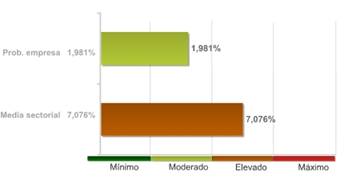
The company's comparative analysis with the rest of the companies that comprise the sector, shows the company holds a better position with regard to the probability of non-compliance.
The 79.00% of the companies of the sector KIROS JEWELS SL belongs to show a higher probability of non-compliance.
The probability of the company's non-compliance with its payment obligations within deadlines estimated by our qualifications models is 1.981%.
In the event they fail to comply with the payment, the seriousness of the loss will depend on factors such as the promptness of the commencement of the charging management, the existence of executive documents which match the credit or the existence of guarantees and free debt assets under the name of the debtor. Therefore, the probability of non-compliance should not be solely interpreted as the total loss of the owed amount.
LEGAL
CLAIMS
|
Summary
of Judicial Claims |
|
|
|
|
|
|
|
|
||
|
|
|
No
se han publicado |
|
|
|
|
No
se han publicado |
|
|
|
|
||
|
|
|
No
se han publicado |
|
|
|
|
No
se han publicado |
|
|
|
|
No
se han publicado |
|
|
|
|
No
se han publicado |
|
|
|
|
||
|
|
|
No
se han publicado |
|
|
|
|
No
se han publicado |
|
|
|
|
||
|
|
|
No
se han publicado |
|
Link
List
|
SHAREHOLDERS: |
1 Entities |
> Shareholders
|
Relationship |
Entity |
Province |
Shareholding stake |
|
SHAREHOLDERS |
ANLO BUSINESS SL |
MADRID |
100 |
Turnover
|
Total Sales 2014 |
2.000.000 |
The sales data is from the latest available financial statements. Failing
that, are estimates data calculated by statistical methods.
Financial
Accounts and Balance Sheets
Financial Years
Presented
|
Ejercicio |
Tipo de Cuentas Anuales |
Fecha Presentacion |
|
2013 |
Normales |
September 2014 |
|
2012 |
Normales |
March 2014 |
|
2011 |
Normales |
April 2013 |
|
2010 |
Normales |
February 2012 |
|
2009 |
Normales |
February 2011 |
|
2008 |
Normales |
March 2010 |
|
2007 |
Normales |
December 2008 |
|
2006 |
Normales |
December 2007 |
|
2005 |
Normales |
October 2007 |
|
2004 |
Normales |
November 2005 |
The data in the report regarding the last Company Accounts submitted by the company is taken from the TRADE REGISTER serving the region in which the company's address is located 31/12/2013
> Balance en formato Pyme de acuerdo al Nuevo Plan General Contable 2007
Information corresponding to the fiscal year 2013 2012 2011 2010 2009 is taken from information submitted to the TRADE REGISTER. Data corresponding to fiscal years before 2013 2012 2011 2010 2009 has been compiled based on the equivalence criteria stipulated in Act JUS/206/2009. Where the provisions of the Act did not establish relevant equivalence criteria. To view details on the methodology.
|
|
ORIGINAL |
ORIGINAL |
ORIGINAL |
ORIGINAL |
ORIGINAL |
|
|
Assets |
2013 |
2012 |
2011 |
2010 |
2009 |
|
|
A) NON-CURRENT ASSETS: 11000 |
25.796,00 |
37.016,00 |
36.244,00 |
44.304,00 |
54.913,00 |
|
|
I. Intangible fixed assets
: 11100 |
0,00 |
1.115,00 |
484,00 |
516,00 |
991,00 |
|
|
II. Tangible fixed
assets : 11200 |
6.497,00 |
23.602,00 |
32.940,00 |
41.109,00 |
51.243,00 |
|
|
III. Real estate
investment: 11300 |
0,00 |
0,00 |
0,00 |
0,00 |
0,00 |
|
|
IV. Long-term
investments in Group companies and associates : 11400 |
0,00 |
0,00 |
0,00 |
0,00 |
0,00 |
|
|
V. Long-term
financial investments: 11500 |
19.298,00 |
12.298,00 |
2.820,00 |
2.680,00 |
2.680,00 |
|
|
VI. Assets for
deferred tax : 11600 |
0,00 |
0,00 |
0,00 |
0,00 |
0,00 |
|
|
VII. Non-current
trade debtors : 11700 |
0,00 |
0,00 |
0,00 |
0,00 |
0,00 |
|
|
B) CURRENT ASSETS: 12000 |
1.292.967,00 |
1.656.764,00 |
2.690.463,00 |
2.805.279,00 |
2.256.121,00 |
|
|
I. Stocks :
12200 |
215.281,00 |
425.254,00 |
948.522,00 |
1.638.546,00 |
1.822.365,00 |
|
|
II. Trade debtors and
others receivable accounts : 12300 |
958.363,00 |
1.196.837,00 |
1.700.656,00 |
1.121.145,00 |
423.764,00 |
|
|
1. Trade debtors / accounts receivable: 12380 |
954.953,00 |
1.183.231,00 |
1.692.050,00 |
1.109.661,00 |
372.701,00 |
|
|
a) Long-term receivables from sales and services supplied
: 12381 |
0,00 |
0,00 |
0,00 |
0,00 |
0,00 |
|
|
b) Customers for sales and provisions of services :
12382 |
954.953,00 |
1.183.231,00 |
1.692.050,00 |
1.109.661,00 |
372.701,00 |
|
|
2.
Called up share capital: 12370 |
0,00 |
0,00 |
0,00 |
0,00 |
0,00 |
|
|
3. Other accounts receivable : 12390 |
3.410,00 |
13.606,00 |
8.606,00 |
11.484,00 |
51.063,00 |
|
|
III. Short-term investment
in Group companies and associates: 12400 |
0,00 |
0,00 |
0,00 |
0,00 |
0,00 |
|
|
IV. Short-term
financial investments : 12500 |
7.500,00 |
10.378,00 |
10.378,00 |
7.500,00 |
7.500,00 |
|
|
V. Short-term accruals
: 12600 |
0,00 |
16.507,00 |
16.507,00 |
20.717,00 |
0,00 |
|
|
VI. Cash and other
equivalent liquid assets : 12700 |
111.823,00 |
7.788,00 |
14.400,00 |
17.372,00 |
2.492,00 |
|
|
TOTAL ASSETS (A + B) : 10000 |
1.318.763,00 |
1.693.780,00 |
2.726.707,00 |
2.849.583,00 |
2.311.034,00 |
|
|
|
ORIGINAL |
ORIGINAL |
ORIGINAL |
ORIGINAL |
ORIGINAL |
|
|
Liabilities and Net Worth |
2013 |
2012 |
2011 |
2010 |
2009 |
|
|
A) NET WORTH: 20000 |
434.402,00 |
398.569,00 |
345.328,00 |
304.147,00 |
287.685,00 |
|
|
A-1) Shareholders' equity: 21000 |
434.402,00 |
398.569,00 |
345.328,00 |
304.147,00 |
287.685,00 |
|
|
I. Capital:
21100 |
215.000,00 |
215.000,00 |
215.000,00 |
215.000,00 |
215.000,00 |
|
|
1. Registered capital : 21110 |
215.000,00 |
215.000,00 |
215.000,00 |
215.000,00 |
215.000,00 |
|
|
2. (Uncalled capital): 21120 |
0,00 |
0,00 |
0,00 |
0,00 |
0,00 |
|
|
II. Share premium:
21200 |
0,00 |
0,00 |
0,00 |
0,00 |
0,00 |
|
|
III. Reserves:
21300 |
183.569,00 |
130.328,00 |
89.147,00 |
72.685,00 |
64.237,00 |
|
|
IV. (Common stock
equity): 21400 |
0,00 |
0,00 |
0,00 |
0,00 |
0,00 |
|
|
V. Profit or loss
brought forward: 21500 |
0,00 |
0,00 |
0,00 |
0,00 |
0,00 |
|
|
VI. Other
shareholders' contributions: 21600 |
0,00 |
0,00 |
0,00 |
0,00 |
0,00 |
|
|
VII. Result of the
period: 21700 |
35.833,00 |
53.241,00 |
41.181,00 |
16.462,00 |
8.448,00 |
|
|
VIII. (Interim
dividend): 21800 |
0,00 |
0,00 |
0,00 |
0,00 |
0,00 |
|
|
A-2) Changes in net worth : 22000 |
0,00 |
0,00 |
0,00 |
0,00 |
0,00 |
|
|
A-3) Received subsidies, donations and legacies:
23000 |
0,00 |
0,00 |
0,00 |
0,00 |
0,00 |
|
|
B) NON-CURRENT LIABILITIES: 31000 |
59.421,00 |
31.144,00 |
44.604,00 |
57.948,00 |
27.980,00 |
|
|
I. Long-term
provisions: 31100 |
0,00 |
0,00 |
0,00 |
0,00 |
0,00 |
|
|
II. Long-term
creditors : 31200 |
59.421,00 |
31.144,00 |
44.604,00 |
57.948,00 |
27.980,00 |
|
|
1. Amounts owed to credit institutions: 31220 |
59.421,00 |
31.144,00 |
40.205,00 |
49.685,00 |
14.115,00 |
|
|
2.
Creditors from financial leasing : 31230 |
0,00 |
0,00 |
4.398,00 |
8.264,00 |
13.865,00 |
|
|
3. Other long-term creditors : 31290 |
0,00 |
0,00 |
0,00 |
0,00 |
0,00 |
|
|
III. Long-term debts with
Group companies and associates: 31300 |
0,00 |
0,00 |
0,00 |
0,00 |
0,00 |
|
|
IV. Liabilities for
deferred tax: 31400 |
0,00 |
0,00 |
0,00 |
0,00 |
0,00 |
|
|
V. Long-term
accruals: 31500 |
0,00 |
0,00 |
0,00 |
0,00 |
0,00 |
|
|
VI. Non-current trade
creditors : 31600 |
0,00 |
0,00 |
0,00 |
0,00 |
0,00 |
|
|
VII. Special
long-term debts : 31700 |
0,00 |
0,00 |
0,00 |
0,00 |
0,00 |
|
|
C) CURRENT LIABILITIES : 32000 |
824.941,00 |
1.264.067,00 |
2.336.775,00 |
2.487.488,00 |
1.995.369,00 |
|
|
I. Short-term
provisions: 32200 |
0,00 |
0,00 |
0,00 |
0,00 |
0,00 |
|
|
II. Short-term
creditors : 32300 |
72.388,00 |
24.083,00 |
82.625,00 |
0,00 |
5.193,00 |
|
|
1. Amounts owed to credit institutions: 32320 |
0,00 |
5.081,00 |
0,00 |
0,00 |
5.193,00 |
|
|
2. Creditors from financial leasing : 32330 |
0,00 |
0,00 |
0,00 |
0,00 |
0,00 |
|
|
3.
Other short-term creditors : 32390 |
72.388,00 |
19.002,00 |
82.625,00 |
0,00 |
0,00 |
|
|
III. Short-term
amounts owed to group and associated companies: 32400 |
0,00 |
0,00 |
0,00 |
0,00 |
0,00 |
|
|
IV. Trade creditors and
other accounts payable: 32500 |
752.553,00 |
1.239.985,00 |
2.254.150,00 |
2.487.488,00 |
1.990.176,00 |
|
|
1. Suppliers: 32580 |
644.259,00 |
1.099.286,00 |
2.065.944,00 |
2.321.461,00 |
1.903.926,00 |
|
|
a) Long-term debts : 32581 |
0,00 |
0,00 |
0,00 |
0,00 |
0,00 |
|
|
b) Short-term debts : 32582 |
644.259,00 |
1.099.286,00 |
2.065.944,00 |
2.321.461,00 |
1.903.926,00 |
|
|
2. Other creditors: 32590 |
108.294,00 |
140.698,00 |
188.206,00 |
166.027,00 |
86.250,00 |
|
|
V. Short-term
accruals : 32600 |
0,00 |
0,00 |
0,00 |
0,00 |
0,00 |
|
|
VI. Special
short-term debts : 32700 |
0,00 |
0,00 |
0,00 |
0,00 |
0,00 |
|
|
TOTAL NET WORTH AND LIABILITIES (A + B +
C) : 30000 |
1.318.763,00 |
1.693.780,00 |
2.726.707,00 |
2.849.583,00 |
2.311.034,00 |
|
|
|
ORIGINAL |
ORIGINAL |
ORIGINAL |
ORIGINAL |
ORIGINAL |
|
|
Profit and Loss |
2013 |
2012 |
2011 |
2010 |
2009 |
|
|
1. Net turnover:
40100 |
2.145.639,00 |
3.092.959,00 |
2.933.652,00 |
2.262.731,00 |
872.112,00 |
|
|
2. Changes in stocks
of finished goods and work in progress: 40200 |
0,00 |
0,00 |
0,00 |
0,00 |
0,00 |
|
|
3. Works carried out
by the company for its assets: 40300 |
0,00 |
0,00 |
0,00 |
0,00 |
0,00 |
|
|
4. Supplies :
40400 |
-1.414.116,00 |
-2.466.105,00 |
-2.430.303,00 |
-1.804.996,00 |
-505.497,00 |
|
|
5. Other operating income:
40500 |
0,00 |
0,00 |
0,00 |
0,00 |
0,00 |
|
|
6. Personnel costs:
40600 |
-339.961,00 |
-285.124,00 |
-237.132,00 |
-249.888,00 |
-225.327,00 |
|
|
7. Other operating
costs: 40700 |
-319.769,00 |
-265.061,00 |
-204.646,00 |
-229.537,00 |
-142.281,00 |
|
|
8. Amortisation of
fixed assets: 40800 |
-11.676,00 |
-13.466,00 |
-13.645,00 |
-13.308,00 |
-12.722,00 |
|
|
9. Allocation of
subsidies of non-financial fixed assets and other: 40900 |
0,00 |
0,00 |
0,00 |
0,00 |
0,00 |
|
|
10. Excess provisions
: 41000 |
0,00 |
0,00 |
0,00 |
0,00 |
0,00 |
|
|
11. Impairment and
result of transfers of fixed assets: 41100 |
-6.544,00 |
0,00 |
0,00 |
0,00 |
0,00 |
|
|
12. Other results :
41300 |
0,00 |
5.932,00 |
9.816,00 |
58.537,00 |
27.196,00 |
|
|
A) OPERATING INCOME (1 + 2 + 3 + 4 + 5 + 6
+ 7 + 8 + 9 + 10 + 11 + 12) : 49100 |
53.573,00 |
69.135,00 |
57.742,00 |
23.540,00 |
13.481,00 |
|
|
13. Financial income
: 41400 |
277,00 |
386,00 |
220,00 |
68,00 |
168,00 |
|
|
a) Allocation of financial subsidies, donations and legacies: 41430 |
0,00 |
0,00 |
0,00 |
0,00 |
0,00 |
|
|
b)
Other financial income: 41490 |
277,00 |
386,00 |
220,00 |
68,00 |
168,00 |
|
|
14. Financial
expenditure : 41500 |
-4.407,00 |
-1.862,00 |
-1.782,00 |
-1.658,00 |
-2.196,00 |
|
|
15. Changes in fair value
of financial instruments : 41600 |
0,00 |
-13,00 |
0,00 |
0,00 |
0,00 |
|
|
16. Exchange rate
differences: 41700 |
-2.709,00 |
-883,00 |
-1.273,00 |
0,00 |
-189,00 |
|
|
17. Impairment and result
for transfers of financial instruments : 41800 |
0,00 |
0,00 |
0,00 |
0,00 |
0,00 |
|
|
18. Other financial
income and expenditure: 42100 |
0,00 |
0,00 |
0,00 |
0,00 |
0,00 |
|
|
a)
Incorporation of financial expenditure to assets: 42110 |
0,00 |
0,00 |
0,00 |
0,00 |
0,00 |
|
|
b) Financial income from arrangement with creditors: 42120 |
0,00 |
0,00 |
0,00 |
0,00 |
0,00 |
|
|
c)
Other income and expenditure: 42130 |
0,00 |
0,00 |
0,00 |
0,00 |
0,00 |
|
|
B) FINANCIAL REVENUE ( 13 + 14 + 15 + 16 +
17 +18 ) : 49200 |
-6.839,00 |
-2.371,00 |
-2.834,00 |
-1.590,00 |
-2.217,00 |
|
|
C) NET RESULT BEFORE TAXES ( A + B ) :
49300 |
46.734,00 |
66.764,00 |
54.907,00 |
21.950,00 |
11.264,00 |
|
|
19. Income taxes :
41900 |
-10.901,00 |
-13.523,00 |
-13.727,00 |
-5.487,00 |
-2.816,00 |
|
|
D) RESULT OF THE PERIOD ( C + 19 ) :
49500 |
35.833,00 |
53.241,00 |
41.181,00 |
16.462,00 |
8.448,00 |
|
> Normal Balance Sheet under the rules of the 1990 General Accounting Plan (repealed since 1st January of 2008)
Information corresponding to the fiscal year 2013 2012 2011 2010 2009 has been compiled based on the equivalence criteria stipulated in Act JUS/206/2009. Where the provisions of the Act did not establish relevant equivalence criteria. To view details on the methodology 2013 2012 2011 2010 2009 is taken from information submitted to the TRADE REGISTER.
|
|
EQUIVALENCIA |
EQUIVALENCIA |
EQUIVALENCIA |
EQUIVALENCIA |
EQUIVALENCIA |
|
|
ASSETS |
2013 |
2012 |
2011 |
2010 |
2009 |
|
|
A) SHAREHOLDERS (PARTNERS) BY UNCALLED
SUSCRIBED CAPITAL: |
0,00 |
0,00 |
0,00 |
0,00 |
0,00 |
|
|
B) FIXED ASSETS: |
25.796,00 |
37.016,00 |
36.244,00 |
44.304,00 |
54.913,00 |
|
|
I. Formation
expenses: |
0,00 |
0,00 |
0,00 |
0,00 |
0,00 |
|
|
II. Intangible fixed
assets: |
0,00 |
1.115,00 |
484,00 |
516,00 |
991,00 |
|
|
III. Tangible fixed
assets: |
6.497,00 |
23.602,00 |
32.940,00 |
41.109,00 |
51.243,00 |
|
|
IV. Financial
investments: |
19.298,00 |
12.298,00 |
2.820,00 |
2.680,00 |
2.680,00 |
|
|
V. Own shares: |
0,00 |
0,00 |
0,00 |
0,00 |
0,00 |
|
|
VI. Long-term trade
receivables: |
0,00 |
0,00 |
0,00 |
0,00 |
0,00 |
|
|
C) Deferred expenses: |
0,00 |
0,00 |
0,00 |
0,00 |
0,00 |
|
|
D) CURRENT ASSETS: |
1.292.967,00 |
1.656.764,00 |
2.690.463,00 |
2.805.279,00 |
2.256.121,00 |
|
|
I. Called-up share
capital (not paid): |
0,00 |
0,00 |
0,00 |
0,00 |
0,00 |
|
|
II. Stocks: |
215.281,00 |
425.254,00 |
948.522,00 |
1.638.546,00 |
1.822.365,00 |
|
|
III. Debtors: |
958.363,00 |
1.196.837,00 |
1.700.656,00 |
1.121.145,00 |
423.764,00 |
|
|
IV. Short-term
investments: |
7.500,00 |
10.378,00 |
10.378,00 |
7.500,00 |
7.500,00 |
|
|
V. Short-term
treasury shares: |
0,00 |
0,00 |
0,00 |
0,00 |
0,00 |
|
|
VI. Cash at bank and
in hand: |
111.823,00 |
7.788,00 |
14.400,00 |
17.372,00 |
2.492,00 |
|
|
VII. Prepayments and
accrued income: |
0,00 |
16.507,00 |
16.507,00 |
20.717,00 |
0,00 |
|
|
GENERAL TOTAL (A + B + C + D): |
1.318.763,00 |
1.693.780,00 |
2.726.707,00 |
2.849.583,00 |
2.311.034,00 |
|
MERCANTILE
REGISTRY.
|
|
EQUIVALENCIA |
EQUIVALENCIA |
EQUIVALENCIA |
EQUIVALENCIA |
EQUIVALENCIA |
|
|
LIABILITIES |
2013 |
2012 |
2011 |
2010 |
2009 |
|
|
A) EQUITY: |
434.402,00 |
398.569,00 |
345.328,00 |
304.147,00 |
287.685,00 |
|
|
I. Subscribed
capital: |
215.000,00 |
215.000,00 |
215.000,00 |
215.000,00 |
215.000,00 |
|
|
II. Share premium:
|
0,00 |
0,00 |
0,00 |
0,00 |
0,00 |
|
|
III. Revaluation
reserves: |
0,00 |
0,00 |
0,00 |
0,00 |
0,00 |
|
|
IV. Reserves: |
183.569,00 |
130.328,00 |
89.147,00 |
72.685,00 |
64.237,00 |
|
|
a) Differences for capital adjustment to euros: |
0,00 |
0,00 |
0,00 |
0,00 |
0,00 |
|
|
b) Remaining Reserves: |
183.569,00 |
130.328,00 |
89.147,00 |
72.685,00 |
64.237,00 |
|
|
V. Profit or loss
brought forward: |
0,00 |
0,00 |
0,00 |
0,00 |
0,00 |
|
|
VI. Profit or loss
for the financial year: |
35.833,00 |
53.241,00 |
41.181,00 |
16.462,00 |
8.448,00 |
|
|
VII. Interim dividend
paid: |
0,00 |
0,00 |
0,00 |
0,00 |
0,00 |
|
|
VIII. Own shares for
capital reduction: |
0,00 |
0,00 |
0,00 |
0,00 |
0,00 |
|
|
B) Deferred income: |
0,00 |
0,00 |
0,00 |
0,00 |
0,00 |
|
|
C) PROVISIONS FOR LIABILITIES AND CHARGES:
|
0,00 |
0,00 |
0,00 |
0,00 |
0,00 |
|
|
D) LONG TERM LIABILITIES: |
59.421,00 |
31.144,00 |
44.604,00 |
57.948,00 |
27.980,00 |
|
|
E) SHORT TERM CREDITORS: |
824.941,00 |
1.264.067,00 |
2.336.775,00 |
2.487.488,00 |
1.995.369,00 |
|
|
F) SHORT-TERM PROVISIONS FOR LIABILITIES
AND CHARGES: |
0,00 |
0,00 |
0,00 |
0,00 |
0,00 |
|
|
GENERAL TOTAL (A + B + C + D + E + F):
|
1.318.763,00 |
1.693.780,00 |
2.726.707,00 |
2.849.583,00 |
2.311.034,00 |
|
MERCANTILE
REGISTRY.
|
|
EQUIVALENCIA |
EQUIVALENCIA |
EQUIVALENCIA |
EQUIVALENCIA |
EQUIVALENCIA |
|
|
DEBIT |
2013 |
2012 |
2011 |
2010 |
2009 |
|
|
A) CHARGES (A.1 to A.15): |
2.110.083,00 |
3.046.036,00 |
2.902.507,00 |
2.304.874,00 |
891.028,00 |
|
|
A.1. Operating consumption: |
1.414.116,00 |
2.466.105,00 |
2.430.303,00 |
1.804.996,00 |
505.497,00 |
|
|
A.2. Staff Costs: |
339.961,00 |
285.124,00 |
237.132,00 |
249.888,00 |
225.327,00 |
|
|
a) Wages, salaries et al.: |
285.451,00 |
239.406,00 |
199.110,00 |
209.820,00 |
189.197,00 |
|
|
b) Social security costs: |
54.511,00 |
45.718,00 |
38.023,00 |
40.068,00 |
36.130,00 |
|
|
A.3. Depreciation expense: |
11.676,00 |
13.466,00 |
13.645,00 |
13.308,00 |
12.722,00 |
|
|
A.4. Variation of trade provisions and losses of unrecovered receivables:
|
0,00 |
0,00 |
0,00 |
0,00 |
0,00 |
|
|
A.5. Other operating charges: |
319.769,00 |
265.061,00 |
204.646,00 |
229.537,00 |
142.281,00 |
|
|
A.I. OPERATING
BENEFITS (B.1-A.1-A.2-A.3-A.4-A.5): |
60.116,00 |
63.203,00 |
47.926,00 |
0,00 |
0,00 |
|
|
A.6. Financial and similar charges: |
4.407,00 |
1.862,00 |
1.782,00 |
1.658,00 |
2.196,00 |
|
|
a) Due to liabilities with companies of the group:
|
0,00 |
0,00 |
0,00 |
0,00 |
0,00 |
|
|
b) Due to liabilities with associated companies: |
0,00 |
0,00 |
0,00 |
0,00 |
0,00 |
|
|
c) Due to other debts: |
4.407,00 |
1.862,00 |
1.782,00 |
1.658,00 |
2.196,00 |
|
|
d) Losses from financial investments: |
0,00 |
0,00 |
0,00 |
0,00 |
0,00 |
|
|
A.7. Financial investment provision change: |
0,00 |
13,00 |
0,00 |
0,00 |
0,00 |
|
|
A.8. Exchange losses: |
2.709,00 |
883,00 |
1.273,00 |
0,00 |
189,00 |
|
|
A.II. POSITIVE
FINANCIAL RESULTS (B.2+B.3-A.6-A.7-A.8): |
0,00 |
0,00 |
0,00 |
0,00 |
0,00 |
|
|
A.III. PROFIT FROM
ORDINARY ACTIVITIES (A.I+A.II-B.I-B.II): |
53.277,00 |
60.832,00 |
45.092,00 |
0,00 |
0,00 |
|
|
A.9. Changes in provisions for intangible, tangible and securities portfolio:
|
0,00 |
0,00 |
0,00 |
0,00 |
0,00 |
|
|
A.10. Losses from tangible and intangible fixed assets and portfolio: |
6.544,00 |
0,00 |
0,00 |
0,00 |
0,00 |
|
|
A.11. Losses from transactions with own shares and debentures: |
0,00 |
0,00 |
0,00 |
0,00 |
0,00 |
|
|
A.12. Extraordinary expenses: |
0,00 |
0,00 |
0,00 |
0,00 |
0,00 |
|
|
A.13. Prior year expenses and losses: |
0,00 |
0,00 |
0,00 |
0,00 |
0,00 |
|
|
A.IV. EXTRAORDINARY
PROFIT (B.4+B.5+B.6+B.7+B.8-A.9-A.10-A.11-A.12-A.13): |
0,00 |
5.932,00 |
9.816,00 |
58.537,00 |
27.196,00 |
|
|
A.V. PROFIT BEFORE
TAXES (A.III+A.IV-B.III-B.IV): |
46.734,00 |
66.764,00 |
54.907,00 |
21.950,00 |
11.264,00 |
|
|
A.14. Corporation Tax: |
10.901,00 |
13.523,00 |
13.727,00 |
5.487,00 |
2.816,00 |
|
|
A.15.
Miscellaneous taxes: |
0,00 |
0,00 |
0,00 |
0,00 |
0,00 |
|
|
A.VI. FINANCIAL YEAR
RESULT (PROFIT) (A.V-A.14-A.15): |
35.833,00 |
53.241,00 |
41.181,00 |
16.462,00 |
8.448,00 |
|
MERCANTILE
REGISTRY.
|
|
EQUIVALENCIA |
EQUIVALENCIA |
EQUIVALENCIA |
EQUIVALENCIA |
EQUIVALENCIA |
|
|
CREDIT |
2013 |
2012 |
2011 |
2010 |
2009 |
|
|
B) INCOME ( B.1 to B.8): |
2.145.916,00 |
3.099.277,00 |
2.943.688,00 |
2.321.336,00 |
899.476,00 |
|
|
B.1.
Operating income: |
2.145.639,00 |
3.092.959,00 |
2.933.652,00 |
2.262.731,00 |
872.112,00 |
|
|
a) Net total sales: |
2.145.639,00 |
3.092.959,00 |
2.933.652,00 |
2.262.731,00 |
872.112,00 |
|
|
b) Miscellaneous operating income: |
0,00 |
0,00 |
0,00 |
0,00 |
0,00 |
|
|
B.I. PÉRDIDAS DE
EXPLOTACIÓN (A.1+A.2+A.3+A.4+A.5-B.1 ): |
0,00 |
0,00 |
0,00 |
34.997,00 |
13.715,00 |
|
|
B.2. Financial income: |
277,00 |
386,00 |
220,00 |
68,00 |
168,00 |
|
|
a) Companies of the group: |
0,00 |
0,00 |
0,00 |
0,00 |
0,00 |
|
|
b) In associated companies: |
0,00 |
0,00 |
0,00 |
0,00 |
0,00 |
|
|
c) Miscellaneous: |
277,00 |
386,00 |
220,00 |
68,00 |
168,00 |
|
|
d) Profit on financial investment: |
0,00 |
0,00 |
0,00 |
0,00 |
0,00 |
|
|
B.3. Exchange gains: |
0,00 |
0,00 |
0,00 |
0,00 |
0,00 |
|
|
B.II. NEGATIVE
FINANCIAL RESULTS (A.6+A.7+A.8-B.2-B.3): |
6.839,00 |
2.371,00 |
2.834,00 |
1.590,00 |
2.217,00 |
|
|
B.III. LOSSES ON
ORDINARY ACTIVITIES ( B.I + B.II - A.I - A.II ): |
0,00 |
0,00 |
0,00 |
36.588,00 |
15.932,00 |
|
|
B.4. Profit on disposal of both tangible and intangible fixed assets and
securities portfolio: |
0,00 |
0,00 |
0,00 |
0,00 |
0,00 |
|
|
B.5. Profit on transactions with own shares and debentures: |
0,00 |
0,00 |
0,00 |
0,00 |
0,00 |
|
|
B.6. Capital grants transferred to profit and loss: |
0,00 |
0,00 |
0,00 |
0,00 |
0,00 |
|
|
B.7. Extraordinary income: |
0,00 |
5.932,00 |
9.816,00 |
58.537,00 |
27.196,00 |
|
|
B.8. Income and profit of former financial years: |
0,00 |
0,00 |
0,00 |
0,00 |
0,00 |
|
|
B.IV. NEGATIVE
EXTRAORDINARY RESULTS (A.9+A.10+A.11+A.12+A.13-B.4-B.5-B.6-B.7-B.8): |
6.544,00 |
0,00 |
0,00 |
0,00 |
0,00 |
|
|
B.V. LOSSES BEFORE
TAXES (B.III+B.IV-A.III-A.IV): |
0,00 |
0,00 |
0,00 |
0,00 |
0,00 |
|
|
B.VI. FINANCIAL YEAR
RESULTS (LOSSES) (B.V+A.14+A.15): |
0,00 |
0,00 |
0,00 |
0,00 |
0,00 |
|
MERCANTILE
REGISTRY.
CASHFLOW
STATEMENT
Model: Normal
> Source of information: Data contained
in this section is taken from the information declared in the Annual Accounts
submitted to the Trade Register.
|
|
2013 |
2012 |
2011 |
2010 |
2009 |
|
|
1. Fiscal year result before taxes.:
61100 |
46.734,00 |
66.764,00 |
54.907,00 |
21.950,00 |
11.264,00 |
|
|
2. Results adjustments.: 61200 |
15.806,00 |
14.942,00 |
15.207,00 |
14.898,00 |
14.750,00 |
|
|
a) Fixed Assets Amortization
(+).: 61201 |
11.676,00 |
13.466,00 |
13.645,00 |
13.308,00 |
12.722,00 |
|
|
g) Financial income
(-).: 61207 |
-277,00 |
-386,00 |
-220,00 |
-68,00 |
-168,00 |
|
|
h) Financial Expenses
(+). : 61208 |
4.407,00 |
1.862,00 |
1.782,00 |
1.658,00 |
2.196,00 |
|
|
3. Changes in current capital equity.:
61300 |
-30.500,00 |
-602,00 |
-135.220,00 |
-42.454,00 |
-33.996,00 |
|
|
a) Stock (+/-).:
61301 |
209.973,00 |
523.268,00 |
690.024,00 |
183.819,00 |
-533.841,00 |
|
|
d) Debtors and other
accounts receivable (+/-). : 61302 |
238.474,00 |
503.819,00 |
-579.511,00 |
-697.381,00 |
170.541,00 |
|
|
c) Other current
assets (+/-). : 61303 |
19.385,00 |
0,00 |
1.331,00 |
-20.717,00 |
11.686,00 |
|
|
d) Creditors and
other accounts payable (+/-). : 61304 |
-498.332,00 |
-1.027.689,00 |
-247.064,00 |
491.824,00 |
317.618,00 |
|
|
4. Other cash flows for operating
activities.: 61400 |
-4.130,00 |
-1.476,00 |
-1.562,00 |
-1.590,00 |
-2.028,00 |
|
|
a) Interest payments
(-). : 61401 |
-4.407,00 |
-1.862,00 |
-1.782,00 |
-1.658,00 |
-2.196,00 |
|
|
c) Interest
collection (+). : 61403 |
277,00 |
386,00 |
220,00 |
68,00 |
168,00 |
|
|
5. Operating activity cash flows (1 + 2 +
3 + 4) : 61500 |
27.910,00 |
79.628,00 |
-66.667,00 |
-7.197,00 |
-10.010,00 |
|
|
6. Payments for investment (-).:
62100 |
-7.000,00 |
-10.110,00 |
-140,00 |
0,00 |
-1.180,00 |
|
|
b) Intangible fixed
assets. : 62102 |
0,00 |
-631,00 |
0,00 |
0,00 |
0,00 |
|
|
e) Other financial
assets. : 62105 |
-7.000,00 |
-9.478,00 |
-140,00 |
0,00 |
-1.180,00 |
|
|
7. Divestment payment collection (+). :
62200 |
18.220,00 |
9.338,00 |
8.200,00 |
10.609,00 |
4.552,00 |
|
|
b) Intangible fixed
assets. : 62202 |
1.115,00 |
0,00 |
31,00 |
475,00 |
31,00 |
|
|
c) Fixed assets. :
62203 |
17.104,00 |
9.338,00 |
8.169,00 |
10.134,00 |
4.521,00 |
|
|
8. Investment activity cash flows (6 + 7)
minus Amortization: 62300 |
-456,00 |
-14.238,00 |
-5.585,00 |
-2.698,00 |
-9.350,00 |
|
|
9. Payment collection and payments for
equity instruments. : 63100 |
0,00 |
0,00 |
0,00 |
0,00 |
0,00 |
|
|
10. Payment collection and payments for
financial liabilities instruments.: 63200 |
76.582,00 |
-72.003,00 |
69.280,00 |
24.775,00 |
-13.215,00 |
|
|
a) Issuance :
63201 |
81.663,00 |
5.081,00 |
82.625,00 |
35.570,00 |
0,00 |
|
|
2. Debts incurred
with credit institutions (+). : 63203 |
28.277,00 |
5.081,00 |
0,00 |
35.570,00 |
0,00 |
|
|
5. Other debts (+). :
63206 |
53.386,00 |
0,00 |
82.625,00 |
0,00 |
0,00 |
|
|
b) Repayment and
amortization of : 63207 |
-5.081,00 |
-77.083,00 |
-13.345,00 |
-10.795,00 |
-13.215,00 |
|
|
2. Debts incurred
with credit institutions (-).: 63209 |
-5.081,00 |
-9.062,00 |
-9.479,00 |
-5.193,00 |
-7.901,00 |
|
|
4. Special characteristic
debts (-). : 63211 |
0,00 |
-4.398,00 |
-3.865,00 |
-5.602,00 |
-5.314,00 |
|
|
5. Other debts (-). :
63212 |
0,00 |
-63.623,00 |
0,00 |
0,00 |
0,00 |
|
|
11. Payments from dividends and remunerations
from other assets instruments. : 63300 |
0,00 |
0,00 |
0,00 |
0,00 |
0,00 |
|
|
12. Cash flows for financing activities
(9+10+11).: 63400 |
76.582,00 |
-72.003,00 |
69.280,00 |
24.775,00 |
-13.215,00 |
|
|
D) EFFECT OF EXCHANGE RATE CHANGES:
64000 |
0,00 |
0,00 |
0,00 |
0,00 |
0,00 |
|
|
E) NET INCREASE/DECREASE OF CASH OR
EQUIVALENT ASSETS (+/-5+/-8+/12+/-D) : 65000 |
104.036,00 |
-6.612,00 |
-2.972,00 |
14.879,00 |
-32.575,00 |
|
|
Cash or equivalent
assets as of beginning of the fiscal year.: 65100 |
7.788,00 |
14.400,00 |
17.372,00 |
2.492,00 |
35.067,00 |
|
|
Cash or equivalent
assets as of end of the fiscal year.: 65200 |
111.823,00 |
7.788,00 |
14.400,00 |
17.372,00 |
2.492,00 |
|
FINANCIAL
DIAGNOSIS
> Economic-Financial Comparative Analysis
Data used in the following ratios and indicators is taken from the Annual Accounts submitted by the company to the TRADE REGISTER.
> Comparison within the Sector
|
Cash Flow |
2013 |
2012 |
Variación 2013 -
2012 |
|
|||
|
|
Empresa |
Sector |
Empresa |
Sector |
Empresa |
Sector |
|
|
Cash Flow over Sales: |
0,05 % |
0,01 % |
0,00 % |
0,00 % |
|
|
|
|
EBITDA over Sales: |
3,35 % |
4,39 % |
2,48 % |
2,62 % |
34,98 % |
67,31 % |
|
|
Cash Flow Yield: |
0,08 % |
0,00 % |
0,00 % |
0,00 % |
|
|
|
|
Profitability |
2013 |
2012 |
Variación 2013 -
2012 |
|
|||
|
|
Empresa |
Sector |
Empresa |
Sector |
Empresa |
Sector |
|
|
Operating economic profitability: |
4,15 % |
1,65 % |
3,78 % |
0,95 % |
9,64 % |
72,81 % |
|
|
Total economic profitability: |
3,88 % |
1,50 % |
4,05 % |
1,35 % |
-4,29 % |
10,79 % |
|
|
Financial profitability: |
8,25 % |
0,05 % |
13,36 % |
-0,34 % |
-38,25 % |
115,94 % |
|
|
Margin: |
2,50 % |
1,71 % |
2,04 % |
1,06 % |
22,19 % |
60,84 % |
|
|
Mark-up: |
2,18 % |
0,24 % |
1,97 % |
-0,22 % |
10,74 % |
204,93 % |
|
|
Solvency |
2013 |
2012 |
Variación 2013 -
2012 |
|
|||
|
|
Empresa |
Sector |
Empresa |
Sector |
Empresa |
Sector |
|
|
Liquidity: |
0,14 |
0,26 |
0,01 |
0,23 |
2.100,18 |
10,76 |
|
|
Acid Test: |
1,31 |
1,10 |
0,96 |
1,07 |
35,91 |
2,47 |
|
|
Working Capital / Investment: |
0,35 |
0,21 |
0,23 |
0,21 |
53,07 |
-3,82 |
|
|
Solvency: |
1,57 |
1,76 |
1,31 |
1,79 |
19,58 |
-2,16 |
|
|
Indebtedness |
2013 |
2012 |
Variación 2013 -
2012 |
|
|||
|
|
Empresa |
Sector |
Empresa |
Sector |
Empresa |
Sector |
|
|
Indebtedness level: |
2,04 |
1,03 |
3,25 |
1,08 |
-37,35 |
-4,41 |
|
|
Borrowing Composition: |
0,07 |
0,73 |
0,02 |
0,80 |
192,35 |
-8,29 |
|
|
Repayment Ability: |
8,50 |
103,97 |
-195,89 |
-1.451,83 |
104,34 |
107,16 |
|
|
Warranty: |
1,49 |
1,98 |
1,31 |
1,93 |
14,03 |
2,20 |
|
|
Generated resources / Total creditors:
|
0,05 |
0,06 |
0,05 |
0,04 |
4,31 |
25,42 |
|
|
Efficiency |
2013 |
2012 |
Variación 2013 -
2012 |
|
|||
|
|
Empresa |
Sector |
Empresa |
Sector |
Empresa |
Sector |
|
|
Productivity: |
1,21 |
1,20 |
1,27 |
1,11 |
-4,55 |
8,39 |
|
|
Turnover of Collection Rights : |
2,24 |
4,36 |
2,58 |
4,25 |
-13,37 |
2,73 |
|
|
Turnover of Payment Entitlements: |
2,30 |
2,92 |
2,20 |
2,76 |
4,60 |
6,00 |
|
|
Stock rotation: |
9,69 |
4,21 |
7,12 |
3,66 |
35,97 |
14,90 |
|
|
Assets turnover: |
1,66 |
0,96 |
1,85 |
0,90 |
-10,27 |
7,44 |
|
|
Borrowing Cost: |
0,50 |
2,14 |
0,14 |
2,43 |
246,60 |
-11,83 |
|
> Trend of indicators under the General
Accounting Plan of 2007 (2013, 2012, 2011, 2010, 2009)
|
Cash Flow |
2013 |
2012 |
2011 |
2010 |
2009 |
|
|
Cash Flow over Sales: |
0,05 % |
0,00 % |
0,00 % |
0,01 % |
-0,04 % |
|
|
EBITDA over Sales: |
3,35 % |
2,48 % |
2,10 % |
-0,96 % |
-0,11 % |
|
|
Cash Flow Yield: |
0,08 % |
0,00 % |
0,00 % |
0,01 % |
-0,01 % |
|
|
Profitability |
2013 |
2012 |
2011 |
2010 |
2009 |
|
|
Operating economic profitability: |
4,15 % |
3,78 % |
1,77 % |
-1,23 % |
-0,60 % |
|
|
Total economic profitability: |
3,88 % |
4,05 % |
2,08 % |
0,83 % |
0,58 % |
|
|
Financial profitability: |
8,25 % |
13,36 % |
11,93 % |
5,41 % |
2,94 % |
|
|
Margin: |
2,50 % |
2,04 % |
1,63 % |
-1,55 % |
-1,57 % |
|
|
Mark-up: |
2,18 % |
1,97 % |
1,54 % |
-1,62 % |
-1,83 % |
|
|
Solvency |
2013 |
2012 |
2011 |
2010 |
2009 |
|
|
Liquidity: |
0,14 |
0,01 |
0,01 |
0,01 |
0,00 |
|
|
Acid Test: |
1,31 |
0,96 |
0,74 |
0,46 |
0,22 |
|
|
Working Capital / Investment: |
0,35 |
0,23 |
0,13 |
0,11 |
0,11 |
|
|
Solvency: |
1,57 |
1,31 |
1,15 |
1,13 |
1,13 |
|
|
Indebtedness |
2013 |
2012 |
2011 |
2010 |
2009 |
|
|
Indebtedness level: |
2,04 |
3,25 |
6,90 |
8,37 |
7,03 |
|
|
Borrowing Composition: |
0,07 |
0,02 |
0,02 |
0,02 |
0,01 |
|
|
Repayment Ability: |
8,50 |
-195,89 |
-801,29 |
171,07 |
-62,11 |
|
|
Warranty: |
1,49 |
1,31 |
1,15 |
1,12 |
1,14 |
|
|
Generated resources / Total creditors:
|
0,05 |
0,05 |
0,02 |
0,01 |
0,01 |
|
|
Efficiency |
2013 |
2012 |
2011 |
2010 |
2009 |
|
|
Productivity: |
1,21 |
1,27 |
1,26 |
0,91 |
1,00 |
|
|
Turnover of Collection Rights : |
2,24 |
2,58 |
1,73 |
2,02 |
2,06 |
|
|
Turnover of Payment Entitlements: |
2,30 |
2,20 |
1,17 |
0,82 |
0,33 |
|
|
Stock rotation: |
9,69 |
7,12 |
3,04 |
1,40 |
0,49 |
|
|
Assets turnover: |
1,66 |
1,85 |
1,08 |
0,80 |
0,38 |
|
|
Borrowing Cost: |
0,50 |
0,14 |
0,07 |
0,07 |
0,11 |
|
COMPARATIVE SECTORIAL BALANCE
Sector-based
Comparison under the rules of the New General Accounting Plan.
|
|
Variación - |
|
|
|
Empresa |
Sector |
|
|
Variación - |
|
|
|
Empresa |
Sector |
|
|
Variación - |
|
|
|
Empresa |
Sector |
News
--
Public
Tenders and Works Won
No Public
Tenders assigned to the name of the company.
Research
Summary
The corporation was
established in 2005. It is dedicated to the manufacture of jewelry items. Its
invoivcing has decreased with a percentage of 30,63 % in 2013 in comparison to
the previous year. Complies regularly with its payment obligations
Sources
Registry of Commerce's Official Gazette. Own
and external data bases Company References
DIAMOND
INDUSTRY – INDIA
-
From time immemorial, India is well known in the world
as the birthplace for diamonds. It is difficult to trace the origin of
diamonds but history says that in the remote past, diamonds were mined only in
India. Diamond production in India can be traced back to almost 8th
Century B.C. India, in fact, remained undisputed leader till 18th
Century when Brazilian fields were discovered in 1725 followed by emergence of
S. Africa, Russia and Australia.
-
The achievement of the Indian diamond industry was
possible only due to combination of the manufacturing skills of the Indian
workforce and the untiring and unflagging efforts of the Indian diamantaires,
supported by progressive Government policies.
-
The area of study of family owned diamond businesses
derives its importance from the huge conglomerate of family run organizations
which operate in the diamond industry since many generations.
-
Some of the basic traits of family run business
enterprises include spirit of entrepreneurship, mutual trust lowers transaction
costs, small, nimble and quick to react, information as a source of advantage
and philanthropy.
-
Family owned diamond businesses need to improve on
many fronts including higher standard of corporate governance, long-term
performance – focused strategies, modern management and technology.
-
Utmost caution is to be exercised while dealing with
some medium and large diamond traders which are usually engaged in fictitious
import – export, inter-company transactions, financially assisted by banks. In
the process, several public sector banks lost several hundred million rupees.
They mostly diverted borrowed money for diamond business into real estate and
capital markets.
-
Excerpts from Times of India dated 30th
October 2010 is as under –
-
Gem & Jewellery Export Promotion Council in its
statistical data has shown the export of polished diamonds to have increase by
28 % in February 2013. Compared to $ 1.4 bn worth of polished diamond export in
February, 2012, India exported $ 1.84 billion worth of polished diamonds in February
2013. A senior executive of GJEPC said, “Export of cut and polished diamonds
started falling month-wise after the imposition of 2 % of import duty on the
polished diamonds. But February, 2013 has given a new ray of hope to the
industry as the export of polished diamonds has actually increased by 28 %. It
means the industry is on the track of recovery and round tripping of
diamonds has stopped completely.” Demand has started coming from the US, the
UK, Japan and China. India’s polished diamond export is expected to cross $ 21
bn in 2013-14.
-
The banking sector has started exercising restraint
while following prudent risk management norms when lending money to gems and
jewellery sector. This follows the implementation of Basel III accord – a
global voluntary regulatory standard on bank capital adequacy, stress testing
and market liquidity.
FOREIGN EXCHANGE RATES
|
Currency |
Unit
|
Indian Rupees |
|
US Dollar |
1 |
Rs.66.74 |
|
UK Pound |
1 |
Rs.101.36 |
|
Euro |
1 |
Rs.74.27 |
INFORMATION DETAILS
|
Analysis Done by
: |
RAS |
|
|
|
|
Report Prepared
by : |
VNT |
RATING EXPLANATIONS
|
RATING |
STATUS |
PROPOSED CREDIT LINE |
|
|
|
>86 |
Aaa |
Possesses an extremely sound financial base with the strongest capability
for timely payment of interest and principal sums |
Unlimited |
|
|
71-85 |
Aa |
Possesses adequate working capital. No caution needed for credit
transaction. It has above average (strong) capability for payment of interest
and principal sums |
Large |
|
|
56-70 |
A |
Financial & operational base are regarded healthy. General
unfavourable factors will not cause fatal effect. Satisfactory capability for
payment of interest and principal sums |
Fairly Large |
|
|
41-55 |
Ba |
Overall operation is considered normal. Capable to meet normal
commitments. |
Satisfactory |
|
|
26-40 |
B |
Capability to overcome financial difficulties seems comparatively
below average. |
Small |
|
|
11-25 |
Ca |
Adverse factors are apparent. Repayment of interest and principal sums
in default or expected to be in default upon maturity |
Limited with
full security |
|
|
<10 |
C |
Absolute credit risk exists. Caution needed to be exercised |
Credit not
recommended |
|
|
-- |
NB |
New Business |
-- |
|
This score serves as a reference to assess
SC’s credit risk and to set the amount of credit to be extended. It is
calculated from a composite of weighted scores obtained from each of the major sections
of this report. The assessed factors and their relative weights (as indicated
through %) are as follows:
Financial
condition (40%) Ownership
background (20%) Payment
record (10%)
Credit history
(10%) Market trend (10%) Operational size
(10%)
This report is issued at your request without any
risk and responsibility on the part of MIRA INFORM PRIVATE LIMITED (MIPL)
or its officials.