MIRA INFORM REPORT
|
Report No. : |
340208 |
|
Report Date : |
14.09.2015 |
IDENTIFICATION DETAILS
|
Name : |
AZBIL
TELSTAR TECHNOLOGIES SL |
|
|
|
|
Registered Office : |
Avg/
Font I Sague, 55 Parc Cientific I T.Orbital N - Terrassa - 08226 - Barcelona |
|
|
|
|
Country : |
Spain |
|
|
|
|
Financials (as on) : |
2014 |
|
|
|
|
Date of Incorporation : |
14.03.2005 |
|
|
|
|
Legal Form : |
Private Company |
|
|
|
|
Line of Business : |
Manufacture of Other General-Purpose Machinery. |
|
|
|
|
No. of Employees : |
Not Available |
RATING & COMMENTS
|
MIRA’s Rating : |
Ba |
|
RATING |
STATUS |
PROPOSED CREDIT LINE |
|
|
41-55 |
Ba |
Overall operation is considered normal. Capable to meet normal
commitments. |
Satisfactory |
|
Maximum Credit Limit : |
780.000 Euro |
|
Status : |
Satisfactory |
|
Payment Behaviour : |
Slow but correct |
|
Litigation : |
Clear |
NOTES:
Any query related to this report can be made
on e-mail: infodept@mirainform.com
while quoting report number, name and date.
ECGC Country Risk Classification List – March 31, 2015
|
Country Name |
Previous Rating (31.12.2014) |
Current Rating (31.03.2015) |
|
Spain |
A1 |
A1 |
|
Risk Category |
ECGC
Classification |
|
Insignificant |
A1 |
|
Low |
A2 |
|
Moderate |
B1 |
|
High |
B2 |
|
Very High |
C1 |
|
Restricted |
C2 |
|
Off-credit |
D |
SPAIN - ECONOMIC OVERVIEW
After experiencing a prolonged recession in the wake of the global financial crisis that began in 2008, in 2014 Spain marked the first full year of positive economic growth in seven years, largely due to increased private consumption. At the onset of the global financial crisis Spain's GDP contracted by 3.7% in 2009, ending a 16-year growth trend, and continued contracting through most of 2013. In 2013 the government successfully shored up struggling banks - exposed to the collapse of Spain's depressed real estate and construction sectors - and in January 2014 completed an EU-funded restructuring and recapitalization program.
Until 2014, credit contraction in the private sector, fiscal austerity, and high unemployment weighed on domestic consumption and investment. The unemployment rate rose from a low of about 8% in 2007 to more than 26% in 2013, but labor reforms prompted a modest reduction to 23.7% in 2014. High unemployment strained Spain's public finances, as spending on social benefits increased while tax revenues fell. Spain’s budget deficit peaked at 11.4% of GDP in 2010, but Spain gradually reduced the deficit to just under 7% of GDP in 2013-14, slightly above the 6.5% target negotiated between Spain and the EU. Public debt has increased substantially – from 60.1% of GDP in 2010 to more than 97% in 2014.
Exports were resilient throughout the economic downturn and helped to bring Spain's current account into surplus in 2013 for the first time since 1986, where it remained in 2014. Rising labor productivity and an internal devaluation resulting from moderating labor costs and lower inflation have helped to improve foreign investor interest in the economy and positive FDI flows have been restored.
The government's efforts to implement labor, pension, health, tax, and education reforms - aimed at supporting investor sentiment - have become overshadowed by political activity in 2015 in anticipation of the national parliamentary elections in November. Spain’s 2015 budget, published in September 2014, rolls back some recently imposed taxes in advance of the elections and leaves untouched the country’s value-added tax (VAT) regime, which continues to generate significantly lower revenue than the EU average. Spain’s borrowing costs are dramatically lower since their peak in mid-2012, and despite the recent uptic in economic activity, inflation has dropped sharply, from 1.5% in 2013 to nearly flat in 2014.
|
Source
: CIA |
EXECUTIVE
SUMMARY
|
|
Name: |
AZBIL
TELSTAR TECHNOLOGIES SL |
|
NIF
/ Fiscal code: |
B63797559 |
|
Trade
Name |
TELSTAR |
|
Status: |
ACTIVE |
|
Incorporation
Date: |
14/03/2005 |
|
Register Data |
Register
Section 8 Sheet 297555 |
|
Last Publication in BORME: |
31/08/2015
[Revocations] |
|
Last
Published Account Deposit: |
2014 |
|
Share
Capital: |
6.295.570 |
|
|
|
|
Localization: |
Avg/
Font I Sague, 55 Parc Cientific I T.Orbital N - Terrassa - 08226 - Barcelona |
|
Telephone
- Fax - Email - Website: |
Telephone.
937 361 600 Email. telstar@telstar.eu Website. www.telstar.com |
|
|
|
|
Activity: |
|
|
NACE: |
2829
- Manufacture of other general-purpose machinery n.e.c. |
|
Registered
Trademarks: |
|
|
Audited
/ Opinion: |
Si
/ |
|
Tenders
and Awards: |
22
for a total cost of 2.848.347,89 |
|
Subsidies: |
9
for a total cost of 1104685 |
|
Quality
Certificate: |
No |
|
|
|
|
Maximum
recommended commercial credit: |
780.000 |
|
Payment
Behaviour: |
According
to the agreed terms |
|
Prospects: |
Product
/ service improvement |
|
Industry
situation: |
Maturity |
|
|
|
|
Defaults, Legal Claims and
Insolvency Proceedings : |
|
|
|
|
|
|
|
Number |
Amount (€) |
Most Recent Entry |
|
Insolvency
Proceedings, Bankruptcy and Suspension of Payments |
|
Unpublished |
--- |
--- |
|
Defaults
on debt with Financial Institutions and Large Companies |
|
None |
--- |
--- |
|
Judicial
Claims (Notices, Executive Proceedings, Attachments, Auctions, Bad Debt) |
|
1 |
0 |
--- |
|
Proceedings
heard by the Civil Court |
|
Unpublished |
0 |
--- |
|
Proceedings
heard by the Labour Court |
|
Unpublished |
0 |
--- |
|
|
|
Partners: |
|
|
|
AZBIL
TELSTAR SL |
100
% |
|
|
Shares: |
2 |
|
|
Other
Links: |
15 |
|
|
No.
of Active Corporate Bodies: |
SINGLE
ADMINISTRATOR 1 |
|
|
Ratios |
2014 |
2013 |
Change |
|
|
|
|
|
Guarantees: |
|
|
Properties
Registered: |
Company
NO, Administrator NO |
|
Financing
/ Guarantee Sources : |
Sources
YES, Guarantees YES |
|
|
|
|
|
|
|
INVESTIGATION
SUMMARY |
|
|
Big
size company engaged in development of engineering projects. Being a part of the
japanese group Azbil since 2013, has been operating for years with no
icedence registered. |
|
|
|
|
|
Enquiry
Details
|
|
|
Business address regime: |
PROPIEDAD |
|
|
|
|
Identification
|
|
|
Social Denomination: |
AZBIL TELSTAR TECHNOLOGIES
SL |
|
Trade Name: |
TELSTAR |
|
NIF / Fiscal code: |
B63797559 |
|
Corporate Status: |
ACTIVE |
|
Start of activity: |
2005 |
|
Registered Office: |
AVG/ FONT I SAGUE, 55 PARC
CIENTIFIC I T.ORBITAL N |
|
Locality: |
TERRASSA |
|
Province: |
BARCELONA |
|
Postal Code: |
08226 |
|
Telephone: |
937 361 600 |
|
Fax: |
937 861 380 |
|
Website: |
www.telstar.com |
|
Email: |
telstar@telstar.eu |
|
|
|
Branch
Offices
|
|
Activity
|
|
|
NACE: |
2829 |
|
Legal Form: |
STUDY, DEVELOPMENT, MANUFACTURING,
IMPORT, EXPORT, LAUNCHING AND SELLINGS OF VACUUM BLOWERS, ESPECIALLY FOR
APPLICATIONS OF DRYING AND ITS PERIPHERAL SYSTEMS; METALLURGICAL ITEMS OF ANY
KIND. REALIZATION OF ANY TYPE OF REPORTS, AUDITS, RATIFICATIONS,
CERTIFICATIONS, CONSULTANCIES, TECHNICAL ASSESORING, BASIC ENGINEERING,
DETAIL ENGINEERING, SORFWARE DEVELOPMENT. |
|
Additional Information: |
Design, development and
construction of engineering projects and equipment installing, mainly allocated
for biotechnology sectors, nanotechnology, chemical, pharmaceutical,
veterinary and aerospace industry. The company is part of the Japanese group
Azbil since 2013. It has ISO 9001.2008 Trademarks - TELSTAR |
|
Additional Address: |
Registered in office and
offices Avd Font i Sagué 55 Parc Cientific i Tecnologic Orbital 40 08227
Terrassa (Barcleona) Josep Tapiolas 20 08226 Terrassa (Barcelona) Avd Cots
Catalanes 5-7 2º Edfis SC Trace Ceter 08173 Sant Cugat del Vallés
(Barcelona), Santibáñez de Béjar 3 local 2 2842 . |
|
Import / export: |
EXPORTS |
|
Future Perspective: |
Product / service
improvement |
|
Industry situation: |
Maturity |
|
Chronological
Summary
|
|||
|
|
Year |
Act |
|
|
|
2005 |
Appointments/ Re-elections (3) Cessations/ Resignations/ Reversals (2)
Change of Social Denomination (1) Change of Social Purpose (1) Change of
Social address (1) Company Formation (1) Declaration of Sole Propietorship
(2) Increase of Capital (2) Loss of the sole propietorship condition (2)
Other Concepts/ Events (3) Statutory Modifications (1) |
|
|
|
2006 |
Appointments/ Re-elections (2) Modification of Powers (1) |
|
|
|
2007 |
Accounts deposit (year 2005, 2006) Appointments/ Re-elections (2)
Cessations/ Resignations/ Reversals (1) |
|
|
|
2008 |
Appointments/ Re-elections (5) Cessations/ Resignations/ Reversals (2)
Change of Social Denomination (1) Change of Social Purpose (1) Declaration of
Sole Propietorship (1) Increase of Capital (1) Loss of the sole propietorship
condition (1) Other Concepts/ Events (2) Statutory Modifications (1)
Take-over Merger (5) |
|
|
|
2009 |
Accounts deposit (year 2007, 2008) Take-over Merger (1) |
|
|
|
2010 |
Accounts deposit (year 2009) Appointments/ Re-elections (5)
Cessations/ Resignations/ Reversals (1) Change of Social address (1) Declaration
of Sole Propietorship (1) Increase of Capital (1) Other Concepts/ Events (1)
Take-over Merger (1) |
|
|
|
2011 |
Appointments/ Re-elections (5) Cessations/ Resignations/ Reversals (3) |
|
|
|
2012 |
Accounts deposit (year 2010, 2011) Appointments/ Re-elections (6)
Cessations/ Resignations/ Reversals (6) |
|
|
|
2013 |
Accounts deposit (year 2012) Appointments/ Re-elections (4) Cessations/
Resignations/ Reversals (4) Change of Social Denomination (1) Change of
Social Purpose (1) Statutory Modifications (1) Take-over Merger (2) |
|
|
|
2014 |
Accounts deposit (year 2013) Appointments/ Re-elections (3) Cessations/
Resignations/ Reversals (1) Change of Social Purpose (1) Declaration of Sole
Propietorship (1) Other Concepts/ Events (1) |
|
|
|
2015 |
Accounts deposit (year 2014) Appointments/ Re-elections (8)
Cessations/ Resignations/ Reversals (4) Take-over Merger (1) |
|
|
|
|
|
|
Main
Historic Changes
|
|||
|
|
|
|
|
|
Concept |
Publication |
Act |
Date |
|
Corporate Purpose Changes: |
FABRICACION, IMPORTACION, EXPORTACION, PUESTA EN MARCHA Y VENTADE ARTÍCULOS
METALURGICOS DE CUALQUIER CLASE, INCLUIDOS CUALESQUIERA INSTRUMENTOS O
EQUIPOS CIENTIFICOS, TALES COMO CABINAS DE FLUJO LAMINAR, ETC |
|
09/10/2008 |
|
|
LA FABRICACION, IMPORT-EXPORT.. PUESTA EN MARCHA Y VENTA DE EQUIPOS DE
VACIO, PRINCIPALMENTE PARA APLICACIONES DE SECADO. Y SUS INSTALACIONES
PERIFERICAS |
Corporate Purpose Change |
15/07/2005 |
|
|
LA REALIZACION DE TODO TIPO DE ESTUDIOS ECONOMICOS. FINANCIEROS Y
COMERCIALES ASI COMO INMOBILIARIOS. INCLUIDOS AQUELLOS RELATIVOS A LA
GESTION, ADMINISTRACION. ADQUISICION, FUSCION DE EMPRESAS, ETC |
Company Formation |
25/04/2005 |
|
Breakdown
of Owners' Equity
|
|
|
Registered Capital: |
6.295.570 |
|
Paid up capital: |
6.295.570 |
|
|
|
|
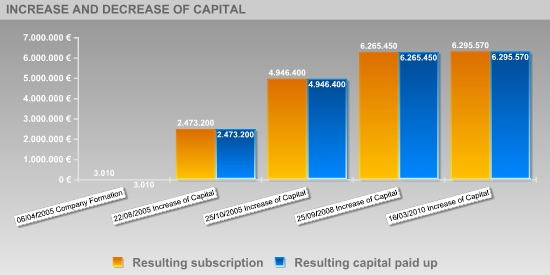
Updated
Evolution of the Subscribed and Paid-in Capital
|
|||||
|
|
|
|
|
|
|
|
|
|||||
|
|
|
|
|
|
|
|
Publishing Date |
Registration Type |
Capital Subscribed |
Paid up capital |
Underwritten result |
Disbursed Result |
|
06/04/2005 |
Company Formation |
3.010 |
3.010 |
3.010 |
3.010 |
|
22/08/2005 |
Increase of Capital |
2.470.190 |
2.470.190 |
2.473.200 |
2.473.200 |
|
25/10/2005 |
Increase of Capital |
2.473.200 |
2.473.200 |
4.946.400 |
4.946.400 |
|
25/09/2008 |
Increase of Capital |
1.319.050 |
1.319.050 |
6.265.450 |
6.265.450 |
|
16/03/2010 |
Increase of Capital |
30.120 |
30.120 |
6.295.570 |
6.295.570 |
|
|
|
|
|
|
|
|
Active
Social Bodies
|
|
Post published |
Social Body's Name |
Appointment Date |
Other Positions in this Company |
|
SINGLE PARTNER |
AZBIL TELSTAR SL |
27/10/2014 |
1 |
|
SINGLE ADMINISTRATOR |
TELSTAR INDUSTRIAS E INVERSIONES SL |
17/05/2013 |
1 |
|
JOINT ATTORNEY |
LOPEZ DIAZ DE RADA SALVADOR |
13/08/2015 |
2 |
|
REPRESENTATIVE |
CAPELLA GALI ANTONI |
17/05/2013 |
4 |
|
ACCOUNTS' AUDITOR / HOLDER |
DELOITTE SL |
13/01/2014 |
1 |
|
|
|
|
|
|
Historical
Social Bodies
|
|
Social Body's Name |
Post published |
End Date |
Other Positions in this Company |
|
ALBERTO VACCHI |
MEMBER OF THE BOARD |
23/04/2008 |
2 |
|
|
PRESIDENT |
23/04/2008 |
|
|
ANGUERA ARMENGOL LAURA |
JOINT MANAGER |
21/06/2005 |
1 |
|
AVILES BARAHONA ENRIQUE |
PROXY |
10/07/2012 |
1 |
|
BES BORDES MARIA DEL PORTAL |
PROXY |
07/12/2010 |
1 |
|
CAPELLA GALI ANTONI |
REPRESENTATIVE |
03/11/2005 |
4 |
|
|
VICE CHAIRMAN |
23/04/2008 |
|
|
|
MEMBER OF THE BOARD |
23/04/2008 |
|
|
CAPELLA GALI ANTONIO |
REPRESENTATIVE |
17/05/2013 |
1 |
|
CAPELLA GALI RAMON |
MEMBER OF THE BOARD |
23/04/2008 |
1 |
|
COSTAS GUAL FERNANDO |
PROXY |
04/02/2013 |
1 |
|
CRUZ PIMENTEL ENRIQUE |
PROXY |
04/04/2011 |
1 |
|
DE BRUGADA MARIEGES CARLES |
MEMBER OF THE BOARD |
23/04/2008 |
1 |
|
DEOGRACIAS HERRERO JUAN MANUEL |
PROXY |
08/11/2011 |
3 |
|
|
PROXY |
04/05/2012 |
|
|
|
PROXY |
04/05/2012 |
|
|
DIAZ RECUERO MARIA CRUZ |
PROXY |
19/08/2011 |
1 |
|
ERNST & YOUNG SL |
ACCOUNTS' AUDITOR / HOLDER |
13/01/2014 |
5 |
|
|
ACCOUNTS' AUDITOR / HOLDER |
19/02/2010 |
|
|
|
ACCOUNTS' AUDITOR / HOLDER |
26/10/2010 |
|
|
|
ACCOUNTS' AUDITOR / HOLDER |
04/05/2012 |
|
|
|
ACCOUNTS' AUDITOR / HOLDER |
28/01/2013 |
|
|
ESCORIHUELA RIBAS SERGI |
PROXY |
16/04/2015 |
2 |
|
|
PROXY |
24/08/2015 |
|
|
ESQUEFA CAYUELA MARIA TERESA |
PROXY |
24/08/2015 |
1 |
|
FRISACH CASTELLA MIGUEL |
PROXY |
18/11/2014 |
1 |
|
GIOVANNI PECCHIOLI |
MEMBER OF THE BOARD |
23/04/2008 |
2 |
|
|
CHIEF EXECUTIVE OFFICER |
23/04/2008 |
|
|
LOPEZ DIAZ DE RADA SALVADOR |
JOINT ATTORNEY |
13/08/2015 |
2 |
|
MERINO TARAFA PERE |
PROXY |
13/12/2013 |
1 |
|
MUÑOZ MARIN MARIA ANGELES |
JOINT ATTORNEY |
16/04/2015 |
3 |
|
|
JOINT ATTORNEY |
13/08/2015 |
|
|
|
JOINT ATTORNEY |
24/08/2015 |
|
|
ORDOÑEZ INDA LUIS JAVIER |
JOINT ATTORNEY |
24/08/2015 |
1 |
|
PABLOS PRUNERA EMILI |
PROXY |
08/04/2015 |
2 |
|
|
PROXY |
24/08/2015 |
|
|
PAUL STEWART |
MEMBER OF THE BOARD |
23/04/2008 |
1 |
|
PEREZ RODRIGUEZ SOFIA |
JOINT MANAGER |
21/06/2005 |
1 |
|
PEÑARRUBIA BERNAL JORGE |
PROXY |
03/02/2012 |
4 |
|
|
PROXY |
03/02/2012 |
|
|
|
PROXY |
26/10/2010 |
|
|
|
PROXY |
19/08/2011 |
|
|
PRICE WATERHOUSE COOPERS AUDITORES SL |
ACCOUNTS' AUDITOR / HOLDER |
15/05/2007 |
1 |
|
PUIG LAVERNIA JORGE |
PROXY |
16/04/2015 |
2 |
|
|
PROXY |
24/08/2015 |
|
|
RIBALTA ABOGADOS SL |
SINGLE PARTNER |
21/06/2005 |
1 |
|
RODRIGUEZ SANCHEZ SUSANA |
NON CONSELLOR SECRETARY |
23/04/2008 |
1 |
|
ROS GARCIA JAIME |
PROXY |
19/08/2011 |
1 |
|
SANCHEZ SOLER JESUS |
JOINT ATTORNEY |
24/08/2015 |
5 |
|
|
JOINT ATTORNEY |
16/04/2015 |
|
|
|
JOINT ATTORNEY |
13/08/2015 |
|
|
|
PROXY |
10/07/2013 |
|
|
|
PROXY |
30/08/2013 |
|
|
SERGIO MARZO |
MEMBER OF THE BOARD |
23/04/2008 |
1 |
|
SERRAT LLADO JORDI |
MEMBER OF THE BOARD |
23/04/2008 |
4 |
|
|
PROXY |
16/04/2015 |
|
|
|
PROXY |
24/08/2015 |
|
|
|
CHIEF EXECUTIVE OFFICER |
24/08/2015 |
|
|
TELSTAR S A |
SINGLE ADMINISTRATOR |
03/11/2005 |
1 |
|
TELSTAR S.A |
SINGLE ADMINISTRATOR |
03/11/2005 |
1 |
|
TELSTAR SA |
SINGLE ADMINISTRATOR |
17/05/2013 |
4 |
|
|
SINGLE PARTNER |
25/10/2005 |
|
|
|
SINGLE PARTNER |
25/09/2008 |
|
|
|
SINGLE PARTNER |
27/10/2014 |
|
Defaults,
Legal Claims and Insolvency Proceedings
|
Section enabling assessment of the degree of compliance of the company queried
with its payment obligations. It provides information on the existence and
nature of all stages of Insolvency and Legal Proceedings published with
reference to the Company in the country's various Official Bulletins and
national newspapers, as well Defaults Registered in the main national credit
bureaus (ASNEF Industrial and RAI ).
>
Summary
Chronological
summary
|
|
|
Number
of Publications |
Amount
(_) |
Start
date |
End
date |
|
Insolvency
Proceedings, Bankruptcy and Suspension of Payments |
|
Unpublished |
--- |
--- |
--- |
|
Request/Declaration |
|
0 |
--- |
date |
|
|
Proceedings |
|
--- |
--- |
|
--- |
|
Resolution |
|
--- |
--- |
|
--- |
|
Defaults
on debt with Financial Institutions and Large Companies |
Bank
and Commercial Delinquency |
None |
0 |
|
|
|
Status:
Friendly |
|
--- |
|
|
|
|
Status:
Pre-Litigation |
|
--- |
|
|
|
|
Status:
Litigation |
|
--- |
|
|
|
|
Status:
Non-performing |
|
--- |
|
|
|
|
Status:
insolvency proceedings, bankruptcy and suspension of payments |
|
--- |
|
|
|
|
Other
status |
|
--- |
|
|
|
|
Legal
and Administrative Proceedings |
|
1 |
--- |
26/05/2015 |
26/05/2015 |
|
Notices
of defaults and enforcement |
|
1 |
--- |
|
--- |
|
Seizures |
|
--- |
--- |
|
--- |
|
Auctions |
|
--- |
--- |
|
--- |
|
Declarations
of insolvency and bad debt |
|
--- |
--- |
|
--- |
|
Proceedings
heard by the Civil Court |
|
Unpublished |
--- |
|
|
|
Proceedings
heard by the Labour Court |
|
Unpublished |
--- |
|
|
> Details
>
Basis for scoring
|
Positive Factors |
Adverse Factors |
|
No irregular payment performance has been detected based on
information obtained from credit bureaus. It is one of the major domestic companies in terms of sales volume. Adequate level of financial autonomy. The financial autonomy of the entity
represents the 29.54 %. In principle, an increase in this ratio would
indicate an improvement in the corporate's balace sheets. AZBIL TELSTAR TECHNOLOGIES SL 's borrowing cost is appropriate
according to its volume of external financing sources. The development of the structure of the debt during the last two years
indicates a decrease of the debt with credit institutions and trade creditors
in respect to all liabilities. The lower the level of debt, the lower the
dependence on suppliers capital and the more guarantee will have its
financial situation. |
It has no return from its main operating activity.This might
deteriorate its financial situation. Moreover, this productivity has
decreased in comparison with the previous financial year. It presents an inefficient resources management. Resources and
variable costs management associated with the activity itself are not
productive, since operating expenses exceed income. Reduced level of liquidity. The company shows not enough capacity to
meet its obligations with a maturity of less than one year with the available
liquid assets. Solvency decrease. Its capacity to bear the cost derived form debts
incurred with third parties has decreased significantly in its last fiscal
year. There is a reduction on the sales turnoverso the Company´s results may
be affected. |
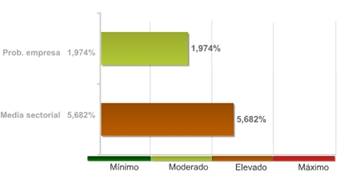
Probability
of default
|
> Estimated Probability
of Default for the next 12 months: 1.974 %
|
Sector
in which comparison is carried out: 282 Manufacture
of other general-purpose machinery |
|
|
Relative
Position:
|
The
company's comparative analysis with the rest of the companies that comprise the
sector, shows the company holds a better position with regard to the
probability of non-compliance.
The
71.00% of the companies of the sector AZBIL TELSTAR TECHNOLOGIES SL belongs to
show a higher probability of non-compliance.
The
probability of the company's non-compliance with its payment obligations within
deadlines estimated by our qualifications models is 1.974%.
In
the event they fail to comply with the payment, the seriousness of the loss
will depend on factors such as the promptness of the commencement of the
charging management, the existence of executive documents which match the
credit or the existence of guarantees and free debt assets under the name of
the debtor. Therefore, the probability of non-compliance should not be solely
interpreted as the total loss of the owed amount.
Recommended
commercial credit
|
Favourable until 780.000 € (Guideline value
of outstanding commercial balance that recommends be awarded to or maintained
with the company queried)
LEGAL CLAIMS
|
|
Summary
of Judicial Claims |
|
|
|
|
|
|
|
|
||
|
|
|
No
se han publicado |
|
|
|
|
No
se han publicado |
|
|
|
|
||
|
|
|
No
se han publicado |
|
|
|
|
No
se han publicado |
|
|
|
|
No
se han publicado |
|
|
|
|
|
|
|
|
|
||
|
|
|
No
se han publicado |
|
|
|
|
No
se han publicado |
|
|
|
|
||
|
|
|
No
se han publicado |
|
|
Incidences
Detailed |
|
Incidences
with the Local Administration |
|
|
|
Last
Published Stage: |
INFRINGEMENT
|
|
Record
Number: |
1400000429 |
|
Amount
of the incidence: |
0,00
E |
|
Requested
by: |
ADMINISTRACION
LOCAL |
|
Published
domicile: |
VILADECANS
(BARCELONA) |
|
Source: |
B.O.E.
Nº156, 2015 SUPLEMENTO 1 PAGINA 5615 |
Link
List
|
|
ABSORBS TO: |
5 Entities |
|
HAS IN ITS ADMINISTRATION
BOARD TO: |
1 Entities |
|
IS RELATED WITH: |
8 Entities |
|
PARTICIPATES IN: |
2 Entities |
|
SHAREHOLDERS: |
1 Entities |
|
RESULT OF THE PARTIAL
SPIN-OFF OF: |
1 Entities |
> Shareholders
|
Relationship |
Entity |
Province |
Shareholding stake |
|
SHAREHOLDERS |
AZBIL TELSTAR SL |
BARCELONA |
100 |
|
PARTICIPATES IN |
TELSTAR FAR EAST CO, S.A. |
|
100 |
|
|
TELSTAR INDUSTRIAL USA INC |
|
100 |
> Other relationships
|
Relationship |
Entity |
Province |
Shareholding stake |
|
IS RELATED WITH |
| | |
|
|
|
|
AZBIL CORPORATION |
|
|
|
|
AZBIL SINGAPORE, S.A. |
|
|
|
|
AZBIL TELSTAR ARGENTINA,
S.A. |
|
|
|
|
AZBIL TELSTAR UK, S.A. |
|
|
|
|
SOCIEDADE DE SERVICOS DE ENGENHARIA
A INDUSTRIA FARMACEUTICA LTDA |
|
|
|
|
SVS PORTUGAL SOCIEDADE DE
SERVICOS DE ENGENHARIA A INDUSTRIA FARMACEUTICA LTDA |
|
|
|
|
TELSTAR FAR EAST COMPANY,
S.A. |
|
|
|
|
AZBIL TELSTAR BRASIL
CONSULTORIA LTDA |
|
|
|
ABSORBS TO |
CELESTER TECHNOLOGIES SL |
BARCELONA |
|
|
|
TELSTAR INDUSTRIAL SL |
BARCELONA |
|
|
|
TELSTAR TECNOLOGIA
MECANICA SL |
BARCELONA |
|
|
|
TELSTAR INSTRUMAT SL |
BARCELONA |
|
|
|
AZBIL TELSTAR PROJECTS SA |
BARCELONA |
|
|
RESULT OF THE PARTIAL
SPIN-OFF OF |
TELSTAR INDUSTRIAL SL |
BARCELONA |
|
|
HAS IN ITS ADMINISTRATION
BOARD TO |
TELSTAR INDUSTRIAS E
INVERSIONES SL |
BARCELONA |
|
|
|
|
|
|
|
Turnover
|
|
|
Total Sales |
48.537.333,77 |
The sales data is from the
latest available financial statements in axesor. Failing that, are estimates
data calculated by statistical methods.
Financial
Accounts and Balance Sheets
|
|
Ejercicio |
Tipo
de Cuentas Anuales |
Fecha
Presentacion |
|
2014 |
Normales |
August
2015 |
|
2013 |
Normales |
August
2014 |
|
2012 |
Normales |
May
2013 |
|
2011 |
Normales |
August
2012 |
|
2010 |
Normales |
May
2012 |
|
2009 |
Normales |
September
2010 |
|
2008 |
Normales |
July
2009 |
|
2007 |
Normales |
July
2009 |
|
2006 |
Normales |
June
2007 |
|
2005 |
Normales |
March
2007 |
The data in the report
regarding the last Company Accounts submitted by the company is taken from the TRADE
REGISTER serving the region in which the company's address is located
31/12/2014
> Normal format Balance in accordance with the New
Accounting Plan 2007
Information corresponding
to the fiscal year 2014 2013 2012 2011 2010 is taken
from information submitted to the TRADE REGISTER. Data corresponding to fiscal
years before 2014 2013 2012 2011 2010 has been
compiled based on the equivalence criteria stipulated in Act JUS/206/2009.
Where the provisions of the Act did not establish relevant equivalence
criteria, such criteria using its own methodology. To view details on the
methodology.
|
|
ORIGINAL |
ORIGINAL |
ORIGINAL |
ORIGINAL |
ORIGINAL |
|
|
Assets |
2014 |
2013 |
2012 |
2011 |
2010 |
|
|
A)
NON-CURRENT ASSETS: 11000 |
11.786.544,00 |
12.696.106,00 |
12.252.984,00 |
10.387.802,00 |
8.814.140,00 |
|
|
I. Intangible fixed assets : 11100 |
4.613.613,00 |
5.177.338,00 |
5.070.451,00 |
4.333.188,00 |
3.270.148,00 |
|
|
1. Development: 11110 |
3.636.491,00 |
3.887.893,00 |
3.859.648,00 |
4.078.952,00 |
3.171.114,00 |
|
|
2. Concessions: 11120 |
0,00 |
0,00 |
0,00 |
0,00 |
0,00 |
|
|
3. Patents, licencing, trade marks and
similar: 11130 |
61.920,00 |
69.756,00 |
159.645,00 |
80.324,00 |
93.915,00 |
|
|
4. Goodwill: 11140 |
50.344,00 |
62.930,00 |
0,00 |
0,00 |
0,00 |
|
|
5. IT applications: 11150 |
864.857,00 |
1.156.758,00 |
1.051.158,00 |
173.912,00 |
5.119,00 |
|
|
6. Investigation: 11160 |
0,00 |
0,00 |
0,00 |
0,00 |
0,00 |
|
|
7. Intellectual property: 11180 |
0,00 |
0,00 |
0,00 |
0,00 |
0,00 |
|
|
8. Greenhouse gas emission allowance:
11190 |
0,00 |
0,00 |
0,00 |
0,00 |
0,00 |
|
|
9. Other intangible fixed assets. :
11170 |
0,00 |
0,00 |
0,00 |
0,00 |
0,00 |
|
|
II. Tangible fixed assets : 11200 |
3.540.657,00 |
3.637.905,00 |
3.772.572,00 |
3.567.476,00 |
3.172.198,00 |
|
|
1. Land and buildings: 11210 |
0,00 |
498.212,00 |
0,00 |
0,00 |
0,00 |
|
|
2. Technical installations and other
tangible fixed assets: 11220 |
3.540.657,00 |
3.139.693,00 |
3.772.572,00 |
3.567.476,00 |
3.014.145,00 |
|
|
3. Tangible asset in progress and
advances: 11230 |
0,00 |
0,00 |
0,00 |
0,00 |
158.053,00 |
|
|
III. Real estate investment: 11300 |
0,00 |
0,00 |
0,00 |
0,00 |
0,00 |
|
|
1. Land: 11310 |
0,00 |
0,00 |
0,00 |
0,00 |
0,00 |
|
|
2. Buildings: 11320 |
0,00 |
0,00 |
0,00 |
0,00 |
0,00 |
|
|
IV. Long-term investments in Group companies and associates :
11400 |
0,00 |
0,00 |
800,00 |
800,00 |
800,00 |
|
|
1. Equity instruments: 11410 |
0,00 |
0,00 |
800,00 |
800,00 |
800,00 |
|
|
2. Credits to businesses: 11420 |
0,00 |
0,00 |
0,00 |
0,00 |
0,00 |
|
|
3. Debt securities: 11430 |
0,00 |
0,00 |
0,00 |
0,00 |
0,00 |
|
|
4. Derivatives : 11440 |
0,00 |
0,00 |
0,00 |
0,00 |
0,00 |
|
|
5. Other financial assets : 11450 |
0,00 |
0,00 |
0,00 |
0,00 |
0,00 |
|
|
6. Other investments: 11460 |
0,00 |
0,00 |
0,00 |
0,00 |
0,00 |
|
|
V. Long-term financial investments: 11500 |
155.923,00 |
33.668,00 |
37.845,00 |
29.460,00 |
69.068,00 |
|
|
1. Equity instruments: 11510 |
0,00 |
0,00 |
0,00 |
0,00 |
0,00 |
|
|
2. Credits to third parties : 11520 |
0,00 |
4.500,00 |
0,00 |
0,00 |
0,00 |
|
|
3. Debt securities: 11530 |
0,00 |
0,00 |
0,00 |
0,00 |
0,00 |
|
|
4. Derivatives : 11540 |
0,00 |
0,00 |
0,00 |
0,00 |
0,00 |
|
|
5. Other financial assets : 11550 |
155.923,00 |
29.168,00 |
37.845,00 |
29.460,00 |
69.068,00 |
|
|
6. Other investments: 11560 |
0,00 |
0,00 |
0,00 |
0,00 |
0,00 |
|
|
VI. Assets for deferred tax : 11600 |
3.476.352,00 |
3.847.196,00 |
3.371.316,00 |
2.456.878,00 |
2.301.926,00 |
|
|
VII. Non-current trade debts : 11700 |
0,00 |
0,00 |
0,00 |
0,00 |
0,00 |
|
|
B)
CURRENT ASSETS: 12000 |
30.354.782,00 |
36.329.761,00 |
32.994.247,00 |
29.757.673,00 |
32.470.293,00 |
|
|
I. Non-current assets held for sale : 12100 |
0,00 |
0,00 |
0,00 |
0,00 |
0,00 |
|
|
II. Stocks: 12200 |
7.608.606,00 |
7.238.627,00 |
5.982.478,00 |
8.666.157,00 |
6.858.362,00 |
|
|
1. Commercial: 12210 |
17.262,00 |
5.647,00 |
8.023,00 |
5.370,00 |
0,00 |
|
|
2. Primary material and other supplies:
12220 |
1.670.591,00 |
2.221.912,00 |
2.169.318,00 |
2.851.662,00 |
2.011.821,00 |
|
|
3. Work in progress: 12230 |
4.078.862,00 |
2.796.141,00 |
2.034.086,00 |
1.619.849,00 |
2.029.354,00 |
|
|
a) Of long-term
production cycle : 12231 |
0,00 |
0,00 |
0,00 |
0,00 |
0,00 |
|
|
b) Of short-term
production cycle : 12232 |
4.078.862,00 |
2.796.141,00 |
2.034.086,00 |
1.619.849,00 |
2.029.354,00 |
|
|
4. Finished goods: 12240 |
869.850,00 |
1.303.570,00 |
1.260.637,00 |
2.032.043,00 |
1.600.286,00 |
|
|
a) Of long-term
production cycle : 12241 |
0,00 |
0,00 |
0,00 |
0,00 |
0,00 |
|
|
b) Of short-term
production cycle : 12242 |
869.850,00 |
1.303.570,00 |
1.260.637,00 |
2.032.043,00 |
1.600.286,00 |
|
|
5. By-products, residues and recycled
materials: 12250 |
0,00 |
0,00 |
0,00 |
0,00 |
0,00 |
|
|
6. Advances to suppliers: 12260 |
972.040,00 |
911.357,00 |
510.414,00 |
2.157.233,00 |
1.216.901,00 |
|
|
III. Trade debtors and others receivable accounts: 12300 |
19.095.009,00 |
22.048.128,00 |
21.491.889,00 |
15.191.414,00 |
12.542.146,00 |
|
|
1. Trade debtors / accounts receivable:
12310 |
15.570.064,00 |
15.029.756,00 |
11.743.085,00 |
10.905.299,00 |
9.807.022,00 |
|
|
a) Long-term
receivables from sales and services supplied : 12311 |
0,00 |
0,00 |
0,00 |
0,00 |
0,00 |
|
|
b) Customers for
sales and provisions of services : 12312 |
15.570.064,00 |
15.029.756,00 |
11.743.085,00 |
10.905.299,00 |
9.807.022,00 |
|
|
2. Customers, Group companies and
associates : 12320 |
3.109.328,00 |
5.529.890,00 |
9.206.817,00 |
2.871.638,00 |
2.258.174,00 |
|
|
3. Other accounts receivable: 12330 |
33.406,00 |
39.841,00 |
344.905,00 |
893.387,00 |
300.000,00 |
|
|
4. Personnel: 12340 |
15.880,00 |
6.872,00 |
-497,00 |
54.803,00 |
82.007,00 |
|
|
5. Assets for deferred tax: 12350 |
366.331,00 |
1.441.768,00 |
0,00 |
0,00 |
0,00 |
|
|
6. Other debtors, including tax and social
security: 12360 |
0,00 |
0,00 |
197.579,00 |
466.287,00 |
94.943,00 |
|
|
7. Called up share capital: 12370 |
0,00 |
0,00 |
0,00 |
0,00 |
0,00 |
|
|
IV. Short-term investments in Group companies and associates:
12400 |
2.655.293,00 |
6.591.651,00 |
4.884.570,00 |
5.070.349,00 |
12.916.935,00 |
|
|
1. Equity instruments: 12410 |
0,00 |
0,00 |
0,00 |
0,00 |
0,00 |
|
|
2. Credits to businesses: 12420 |
2.655.293,00 |
0,00 |
4.884.570,00 |
5.070.349,00 |
12.916.935,00 |
|
|
3. Debt securities: 12430 |
0,00 |
0,00 |
0,00 |
0,00 |
0,00 |
|
|
4. Derivatives : 12440 |
0,00 |
0,00 |
0,00 |
0,00 |
0,00 |
|
|
5. Other financial assets : 12450 |
0,00 |
6.591.651,00 |
0,00 |
0,00 |
0,00 |
|
|
6. Other investments: 12460 |
0,00 |
0,00 |
0,00 |
0,00 |
0,00 |
|
|
V. Short-term financial investments : 12500 |
0,00 |
5.825,00 |
1.505,00 |
505,00 |
21.582,00 |
|
|
1. Equity instruments: 12510 |
0,00 |
0,00 |
0,00 |
0,00 |
0,00 |
|
|
2. Credits to businesses: 12520 |
0,00 |
0,00 |
0,00 |
0,00 |
0,00 |
|
|
3. Debt securities: 12530 |
0,00 |
0,00 |
0,00 |
0,00 |
0,00 |
|
|
4. Derivatives : 12540 |
0,00 |
0,00 |
0,00 |
0,00 |
0,00 |
|
|
5. Other financial assets : 12550 |
0,00 |
5.825,00 |
1.505,00 |
505,00 |
21.582,00 |
|
|
6. Other investments: 12560 |
0,00 |
0,00 |
0,00 |
0,00 |
0,00 |
|
|
VI. Short-term accruals: 12600 |
137.085,00 |
34.276,00 |
27.676,00 |
127.420,00 |
0,00 |
|
|
VII. Cash and other equivalent liquid assets : 12700 |
858.790,00 |
411.254,00 |
606.129,00 |
701.828,00 |
131.268,00 |
|
|
1. Treasury: 12710 |
858.790,00 |
411.254,00 |
606.129,00 |
701.828,00 |
131.268,00 |
|
|
2. Other equivalent liquid assets:
12720 |
0,00 |
0,00 |
0,00 |
0,00 |
0,00 |
|
|
TOTAL
ASSETS (A + B) : 10000 |
42.141.326,00 |
49.025.867,00 |
45.247.231,00 |
40.145.475,00 |
41.284.433,00 |
|
|
|
ORIGINAL |
ORIGINAL |
ORIGINAL |
ORIGINAL |
ORIGINAL |
|
|
Liabilities
and Net Worth |
2014 |
2013 |
2012 |
2011 |
2010 |
|
|
A)
NET WORTH: 20000 |
12.584.324,00 |
16.765.425,00 |
15.707.721,00 |
16.114.447,00 |
16.922.069,00 |
|
|
A-1) Shareholders' equity: 21000 |
12.446.817,00 |
16.524.552,00 |
15.418.101,00 |
16.004.258,00 |
16.781.828,00 |
|
|
I. Capital: 21100 |
6.295.570,00 |
6.295.570,00 |
6.295.570,00 |
6.265.450,00 |
6.265.450,00 |
|
|
1. Registered capital : 21110 |
6.295.570,00 |
6.295.570,00 |
6.295.570,00 |
6.265.450,00 |
6.265.450,00 |
|
|
2. (Uncalled capital): 21120 |
0,00 |
0,00 |
0,00 |
0,00 |
0,00 |
|
|
II. Share premium: 21200 |
8.637.228,00 |
8.637.228,00 |
8.637.228,00 |
8.637.228,00 |
8.637.228,00 |
|
|
III. Reserves: 21300 |
4.553.361,00 |
4.477.236,00 |
4.132.036,00 |
4.293.279,00 |
4.993.279,00 |
|
|
1. Legal and statutory: 21310 |
308.805,00 |
232.680,00 |
232.680,00 |
232.680,00 |
232.680,00 |
|
|
2. Other reserves: 21320 |
4.244.556,00 |
4.244.556,00 |
3.899.356,00 |
4.060.599,00 |
4.760.599,00 |
|
|
3. Revaluation reserves: 21330 |
0,00 |
0,00 |
0,00 |
0,00 |
0,00 |
|
|
IV. (Common stock equity): 21400 |
0,00 |
0,00 |
0,00 |
0,00 |
0,00 |
|
|
V. Results from previous periods: 21500 |
-2.961.607,00 |
-3.646.733,00 |
-3.191.669,00 |
-3.114.129,00 |
-2.000.277,00 |
|
|
1. Brought forward: 21510 |
0,00 |
0,00 |
0,00 |
0,00 |
0,00 |
|
|
2. (Negative results from previous
periods): 21520 |
-2.961.607,00 |
-3.646.733,00 |
-3.191.669,00 |
-3.114.129,00 |
-2.000.277,00 |
|
|
VI. Other shareholders' contributions: 21600 |
0,00 |
0,00 |
0,00 |
0,00 |
0,00 |
|
|
VII. Result of the period: 21700 |
-4.077.735,00 |
761.251,00 |
-455.064,00 |
-77.570,00 |
-1.113.852,00 |
|
|
VIII. (Interim dividend): 21800 |
0,00 |
0,00 |
0,00 |
0,00 |
0,00 |
|
|
IX. Other net worth instruments: 21900 |
0,00 |
0,00 |
0,00 |
0,00 |
0,00 |
|
|
A-2) Adjustments due to changes in value: 22000 |
0,00 |
0,00 |
0,00 |
0,00 |
0,00 |
|
|
I. Financial assets held for sale: 22100 |
0,00 |
0,00 |
0,00 |
0,00 |
0,00 |
|
|
II. Hedge operations: 22200 |
0,00 |
0,00 |
0,00 |
0,00 |
0,00 |
|
|
III. Linked non-current assets and liabilities held for sale :
22300 |
0,00 |
0,00 |
0,00 |
0,00 |
0,00 |
|
|
IV. Exchange rate difference: 22400 |
0,00 |
0,00 |
0,00 |
0,00 |
0,00 |
|
|
V. Other: 22500 |
0,00 |
0,00 |
0,00 |
0,00 |
0,00 |
|
|
A-3) Received subsidies, donations and legacies: 23000 |
137.507,00 |
240.874,00 |
289.620,00 |
110.189,00 |
140.241,00 |
|
|
B)
NON-CURRENT LIABILITIES: 31000 |
2.218.902,00 |
2.986.486,00 |
3.683.648,00 |
3.179.659,00 |
4.231.321,00 |
|
|
I. Long-term provisions: 31100 |
233.050,00 |
277.786,00 |
208.548,00 |
225.168,00 |
295.825,00 |
|
|
1. Long-term employee benefits liability:
31110 |
0,00 |
0,00 |
0,00 |
0,00 |
0,00 |
|
|
2. Environmental actions: 31120 |
0,00 |
0,00 |
0,00 |
0,00 |
0,00 |
|
|
3. Restructuring provisions: 31130 |
0,00 |
0,00 |
0,00 |
0,00 |
0,00 |
|
|
4. Other provisions: 31140 |
233.050,00 |
277.786,00 |
208.548,00 |
225.168,00 |
295.825,00 |
|
|
II Long-term creditors: 31200 |
1.926.920,00 |
2.605.468,00 |
3.368.185,00 |
2.878.371,00 |
3.846.498,00 |
|
|
1. Liabilities and other securities:
31210 |
0,00 |
0,00 |
0,00 |
0,00 |
0,00 |
|
|
2. Amounts owed to credit institutions:
31220 |
1.926.920,00 |
2.605.468,00 |
3.368.185,00 |
2.878.371,00 |
3.846.498,00 |
|
|
3. Creditors from financial leasing:
31230 |
0,00 |
0,00 |
0,00 |
0,00 |
0,00 |
|
|
4. Derivatives : 31240 |
0,00 |
0,00 |
0,00 |
0,00 |
0,00 |
|
|
5. Other financial liabilities :
31250 |
0,00 |
0,00 |
0,00 |
0,00 |
0,00 |
|
|
III. Long-term debts with Group companies and associates:
31300 |
0,00 |
0,00 |
0,00 |
0,00 |
0,00 |
|
|
IV. Liabilities for deferred tax: 31400 |
58.932,00 |
103.232,00 |
106.915,00 |
76.120,00 |
88.998,00 |
|
|
V. Long-term accruals: 31500 |
0,00 |
0,00 |
0,00 |
0,00 |
0,00 |
|
|
VI. Non-current trade creditors : 31600 |
0,00 |
0,00 |
0,00 |
0,00 |
0,00 |
|
|
VII. Special long-term debts : 31700 |
0,00 |
0,00 |
0,00 |
0,00 |
0,00 |
|
|
C)
CURRENT LIABILITIES : 32000 |
27.338.100,00 |
29.273.956,00 |
25.855.862,00 |
20.851.369,00 |
20.131.043,00 |
|
|
I. Liabilities linked to non-current assets held for sale:
32100 |
0,00 |
0,00 |
0,00 |
0,00 |
0,00 |
|
|
II. Short-term provisions: 32200 |
0,00 |
0,00 |
0,00 |
0,00 |
0,00 |
|
|
1. Provisions from greenhouse gas emission
allowance: 32210 |
0,00 |
0,00 |
0,00 |
0,00 |
0,00 |
|
|
2. Other provisions: 32220 |
0,00 |
0,00 |
0,00 |
0,00 |
0,00 |
|
|
III. Short-term creditors : 32300 |
5.549.585,00 |
5.863.284,00 |
3.476.200,00 |
2.556.896,00 |
5.606.793,00 |
|
|
1. Liabilities and other securities:
32310 |
0,00 |
0,00 |
0,00 |
0,00 |
0,00 |
|
|
2. Amounts owed to credit institutions:
32320 |
5.494.181,00 |
5.863.284,00 |
3.476.200,00 |
2.556.896,00 |
5.606.793,00 |
|
|
3. Creditors from financial leasing:
32330 |
0,00 |
0,00 |
0,00 |
0,00 |
0,00 |
|
|
4. Derivatives : 32340 |
0,00 |
0,00 |
0,00 |
0,00 |
0,00 |
|
|
5. Other financial liabilities :
32350 |
55.404,00 |
0,00 |
0,00 |
0,00 |
0,00 |
|
|
IV. Short-term debts with Group companies and associates: 32400 |
2.439.303,00 |
1.949.174,00 |
443.028,00 |
0,00 |
0,00 |
|
|
V. Trade creditors and other accounts payable: 32500 |
19.349.212,00 |
21.447.249,00 |
21.936.634,00 |
18.294.473,00 |
14.524.250,00 |
|
|
1. Suppliers: 32510 |
8.180.812,00 |
9.498.313,00 |
8.342.139,00 |
10.799.691,00 |
8.268.499,00 |
|
|
a) Long-term debts :
32511 |
0,00 |
0,00 |
0,00 |
0,00 |
0,00 |
|
|
b) Short-term debts :
32512 |
8.180.812,00 |
9.498.313,00 |
8.342.139,00 |
10.799.691,00 |
8.268.499,00 |
|
|
2. Suppliers, Group companies and
associates: 32520 |
3.515.816,00 |
5.471.082,00 |
5.376.022,00 |
3.758.049,00 |
1.575.275,00 |
|
|
3. Other creditors: 32530 |
1.985.801,00 |
1.695.278,00 |
2.219.132,00 |
2.486.414,00 |
1.177.173,00 |
|
|
4. Personnel (remuneration due):
32540 |
1.040.521,00 |
387.170,00 |
441.140,00 |
499.873,00 |
609.777,00 |
|
|
5. Liabilities for current tax:
32550 |
0,00 |
0,00 |
0,00 |
0,00 |
0,00 |
|
|
6. Other accounts payable to Public
Administrations.: 32560 |
855.162,00 |
1.623.631,00 |
1.787.986,00 |
1.035.393,00 |
404.085,00 |
|
|
7. Advances from clients: 32570 |
3.771.099,00 |
2.771.776,00 |
3.770.215,00 |
-284.947,00 |
2.489.441,00 |
|
|
VI. Short-term accruals: 32600 |
0,00 |
14.250,00 |
0,00 |
0,00 |
0,00 |
|
|
VII. Special short-term debts : 32700 |
0,00 |
0,00 |
0,00 |
0,00 |
0,00 |
|
|
TOTAL
NET WORTH AND LIABILITIES (A + B + C) : 30000 |
42.141.326,00 |
49.025.867,00 |
45.247.231,00 |
40.145.475,00 |
41.284.433,00 |
|
|
|
ORIGINAL |
ORIGINAL |
ORIGINAL |
ORIGINAL |
ORIGINAL |
|
|
Profit
and Loss |
2014 |
2013 |
2012 |
2011 |
2010 |
|
|
1.
Net turnover: 40100 |
48.537.334,00 |
59.280.792,00 |
45.382.797,00 |
46.767.355,00 |
30.709.186,00 |
|
|
a) Sales: 40110 |
40.879.631,00 |
49.792.609,00 |
45.382.797,00 |
46.767.355,00 |
30.709.186,00 |
|
|
b) Rendering of services: 40120 |
7.657.703,00 |
9.488.182,00 |
0,00 |
0,00 |
0,00 |
|
|
c) Income of financial nature of holding companies: 40130 |
0,00 |
0,00 |
0,00 |
0,00 |
0,00 |
|
|
2.
Changes in stocks of finished goods and work in progress: 40200 |
849.001,00 |
-806.056,00 |
-1.270.716,00 |
1.029.150,00 |
-1.175.781,00 |
|
|
3.
Works carried out by the company for its assets: 40300 |
1.439.324,00 |
1.590.103,00 |
1.221.522,00 |
1.658.832,00 |
842.286,00 |
|
|
4.
Supplies : 40400 |
-25.512.794,00 |
-29.973.822,00 |
-20.715.119,00 |
-25.842.185,00 |
-15.324.406,00 |
|
|
a) Stock consumption: 40410 |
-20.316.402,00 |
0,00 |
0,00 |
0,00 |
0,00 |
|
|
b) Consumption of raw materials and miscellaneous consumable
ones: 40420 |
0,00 |
-22.394.837,00 |
-15.308.266,00 |
-19.222.603,00 |
-14.181.630,00 |
|
|
c) Works carried out by other companies: 40430 |
-4.958.984,00 |
-7.542.063,00 |
-5.813.586,00 |
-6.642.414,00 |
-1.254.501,00 |
|
|
d) Impairment of stock, primary material and other supplies:
40440 |
-237.408,00 |
-36.921,00 |
406.733,00 |
22.832,00 |
111.725,00 |
|
|
5.
Other operating income: 40500 |
345.237,00 |
470.296,00 |
330.675,00 |
1.088.378,00 |
1.294.493,00 |
|
|
a) Auxiliary income and other from current management:
40510 |
315.238,00 |
413.430,00 |
182.528,00 |
819.999,00 |
1.271.964,00 |
|
|
b) Operation subsidies included in the Period's
result: 40520 |
29.999,00 |
56.866,00 |
148.147,00 |
268.379,00 |
22.529,00 |
|
|
6.
Personnel costs: 40600 |
-17.397.164,00 |
-16.689.724,00 |
-15.247.186,00 |
-14.840.118,00 |
-9.678.967,00 |
|
|
a) Wages, salaries et al.: 40610 |
-13.415.060,00 |
-12.819.833,00 |
-11.720.761,00 |
-11.450.554,00 |
-7.405.906,00 |
|
|
b) Social security costs: 40620 |
-3.982.104,00 |
-3.869.891,00 |
-3.526.425,00 |
-3.389.564,00 |
-2.273.061,00 |
|
|
c) Provisions : 40630 |
0,00 |
0,00 |
0,00 |
0,00 |
0,00 |
|
|
7.
Other operating costs: 40700 |
-9.542.240,00 |
-10.868.665,00 |
-8.904.995,00 |
-8.693.375,00 |
-7.109.792,00 |
|
|
a) External services: 40710 |
-9.352.757,00 |
-10.785.127,00 |
-9.169.025,00 |
-8.601.699,00 |
-6.772.188,00 |
|
|
b) Taxes: 40720 |
-98.725,00 |
-56.377,00 |
-43.583,00 |
-42.055,00 |
-29.451,00 |
|
|
c) Losses, impairments and variation in provisions from trade
operations : 40730 |
-89.353,00 |
-27.161,00 |
6.917,00 |
-49.621,00 |
-308.153,00 |
|
|
d) Other current management expenditure : 40740 |
-1.405,00 |
0,00 |
300.696,00 |
0,00 |
0,00 |
|
|
e) Expenses due to greenhouse gas emissions: 40750 |
0,00 |
0,00 |
0,00 |
0,00 |
0,00 |
|
|
8.
Amortisation of fixed assets: 40800 |
-2.092.178,00 |
-1.868.318,00 |
-1.602.102,00 |
-1.194.362,00 |
-1.136.438,00 |
|
|
9.
Allocation of subsidies of non-financial fixed assets and other: 40900 |
147.667,00 |
159.286,00 |
0,00 |
42.931,00 |
169.583,00 |
|
|
10.
Excess provisions : 41000 |
0,00 |
0,00 |
0,00 |
0,00 |
0,00 |
|
|
11.
Impairment and result of transfers of fixed assets: 41100 |
-12.586,00 |
2.260,00 |
161.712,00 |
-63.065,00 |
-181.369,00 |
|
|
a) Impairment and losses : 41110 |
0,00 |
0,00 |
0,00 |
0,00 |
0,00 |
|
|
b) Results for transfers and other : 41120 |
-12.586,00 |
2.260,00 |
161.712,00 |
-63.065,00 |
-181.369,00 |
|
|
c) Impairment and profit due to disposals of assets of holding
companies: 41130 |
0,00 |
0,00 |
0,00 |
0,00 |
0,00 |
|
|
12.
Negative difference in combined businesses: 41200 |
0,00 |
0,00 |
0,00 |
0,00 |
0,00 |
|
|
13.
Other results : 41300 |
0,00 |
-30.414,00 |
0,00 |
0,00 |
0,00 |
|
|
A.1)
OPERATING INCOME (1 + 2 + 3 + 4 + 5 + 6 + 7 + 8 + 9 + 10 + 11 + 12 + 13) :
49100 |
-3.238.399,00 |
1.265.738,00 |
-643.412,00 |
-46.459,00 |
-1.591.205,00 |
|
|
14.
Financial income : 41400 |
61.031,00 |
49.237,00 |
43.350,00 |
246.507,00 |
115.304,00 |
|
|
a) Of shares in equity instruments : 41410 |
0,00 |
0,00 |
0,00 |
0,00 |
0,00 |
|
|
a 1) In Group companies and associates:
41411 |
0,00 |
0,00 |
0,00 |
0,00 |
0,00 |
|
|
a 2) In third parties: 41412 |
0,00 |
0,00 |
0,00 |
0,00 |
0,00 |
|
|
b) From negotiable securities and other financial instruments :
41420 |
61.031,00 |
49.237,00 |
43.350,00 |
246.507,00 |
115.304,00 |
|
|
b 1) From Group companies and associates :
41421 |
58.778,00 |
18.188,00 |
40.366,00 |
242.988,00 |
103.801,00 |
|
|
b 2) From third parties : 41422 |
2.253,00 |
31.049,00 |
2.984,00 |
3.519,00 |
11.503,00 |
|
|
c) Allocation of financial subsidies, donations and legacies :
41430 |
0,00 |
0,00 |
0,00 |
0,00 |
0,00 |
|
|
15.
Financial expenditure: 41500 |
-408.990,00 |
-401.504,00 |
-336.935,00 |
-429.384,00 |
-327.857,00 |
|
|
a) Amounts owed to Group companies and associates : 41510 |
0,00 |
-401.504,00 |
0,00 |
0,00 |
0,00 |
|
|
b) For debts with third parties : 41520 |
-408.990,00 |
0,00 |
-336.935,00 |
-429.384,00 |
-327.857,00 |
|
|
c) Stock renewal : 41530 |
0,00 |
0,00 |
0,00 |
0,00 |
0,00 |
|
|
16.
Changes in fair value of financial instruments : 41600 |
0,00 |
0,00 |
0,00 |
0,00 |
0,00 |
|
|
a) Trading book and other : 41610 |
0,00 |
0,00 |
0,00 |
0,00 |
0,00 |
|
|
b) Allocation of financial assets held for sale to the result
for the period: 41620 |
0,00 |
0,00 |
0,00 |
0,00 |
0,00 |
|
|
17.
Exchange rate differences : 41700 |
-91.796,00 |
-27.249,00 |
-11.924,00 |
-7.335,00 |
3.304,00 |
|
|
18.
Impairment and result for transfers of financial instruments: 41800 |
0,00 |
0,00 |
0,00 |
0,00 |
0,00 |
|
|
a) Impairment and losses : 41810 |
0,00 |
0,00 |
0,00 |
0,00 |
0,00 |
|
|
b) Results for transfers and other : 41820 |
0,00 |
0,00 |
0,00 |
0,00 |
0,00 |
|
|
19.
Other financial income and expenditure: 42100 |
0,00 |
0,00 |
0,00 |
0,00 |
0,00 |
|
|
a) Incorporation of financial expenditure to assets:
42110 |
0,00 |
0,00 |
0,00 |
0,00 |
0,00 |
|
|
b) Financial income from arrangement with creditors:
42120 |
0,00 |
0,00 |
0,00 |
0,00 |
0,00 |
|
|
c) Other income and expenditure: 42130 |
0,00 |
0,00 |
0,00 |
0,00 |
0,00 |
|
|
A.2)
FINANCIAL REVENUE (14+15+16+17+18+19) : 49200 |
-439.755,00 |
-379.517,00 |
-305.509,00 |
-190.212,00 |
-209.249,00 |
|
|
A.3)
NET RESULT BEFORE TAXES (A.1+A.2) : 49300 |
-3.678.154,00 |
886.221,00 |
-948.921,00 |
-236.671,00 |
-1.800.454,00 |
|
|
20.
Income taxes: 41900 |
-399.581,00 |
-124.970,00 |
493.857,00 |
159.101,00 |
686.602,00 |
|
|
A.4)
PROFIT AFTER TAXES (A.3+20) : 49400 |
-4.077.735,00 |
761.251,00 |
-455.064,00 |
-77.570,00 |
-1.113.852,00 |
|
|
21.
Result of the year coming from interrupted operations : 42000 |
0,00 |
0,00 |
0,00 |
0,00 |
0,00 |
|
|
A.5)
RESULT OF THE PERIOD (A.4+21) : 49500 |
-4.077.735,00 |
761.251,00 |
-455.064,00 |
-77.570,00 |
-1.113.852,00 |
|
> Normal Balance Sheet under the rules of the 1990 General Accounting
Plan (repealed since 1st January of 2008)
Information corresponding
to the fiscal year 2014 2013 2012 2011 2010 has been
compiled based on the equivalence criteria stipulated in Act JUS/206/2009.
Where the provisions of the Act did not establish relevant equivalence
criteria, Axesor created such criteria using its own methodology. To view
details on the methodology 2014 2013 2012 2011 2010
is taken from information submitted to the TRADE REGISTER.
|
|
EQUIVALENCIA |
EQUIVALENCIA |
EQUIVALENCIA |
EQUIVALENCIA |
EQUIVALENCIA |
|
|
ASSETS |
2014 |
2013 |
2012 |
2011 |
2010 |
|
|
A)
SHAREHOLDERS (PARTNERS) BY UNCALLED SUSCRIBED CAPITAL: |
0,00 |
0,00 |
0,00 |
0,00 |
0,00 |
|
|
B)
FIXED ASSETS: |
8.310.193,00 |
8.848.910,00 |
8.881.668,00 |
7.930.924,00 |
6.512.214,00 |
|
|
I. Formation expenses: |
0,00 |
0,00 |
0,00 |
0,00 |
0,00 |
|
|
II. Intangible fixed assets: |
4.613.613,00 |
5.177.338,00 |
5.070.451,00 |
4.333.188,00 |
3.270.148,00 |
|
|
1. Research and development costs: |
3.636.491,00 |
3.887.893,00 |
3.859.648,00 |
4.078.952,00 |
3.171.114,00 |
|
|
2. Concessions, patents, licences, trademarks
et al.: |
61.920,00 |
69.756,00 |
159.645,00 |
80.324,00 |
93.915,00 |
|
|
3. Goodwill: |
50.344,00 |
62.930,00 |
0,00 |
0,00 |
0,00 |
|
|
4. Key money paid for premises: |
0,00 |
0,00 |
0,00 |
0,00 |
0,00 |
|
|
5. Software: |
864.857,00 |
1.156.758,00 |
1.051.158,00 |
173.912,00 |
5.119,00 |
|
|
6. Assets under capital leases: |
0,00 |
0,00 |
0,00 |
0,00 |
0,00 |
|
|
7. Payments on account: |
0,00 |
0,00 |
0,00 |
0,00 |
0,00 |
|
|
8. Provisions: |
0,00 |
0,00 |
0,00 |
0,00 |
0,00 |
|
|
9. Accumulated depreciation: |
0,00 |
0,00 |
0,00 |
0,00 |
0,00 |
|
|
III. Tangible fixed assets: |
3.540.657,00 |
3.637.905,00 |
3.772.572,00 |
3.567.476,00 |
3.172.198,00 |
|
|
1. Land and construction: |
0,00 |
498.212,00 |
0,00 |
0,00 |
0,00 |
|
|
2. Technical installations and machinery:
|
3.540.657,00 |
3.139.693,00 |
3.772.572,00 |
3.567.476,00 |
3.014.145,00 |
|
|
3. Other installations, tools and
furniture: |
0,00 |
0,00 |
0,00 |
0,00 |
0,00 |
|
|
4. Payments on account and tangible fixed
assets under construction: |
0,00 |
0,00 |
0,00 |
0,00 |
158.053,00 |
|
|
5. Other tangible assets: |
0,00 |
0,00 |
0,00 |
0,00 |
0,00 |
|
|
6. Provisions: |
0,00 |
0,00 |
0,00 |
0,00 |
0,00 |
|
|
7. Accumulated depreciation: |
0,00 |
0,00 |
0,00 |
0,00 |
0,00 |
|
|
IV. Financial investments: |
155.923,00 |
33.668,00 |
38.645,00 |
30.260,00 |
69.868,00 |
|
|
1. Equity investments in group companies:
|
0,00 |
0,00 |
800,00 |
800,00 |
800,00 |
|
|
2. Receivables from group companies:
|
0,00 |
0,00 |
0,00 |
0,00 |
0,00 |
|
|
3. Equity investment in associated
companies: |
0,00 |
0,00 |
0,00 |
0,00 |
0,00 |
|
|
4. Credits to associated companies: |
0,00 |
0,00 |
0,00 |
0,00 |
0,00 |
|
|
5. Long-term securities portfolio: |
0,00 |
0,00 |
0,00 |
0,00 |
0,00 |
|
|
6. Other receivables: |
0,00 |
4.500,00 |
0,00 |
0,00 |
0,00 |
|
|
7. Long term guarantees and deposits:
|
155.923,00 |
29.168,00 |
37.845,00 |
29.460,00 |
69.068,00 |
|
|
8. Provisions: |
0,00 |
0,00 |
0,00 |
0,00 |
0,00 |
|
|
9. Long-term receivables from public
bodies: |
0,00 |
0,00 |
0,00 |
0,00 |
0,00 |
|
|
V. Own shares: |
0,00 |
0,00 |
0,00 |
0,00 |
0,00 |
|
|
VI. Long-term trade receivables: |
0,00 |
0,00 |
0,00 |
0,00 |
0,00 |
|
|
C)
Deferred expenses: |
0,00 |
0,00 |
0,00 |
0,00 |
0,00 |
|
|
D)
CURRENT ASSETS: |
33.831.134,00 |
40.176.957,00 |
36.365.563,00 |
32.214.551,00 |
34.772.219,00 |
|
|
I. Called-up share capital (not paid): |
0,00 |
0,00 |
0,00 |
0,00 |
0,00 |
|
|
II. Stocks: |
7.608.606,00 |
7.238.627,00 |
5.982.478,00 |
8.666.157,00 |
6.858.362,00 |
|
|
1. Goods for resale: |
17.262,00 |
5.647,00 |
8.023,00 |
5.370,00 |
0,00 |
|
|
2. Raw materials and other consumables:
|
1.670.591,00 |
2.221.912,00 |
2.169.318,00 |
2.851.662,00 |
2.011.821,00 |
|
|
3. Goods in process and semifinished ones:
|
4.078.862,00 |
2.796.141,00 |
2.034.086,00 |
1.619.849,00 |
2.029.354,00 |
|
|
4. Finished products: |
869.850,00 |
1.303.570,00 |
1.260.637,00 |
2.032.043,00 |
1.600.286,00 |
|
|
5. Byproducts, scrap and recovered
materials: |
0,00 |
0,00 |
0,00 |
0,00 |
0,00 |
|
|
6. Payments on account: |
972.040,00 |
911.357,00 |
510.414,00 |
2.157.233,00 |
1.216.901,00 |
|
|
7. Provisions: |
0,00 |
0,00 |
0,00 |
0,00 |
0,00 |
|
|
III. Debtors: |
22.571.360,00 |
25.895.324,00 |
24.863.205,00 |
17.648.292,00 |
14.844.072,00 |
|
|
1. Trade debtors / accounts receivable:
|
15.570.064,00 |
15.029.756,00 |
11.743.085,00 |
10.905.299,00 |
9.807.022,00 |
|
|
2. Accounts receivable, Group companies: |
3.109.328,00 |
5.529.890,00 |
9.206.817,00 |
2.871.638,00 |
2.258.174,00 |
|
|
3. Accounts receivable, associated
companies: |
0,00 |
0,00 |
0,00 |
0,00 |
0,00 |
|
|
4. Other debtors: |
33.406,00 |
39.841,00 |
344.905,00 |
893.387,00 |
300.000,00 |
|
|
5. Staff: |
15.880,00 |
6.872,00 |
-497,00 |
54.803,00 |
82.007,00 |
|
|
6. Public bodies: |
3.842.683,00 |
5.288.964,00 |
3.568.895,00 |
2.923.165,00 |
2.396.869,00 |
|
|
7. Provisions: |
0,00 |
0,00 |
0,00 |
0,00 |
0,00 |
|
|
IV. Short-term investments: |
2.655.293,00 |
6.597.476,00 |
4.886.075,00 |
5.070.854,00 |
12.938.517,00 |
|
|
1. Equity investments in group companies:
|
0,00 |
0,00 |
0,00 |
0,00 |
0,00 |
|
|
2. Receivables from group companies:
|
2.655.293,00 |
0,00 |
4.884.570,00 |
5.070.349,00 |
12.916.935,00 |
|
|
3. Equity investment in associated
companies: |
0,00 |
0,00 |
0,00 |
0,00 |
0,00 |
|
|
4. Credits to associated companies: |
0,00 |
0,00 |
0,00 |
0,00 |
0,00 |
|
|
5. Short term securities portfolio: |
0,00 |
0,00 |
0,00 |
0,00 |
0,00 |
|
|
6. Other receivables: |
0,00 |
6.591.651,00 |
0,00 |
0,00 |
0,00 |
|
|
7. Shor term guarantees and deposits:
|
0,00 |
5.825,00 |
1.505,00 |
505,00 |
21.582,00 |
|
|
8. Provisions: |
0,00 |
0,00 |
0,00 |
0,00 |
0,00 |
|
|
V. Short-term treasury shares: |
0,00 |
0,00 |
0,00 |
0,00 |
0,00 |
|
|
VI. Cash at bank and in hand: |
858.790,00 |
411.254,00 |
606.129,00 |
701.828,00 |
131.268,00 |
|
|
VII. Prepayments and accrued income: |
137.085,00 |
34.276,00 |
27.676,00 |
127.420,00 |
0,00 |
|
|
GENERAL
TOTAL (A + B + C + D): |
42.141.326,00 |
49.025.867,00 |
45.247.231,00 |
40.145.475,00 |
41.284.433,00 |
|
MERCANTILE REGISTRY.
|
|
EQUIVALENCIA |
EQUIVALENCIA |
EQUIVALENCIA |
EQUIVALENCIA |
EQUIVALENCIA |
|
|
LIABILITIES |
2014 |
2013 |
2012 |
2011 |
2010 |
|
|
A)
EQUITY: |
12.488.069,00 |
16.596.814,00 |
15.504.987,00 |
16.037.315,00 |
16.823.900,00 |
|
|
I. Subscribed capital: |
6.295.570,00 |
6.295.570,00 |
6.295.570,00 |
6.265.450,00 |
6.265.450,00 |
|
|
II. Share premium: |
8.637.228,00 |
8.637.228,00 |
8.637.228,00 |
8.637.228,00 |
8.637.228,00 |
|
|
III. Revaluation reserves: |
0,00 |
0,00 |
0,00 |
0,00 |
0,00 |
|
|
IV. Reserves: |
4.594.613,00 |
4.549.498,00 |
4.218.922,00 |
4.326.336,00 |
5.035.351,00 |
|
|
1. Legal reserve: |
308.805,00 |
232.680,00 |
232.680,00 |
232.680,00 |
232.680,00 |
|
|
2. Reserves for own shares: |
0,00 |
0,00 |
0,00 |
0,00 |
0,00 |
|
|
3. Reserves for shares of the controlling
company: |
0,00 |
0,00 |
0,00 |
0,00 |
0,00 |
|
|
4. Statutory reserves: |
0,00 |
0,00 |
0,00 |
0,00 |
0,00 |
|
|
5. Miscellaneous reserves: |
4.285.808,00 |
4.316.818,00 |
3.986.242,00 |
4.093.656,00 |
4.802.671,00 |
|
|
Differences due to capital adjustement to
euros: |
0,00 |
0,00 |
0,00 |
0,00 |
0,00 |
|
|
V. Profit or loss brought forward: |
-2.961.607,00 |
-3.646.733,00 |
-3.191.669,00 |
-3.114.129,00 |
-2.000.277,00 |
|
|
1. Retained earnings: |
0,00 |
0,00 |
0,00 |
0,00 |
0,00 |
|
|
2. Prior year losses: |
-2.961.607,00 |
-3.646.733,00 |
-3.191.669,00 |
-3.114.129,00 |
-2.000.277,00 |
|
|
3. Partners' contributions so as to
compensate losses: |
0,00 |
0,00 |
0,00 |
0,00 |
0,00 |
|
|
VI. Profit or loss for the financial year: |
-4.077.735,00 |
761.251,00 |
-455.064,00 |
-77.570,00 |
-1.113.852,00 |
|
|
VII. Interim dividend paid: |
0,00 |
0,00 |
0,00 |
0,00 |
0,00 |
|
|
VIII. Own shares for capital reduction: |
0,00 |
0,00 |
0,00 |
0,00 |
0,00 |
|
|
B)
Deferred income: |
96.255,00 |
168.611,00 |
202.734,00 |
77.132,00 |
98.169,00 |
|
|
1. Capital grants: |
96.255,00 |
168.611,00 |
202.734,00 |
77.132,00 |
98.169,00 |
|
|
2. Unrealised exchange gains: |
0,00 |
0,00 |
0,00 |
0,00 |
0,00 |
|
|
3. Other deferred income: |
0,00 |
0,00 |
0,00 |
0,00 |
0,00 |
|
|
4. Public revenues to distribute in
several financial years: |
0,00 |
0,00 |
0,00 |
0,00 |
0,00 |
|
|
C)
PROVISIONS FOR LIABILITIES AND CHARGES: |
233.050,00 |
277.786,00 |
208.548,00 |
225.168,00 |
295.825,00 |
|
|
1. Provisions for pension fund and other
similar obligations: |
0,00 |
0,00 |
0,00 |
0,00 |
0,00 |
|
|
2. Provisions for taxes: |
0,00 |
0,00 |
0,00 |
0,00 |
0,00 |
|
|
3. Other provisions: |
233.050,00 |
277.786,00 |
208.548,00 |
225.168,00 |
295.825,00 |
|
|
4. Reversion fund: |
0,00 |
0,00 |
0,00 |
0,00 |
0,00 |
|
|
D)
LONG TERM LIABILITIES: |
1.985.852,00 |
2.708.700,00 |
3.475.100,00 |
2.954.491,00 |
3.935.496,00 |
|
|
I. Issued debentures and other marketable securities: |
0,00 |
0,00 |
0,00 |
0,00 |
0,00 |
|
|
1. Non-convertible debentures: |
0,00 |
0,00 |
0,00 |
0,00 |
0,00 |
|
|
2. Convertible debentures: |
0,00 |
0,00 |
0,00 |
0,00 |
0,00 |
|
|
3. Other debt securities: |
0,00 |
0,00 |
0,00 |
0,00 |
0,00 |
|
|
II. Amounts owed to credit institutions: |
1.926.920,00 |
2.605.468,00 |
3.368.185,00 |
2.878.371,00 |
3.846.498,00 |
|
|
1. Loans and other liabilities: |
1.926.920,00 |
2.605.468,00 |
3.368.185,00 |
2.878.371,00 |
3.846.498,00 |
|
|
2. Long-term liabilities from capital
leases: |
0,00 |
0,00 |
0,00 |
0,00 |
0,00 |
|
|
III. Debts with companies of the group and affiliated ones:
|
0,00 |
0,00 |
0,00 |
0,00 |
0,00 |
|
|
1. Amounts owed to group companies: |
0,00 |
0,00 |
0,00 |
0,00 |
0,00 |
|
|
2. Amounts owed to associated companies:
|
0,00 |
0,00 |
0,00 |
0,00 |
0,00 |
|
|
IV. Other creditors: |
58.932,00 |
103.232,00 |
106.915,00 |
76.120,00 |
88.998,00 |
|
|
1. Long-term bills of exchange payable:
|
0,00 |
0,00 |
0,00 |
0,00 |
0,00 |
|
|
2. Other creditors: |
0,00 |
0,00 |
0,00 |
0,00 |
0,00 |
|
|
3. Long term guarantees and deposits
received: |
0,00 |
0,00 |
0,00 |
0,00 |
0,00 |
|
|
4. Long term payables to public bodies:
|
58.932,00 |
103.232,00 |
106.915,00 |
76.120,00 |
88.998,00 |
|
|
V. Unpaid portion of equity investment: |
0,00 |
0,00 |
0,00 |
0,00 |
0,00 |
|
|
1. Group companies: |
0,00 |
0,00 |
0,00 |
0,00 |
0,00 |
|
|
2. Associated companies: |
0,00 |
0,00 |
0,00 |
0,00 |
0,00 |
|
|
3. Third parties: |
0,00 |
0,00 |
0,00 |
0,00 |
0,00 |
|
|
VI. Long term trade creditors: |
0,00 |
0,00 |
0,00 |
0,00 |
0,00 |
|
|
E)
SHORT TERM CREDITORS: |
27.338.100,00 |
29.273.956,00 |
25.855.862,00 |
20.851.369,00 |
20.131.043,00 |
|
|
I. Issued debentures and other marketable securities: |
0,00 |
0,00 |
0,00 |
0,00 |
0,00 |
|
|
1. Non-convertible debentures: |
0,00 |
0,00 |
0,00 |
0,00 |
0,00 |
|
|
2. Convertible debentures: |
0,00 |
0,00 |
0,00 |
0,00 |
0,00 |
|
|
3. Other debt securities: |
0,00 |
0,00 |
0,00 |
0,00 |
0,00 |
|
|
4. Accrued interest on debentures and
other debt securities: |
0,00 |
0,00 |
0,00 |
0,00 |
0,00 |
|
|
II. Amounts owed to credit institutions: |
5.494.181,00 |
5.863.284,00 |
3.476.200,00 |
2.556.896,00 |
5.606.793,00 |
|
|
1. Loans and other liabilities: |
5.494.181,00 |
5.863.284,00 |
3.476.200,00 |
2.556.896,00 |
5.606.793,00 |
|
|
2. Accrued interest on liabilities with
credit institutions: |
0,00 |
0,00 |
0,00 |
0,00 |
0,00 |
|
|
3. Short-term liabilities from capital
leases: |
0,00 |
0,00 |
0,00 |
0,00 |
0,00 |
|
|
III. Short-term amounts owed to group and associated companies:
|
5.955.119,00 |
7.420.256,00 |
5.819.050,00 |
3.758.049,00 |
1.575.275,00 |
|
|
1. Amounts owed to group companies: |
5.955.119,00 |
7.420.256,00 |
5.819.050,00 |
3.758.049,00 |
1.575.275,00 |
|
|
2. Amounts owed to associated companies:
|
0,00 |
0,00 |
0,00 |
0,00 |
0,00 |
|
|
IV. Trade creditors: |
13.937.712,00 |
13.965.367,00 |
14.331.486,00 |
13.001.158,00 |
11.935.113,00 |
|
|
1. Advanced payments from customers:
|
3.771.099,00 |
2.771.776,00 |
3.770.215,00 |
-284.947,00 |
2.489.441,00 |
|
|
2. Amounts owed for purchases of goods or
services: |
10.166.613,00 |
11.193.591,00 |
10.561.271,00 |
13.286.105,00 |
9.445.672,00 |
|
|
3. Debts represented by notes payable:
|
0,00 |
0,00 |
0,00 |
0,00 |
0,00 |
|
|
V. Other creditors: |
1.951.088,00 |
2.010.800,00 |
2.229.126,00 |
1.535.266,00 |
1.013.862,00 |
|
|
1. Public bodies: |
855.162,00 |
1.623.631,00 |
1.787.986,00 |
1.035.393,00 |
404.085,00 |
|
|
2. Bills of exchange payable: |
0,00 |
0,00 |
0,00 |
0,00 |
0,00 |
|
|
3. Miscellaneous debts: |
55.404,00 |
0,00 |
0,00 |
0,00 |
0,00 |
|
|
4. Wages and salaries payable: |
1.040.521,00 |
387.170,00 |
441.140,00 |
499.873,00 |
609.777,00 |
|
|
5. Guarantees and deposits received at
short term: |
0,00 |
0,00 |
0,00 |
0,00 |
0,00 |
|
|
VI. Provisions: |
0,00 |
0,00 |
0,00 |
0,00 |
0,00 |
|
|
VII. Prepayments and accrued income: |
0,00 |
14.250,00 |
0,00 |
0,00 |
0,00 |
|
|
F)
SHORT-TERM PROVISIONS FOR LIABILITIES AND CHARGES: |
0,00 |
0,00 |
0,00 |
0,00 |
0,00 |
|
|
GENERAL
TOTAL (A + B + C + D + E + F): |
42.141.326,00 |
49.025.867,00 |
45.247.231,00 |
40.145.475,00 |
41.284.433,00 |
|
MERCANTILE REGISTRY.
|
|
EQUIVALENCIA |
EQUIVALENCIA |
EQUIVALENCIA |
EQUIVALENCIA |
EQUIVALENCIA |
|
|
DEBIT |
2014 |
2013 |
2012 |
2011 |
2010 |
|
|
A)
CHARGES (A.1 to A.15): |
55.457.328,00 |
60.790.722,00 |
47.595.120,00 |
50.910.723,00 |
34.248.008,00 |
|
|
A.1. Stock reduction of both manufactured
goods and the ones in process: |
0,00 |
806.056,00 |
1.270.716,00 |
0,00 |
1.175.781,00 |
|
|
A.2. Supplies: |
25.275.386,00 |
29.936.900,00 |
21.121.852,00 |
25.865.017,00 |
15.436.131,00 |
|
|
a) Stock consumption:
|
20.316.402,00 |
0,00 |
0,00 |
0,00 |
0,00 |
|
|
b) Consumption of raw
materials and miscellaneous consumable ones: |
0,00 |
22.394.837,00 |
15.308.266,00 |
19.222.603,00 |
14.181.630,00 |
|
|
c) Miscellaneous
external expenditure: |
4.958.984,00 |
7.542.063,00 |
5.813.586,00 |
6.642.414,00 |
1.254.501,00 |
|
|
A.3. Staff costs: |
17.397.164,00 |
16.689.724,00 |
15.247.186,00 |
14.840.118,00 |
9.678.967,00 |
|
|
a) Wages, salaries et
al.: |
13.415.060,00 |
12.819.833,00 |
11.720.761,00 |
11.450.554,00 |
7.405.906,00 |
|
|
b) Social security
costs: |
3.982.104,00 |
3.869.891,00 |
3.526.425,00 |
3.389.564,00 |
2.273.061,00 |
|
|
A.4. Depreciation expense: |
2.092.178,00 |
1.868.318,00 |
1.602.102,00 |
1.194.362,00 |
1.136.438,00 |
|
|
A.5. Variation of trade provisions and
losses of unrecovered receivables: |
326.761,00 |
64.083,00 |
-413.650,00 |
26.789,00 |
196.428,00 |
|
|
a) Stock provision
variation: |
237.408,00 |
36.921,00 |
-406.733,00 |
-22.832,00 |
-111.725,00 |
|
|
b) Variation in
provision and bad debt losses: |
0,00 |
0,00 |
0,00 |
0,00 |
0,00 |
|
|
c) Variation of other
trade provisions: |
89.353,00 |
27.161,00 |
-6.917,00 |
49.621,00 |
308.153,00 |
|
|
A.6. Other operating charges: |
9.452.887,00 |
10.841.504,00 |
8.911.912,00 |
8.643.754,00 |
6.801.639,00 |
|
|
a) External services:
|
9.352.757,00 |
10.785.127,00 |
9.169.025,00 |
8.601.699,00 |
6.772.188,00 |
|
|
b) Taxes: |
98.725,00 |
56.377,00 |
43.583,00 |
42.055,00 |
29.451,00 |
|
|
c) Other operating
expenses: |
1.405,00 |
0,00 |
-300.696,00 |
0,00 |
0,00 |
|
|
d) Allocation to
revision fund: |
0,00 |
0,00 |
0,00 |
0,00 |
0,00 |
|
|
A.I. OPERATING BENEFITS (B.1+B.2+B.3+B.4-A.1-A.2-A.3-A.4-A.5-A.6):
|
0,00 |
1.134.606,00 |
0,00 |
0,00 |
0,00 |
|
|
A.7. Financial and similar charges: |
408.990,00 |
401.504,00 |
336.935,00 |
429.384,00 |
327.857,00 |
|
|
a) Due to liabilities
with companies of the group: |
0,00 |
401.504,00 |
0,00 |
0,00 |
0,00 |
|
|
b) Due to liabilities
with associated companies: |
0,00 |
0,00 |
0,00 |
0,00 |
0,00 |
|
|
c) Due to other debts.:
|
408.990,00 |
0,00 |
336.935,00 |
429.384,00 |
327.857,00 |
|
|
d) Losses from
financial investments: |
0,00 |
0,00 |
0,00 |
0,00 |
0,00 |
|
|
A.8. Changes in financial investment
provisions: |
0,00 |
0,00 |
0,00 |
0,00 |
0,00 |
|
|
A.9. Exchange losses: |
91.796,00 |
27.249,00 |
11.924,00 |
7.335,00 |
0,00 |
|
|
A.II. NET FINANCIAL INCOME (B.5+B.6+B.7+B.8-A.7-A.8-A.9):
|
0,00 |
0,00 |
0,00 |
0,00 |
0,00 |
|
|
A.III. PROFIT FROM ORDINARY ACTIVITIES (A.I+A.II-B.I-B.II):
|
0,00 |
755.090,00 |
0,00 |
0,00 |
0,00 |
|
|
A.10. Changes in provisions for
intangible, tangible and securities portfolio: |
0,00 |
0,00 |
0,00 |
0,00 |
0,00 |
|
|
A.11. Losses from tangible and intangible
fixed assets and securities portfolio: |
12.586,00 |
0,00 |
0,00 |
63.065,00 |
181.369,00 |
|
|
A.12. Losses from transactions with own
shares and debentures: |
0,00 |
0,00 |
0,00 |
0,00 |
0,00 |
|
|
A.13. Extraordinary expenses: |
0,00 |
30.414,00 |
0,00 |
0,00 |
0,00 |
|
|
A.14. Expenses and losses of former
financial years: |
0,00 |
0,00 |
0,00 |
0,00 |
0,00 |
|
|
A.IV. EXTRAORDINARY PROFIT
(B.9+B.10+B.11+B.12+B.13-A.10-A.11-A.12-A.13-A.14): |
135.081,00 |
131.132,00 |
161.712,00 |
0,00 |
0,00 |
|
|
A.V. PROFIT BEFORE TAXES (A.III+A.IV-B.III-B.IV): |
0,00 |
886.221,00 |
0,00 |
0,00 |
0,00 |
|
|
A.15. Corporation tax: |
399.581,00 |
124.970,00 |
-493.857,00 |
-159.101,00 |
-686.602,00 |
|
|
A.16. Miscellaneous taxes: |
0,00 |
0,00 |
0,00 |
0,00 |
0,00 |
|
|
A.VI. FINANCIAL YEAR RESULTS (PROFIT) (A.V-A.15-A.16): |
0,00 |
761.251,00 |
0,00 |
0,00 |
0,00 |
|
MERCANTILE REGISTRY.
|
|
EQUIVALENCIA |
EQUIVALENCIA |
EQUIVALENCIA |
EQUIVALENCIA |
EQUIVALENCIA |
|
|
CREDIT |
2014 |
2013 |
2012 |
2011 |
2010 |
|
|
B)
INCOME ( B.1 to B.13): |
51.379.593,00 |
61.551.973,00 |
47.140.056,00 |
50.833.153,00 |
33.134.156,00 |
|
|
B.1. Net total sales: |
48.537.334,00 |
59.280.792,00 |
45.382.797,00 |
46.767.355,00 |
30.709.186,00 |
|
|
a) Sales: |
40.879.631,00 |
49.792.609,00 |
45.382.797,00 |
46.767.355,00 |
30.709.186,00 |
|
|
b) Rendering of
services: |
7.657.703,00 |
9.488.182,00 |
0,00 |
0,00 |
0,00 |
|
|
Returns and Rappel on
sales: |
0,00 |
0,00 |
0,00 |
0,00 |
0,00 |
|
|
B.2. Stock increase of manufactured goods
and products in process: |
849.001,00 |
0,00 |
0,00 |
1.029.150,00 |
0,00 |
|
|
B.3. Works performed by the company for
fixed assets: |
1.439.324,00 |
1.590.103,00 |
1.221.522,00 |
1.658.832,00 |
842.286,00 |
|
|
B.4. Miscellaneous operating income:
|
345.237,00 |
470.296,00 |
330.675,00 |
1.088.378,00 |
1.294.493,00 |
|
|
a) Auxiliary income
and other from current management: |
315.238,00 |
413.430,00 |
182.528,00 |
819.999,00 |
1.271.964,00 |
|
|
b) Grants: |
29.999,00 |
56.866,00 |
148.147,00 |
268.379,00 |
22.529,00 |
|
|
c) Liabilities and
charges provisions surplus: |
0,00 |
0,00 |
0,00 |
0,00 |
0,00 |
|
|
B.I. PÉRDIDAS DE EXPLOTACIÓN
(A.1+A.2+A.3+A.4+A.5-A.6-B.1-B.2-B.3-B.4): |
3.373.480,00 |
0,00 |
805.124,00 |
26.325,00 |
1.579.419,00 |
|
|
B.5. Income from equity investment: |
0,00 |
0,00 |
0,00 |
0,00 |
0,00 |
|
|
a) In companies of
the group: |
0,00 |
0,00 |
0,00 |
0,00 |
0,00 |
|
|
b) In associated
companies: |
0,00 |
0,00 |
0,00 |
0,00 |
0,00 |
|
|
c) Third parties:
|
0,00 |
0,00 |
0,00 |
0,00 |
0,00 |
|
|
B.6. Income from other marketable
securities and long-term receivables: |
0,00 |
0,00 |
0,00 |
0,00 |
0,00 |
|
|
a) From companies of
the group: |
0,00 |
0,00 |
0,00 |
0,00 |
0,00 |
|
|
b) From associated
companies: |
0,00 |
0,00 |
0,00 |
0,00 |
0,00 |
|
|
c) From companies out
of the group: |
0,00 |
0,00 |
0,00 |
0,00 |
0,00 |
|
|
B.7. Miscellaneous interests or similar
income: |
61.031,00 |
49.237,00 |
43.350,00 |
246.507,00 |
115.304,00 |
|
|
a) From companies of
the group: |
58.778,00 |
18.188,00 |
40.366,00 |
242.988,00 |
103.801,00 |
|
|
b) From associated
companies: |
0,00 |
0,00 |
0,00 |
0,00 |
0,00 |
|
|
c) Miscellaneous
interests: |
2.253,00 |
31.049,00 |
2.984,00 |
3.519,00 |
11.503,00 |
|
|
d) Profit on
financial investment: |
0,00 |
0,00 |
0,00 |
0,00 |
0,00 |
|
|
B.8. Exchange positive differences: |
0,00 |
0,00 |
0,00 |
0,00 |
3.304,00 |
|
|
B.II. NEGATIVE FINANCIAL RESULTS (A.7+A.8+A.9-B.5-B.6-B.7-B.8):
|
439.755,00 |
379.517,00 |
305.509,00 |
190.212,00 |
209.249,00 |
|
|
B.III. LOSSES ON ORDINARY ACTIVITIES ( B.I + B.II - A.I - A.II
): |
3.813.235,00 |
0,00 |
1.110.633,00 |
216.537,00 |
1.788.668,00 |
|
|
B.9.Profit on disposal of both tangible
and intangible fixed assets and securities portfolio: |
0,00 |
2.260,00 |
161.712,00 |
0,00 |
0,00 |
|
|
B.10. Profit on transactions with own
shares and debentures: |
0,00 |
0,00 |
0,00 |
0,00 |
0,00 |
|
|
B.11. Capital grants transferred to profit
and loss: |
147.667,00 |
159.286,00 |
0,00 |
42.931,00 |
169.583,00 |
|
|
B.12. Extraordinary income: |
0,00 |
0,00 |
0,00 |
0,00 |
0,00 |
|
|
B.13. Income and profit of former
financial years: |
0,00 |
0,00 |
0,00 |
0,00 |
0,00 |
|
|
B.IV. NEGATIVE EXTRAORDINARY RESULTS (A.10+A.11+A.12+A.13+A.14-B.9-B.10-B.11-B.12-B.13):
|
0,00 |
0,00 |
0,00 |
20.134,00 |
11.786,00 |
|
|
B.V. LOSSES BEFORE TAXES (B.III+B.IV-A.III-A.IV): |
3.678.154,00 |
0,00 |
948.921,00 |
236.671,00 |
1.800.454,00 |
|
|
B.VI. RESULT OF THE PERIOD (LOSSES) (B.V+A.15+A.16): |
4.077.735,00 |
0,00 |
455.064,00 |
77.570,00 |
1.113.852,00 |
|
MERCANTILE REGISTRY.
|
CASHFLOW
STATEMENT
|
Model: Normal
>
Source of information: Data contained in this section is taken from the information
declared in the Annual Accounts submitted to the Trade Register.
|
|
2014 |
2013 |
2012 |
2011 |
2010 |
|
|
1.
Fiscal year result before taxes.: 61100 |
-3.678.154,00 |
886.221,00 |
-948.921,00 |
-236.671,00 |
-1.800.454,00 |
|
|
2.
Results adjustments.: 61200 |
1.100.696,00 |
447.909,00 |
1.177.638,00 |
1.353.507,00 |
1.541.683,00 |
|
|
a) Fixed Assets Amortization (+).: 61201 |
2.092.178,00 |
1.869.384,00 |
1.602.102,00 |
1.194.362,00 |
1.136.438,00 |
|
|
b) Obsolescence Allowances (+/-). : 61202 |
339.347,00 |
5.156,00 |
-413.650,00 |
0,00 |
0,00 |
|
|
c) Variation in Provision (+/-). : 61203 |
0,00 |
0,00 |
0,00 |
-43.866,00 |
180.906,00 |
|
|
d) Allocation of grants (-).: 61204 |
-147.667,00 |
-159.286,00 |
-142.687,00 |
-42.931,00 |
-169.583,00 |
|
|
e) Results on disposal of fixed assets (+/-). : 61205 |
0,00 |
-2.260,00 |
-161.712,00 |
63.065,00 |
181.369,00 |
|
|
f) Results on disposal of financial instruments (+/-).:
61206 |
-61.031,00 |
-49.237,00 |
0,00 |
0,00 |
0,00 |
|
|
g) Financial income (-).: 61207 |
0,00 |
0,00 |
-43.350,00 |
-246.507,00 |
-115.304,00 |
|
|
h) Financial Expenses (+). : 61208 |
408.990,00 |
401.504,00 |
336.935,00 |
429.384,00 |
327.857,00 |
|
|
i) Exchange differences (+/-). : 61209 |
-91.786,00 |
-27.249,00 |
0,00 |
0,00 |
0,00 |
|
|
k) Other income and expense (-/+). : 61211 |
0,00 |
-1.590.103,00 |
0,00 |
0,00 |
0,00 |
|
|
3.
Changes in current capital equity.: 61300 |
87.663,00 |
-2.383.811,00 |
-706.737,00 |
-712.099,00 |
4.576.162,00 |
|
|
a) Stock (+/-).: 61301 |
-607.386,00 |
-1.293.072,00 |
2.683.679,00 |
-1.807.795,00 |
1.465.824,00 |
|
|
d) Debtors and other accounts receivable (+/-). : 61302 |
2.983.614,00 |
-583.400,00 |
-6.300.475,00 |
-2.649.267,00 |
-1.246.629,00 |
|
|
c) Other current assets (+/-). : 61303 |
-102.809,00 |
-10.920,00 |
-1.000,00 |
21.076,00 |
46.432,00 |
|
|
d) Creditors and other accounts payable (+/-). : 61304 |
-2.126.770,00 |
-496.419,00 |
3.642.161,00 |
3.966.651,00 |
4.274.081,00 |
|
|
e) Other current liabilities (+/-).: 61305 |
-14.250,00 |
0,00 |
0,00 |
0,00 |
0,00 |
|
|
f) Other non-current assets and liabilities (+/-).: 61306 |
-44.736,00 |
0,00 |
-731.102,00 |
-242.764,00 |
36.454,00 |
|
|
4.
Other cash flows for operating activities.: 61400 |
-347.959,00 |
-352.267,00 |
200.272,00 |
-182.877,00 |
-212.553,00 |
|
|
a) Interest payments (-). : 61401 |
-408.990,00 |
-401.504,00 |
-336.935,00 |
-429.384,00 |
-327.857,00 |
|
|
c) Interest collection (+). : 61403 |
61.031,00 |
49.237,00 |
43.350,00 |
246.507,00 |
115.304,00 |
|
|
d) Income tax payment collection (payments) (+/-).: 61404 |
0,00 |
0,00 |
493.857,00 |
0,00 |
0,00 |
|
|
5.
Operating activity cash flows (1 + 2 + 3 + 4) : 61500 |
-2.837.754,00 |
-1.401.948,00 |
-277.748,00 |
221.860,00 |
4.104.838,00 |
|
|
6.
Payments for investment (-).: 62100 |
-246.571,00 |
-1.957.158,00 |
-3.110.815,00 |
-2.715.747,00 |
-9.546.658,00 |
|
|
a) Companies of the group and affiliates. : 62101 |
0,00 |
-1.707.081,00 |
0,00 |
0,00 |
-6.438.832,00 |
|
|
b) Intangible fixed assets. : 62102 |
-19.443,00 |
-225.637,00 |
-2.411.110,00 |
-1.785.332,00 |
-852.249,00 |
|
|
c) Fixed assets. : 62103 |
-104.873,00 |
-24.440,00 |
-699.705,00 |
-930.415,00 |
-2.255.577,00 |
|
|
e) Other financial assets. : 62105 |
-122.255,00 |
0,00 |
0,00 |
0,00 |
0,00 |
|
|
7.
Divestment payment collection (+). : 62200 |
3.942.183,00 |
11.543,00 |
661.397,00 |
2,00 |
2.762.581,00 |
|
|
a) Companies of the group and affiliates. : 62201 |
3.936.358,00 |
0,00 |
0,00 |
0,00 |
140.000,00 |
|
|
c) Fixed assets. : 62203 |
0,00 |
6.566,00 |
661.397,00 |
2,00 |
3.312,00 |
|
|
e) Other financial assets. : 62205 |
5.825,00 |
4.977,00 |
0,00 |
0,00 |
2.619.269,00 |
|
|
8.
Investment activity cash flows (6 + 7) minus Amortization: 62300 |
3.695.612,00 |
-1.945.615,00 |
-2.449.418,00 |
-2.715.745,00 |
-6.784.077,00 |
|
|
9.
Payment collection and payments for equity instruments. : 63100 |
-103.366,00 |
62.754,00 |
279.312,00 |
0,00 |
0,00 |
|
|
e) Grants, donations and bequests received (+). : 63105 |
-103.366,00 |
62.754,00 |
279.312,00 |
0,00 |
0,00 |
|
|
10.
Payment collection and payments for financial liabilities instruments.:
63200 |
-502.120,00 |
3.062.687,00 |
2.352.155,00 |
3.764.445,00 |
2.172.290,00 |
|
|
a) Issuance : 63201 |
-502.120,00 |
3.062.686,00 |
443.028,00 |
7.846.586,00 |
0,00 |
|
|
2. Debts incurred with credit institutions (+). : 63203 |
0,00 |
1.624.370,00 |
0,00 |
0,00 |
0,00 |
|
|
3. Debts incurred with companies of the group and affiliates
(+).: 63204 |
490.130,00 |
1.506.145,00 |
443.028,00 |
7.846.586,00 |
0,00 |
|
|
5. Other debts (+). : 63206 |
-992.250,00 |
-67.829,00 |
0,00 |
0,00 |
0,00 |
|
|
b) Repayment and amortization of : 63207 |
0,00 |
0,00 |
1.909.127,00 |
-4.082.141,00 |
2.172.290,00 |
|
|
2. Debts incurred with credit institutions (-).: 63209 |
0,00 |
0,00 |
1.409.118,00 |
-4.018.023,00 |
2.172.290,00 |
|
|
5. Other debts (-). : 63212 |
0,00 |
0,00 |
500.009,00 |
-64.118,00 |
0,00 |
|
|
11.
Payments from dividends and remunerations from other assets instruments. :
63300 |
0,00 |
0,00 |
0,00 |
-700.000,00 |
0,00 |
|
|
a) Dividends (-).: 63301 |
0,00 |
0,00 |
0,00 |
-700.000,00 |
0,00 |
|
|
12.
Cash flows for financing activities (9+10+11).: 63400 |
-502.120,00 |
3.125.441,00 |
2.631.467,00 |
3.064.445,00 |
2.172.290,00 |
|
|
D)
EFFECT OF EXCHANGE RATE CHANGES: 64000 |
91.796,00 |
27.249,00 |
0,00 |
0,00 |
0,00 |
|
|
E)
NET INCREASE/DECREASE OF CASH OR EQUIVALENT ASSETS (+/-5+/-8+/12+/-D) :
65000 |
447.533,00 |
-194.873,00 |
-95.699,00 |
570.560,00 |
-506.949,00 |
|
|
Cash or equivalent assets as of beginning of the fiscal year.:
65100 |
411.254,00 |
606.129,00 |
701.828,00 |
131.268,00 |
638.217,00 |
|
|
Cash or equivalent assets as of end of the fiscal year.:
65200 |
858.790,00 |
411.255,00 |
606.129,00 |
701.828,00 |
131.268,00 |
|
|
|
|
|
|
|
>
Economic-Financial Comparative Analysis
Data used in the following ratios and indicators is taken from the
Annual Accounts submitted by the company to the TRADE REGISTER.
>
Comparison within the Sector
|
Cash
Flow |
2014 |
2013 |
Variación 2014 - 2013 |
|
|||
|
|
Empresa |
Sector |
Empresa |
Sector |
Empresa |
Sector |
|
|
Cash
Flow over Sales: |
0,01 % |
0,05 % |
0,00 % |
0,01 % |
|
295,53 % |
|
|
EBITDA
over Sales: |
-2,64 % |
11,79 % |
5,07 % |
11,36 % |
-152,11 % |
3,73 % |
|
|
Cash
Flow Yield: |
0,01 % |
0,03 % |
0,00 % |
0,01 % |
|
310,86 % |
|
|
Profitability |
2014 |
2013 |
Variación 2014 - 2013 |
|
|||
|
|
Empresa |
Sector |
Empresa |
Sector |
Empresa |
Sector |
|
|
Operating
economic profitability: |
-8,23 % |
8,97 % |
3,06 % |
6,91 % |
-369,32 % |
29,85 % |
|
|
Total
economic profitability: |
-7,76 % |
4,85 % |
2,63 % |
3,75 % |
-395,35 % |
29,47 % |
|
|
Financial
profitability: |
-32,76 % |
6,72 % |
4,61 % |
4,22 % |
-811,15 % |
59,24 % |
|
|
Margin:
|
-6,44 % |
7,74 % |
2,11 % |
6,73 % |
-404,56 % |
15,04 % |
|
|
Mark-up:
|
-7,31 % |
6,96 % |
1,49 % |
4,47 % |
-589,13 % |
55,53 % |
|
|
Solvency |
2014 |
2013 |
Variación 2014 - 2013 |
|
|||
|
|
Empresa |
Sector |
Empresa |
Sector |
Empresa |
Sector |
|
|
Liquidity:
|
0,03 |
0,16 |
0,01 |
0,13 |
123,62 |
16,84 |
|
|
Acid
Test: |
0,83 |
0,93 |
0,99 |
0,87 |
-16,68 |
6,93 |
|
|
Working
Capital / Investment: |
0,07 |
0,03 |
0,14 |
0,05 |
-50,26 |
-42,45 |
|
|
Solvency:
|
1,24 |
1,22 |
1,37 |
1,18 |
-9,83 |
3,80 |
|
|
Indebtedness |
2014 |
2013 |
Variación 2014 - 2013 |
|
|||
|
|
Empresa |
Sector |
Empresa |
Sector |
Empresa |
Sector |
|
|
Indebtedness
level: |
2,29 |
1,28 |
1,88 |
1,38 |
21,92 |
-7,53 |
|
|
Borrowing
Composition: |
0,07 |
1,24 |
0,09 |
1,00 |
-21,49 |
24,41 |
|
|
Repayment
Ability: |
65,52 |
21,77 |
-164,12 |
92,38 |
139,92 |
-76,44 |
|
|
Warranty:
|
1,44 |
1,79 |
1,53 |
1,73 |
-6,25 |
3,29 |
|
|
Generated
resources / Total creditors: |
-0,06 |
0,08 |
0,08 |
0,08 |
-171,50 |
-2,08 |
|
|
Efficiency |
2014 |
2013 |
Variación 2014 - 2013 |
|
|||
|
|
Empresa |
Sector |
Empresa |
Sector |
Empresa |
Sector |
|
|
Productivity:
|
0,93 |
1,96 |
1,18 |
1,85 |
-21,49 |
5,99 |
|
|
Turnover
of Collection Rights : |
2,64 |
5,67 |
2,78 |
5,00 |
-5,28 |
13,49 |
|
|
Turnover
of Payment Entitlements: |
1,86 |
3,74 |
1,87 |
3,64 |
-0,60 |
2,97 |
|
|
Stock
rotation: |
7,06 |
9,98 |
8,32 |
7,34 |
-15,15 |
35,92 |
|
|
Assets
turnover: |
1,28 |
1,16 |
1,45 |
1,03 |
-11,57 |
12,87 |
|
|
Borrowing
Cost: |
1,39 |
2,96 |
1,26 |
2,86 |
11,10 |
3,60 |
|
>
Trend of indicators under the General Accounting Plan of 2007 (2014, 2013,
2012, 2011, 2010)
|
Cash
Flow |
2014 |
2013 |
2012 |
2011 |
2010 |
|
|
Cash
Flow over Sales: |
0,01 % |
0,00 % |
0,00 % |
0,01 % |
-0,02 % |
|
|
EBITDA
over Sales: |
-2,64 % |
5,07 % |
1,76 % |
2,50 % |
-1,44 % |
|
|
Cash
Flow Yield: |
0,01 % |
0,00 % |
0,00 % |
0,01 % |
-0,01 % |
|
|
Profitability |
2014 |
2013 |
2012 |
2011 |
2010 |
|
|
Operating
economic profitability: |
-8,23 % |
3,06 % |
-1,60 % |
-0,13 % |
-5,63 % |
|
|
Total
economic profitability: |
-7,76 % |
2,63 % |
-1,35 % |
0,48 % |
-3,57 % |
|
|
Financial
profitability: |
-32,76 % |
4,61 % |
-2,95 % |
-0,48 % |
-6,64 % |
|
|
Margin:
|
-6,44 % |
2,11 % |
-1,37 % |
-0,09 % |
-4,84 % |
|
|
Mark-up:
|
-7,31 % |
1,49 % |
-2,02 % |
-0,48 % |
-5,48 % |
|
|
Solvency |
2014 |
2013 |
2012 |
2011 |
2010 |
|
|
Liquidity:
|
0,03 |
0,01 |
0,02 |
0,03 |
0,01 |
|
|
Acid
Test: |
0,83 |
0,99 |
1,04 |
1,01 |
1,27 |
|
|
Working
Capital / Investment: |
0,07 |
0,14 |
0,16 |
0,22 |
0,30 |
|
|
Solvency:
|
1,24 |
1,37 |
1,41 |
1,54 |
1,73 |
|
|
Indebtedness |
2014 |
2013 |
2012 |
2011 |
2010 |
|
|
Indebtedness
level: |
2,29 |
1,88 |
1,84 |
1,46 |
1,40 |
|
|
Borrowing
Composition: |
0,07 |
0,09 |
0,13 |
0,14 |
0,20 |
|
|
Repayment
Ability: |
65,52 |
-164,12 |
-306,49 |
41,72 |
-47,47 |
|
|
Warranty:
|
1,44 |
1,53 |
1,54 |
1,69 |
1,72 |
|
|
Generated
resources / Total creditors: |
-0,06 |
0,08 |
0,03 |
0,05 |
0,00 |
|
|
Efficiency |
2014 |
2013 |
2012 |
2011 |
2010 |
|
|
Productivity:
|
0,93 |
1,18 |
1,05 |
1,08 |
0,95 |
|
|
Turnover
of Collection Rights : |
2,64 |
2,78 |
2,18 |
3,26 |
2,62 |
|
|
Turnover
of Payment Entitlements: |
1,86 |
1,87 |
1,29 |
1,94 |
1,46 |
|
|
Stock
rotation: |
7,06 |
8,32 |
7,98 |
5,72 |
5,02 |
|
|
Assets
turnover: |
1,28 |
1,45 |
1,16 |
1,41 |
1,16 |
|
|
Borrowing
Cost: |
1,39 |
1,26 |
1,15 |
1,80 |
1,36 |
|
COMPARATIVE SECTORIAL BALANCE
|
Sector-based Comparison under the
rules of the New General Accounting Plan.
|
|
Variación - |
|
|
|
Empresa |
Sector |
|
|
Variación - |
|
|
|
Empresa |
Sector |
|
|
Variación - |
|
|
|
Empresa |
Sector |
Public
Tenders and Works Won
|
|
|
|
Organisation
that calls the tender: |
|
CONSEJO SUPERIOR DE INVESTIGACIONES CIENTIFICAS
CSIC |
|
Objective
of Tender: |
|
Suministro e instalación de un equipo de
pulverización catódica |
|
Date
Awarded: |
|
25/06/2015 |
|
Cost: |
|
171.215,00 EURO. |
|
|
|
Organisation
that calls the tender: |
|
CONSEJO SUPERIOR DE INVESTIGACIONES CIENTIFICAS
CSIC |
|
Objective
of Tender: |
|
SUMINISTRO E INSTALACION DE UN EQUIPO DE
PULVERIZACION CATODICA |
|
Date
Awarded: |
|
25/06/2015 |
|
Cost: |
|
171.215,00 EURO. |
|
|
|
Organisation
that calls the tender: |
|
UNIVERSITAT AUTONOMA DE BARCELONA |
|
Objective
of Tender: |
|
SUBMINISTRAMENT D UN SISTEMA DE RECOBRIMENT PER
SPUTTERING |
|
Date
Awarded: |
|
11/06/2015 |
|
Cost: |
|
142.500,00 EURO. |
|
|
|
Organisation
that calls the tender: |
|
UNIVERSIDAD DE ZARAGOZA |
|
Objective
of Tender: |
|
SUMINISTRO E INSTALACION DE UN PERFILOMETRO
MECANICO |
|
Date
Awarded: |
|
18/05/2015 |
|
Cost: |
|
41.503,00 EURO. |
|
|
|
Organisation
that calls the tender: |
|
CONSEJO SUPERIOR DE INVESTIGACIONES CIENTIFICAS
CSIC |
|
Objective
of Tender: |
|
SUMINISTRO E INSTALACION DE UNA MESA CRIOGENICA
PARA MEDIDAS ELECTRICAS MEDIANTE PUNTAS CON CONTROL MICROMETRICO CON DESTINO
AL INSTITUTO DE CIENCIA DE MATERIALES DE BARCELONA |
|
Date
Awarded: |
|
19/12/2014 |
|
Cost: |
|
174.845,00 EURO. |
|
|
|
Organisation
that calls the tender: |
|
CONSEJO SUPERIOR DE INVESTIGACIONES CIENTIFICAS
CSIC |
|
Objective
of Tender: |
|
SUMINISTRO E INSTALACION DE UNA MESA CRIOGENICA
PARA MEDIDAS ELECTRICAS MEDIANTE PUNTAS CON CONTROL MICROMETRICO CON DESTINO AL
INSTITUTO DE DE CIENCIA DE MATERIALES DE BARCELONA |
|
Date
Awarded: |
|
19/12/2014 |
|
Cost: |
|
174.845,00 EURO. |
|
|
|
Organisation
that calls the tender: |
|
UNIVERSIDAD DE VALENCIA |
|
Objective
of Tender: |
|
SUMINISTRO DE UNA CAMARA DE ULTRA VACIO PARA LA
INTRODUCCION DE MUESTRAS CON DESTINO AL INSTITUT DE CIENCIA MOLECULAR |
|
Date
Awarded: |
|
30/10/2014 |
|
Cost: |
|
63.056,73 EURO. |
|
|
|
Organisation
that calls the tender: |
|
UNIVERSIDAD DE VALENCIA |
|
Objective
of Tender: |
|
SUMINISTRO DE UNA CAJA DE GUANTES PARA UN SISTEMA
DE EVAPORACION DE METALES CON DESTINO AL INSTITUT DE CIENCIA MOLECULAR DE LA
UNIVERSITAT DE VALENCIA |
|
Date
Awarded: |
|
30/06/2014 |
|
Cost: |
|
54.450,00 EURO. |
|
|
|
Organisation
that calls the tender: |
|
AGENCIA ESPAÑOLA DE MEDICAMENTOS Y PRODUCTOS
SANITARIOS |
|
Objective
of Tender: |
|
SERVICIOO DE MANTENIMIENTO PREVENTIVO Y
VERIFICACION DE LAS SALAS DE CPR Y DE LA ZONA ESTERIL, Y VERFICIACION DE LAS CABINAS
DE FLUJO LAMINAR DE LA MARCA TELSTAR EN LOS LABORATORIOS DE LA AGENCIA
ESPAÑOLA DE MEDICAMENTOS Y PRODUCTOS SANITARIOS |
|
Date
Awarded: |
|
23/01/2014 |
|
Cost: |
|
39.286,32 EURO. |
|
|
|
Organisation
that calls the tender: |
|
UNIVERSIDAD DE SEVILLA |
|
Objective
of Tender: |
|
BIOWASTE PARA LABORATORIO P3 DE ALTA SEGURIDAD
BIOLOGICA DEL IBIS |
|
Date
Awarded: |
|
14/01/2014 |
|
Cost: |
|
283.621,58 EURO. |
|
|
|
Organisation
that calls the tender: |
|
INSTITUTO NACIONAL DE TECNICA AEROESPACIAL |
|
Objective
of Tender: |
|
MANTENIMIENTO DE LA CAMARA DE VACIO DEL LINES |
|
Date
Awarded: |
|
04/12/2013 |
|
Cost: |
|
22.990,00 EURO. |
|
|
|
Organisation
that calls the tender: |
|
CONSEJO SUPERIOR DE INVESTIGACIONES CIENTIFICAS
CSIC |
|
Objective
of Tender: |
|
SUMINISTRO E INSTALACION DE UN ACCESORIO PARA EL
CONTROL DE TEMPERATURA Y OTRO PARA MEDIDAS ELECTRICAS EN EL MICROSCOPIO DE FUERZAS
ATOMICAS AFM MULTIMODE, NANOSCOPE CON DESTINO AL INSTITUTO DE ESTRUCTURA DE
LA MATERIA |
|
Date
Awarded: |
|
11/11/2013 |
|
Cost: |
|
64.856,00 EURO. |
|
|
|
Organisation
that calls the tender: |
|
CENTRO DE INVESTIGACIONES ENERGETICAS MEDIOAMBIENTALES
Y TECNOLOGICAS CIEMAT |
|
Objective
of Tender: |
|
ADQUISICION DE UN PERFILOMETRO MECANICO
AUTOMATICO PARA MEDIDA DE RUGOSIDAD Y PROFUNDIDAD |
|
Date
Awarded: |
|
22/10/2013 |
|
Cost: |
|
52.973,80 EURO. |
|
|
|
Organisation
that calls the tender: |
|
UNIVERSIDAD DE GRANADA |
|
Objective
of Tender: |
|
SUMINISTRO DE DE DIVERSO EQUIPAMIENTO CIENTIFICO
O TECNICO PARA EL INSTITUTO MIXTO UNIVERSITARIO DEPORTE Y SALUD IMUDS |
|
Date
Awarded: |
|
19/09/2013 |
|
Cost: |
|
Importe compartido entre distintos Contratistas |
|
|
|
Organisation
that calls the tender: |
|
UNIVERSIDAD DE VALENCIA |
|
Objective
of Tender: |
|
SISTEMA DE ULTRA VACIO UHV PARA LA DEPOSICION DE
METALES |
|
Date
Awarded: |
|
09/09/2013 |
|
Cost: |
|
361.790,00 EURO. |
|
|
|
Organisation
that calls the tender: |
|
UMIVALE MATEPSS |
|
Objective
of Tender: |
|
SUMINISTRO DE UN LIOFILIZADOR DE LABORATORIO C O
VIGO |
|
Date
Awarded: |
|
19/12/2012 |
|
Cost: |
|
58.958,46 EURO. |
|
|
|
Organisation
that calls the tender: |
|
CONSEJO SUPERIOR DE INVESTIGACIONES CIENTIFICAS
CSIC |
|
Objective
of Tender: |
|
SUMINISTRO E INSTALACION DE UN AISLADOR RIGIDO EN
CAMARA DE 4 GUANTES Y CON FUNCIONAMIENTO EN PRESION NEGATIVA CON DESTINO AL
INSTITUTO DE CIENCIA DE LOS MATERIALES DE BARCELONA |
|
Date
Awarded: |
|
17/07/2012 |
|
Cost: |
|
69.974,00 EURO. |
|
|
|
Organisation
that calls the tender: |
|
UNIVERSIDAD POLITECNICA DE MADRID |
|
Objective
of Tender: |
|
Suministro de cámara de vacío térmica para el Instituto
de Microgravedad "Ignacio Da Riva" del Parque Científico y
Tecnológico, en Montegancedo |
|
Date
Awarded: |
|
01/08/2011 |
|
Cost: |
|
259.600,00 EURO. |
|
|
|
Organisation
that calls the tender: |
|
INSTITUTO NACIONAL DE TECNICA AEROESPACIAL |
|
Objective
of Tender: |
|
ACTUALIZACION Y MEJORA DEL SIMULADOR 4 X 4 |
|
Date
Awarded: |
|
05/08/2010 |
|
|
|
Organisation
that calls the tender: |
|
INSTITUTO NACIONAL DE TECNICA AEROESPACIAL |
|
Objective
of Tender: |
|
MANTENIMIENTOS DE LOS EQUIPOS DE LA SALA LIMPIA
DEL LINES |
|
Date
Awarded: |
|
24/11/2009 |
|
Cost: |
|
32.248,00 EURO. |
|
|
|
Organisation
that calls the tender: |
|
CENTRO NACIONAL DE INVESTIGACIONES
CARDIOVASCULARES CARLOS III |
|
Objective
of Tender: |
|
ADQUISICION DE AUTOCLAVE |
|
Date
Awarded: |
|
17/11/2009 |
|
Cost: |
|
150.220,00 EURO. |
|
|
|
Organisation
that calls the tender: |
|
CONSEJO SUPERIOR DE INVESTIGACIONES CIENTIFICAS
CSIC |
|
Objective
of Tender: |
|
suministro e instalación de un esterilizador a
vapor con sello doble biológico de 6.000 litros, un esterilizador a vapor con
doble sello biológico de 3.000 litros, ambos para conectar a vapor de red y
un esterilizador a vapor con doble sello biológico de 875 litros con
generador de vapor integrado, para conectar a vapor |
|
Date
Awarded: |
|
08/06/2009 |
|
Cost: |
|
458.200,00 EURO. |
|
Detail
of Subsidies appearing in Balances Memories
|
|
|
|
|
|
Entity |
ORGANISMO NO ESPECIFICADO |
|
Status |
CONCEDIDA |
|
Amount Granted |
147.667,00 |
|
Notes |
El importe reflejado corresponde al transferido a
la cuenta de pérdidas y ganancias, quedando un saldo pendiente al cierre de
137.507 euros. |
|
Entity |
ORGANISMO NO ESPECIFICADO |
|
Subsidy Concept |
Subvención de capital. |
|
Status |
CONCEDIDA |
|
Amount Granted |
142.687,00 |
|
Notes |
Dicho importe corresponde al traspasado a
resultados del ejercicio, quedando a fecha de cierre pendiente de imputar
289.620 euros. Subvención implícita en préstamos con tipo de interés cero. |
|
Entity |
ORGANISMO NO ESPECIFICADO |
|
Subsidy Concept |
Subvención de explotación. |
|
Status |
CONCEDIDA |
|
Amount Granted |
5.460,00 |
|
Entity |
ORGANISMO NO ESPECIFICADO |
|
Subsidy Concept |
Subvención de explotación. |
|
Status |
CONCEDIDA |
|
Amount Granted |
268.379,00 |
|
Entity |
ORGANISMO NO ESPECIFICADO |
|
Subsidy Concept |
Subvención de capital. |
|
Status |
CONCEDIDA |
|
Amount Granted |
110.189,00 |
|
Notes |
El importe reflejado corresponde al saldo al
cierre del ejercicio. |
|
Entity |
ORGANISMO NO ESPECIFICADO |
|
Status |
CONCEDIDA |
|
Project |
Subvención de intereses |
|
Amount Granted |
169.583,00 |
|
Notes |
Imputado a resultados. |
|
Entity |
ORGANISMO NO ESPECIFICADO |
|
Subsidy Concept |
Subvención de explotación |
|
Status |
CONCEDIDA |
|
Amount Granted |
22.509,00 |
|
Notes |
Imputado a resultados. |
|
Entity |
ORGANISMO NO ESPECIFICADO |
|
Status |
CONCEDIDA |
|
Amount Granted |
120.706,00 |
|
Notes |
Dicho importe corresponde al traspasado a
resultados del ejercicio, quedando a fecha de cierre pendiente de imputar
221.809,00 euros. |
|
Entity |
ORGANISMO NO ESPECIFICADO |
|
Subsidy Concept |
Subvención de explotación. |
|
Status |
CONCEDIDA |
|
Amount Granted |
117.505,00 |
|
Research
Summary
|
|
Big size company engaged
in development of engineering projects. Being a part of the japanese group Azbil
since 2013, has been operating for years with no icedence registered. |
|
Sources
|
|
Registry of Commerce's
Official Gazette. Own and external data bases Company References |
FOREIGN EXCHANGE RATES
|
Currency |
Unit
|
Indian Rupees |
|
US Dollar |
1 |
Rs.66.39 |
|
|
1 |
Rs.102.59 |
|
Euro |
1 |
Rs.74.90 |
INFORMATION DETAILS
|
Analysis Done by
: |
RAS |
|
|
|
|
Report Prepared
by : |
TPT |
RATING EXPLANATIONS
|
RATING |
STATUS |
PROPOSED CREDIT LINE |
|
|
|
>86 |
Aaa |
Possesses an extremely sound financial base with the strongest
capability for timely payment of interest and principal sums |
Unlimited |
|
|
71-85 |
Aa |
Possesses adequate working capital. No caution needed for credit transaction.
It has above average (strong) capability for payment of interest and
principal sums |
Large |
|
|
56-70 |
A |
Financial & operational base are regarded healthy. General unfavourable
factors will not cause fatal effect. Satisfactory capability for payment of
interest and principal sums |
Fairly Large |
|
|
41-55 |
Ba |
Overall operation is considered normal. Capable to meet normal
commitments. |
Satisfactory |
|
|
26-40 |
B |
Capability to overcome financial difficulties seems comparatively
below average. |
Small |
|
|
11-25 |
Ca |
Adverse factors are apparent. Repayment of interest and principal sums
in default or expected to be in default upon maturity |
Limited with
full security |
|
|
<10 |
C |
Absolute credit risk exists. Caution needed to be exercised |
Credit not
recommended |
|
|
-- |
NB |
New Business |
-- |
|
This score serves as a reference to assess SC’s
credit risk and to set the amount of credit to be extended. It is calculated
from a composite of weighted scores obtained from each of the major sections of
this report. The assessed factors and their relative weights (as indicated
through %) are as follows:
Financial
condition (40%) Ownership
background (20%) Payment
record (10%)
Credit history
(10%) Market trend (10%) Operational size
(10%)
This report is issued at your request without any
risk and responsibility on the part of MIRA INFORM PRIVATE LIMITED (MIPL) or
its officials.