MIRA INFORM REPORT
|
Report No. : |
340694 |
|
Report Date : |
15.09.2015 |
IDENTIFICATION DETAILS
|
Name : |
PURATOS BALGARIYA AD |
|
|
|
|
Formerly Known As : |
PURATOS BULGARIA AD |
|
|
|
|
Registered Office : |
J.K. Kv. Moshino, Ul. Mladen Stoyanov 2 2303 Pernik |
|
|
|
|
Country : |
Bulgaria |
|
|
|
|
Financials (as on) : |
31.12.2014 |
|
|
|
|
Date of Incorporation : |
1996 |
|
|
|
|
Legal Form : |
Joint Stock Company (AD) |
|
|
|
|
Line of Business : |
|
|
|
|
|
No. of Employee : |
34 (31.12.2014) |
RATING & COMMENTS
|
MIRA’s Rating : |
Ba |
|
RATING |
STATUS |
PROPOSED CREDIT LINE |
|
|
41-55 |
Ba |
Overall operation is considered normal. Capable to meet normal
commitments. |
Satisfactory |
|
Status : |
Satisfactory |
|
|
|
|
Payment Behaviour : |
No complaints |
|
|
|
|
Litigation : |
Clear |
NOTES :
Any query related to this report can be made
on e-mail : infodept@mirainform.com
while quoting report number, name and date.
ECGC Country Risk Classification List – March 31, 2015
|
Country Name |
Previous Rating (31.12.2014) |
Current Rating (31.03.2015) |
|
Bulgaria |
A2 |
A2 |
|
Risk Category |
ECGC
Classification |
|
Insignificant |
A1 |
|
Low |
A2 |
|
Moderate |
B1 |
|
High |
B2 |
|
Very High |
C1 |
|
Restricted |
C2 |
|
Off-credit |
D |
BULGARIA ECONOMIC OVERVIEW
Bulgaria, a former Communist country that entered the EU on 1 January 2007, averaged more than 6% annual growth from 2004 to 2008, driven by significant amounts of bank lending, consumption, and foreign direct investment. Successive governments have demonstrated a commitment to economic reforms and responsible fiscal planning, but the global downturn sharply reduced domestic demand, exports, capital inflows, and industrial production. GDP contracted by 5.5% in 2009, and has been slow to recover in the years since. Despite having a favorable investment regime, including low, flat corporate income taxes, significant challenges remain. Corruption in public administration, a weak judiciary, and the presence of organized crime continue to hamper the country's investment climate and economic prospects.
|
Source
: CIA |
COMPANY DETAILS
Local name: PURATOS BALGARIYA AD
International name: PURATOS BULGARIA JSC
Registered address:
J.K. KV. MOSHINO,
UL. MLADEN STOYANOV 2
2303 PERNIK
Bulgaria
Telephone: +359-76-670071
Fax: +359-76-670071
E-Mail: info@puratos.bg
Internet: http://www.puratos.bg
ESTABLISHMENT & REGISTRATION:
Established: 1996
Registered at Pernik district court
Court number 787/1996
Bulstat/VAT number: 113021497
Status of the company:
Active
HISTORY:
Established as
PURATOS BYULGARI AD (PURATOS BULGARIE AD).
In 2010 the name was changed to PURATOS BULGARIA AD.
LEGAL FORM:
Joint Stock
Company (AD)
REGISTERED CAPITAL:
BGN 575 080.00
SHAREHOLDERS/MANAGEMENT
SHAREHOLDERS:
|
PURATOS GROUP (Belgium) |
99.92% |
|
MISHEL DYOMANE |
0.04% |
|
EDI VAN BEL |
0.04% |
MANAGEMENT:
|
ROSTISLAVA MIHAYLOVA PAVLOVA |
(Personal ID 7210103794) |
- Representative, Member of the board |
|
EDI VAN BEL |
(Personal ID date of birth 20.9.1949) |
- Member of the board |
|
PIT SANDERS |
(Personal ID date of birth 27.4.1956) |
- Member of the board |
RELATED COMPANIES:
None
BUSINESS ACTIVITY
BUSINESS
OPERATION:
NACE 1.1: 15.89 Manufacture of other food
products n.e.c.
Activity:
Trade with raw materials and ingredients for
the food industry.
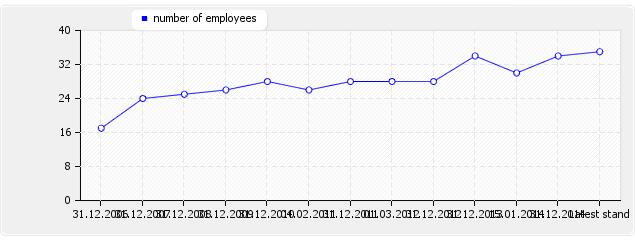
NUMBER OF
EMPLOYEES:
|
As at date |
Value |
|
31.12.2006 |
17 |
|
31.12.2007 |
24 |
|
31.12.2008 |
25 |
|
31.12.2009 |
26 |
|
31.12.2010 |
28 |
|
04.02.2011 |
26 |
|
31.12.2011 |
28 |
|
01.03.2012 |
28 |
|
31.12.2012 |
28 |
|
31.12.2013 |
34 |
|
15.01.2014 |
30 |
|
31.12.2014 |
34 |
|
Latest stand |
35 |
EXPORT:
None
IMPORT:
Belgium, Greece, Romania
REAL ESTATE:
None
FINANCIAL DATA
TURNOVER:
|
Year |
Currency |
Value |
|
2002 |
BGN |
1 396 000.00 |
|
2003 |
BGN |
2 016 000.00 |
|
2004 |
BGN |
2 490 000.00 |
|
2005 |
BGN |
3 081 000.00 |
|
2006 |
BGN |
3 618 000.00 |
|
2007 |
BGN |
4 959 000.00 |
|
2008 |
BGN |
6 925 000.00 |
|
2009 |
BGN |
7 936 000.00 |
|
2010 |
BGN |
10 051 000.00 |
|
2011 |
BGN |
11 163 000.00 |
|
2012 |
BGN |
11 690 000.00 |
|
2013 |
BGN |
13 126 000.00 |
|
2014 |
BGN |
14 275 000.00 |
MODES OF PAYMENT:
Payments are made within agreed terms.
DEBT COLLECTION:
No debt collection cases are registered
against the company.
BANK DISTRAINTS:
No shares of the company are under bank
distraint.
UNPAID TAXES/
CONTRIBUTIONS TO GOVERNMENT:
There is no publication about overdue unpaid
taxes.
INVOLVEMENT IN
LEGAL DISPUTES:
There is no publication about legal claims
or disputes against the company.
OTHER PAYMENT
INFORMATION:
No adverse payment information is available.
BRANCH INDICATOR:
The company's payment behaviour is average
for the branch.
GENERAL PAYMENT
ASSESSMENT:
A
FINANCIAL OPINION:
A
|
Ratio |
2011 |
2012 |
2013 |
2014 |
|
Accounting
period: |
1.1.2011 - |
1.1.2012 - |
1.1.2013 - |
1.1.2014 - |
|
Debt ratio |
0.58 |
0.59 |
0.52 |
0.49 |
|
Quick ratio |
0.91 |
0.96 |
1.17 |
1.19 |
|
Current ratio |
1.48 |
1.53 |
1.76 |
1.85 |
|
Days purchase in payables |
72.28 |
93.48 |
64.89 |
55.82 |
|
Operating margin in % |
3.38 |
7.36 |
7.25 |
6.82 |
|
Cash ratio (acid ratio) |
0.32 |
0.19 |
0.42 |
0.36 |
|
Return on sales ROS in % |
3.04 |
6.61 |
6.52 |
6.13 |
|
Return on assets ROA in % |
8.73 |
15.06 |
18.62 |
19.30 |
|
Return on equity ROE in % |
20.99 |
37.22 |
38.52 |
37.73 |
|
Days supply in inventory |
41.59 |
54.02 |
38.78 |
36.64 |
|
Days sales in receivables |
42.39 |
71.15 |
48.63 |
46.22 |
|
BALANCE SHEET in BGN'000 |
2011 |
2012 |
2013 |
2014 |
|
Accounting
period: |
1.1.2011 - |
1.1.2012 - |
1.1.2013 - |
1.1.2014 - |
|
A.UNPAID CAPITAL |
|
|
|
|
|
B. FIXED ASSETS |
|
|
|
|
|
I Fixed Intangible Assets: |
|
|
|
|
|
R&D Products |
|
|
|
|
|
Concessions, patents, trade-marks etc |
|
|
|
|
|
Goodwill |
|
|
|
|
|
Intangible fixed assets under construction |
|
|
|
|
|
thereof advances |
|
|
|
|
|
Total I: |
|
|
|
|
|
II Fixed Tangible Assets |
|
|
|
|
|
Land and Buildings |
|
|
|
|
|
thereof Land |
|
|
|
|
|
thereof Buildings |
|
|
|
|
|
Machines, Vehicles |
405 |
257 |
239 |
186 |
|
Equipment |
77 |
114 |
98 |
122 |
|
Tangible fixed assets under construction |
|
6 |
|
37 |
|
thereof advances |
|
|
|
|
|
Total II |
482 |
405 |
337 |
345 |
|
III. Fixed Financial Assets |
|
|
|
|
|
Shares in group companies |
|
|
|
|
|
Loans granted to group companies |
|
|
|
|
|
Shares in joint ventures |
|
|
|
|
|
Long term investments |
|
|
|
|
|
Other loans |
|
|
|
|
|
Bought back own shares |
|
|
|
|
|
Total III |
|
|
|
|
|
IV. Deferred Taxes |
28 |
|
26 |
26 |
|
B. FIXED ASSETS TOTAL |
510 |
405 |
363 |
371 |
|
C. CURRENT ASSETS |
|
|
|
|
|
I. Inventories |
|
|
|
|
|
Raw Materials |
582 |
829 |
591 |
578 |
|
Work in progress |
|
|
|
|
|
thereof young animals |
|
|
|
|
|
Trading goods |
613 |
803 |
719 |
783 |
|
thereof production |
249 |
293 |
272 |
281 |
|
thereof goods for sale |
364 |
510 |
447 |
502 |
|
Advances |
|
1 |
21 |
13 |
|
Total I |
1195 |
1633 |
1331 |
1374 |
|
II. Receivables |
|
|
|
|
|
Receivables from customers |
1082 |
1539 |
1291 |
1306 |
|
thereof more than 1 year |
|
282 |
|
|
|
Receivables from group companies |
120 |
595 |
155 |
105 |
|
thereof more than 1 year |
|
|
|
|
|
Receivables from joint ventures |
|
|
|
312 |
|
thereof more than 1 year |
|
|
|
|
|
Other receivables |
13 |
17 |
223 |
10 |
|
thereof more than 1 year |
|
|
|
3 |
|
Total II |
1218 |
2151 |
1669 |
1733 |
|
III. Current Financial Assets |
|
|
|
|
|
Current investments in related companies |
|
|
|
|
|
Bought back own shares |
|
|
|
|
|
Other current financial assets |
|
|
|
|
|
Total III |
|
|
|
|
|
IV. Cash equivalents |
|
|
|
|
|
Cash and accounts in the country |
|
|
929 |
762 |
|
thereof cash |
1 |
2 |
3 |
3 |
|
Thereof cash in foreign currency (equivalent) |
|
|
|
|
|
thereof current accounts |
661 |
548 |
926 |
759 |
|
thereof blocked accounts |
|
|
|
|
|
thereof cash equivalents |
|
|
|
|
|
Cash and accounts abroad |
|
|
|
|
|
thereof cash |
|
|
|
|
|
Thereof cash in foreign currency (equivalent) |
|
|
|
|
|
thereof current accounts |
|
|
|
|
|
thereof blocked accounts |
|
|
|
|
|
Total IV |
662 |
550 |
929 |
762 |
|
C. CURRENT ASSETS TOTAL |
3075 |
4334 |
3929 |
3869 |
|
D. Deferred expenses |
13 |
35 |
32 |
45 |
|
TOTAL ASSETS |
3598 |
4774 |
4324 |
4285 |
|
A. OWNERS EQUITY |
|
|
|
|
|
I. Share capital |
575 |
575 |
575 |
575 |
|
II. Issue premium |
|
|
|
|
|
III. Revaluation reserves |
|
|
|
|
|
thereof revaluation reserves of financial instruments |
|
|
|
|
|
IV. Reserves |
|
|
|
|
|
legal reserves |
|
|
170 |
250 |
|
reserve related to bought back own shares |
|
|
|
|
|
reserve from company foundation |
|
|
|
|
|
other reserves |
67 |
98 |
|
|
|
Total IV |
67 |
98 |
170 |
250 |
|
V. Result from previous period |
|
|
|
|
|
Undistributed profit |
|
988 |
988 |
988 |
|
Uncovered loss |
|
-448 |
-448 |
-448 |
|
Total V |
640 |
540 |
540 |
540 |
|
VI. Current result profit (loss) |
214 |
719 |
805 |
827 |
|
A. OWNERS EQUITY TOTAL |
1496 |
1932 |
2090 |
2192 |
|
B. PROVISIONS |
|
|
|
|
|
Provisions for pensions |
|
|
|
|
|
Provisions for taxes |
|
|
|
|
|
thereof deferred taxes |
|
|
|
|
|
Other provisions |
|
|
|
|
|
B. PROVISIONS TOTAL |
|
|
|
|
|
C. LIABILITIES |
|
|
|
|
|
Bond-backed loans |
|
|
|
|
|
less than 1 year |
|
|
|
|
|
more than 1 year |
|
|
|
|
|
Bank loans |
|
|
|
|
|
less than 1 year |
|
|
|
|
|
more than 1 year |
|
|
|
|
|
Advances received |
|
|
|
|
|
less than 1 year |
|
|
|
|
|
more than 1 year |
|
|
|
|
|
Payables to suppliers |
556 |
816 |
762 |
838 |
|
less than 1 year |
556 |
816 |
762 |
838 |
|
more than 1 year |
|
|
|
|
|
Liabilities on policies |
|
|
|
|
|
less than 1 year |
|
|
|
|
|
more than 1 year |
|
|
|
|
|
Liabilities to group companies |
1367 |
1855 |
1290 |
662 |
|
less than 1 year |
1367 |
1855 |
1290 |
662 |
|
more than 1 year |
|
|
|
|
|
Liabilities to joint-venture companies |
|
|
|
|
|
less than 1 year |
|
|
|
|
|
more than 1 year |
|
|
|
|
|
Other liabilities |
154 |
155 |
175 |
593 |
|
less than 1 year |
154 |
155 |
175 |
593 |
|
more than 1 year |
|
|
|
|
|
thereof to personnel |
|
|
|
|
|
less than 1 year |
|
|
|
|
|
more than 1 year |
|
|
|
|
|
thereof to social insurance |
|
|
|
19 |
|
less than 1 year |
|
|
|
19 |
|
more than 1 year |
|
|
|
|
|
thereof for taxes |
139 |
153 |
175 |
249 |
|
less than 1 year |
139 |
153 |
175 |
249 |
|
more than 1 year |
|
|
|
|
|
C. LIABILITIES TOTAL |
2077 |
2826 |
2227 |
2093 |
|
less than 1 year |
2077 |
2826 |
2227 |
2093 |
|
more than 1 year |
|
|
|
|
|
D. FINANCING AND DEFERRED INCOME |
25 |
16 |
7 |
|
|
thereof |
|
|
|
|
|
Financing |
25 |
16 |
|
|
|
Deferred income |
|
|
|
|
|
TOTAL EQUITY AND LIABILITIES |
3598 |
4774 |
4324 |
4285 |
|
P&L ACCOUNT in BGN'000 |
2011 |
2012 |
2013 |
2014 |
|
Accounting
period: |
1.1.2011 - |
1.1.2012 - |
1.1.2013 - |
1.1.2014 - |
|
A. EXPENSES |
|
|
|
|
|
I. OPERATION EXPENSES |
|
|
|
|
|
Decrease of inventories |
12 |
|
21 |
|
|
thereof for materials |
3489 |
3976 |
4286 |
4477 |
|
thereof for services |
939 |
1010 |
1065 |
1089 |
|
Personnel expenses |
856 |
927 |
1053 |
1211 |
|
thereof wages |
768 |
834 |
949 |
1088 |
|
thereof social insurance |
88 |
93 |
104 |
123 |
|
thereof pensions |
|
|
|
|
|
Depreciation |
127 |
103 |
96 |
90 |
|
thereof Depreciation of fixed assets |
127 |
103 |
96 |
90 |
|
Other expenses |
5362 |
4855 |
5699 |
6481 |
|
thereof Book value of sold assets (without production) |
4812 |
4300 |
4741 |
5101 |
|
I. OPERATION EXPENSES TOTAL |
10785 |
10871 |
12220 |
13348 |
|
II. Financial expenditures |
|
|
|
|
|
Depreciation of financial assets |
|
1 |
|
|
|
thereof exchange rate losses |
|
1 |
|
|
|
Paid interest |
29 |
19 |
12 |
8 |
|
thereof interest to group companies |
|
12 |
|
|
|
Thereof expenditures for securities operations |
|
|
|
|
|
II. Financial expenditures Total |
29 |
20 |
12 |
8 |
|
B. Profit on ordinary activity |
350 |
801 |
896 |
921 |
|
III. Extraordinary expenses |
|
|
|
|
|
thereof expenses on disasters and emergency expenses |
|
|
|
|
|
C. Total expenses (I+II+III) |
10814 |
10891 |
12232 |
13356 |
|
D. Accounting profit |
350 |
801 |
896 |
921 |
|
IV. Taxation on profit |
51 |
82 |
89 |
94 |
|
V. Other taxes |
-15 |
|
2 |
|
|
E. Net profit |
314 |
719 |
805 |
827 |
|
Total expenses |
11164 |
11692 |
13128 |
14277 |
|
A. REVENUES |
|
|
|
|
|
I . OPERATING REVENUES |
|
|
|
|
|
Net sales |
10345 |
10883 |
12355 |
13499 |
|
Production |
5409 |
6425 |
7239 |
7853 |
|
Goods |
4936 |
4458 |
5095 |
5626 |
|
Services |
|
|
21 |
20 |
|
Increase of production and work in progress |
|
37 |
|
9 |
|
Expenses on acquisition of assets |
|
|
|
|
|
Other revenues |
818 |
770 |
771 |
767 |
|
thereof financing |
|
9 |
9 |
9 |
|
I. TOTAL OPERATING REVENUES |
11163 |
11690 |
13126 |
14275 |
|
II FINANCIAL REVENUES |
|
|
|
|
|
Income from shares |
|
|
|
|
|
thereof income from shares in group companies |
|
|
|
|
|
Income from investments and loans |
|
|
|
|
|
thereof from investments in group companies |
|
|
|
|
|
Income from interest |
|
|
2 |
2 |
|
thereof from interest from group companies |
|
|
|
|
|
II FINANCIAL REVENUES TOTAL |
1 |
2 |
2 |
2 |
|
TOTAL REVENUES FROM ORDINARY ACTIVITIES |
11164 |
11692 |
13128 |
14277 |
|
LOSS |
|
|
|
|
|
Extraordinary revenues |
|
|
|
|
|
AFTER TAX LOSS |
|
|
|
|
|
TOTAL REVENUES |
11164 |
11692 |
13128 |
14277 |
FOREIGN EXCHANGE RATES
|
Currency |
Unit
|
Indian Rupees |
|
US Dollar |
1 |
Rs.66.37 |
|
|
1 |
Rs.102.54 |
|
Euro |
1 |
Rs.75.32 |
INFORMATION DETAILS
|
Analysis Done by
: |
TRI |
|
|
|
|
Report Prepared
by : |
ANK |
RATING EXPLANATIONS
|
RATING |
STATUS |
PROPOSED CREDIT LINE |
|
|
>86 |
Aaa |
Possesses an extremely sound financial base with the strongest
capability for timely payment of interest and principal sums |
Unlimited |
|
71-85 |
Aa |
Possesses adequate working capital. No caution needed for credit transaction.
It has above average (strong) capability for payment of interest and
principal sums |
Large |
|
56-70 |
A |
Financial & operational base are regarded healthy. General unfavourable
factors will not cause fatal effect. Satisfactory capability for payment of
interest and principal sums |
Fairly Large |
|
41-55 |
Ba |
Overall operation is considered normal. Capable to meet normal
commitments. |
Satisfactory |
|
26-40 |
B |
Capability to overcome financial difficulties seems comparatively
below average. |
Small |
|
11-25 |
Ca |
Adverse factors are apparent. Repayment of interest and principal sums
in default or expected to be in default upon maturity |
Limited with full
security |
|
<10 |
C |
Absolute credit risk exists. Caution needed to be exercised |
Credit not
recommended |
|
-- |
NB |
New Business |
-- |
This score serves as a reference to assess SC’s
credit risk and to set the amount of credit to be extended. It is calculated
from a composite of weighted scores obtained from each of the major sections of
this report. The assessed factors and their relative weights (as indicated
through %) are as follows:
Financial
condition (40%) Ownership
background (20%) Payment
record (10%)
Credit history
(10%) Market trend (10%) Operational size
(10%)
This report is issued at your request without any
risk and responsibility on the part of MIRA INFORM PRIVATE LIMITED (MIPL)
or its officials.