MIRA INFORM REPORT
|
Report No. : |
340504 |
|
Report Date : |
16.09.2015 |
IDENTIFICATION DETAILS
|
Name : |
SIAM QUALITY STARCH CO., LTD. |
|
|
|
|
Registered Office : |
38/6 Moo 11,
Pathumthani-Ladlumkaew
Road, T. Kubangluang, A. Ladlumkaew,
Pathumthani 12140 |
|
|
|
|
Country : |
Thailand |
|
|
|
|
Financials (as on) : |
31.12.2014 |
|
|
|
|
Date of Incorporation : |
08.12.1992 |
|
|
|
|
Com. Reg. No.: |
0105535162662 |
|
|
|
|
Legal Form : |
Private Limited Company |
|
|
|
|
Line of Business : |
The subject is
engaged in manufacturing, exporting
and distributing native
and modified tapioca
starches for various
industries, such as
foods, paper, textiles
and adhesive. |
|
|
|
|
No. of Employee : |
300 |
RATING & COMMENTS
|
MIRA’s Rating : |
Ba |
|
RATING |
STATUS |
PROPOSED CREDIT LINE |
|
|
41-55 |
Ba |
Overall operation is considered normal. Capable to meet normal
commitments. |
Satisfactory |
|
Status : |
Satisfactory |
|
Payment Behaviour : |
No complaints |
|
Litigation : |
Clear |
NOTES :
Any query related to this report can be made
on e-mail : infodept@mirainform.com
while quoting report number, name and date.
ECGC Country Risk Classification List – March 31, 2015
|
Country Name |
Previous Rating (31.12.2014) |
Current Rating (31.03.2015) |
|
Thailand |
B1 |
B1 |
|
Risk Category |
ECGC
Classification |
|
Insignificant |
A1 |
|
Low |
A2 |
|
Moderate |
B1 |
|
High |
B2 |
|
Very High |
C1 |
|
Restricted |
C2 |
|
Off-credit |
D |
THAILAND ECONOMIC OVERVIEW
With a well-developed infrastructure, a free-enterprise
economy, and generally pro-investment policies Thailand has historically had a strong
economy due in part to competitive industrial and agriculture exports - mostly
electronics, agricultural commodities, automobiles and parts, and processed
foods. The economy experienced slow growth and declining exports in 2014, in
part due to domestic political turmoil and sluggish global demand. With full
employment, Thailand attracts an estimated 2-4 million migrant workers from
neighboring countries, and faces labor shortages. Following the May 2014 coup
d’�tat, tourism decreased 6-7% but is beginning
to recover. The household debt to GDP ratio is over 80%. The Thai government in
2013 implemented a nation-wide 300 baht ($10) per day minimum wage policy and
deployed new tax reforms designed to lower rates on middle-income earners. The
Thai baht has remained stable.
|
Source
: CIA |
Company
name
SIAM QUALITY
STARCH CO., LTD.
SUMMARY
BUSINESS ADDRESS : 38/6 MOO 11,
PATHUMTHANI-LADLUMKAEW ROAD,
T. KUBANGLUANG,
A. LADLUMKAEW,
PATHUMTHANI 12140,
THAILAND
TELEPHONE
: [66] 2598-3135-8,
2598-1123-9
FAX : [66] 2598-3139,
2598-1130
E-MAIL ADDRESS : info@sqs.co.th
REGISTRATION ADDRESS : SAME AS BUSINESS
ADDRESS
ESTABLISHED : 1992
REGISTRATION NO. : 0105535162662
TAX ID NO. : 3011213568
CAPITAL REGISTERED : BHT.
380,000,000
CAPITAL PAID-UP : BHT.
380,000,000
SHAREHOLDER’S PROPORTION : THAI
: 82.74%
JAPANESE :
17.26%
FISCAL YEAR CLOSING DATE : DECEMBER 31
LEGAL STATUS : PRIVATE LIMITED
COMPANY
EXECUTIVE : MR.
SUMATE SRIVARAKIAT, THAI
MANAGING DIRECTOR
AND FACTORY MANAGER
NO. OF STAFF : 300
LINES OF BUSINESS : TAPIOCA STARCH
MANUFACTURER, DISTRIBUTOR
AND EXPORTER
CORPORATE
PROFILE
OPERATING TREND : STABLE
PRESENT SITUATION : OPERATING NORMALLY
REPUTATION : GOOD
WITH NORMAL BUSINESS
ENGAGEMENT
MANAGEMENT STANDARD : MANAGEMENT
WITH FAIR PERFORMANCE
HISTORY
The subject was
established on December
8, 1992 as
a private limited
company under the
registered name SIAM
QUALITY STARCH CO.,
LTD., by Thai
and Japanese groups,
with the business objective
to manufacture native
and modified starches
to both domestic
and oversea markets.
It currently employs
approximately 300 staff. The
subject is a
member of The Poon
Phol Group of companies.
In 2013, the
subject has been
promoted by Thailand’s
Board of Investment [BOI] to
expand the production capacity to 112,000
tons per annum,
which has been
started since January 2015.
Subject achieved the
quality standard ISO
9001:2000 certificate, as
well as HACCP,
Halal and Kosher
standards under the
brand “Siam Modified
Starch”.
The subject’s registered
address is 38/6
Moo 11,
Pathumthani-Ladlumkaew Rd.,
T. Kubangluang, A.
Ladlumkaew, Pathumthani 12140,
and this is
the subject’s current
operation address.
THE
BOARD OF DIRECTOR
|
Name |
|
Nationality |
Age |
|
|
|
|
|
|
Mr. Sukij Wanglee |
|
Thai |
85 |
|
Mr. Petch Wanglee |
|
Thai |
51 |
|
Mr. Danai-thanit Bisalputra |
|
Thai |
57 |
|
Mr. Sumate Srivarakiat |
|
Thai |
62 |
|
Mr. Weerawat Lertwanawatana |
|
Thai |
63 |
|
Mrs. Puangrut Jirawutitanun |
|
Thai |
50 |
|
Mr. Yoshinobu Matsutani |
|
Japanese |
68 |
|
Mr. Ryo Matsutani |
|
Japanese |
32 |
|
Mr. Eijiro Matsutani |
|
Japanese |
89 |
|
Mr. Natachai Wanglee |
|
Thai |
40 |
|
Mrs. Haruyo Matsutani |
|
Japanese |
62 |
|
Mr. Thamrongrat Bisalputra |
|
Thai |
48 |
|
Mr. Khem Wanglee |
|
Thai |
40 |
AUTHORIZED
PERSON
Two of the
above directors can
jointly sign on
behalf of the
subject with company’s
affixed.
MANAGEMENT
Mr. Sumate Srivarakiat is
the Managing Director
and Factory Manager.
He is Thai
nationality with the
age of 62
years old.
Mr. Weerawat Lertwanawatana is
the Deputy Managing
Director.
He is Thai
nationality with the
age of 63 years old.
Mr. Banlu Siripetch is
the Production Manager.
He is Thai
nationality.
Mr. Khem Wanglee is
the Sales and
Marketing Manager.
He is Thai
nationality with the
age of 40
years old.
BUSINESS
OPERATIONS
The subject is
engaged in manufacturing, exporting
and distributing native
and modified tapioca
starches for various
industries, such as
foods, paper, textiles
and adhesive.
MAJOR
BRAND
“SIAM MODIFIED STARCH”
PRODUCTION
CAPACITY
112,000 tons per
annum [as of
January 1, 2015]
PURCHASE
100% of raw
material mainly tapioca
root and chemicals
are purchased from
local suppliers.
EXPORT
80% of the
products is exported
to U.S.A., Australia,
New Zealand, Canada,
South Africa, and
the countries in
Europe, Asia and
Middle East regions.
SALES
[LOCAL]
20% of the
products is sold
locally to manufacturers
and wholesalers.
MAJOR
CUSTOMERS
Matsutani Chemical Industry
Co., Ltd. : Japan
Siam Modified Starch
Co., Ltd. :
Thailand
Sitthinan Co., Ltd. : Thailand
RELATED
AND AFFILIATED COMPANIES
The Poon Phol
Group of companies,
consist of:
Poon Phol Co.,
Ltd.
Business Type :
Holding company and
distributor of agriculture
products
Siam Modified Starch
Co., Ltd.
Business Type :
Manufacturer and distributor
of modified starch
Pipatanasin Co., Ltd.
Business Type :
Property management
Poonpipat Co., Ltd.
Business Type :
Warehouse rental service
Rangsit Ruampatana Co.,
Ltd.
Business Type :
Owner and operator
of Rangsit fresh
market
Sitthinan Co., Ltd.
Business Type :
Manufacturer and distributor
of quality green
mung
Thanakorn Vegetable Oil
Products Co., Ltd.
Business Type :
Manufacturer and distributor
of vegetable oil
LITIGATION
Bankruptcy and Receivership
There are no
litigation on bankruptcy
and receivership cases
filed against the
subject found at
Legal Execution Department
for the past
five years.
Others
There are no
legal suits filed
against the subject
for the past
two years.
CREDIT
Sales are by
cash or on
the credits term
of 30-60 days.
Local bills are
paid by cash
or on the
credits term of
30-60 days.
Exports are against
T/T.
BANKING
Bangkok Bank Public
Co., Ltd.
EMPLOYMENT
The subject employs
approximately 300 staff
comprising:
Pathumthani factory :
100 staff
Chaiyaphum factory :
200 staff
LOCATION
DETAILS
The premise is
owned for administrative office,
factory I and warehouse
at the heading
address. Premise is
located in provincial.
The factory II
is located at 222-223 Moo
10, Suranarai Rd.,
T. Kokrerngrom,
A. Bamnetnarong, Chaiyaphum 36160.
Tel : [66] 44
815-555, Fax :
[66] 44 815-550.
COMMENT
The subject was
formed in 1992
as a manufacturer,
distributor and exporter
of tapioca starch. The
products are for
various industries. Its
business performance is
related to the
growth and improvement
of various industries
such as foods,
paper and etc.
Subject reported moderate
business in 2014,
meanwhile its current
business remains promising.
NOTE
Refer to your
given name “Shiam
Quality Starch Co.,
Ltd.”, please be
informed that, the
correct name is
“Siam Quality Starch
Co., Ltd.”
FINANCIAL
INFORMATION
The capital was
registered at Bht.
100,000,000 divided into
1,000,000 shares of
Bht. 100 each.
The capital was
increased later as
following:
Bht. 150,000,000 on
July 7, 1993
Bht. 180,000,000 on
April 23, 1996
Bht. 380,000,000 on September 6,
2005
The latest registered capital
was increased to Bht. 380 million,
divided into 3,800,000 shares
of Bht. 100
each with fully
paid.
THE
SHAREHOLDERS LISTED WERE
[as at
April 30, 2015]
|
NAME |
HOLDING |
% |
|
|
|
|
|
Poon Phol Co.,
Ltd. Nationality: Thai Address : 90/54-57
North Sathorn Rd.,
Silom,
Bangrak, Bangkok |
950,000 |
25.00 |
|
Pipatanasin Co., Ltd. Nationality: Thai Address : 90/54-57
North Sathorn Rd.,
Silom,
Bangrak, Bangkok |
950,000 |
25.00 |
|
Siam Modified Starch
Co., Ltd. Nationality: Thai Address : 90/54-57
North Sathorn Rd.,
Silom,
Bangrak, Bangkok |
494,462 |
13.01 |
|
Matsutani Europe B.V. Nationality: Japanese Address : Amsterdam,
The Netherlands |
463,714 |
12.20 |
|
Sitthinan Co., Ltd. Nationality: Thai Address : 90/54-57
North Sathorn Rd.,
Silom,
Bangrak, Bangkok |
411,233 |
10.82 |
|
Matsutani Co., Ltd. Nationality: Japanese Address : 5-3
Kita-Itami, Itami City,
Hyogo, Japan |
192,000 |
5.05 |
|
Poonpipat Co., Ltd. Nationality: Thai Address : 90/54-57
North Sathorn Rd.,
Silom, Bangrak, Bangkok |
177,834 |
4.68 |
|
P P M Holding Co.,
Ltd. Nationality: Thai Address : 90/54-57
North Sathorn Rd.,
Silom,
Bangrak, Bangkok |
160,757 |
4.24 |
Total Shareholders : 8
Share Structure
[as at April
30, 2015]
|
Nationality |
Shareholders |
No. of Share |
% Shares |
|
|
|
|
|
|
Thai |
6 |
3,144,286 |
82.74 |
|
Foreign - Japanese |
2 |
655,714 |
17.26 |
|
Total |
8 |
3,800,000 |
100.00 |
NAME
OF AUDITOR & CERTIFIED PUBLIC ACCOUNTANT NO.
Ms. Krongkaew Limkittikul No.
5874
BALANCE
SHEET [BAHT]
The latest financial
figures published for December 31, 2014,
2013 & 2012 were:
ASSETS
|
Current Assets |
2014 |
2013 |
2012 |
|
|
|
|
|
|
Cash and Cash Equivalents |
1,642,608 |
5,052,462 |
400,646 |
|
Trade Accounts & Other Receivable |
325,709,321 |
431,164,087 |
358,280,108 |
|
Short-term Loan to Subsidiaries |
50,000,000 |
- |
- |
|
Inventories |
1,000,159,899 |
625,108,302 |
627,210,683 |
|
Other Current Assets
|
11,728,545 |
7,663,344 |
9,773,670 |
|
|
|
|
|
|
Total Current Assets
|
1,389,240,373 |
1,068,988,195 |
995,665,107 |
|
Investment in Subsidiaries |
39,999,700 |
39,999,700 |
- |
|
Fixed Assets |
1,190,105,806 |
1,218,802,819 |
1,217,456,965 |
|
Intangible Assets |
13,619,443 |
15,403,783 |
17,435,635 |
|
Deposits |
119,518 |
511,519 |
511,238 |
|
Total Assets |
2,633,084,840 |
2,343,706,016 |
2,231,068,945 |
LIABILITIES &
SHAREHOLDERS’ EQUITY [BAHT]
|
Current
Liabilities |
2014 |
2013 |
2012 |
|
|
|
|
|
|
Bank Overdraft & Short-term Loan from Financial Institutions |
1,076,242,118 |
860,567,307 |
898,969,390 |
|
Trade Accounts &
Other Payable |
192,840,691 |
225,335,273 |
206,078,065 |
|
Other Current Liabilities |
16,761,309 |
14,505,326 |
15,122,722 |
|
|
|
|
|
|
Total Current Liabilities |
1,285,844,118 |
1,100,407,906 |
1,120,170,177 |
|
|
|
|
|
|
Reserve for Employee’s Benefit |
12,623,650 |
8,766,750 |
7,821,550 |
|
Total Liabilities |
1,298,467,768 |
1,109,174,656 |
1,127,991,727 |
|
|
|
|
|
|
Shareholders' Equity |
|
|
|
|
|
|
|
|
|
Share capital : Baht 100
value authorized and
issued share capital
3,800,000 shares |
380,000,000 |
380,000,000 |
380,000,000 |
|
|
|
|
|
|
Capital Paid |
380,000,000 |
380,000,000 |
380,000,000 |
|
Premium on Share Capital |
30,000,000 |
30,000,000 |
30,000,000 |
|
Retained Earning Appropriated for Statutory
Reserve |
38,000,000 |
38,000,000 |
38,000,000 |
|
Unappropriated |
886,617,072 |
786,531,360 |
655,077,218 |
|
Total Shareholders' Equity |
1,334,617,072 |
1,234,531,360 |
1,103,077,218 |
|
Total Liabilities &
Shareholders' Equity |
2,633,084,840 |
2,343,706,016 |
2,231,068,945 |
PROFIT
& LOSS ACCOUNT
|
Revenue |
2014 |
2013 |
2012 |
|
|
|
|
|
|
Sales |
3,272,955,359 |
3,325,674,115 |
3,178,235,185 |
|
Gain on Exchange Rate |
1,579,684 |
6,704,552 |
2,937,661 |
|
Other Income |
85,611,936 |
92,330,708 |
75,320,731 |
|
Total Revenues |
3,360,146,979 |
3,424,709,375 |
3,256,493,577 |
|
Expenses |
|
|
|
|
|
|
|
|
|
Cost of Goods
Sold |
2,568,214,995 |
2,573,504,211 |
2,409,338,859 |
|
Selling Expenses |
287,476,151 |
285,985,673 |
271,420,669 |
|
Administrative Expenses |
314,541,351 |
333,302,048 |
304,962,366 |
|
Total Expenses |
3,170,232,497 |
3,192,791,932 |
2,985,721,894 |
|
|
|
|
|
|
Profit before Financial Expenses |
189,914,482 |
231,917,443 |
270,771,683 |
|
Financial Expenses |
[21,428,770] |
[24,463,301] |
[31,330,602] |
|
Net Profit / [Loss] |
168,485,712 |
207,454,142 |
239,441,081 |
FINANCIAL
ANALYSIS
|
ITEM |
UNIT |
2014 |
2013 |
2012 |
|
|
|
|
|
|
|
LIQUIDITY RATIO |
|
|
|
|
|
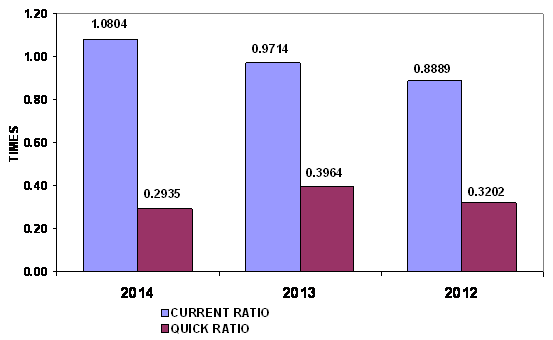
CURRENT RATIO |
TIMES |
1.08 |
0.97 |
0.89 |
|
QUICK RATIO |
TIMES |
0.29 |
0.40 |
0.32 |
|
|
|
|
|
|
|
ACTIVITY RATIO |
|
|
|
|
|
FIXED ASSETS TURNOVER |
TIMES |
2.75 |
2.73 |
2.61 |
|
TOTAL ASSETS TURNOVER |
TIMES |
1.24 |
1.42 |
1.42 |
|
INVENTORY CONVERSION PERIOD |
DAYS |
142.14 |
88.66 |
95.02 |
|
INVENTORY TURNOVER |
TIMES |
2.57 |
4.12 |
3.84 |
|
RECEIVABLES CONVERSION PERIOD |
DAYS |
36.32 |
47.32 |
41.15 |
|
RECEIVABLES TURNOVER |
TIMES |
10.05 |
7.71 |
8.87 |
|
PAYABLES CONVERSION PERIOD |
DAYS |
27.41 |
31.96 |
31.22 |
|
CASH CONVERSION CYCLE |
DAYS |
151.06 |
104.02 |
104.95 |
|
|
|
|
|
|
|
PROFITABILITY RATIO |
|
|
|
|
|
COST OF GOODS SOLD |
% |
78.47 |
77.38 |
75.81 |
|
SELLING & ADMINISTRATION |
% |
18.39 |
18.62 |
18.14 |
|
INTEREST |
% |
0.65 |
0.74 |
0.99 |
|
GROSS PROFIT MARGIN |
% |
24.20 |
25.59 |
26.65 |
|
NET PROFIT MARGIN BEFORE EX. ITEM |
% |
5.80 |
6.97 |
8.52 |
|
NET PROFIT MARGIN |
% |
5.15 |
6.24 |
7.53 |
|
RETURN ON EQUITY |
% |
12.62 |
16.80 |
21.71 |
|
RETURN ON ASSET |
% |
6.40 |
8.85 |
10.73 |
|
EARNING PER SHARE |
BAHT |
44.34 |
54.59 |
63.01 |
|
|
|
|
|
|
|
LEVERAGE RATIO |
|
|
|
|
|
DEBT RATIO |
TIMES |
0.49 |
0.47 |
0.51 |
|
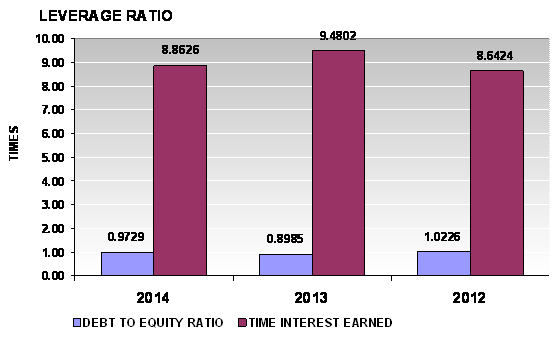
DEBT TO EQUITY RATIO |
TIMES |
0.97 |
0.90 |
1.02 |
|
TIME INTEREST EARNED |
TIMES |
8.86 |
9.48 |
8.64 |
|
|
|
|
|
|
|
ANNUAL GROWTH |
|
|
|
|
|
SALES GROWTH |
% |
(1.59) |
4.64 |
|
|
OPERATING PROFIT |
% |
(18.11) |
(14.35) |
|
|
NET PROFIT |
% |
(18.78) |
(13.36) |
|
|
FIXED ASSETS |
% |
(2.35) |
0.11 |
|
|
TOTAL ASSETS |
% |
12.35 |
5.05 |
|
ANNUAL GROWTH :
RISKY
An annual sales growth is -1.59%. Turnover has decreased from THB
3,325,674,115.00 in 2013 to THB 3,272,955,359.00 in 2014. While net profit has decreased
from THB 207,454,142.00 in 2013 to THB 168,485,712.00 in 2014. And total assets
has increased from THB 2,343,706,016.00 in 2013 to THB 2,633,084,840.00 in
2014.
PROFITABILITY : IMPRESSIVE

PROFITABILITY
RATIO
|
Gross Profit Margin |
24.20 |
Impressive |
Industrial Average |
12.98 |
|
Net Profit Margin |
5.15 |
Impressive |
Industrial Average |
3.34 |
|
Return on Assets |
6.40 |
Satisfactory |
Industrial Average |
6.60 |
|
Return on Equity |
12.62 |
Satisfactory |
Industrial Average |
14.41 |
Gross Profit Margin used to assess a firm's financial health by
revealing the proportion of money left over from revenues after accounting for
the cost of goods sold. Gross profit margin serves as the source for paying
additional expenses and future savings. The
company’s figure is 24.2%. When
compared with the industry average, the ratio of the company was higher,
indicated that company was more profitable than the same industry.
Net Profit Margin is the indicator of the company's efficiency in that
net profit takes into consideration all expenses of the company. A low profit
margin indicates a low margin of safety, higher risk that a decline in sales
will erase profits and result in a net loss. The company’s
figure is 5.15%, higher figure when compared with those of its average
competitors in the same industry, indicated that business was an efficient operator in a dominant position within its industry.
Return on Assets measures how efficiently profits are being generated
from the assets employed in the business when compared with the ratios of firms
in a similar business. A low ratio in comparison with industry averages
indicates an inefficient use of business assets. When compared with the
industry average, it was lower, the
company's figure is 6.4%.
Return on Equity indicates how profitable a company is by comparing its
net income to its average shareholders' equity, ROE measures how much the
shareholders earned for their investment in the company. When compared with the
industry average, it was lower, the company's figure is 12.62%.
Trend of the average competitors in the same industry for last 5 years
Return on Assets Uptrend
Return on Equity Uptrend
LIQUIDITY : ACCEPTABLE
LIQUIDITY RATIO
|
Current Ratio |
1.08 |
Impressive |
Industrial Average |
1.05 |
|
Quick Ratio |
0.29 |
|
|
|
|
Cash Conversion Cycle |
151.06 |
|
|
|
The Current Ratio is to ascertain whether a company's short-term assets
are readily available to pay off its short-term liabilities. The company's
figure is 1.08 times in 2014, increased from 0.97 times, then it is generally
considered to have good short-term financial strength. When compared with the
industry average, the ratio of the company was higher, indicated that company
was an efficient operator in a dominant position within its industry.
The Quick Ratio is a liquidity indicator that further refines the
current ratio by measuring the amount of the most liquid current assets there
are to cover current liabilities. The company's figure is 0.29 times in 2014,
decreased from 0.4 times, then the company has not enough current assets that
presumably can be quickly converted to cash for pay financial obligations.
The Cash Conversion Cycle measures the number of days a company's cash
is tied up in the production and sales process of its operations and the
benefit from payment terms from its creditors. It meant the company could
survive when no cash inflow was received from sale for 152 days.
Trend of the average competitors in the same industry for last 5 years
Current Ratio Downtrend
LEVERAGE : EXCELLENT

LEVERAGE RATIO
|
Debt Ratio |
0.49 |
Impressive |
Industrial Average |
0.54 |
|
Debt to Equity Ratio |
0.97 |
Impressive |
Industrial Average |
1.18 |
|
Times Interest Earned |
8.86 |
Impressive |
Industrial Average |
- |
Debt to Equity Ratio a measurement of how much suppliers, lenders,
creditors and obligors have committed to the company versus what the shareholders
have committed. A lower the percentage means that the company is using less
leverage and has a stronger equity position.
Times Interest Earned measuring a company's ability to meet its debt
obligations. Ratio is 8.87 higher than 1, so the company can pay interest
expenses on outstanding debt.
Debt Ratio shows the proportion of a company's assets which are financed
through debt. The company's figure is 0.49 less than 0.5, most of the company's
assets are financed through equity.
Trend of the average competitors in the same industry for last 5 years
Debt Ratio Uptrend
Times Interest Earned Stable
ACTIVITY : SATISFACTORY
ACTIVITY RATIO
|
Fixed Assets Turnover |
2.75 |
Impressive |
Industrial Average |
- |
|
Total Assets Turnover |
1.24 |
Acceptable |
Industrial Average |
1.97 |
|
Inventory Conversion Period |
142.14 |
|
|
|
|
Inventory Turnover |
2.57 |
Deteriorated |
Industrial Average |
5.24 |
|
Receivables Conversion Period |
36.32 |
|
|
|
|
Receivables Turnover |
10.05 |
Impressive |
Industrial Average |
9.14 |
|
Payables Conversion Period |
27.41 |
|
|
|
The company's Account Receivable Ratio is calculated as 10.05 and 7.71 in
2014 and 2013 respectively. This ratio measures the efficiency of the company
in managing its trade debtors to generate revenue. A lower ratio may indicate
over extension and collection problems. Conversely, a higher ratio may indicate
an overtly stringent policy. In this case, the company's A/R ratio in 2014
increased from 2013. This would suggest the company had good performance in the
management of its debt collections.
Inventory Turnover in Days Ratio indicates the liquidity of inventory. It
estimates the number of days that it will take to sell the current inventory.
Inventory is particularly sensitive to change in business activities. The
inventory turnover in days has increased from 89 days at the end of 2013 to 142
days at the end of 2014. This represents a negative trend. And Inventory
turnover has decreased from 4.12 times in year 2013 to 2.57 times in year 2014.
The company's Total Asset Turnover is calculated as 1.24 times and 1.42
times in 2014 and 2013 respectively. This ratio is determined by dividing total
assets into total sales turnover. The ratio measures the activity of the assets
and the ability of the firm to generate sales through the use of the assets.
Trend of the average competitors in the same industry for last 5 years
Fixed Assets Turnover Stable
Total Assets Turnover Uptrend
Inventory Turnover Uptrend
Receivables Turnover Uptrend
FOREIGN EXCHANGE RATES
|
Currency |
Unit
|
Indian Rupees |
|
US Dollar |
1 |
Rs.66.44 |
|
|
1 |
Rs.102.41 |
|
Euro |
1 |
Rs.75.05 |
INFORMATION DETAILS
|
Analysis Done by
: |
KAS |
|
|
|
|
Report Prepared
by : |
SDA |
RATING EXPLANATIONS
|
RATING |
STATUS |
PROPOSED CREDIT LINE |
|
|
>86 |
Aaa |
Possesses an extremely sound financial base with the strongest capability
for timely payment of interest and principal sums |
Unlimited |
|
71-85 |
Aa |
Possesses adequate working capital. No caution needed for credit
transaction. It has above average (strong) capability for payment of interest
and principal sums |
Large |
|
56-70 |
A |
Financial & operational base are regarded healthy. General
unfavourable factors will not cause fatal effect. Satisfactory capability for
payment of interest and principal sums |
Fairly Large |
|
41-55 |
Ba |
Overall operation
is considered normal. Capable to meet normal commitments. |
Satisfactory |
|
26-40 |
B |
Capability to overcome financial difficulties seems comparatively
below average. |
Small |
|
11-25 |
Ca |
Adverse factors are apparent. Repayment of interest and principal sums
in default or expected to be in default upon maturity |
Limited with
full security |
|
<10 |
C |
Absolute credit risk exists. Caution needed to be exercised |
Credit not
recommended |
|
-- |
NB |
New Business |
-- |
This score serves as a reference to assess
SC’s credit risk and to set the amount of credit to be extended. It is calculated
from a composite of weighted scores obtained from each of the major sections of
this report. The assessed factors and their relative weights (as indicated
through %) are as follows:
Financial
condition (40%) Ownership
background (20%) Payment record
(10%)
Credit history
(10%) Market trend (10%) Operational size
(10%)
This report is issued at your request without any
risk and responsibility on the part of MIRA INFORM PRIVATE LIMITED (MIPL)
or its officials.