MIRA INFORM REPORT
|
Report No. : |
341075 |
|
Report Date : |
19.09.2015 |
IDENTIFICATION DETAILS
|
Name : |
THAI SHIPPINGWALA LOGISTICS CO., LTD. |
|
|
|
|
Registered Office : |
222/176/1 Soi Kanchanapisek 22, Kanchanapisek Road, Sapansung, Bangkok 10240 |
|
|
|
|
Country : |
Thailand |
|
|
|
|
Financials (as on) : |
31.12.2014 |
|
|
|
|
Date of Incorporation : |
20.06.2014 |
|
|
|
|
Com. Reg. No.: |
0105557087477 |
|
|
|
|
Legal Form : |
Private Limited Company |
|
|
|
|
Line of Business : |
Providing Logistics and Freight Forwarding
Services. |
|
|
|
|
No. of Employees : |
4 |
RATING & COMMENTS
|
MIRA’s Rating : |
B |
|
RATING |
STATUS |
PROPOSED CREDIT LINE |
|
|
26-40 |
B |
Capability to overcome financial difficulties seems comparatively
below average. |
Small |
|
Status : |
Moderate |
|
|
|
|
Payment Behaviour : |
Slow but correct |
|
|
|
|
Litigation : |
Clear |
NOTES:
Any query related to this report can be made on
e-mail: infodept@mirainform.com
while quoting report number, name and date.
ECGC Country Risk Classification List – March 31, 2015
|
Country Name |
Previous Rating (31.12.2014) |
Current Rating (31.03.2015) |
|
Thailand |
A2 |
A2 |
|
Risk Category |
ECGC
Classification |
|
Insignificant |
A1 |
|
Low |
A2 |
|
Moderate |
B1 |
|
High |
B2 |
|
Very High |
C1 |
|
Restricted |
C2 |
|
Off-credit |
D |
THAILAND - ECONOMIC OVERVIEW
With a well-developed infrastructure, a free-enterprise
economy, and generally pro-investment policies Thailand has historically had a
strong economy due in part to competitive industrial and agriculture exports -
mostly electronics, agricultural commodities, automobiles and parts, and
processed foods. The economy experienced slow growth and declining exports in
2014, in part due to domestic political turmoil and sluggish global demand.
With full employment, Thailand attracts an estimated 2-4 million migrant
workers from neighboring countries, and faces labor shortages. Following the
May 2014 coup d’tat, tourism decreased 6-7% but is beginning to recover. The
household debt to GDP ratio is over 80%. The Thai government in 2013
implemented a nation-wide 300 baht ($10) per day minimum wage policy and
deployed new tax reforms designed to lower rates on middle-income earners. The
Thai baht has remained stable.
|
Source
: CIA |
Company
Name and Address
THAI SHIPPINGWALA LOGISTICS CO., LTD.
SUMMARY
BUSINESS ADDRESS : 222/176/1 SOI
KANCHANAPISEK 22,
KANCHANAPISEK ROAD,
SAPANSUNG,
BANGKOK 10240,
THAILAND
TELEPHONE : [66] 2735-7100
FAX :
[66] 2735-7650
E-MAIL
ADDRESS : -
REGISTRATION
ADDRESS : SAME
AS BUSINESS ADDRESS
ESTABLISHED
: 2014
REGISTRATION
NO. : 0105557087477
TAX
ID NO. : 3036535690
CAPITAL REGISTERED : BHT. 2,000,000
CAPITAL PAID-UP : BHT.
2,000,000
SHAREHOLDER’S PROPORTION : THAI : 67.00%
PAKISTANI :
33.00%
FISCAL YEAR CLOSING DATE : DECEMBER 31
LEGAL
STATUS : PRIVATE LIMITED
COMPANY
EXECUTIVE : MRS.
ARISARA AKHUNKHEL, THAI
MANAGING DIRECTOR
NO.
OF STAFF : 4
LINES
OF BUSINESS : LOGISTICS AND
FREIGHT FORWARDING
SERVICES
CORPORATE
PROFILE
OPERATING
TREND : STABLE
PRESENT
SITUATION : OPERATING NORMALLY
REPUTATION : FAIR
WITH NORMAL BUSINESS
ENGAGEMENT
MANAGEMENT
STANDARD : MANAGEMENT WITH
FAIR PERFORMANCE
HISTORY
The
subject was established
on June 20, 2014
as a private
limited company under
the registered name THAI
SHIPPINGWALA LOGISTICS CO.,
LTD., by Thai and
Pakistani groups, with the business objective
to provide logistics
and freight forwarding
services. It currently
employs 4 staff.
The
subject’s registered address is
222/176/1 Soi Kanchanapisek 22,
Kanchanapisek Road,
Sapansung, Bangkok 10240,
and this is
the subject’s current
operation address.
THE
BOARD OF DIRECTOR
|
Name |
|
Nationality |
Age |
|
|
|
|
|
|
Mrs. Arisara Akhunkhel |
|
Thai |
35 |
|
Mr. Anucha Saengbumrung |
|
Thai |
30 |
|
Mr. Noor Nabi Akhunkhel |
|
Pakistani |
- |
AUTHORIZED
PERSON
Anyone of the
above directors can
sign on behalf
of the subject
with company’s affixed.
MANAGEMENT
Mrs. Arisara Akhunkhel is
the Managing Director.
She is Thai
nationality with the
age of 35
years old.
BUSINESS
OPERATIONS
The subject
is engaged in
providing wide range
of logistics and freight
forwarding services, including
customs clearance, shipping,
import and export
agent and etc.
PURCHASE
100% of purchasing
is from local
suppliers.
SERVICES
The services have
been served locally
to end-users.
SUBSIDIARY
AND AFFILIATED COMPANY
The subject is
not found to
have any subsidiary
or affiliated company
here in Thailand.
LITIGATION
Bankruptcy and Receivership
There are no
litigation on bankruptcy
and receivership cases
filed against the
subject found at
Legal Execution Department for
the past five
years.
Others
There are no
legal suits filed
against the subject
according the past
two years.
CREDIT
Services are by
cash or on
the credits term
of 30-60 days.
Local bills are
paid by cash
or on the
credits term of
30-60 days.
BANKING
The
banker’s name was
not disclosed.
EMPLOYMENT
The
subject currently employs
4 staff.
LOCATION
DETAILS
The
premise is rent for administrative office
at the heading
address. Premise is
located in commercial/residential area.
COMMENT
The
subject was established
in June 2014.
Its first year
operation was reported
at low level.
Subject is a
small logistics operator
which growth is
expected at a
slow pace.
FINANCIAL
INFORMATION
The
capital was registered at Bht. 2,000,000
divided into 20,000 shares of
Bht. 100 each with
fully paid.
THE
SHAREHOLDERS LISTED WERE
: [as at
April 30, 2015]
|
NAME |
HOLDING |
% |
|
|
|
|
|
Mrs. Arisara Akhunkhel Nationality: Thai Address : 108/43
Moo 4, T. Naimuang, A. Muang, Khon
Kaen |
6,800 |
34.00 |
|
Mr. Anucha Saengbumrung Nationality: Thai Address : 108/43
Moo 4, T. Naimuang, A. Muang, Khon
Kaen |
6,600 |
33.00 |
|
Mr. Noor Nabi Akhunkhel Nationality: Pakistani Address : 222/176
Soi Kanchanapisek 22,
Kanchanapisek Road, Sapansung,
Bangkok |
6,600 |
33.00 |
Total Shareholders : 3
Share Structure [as
at April 30,
2015]
|
Nationality |
Shareholders |
No. of Share |
% Shares |
|
|
|
|
|
|
Thai |
2 |
13,400 |
67.00 |
|
Foreign - Pakistani |
1 |
6,600 |
33.00 |
|
Total |
3 |
20,000 |
100.00 |
NAME OF AUDITOR
& CERTIFIED PUBLIC
ACCOUNTANT NO. :
Ms. Intiraporn
Charoensingkorn No. 8582
BALANCE
SHEET [BAHT]
The
latest financial figures
published for December
31, 2014 was :
ASSETS
|
Current Assets |
2014 |
|
|
|
|
Cash and Cash Equivalents
|
1,737,012.91 |
|
Other Current Assets
|
59.50 |
|
|
|
|
Total Current Assets
|
1,737,072.41 |
|
Total Assets |
1,737,072.41 |
LIABILITIES &
SHAREHOLDERS' EQUITY [BAHT]
|
Current
Liabilities |
2014 |
|
|
|
|
Other Current Liabilities |
21,265.60 |
|
|
|
|
Total Current Liabilities |
21,265.60 |
|
Total Liabilities |
21,265.60 |
|
|
|
|
Shareholders' Equity |
|
|
|
|
|
Share capital : Baht 100
value authorized and
issued share capital
20,000 shares |
2,000,000.00 |
|
|
|
|
Capital Paid |
2,000,000.00 |
|
Retained Earning -
Unappropriated [Deficit] |
[284,193.19] |
|
Total Shareholders' Equity |
1,715,806.81 |
|
Total Liabilities & Shareholders' Equity |
1,737,072.41 |
PROFIT
& LOSS ACCOUNT
|
Revenue |
June 30,
2014 - Dec. 31, 2014 |
|
|
|
|
Sales Income |
900,240.00 |
|
Total Revenues |
900,240.00 |
|
Expenses |
|
|
|
|
|
Cost of Goods
Sold |
823,793.46 |
|
Administrative Expenses |
360,639.73 |
|
Total Expenses |
1,184,433.19 |
|
|
|
|
Profit / [Loss] before Income Tax
|
[284,193.19] |
|
Income Tax |
- |
|
Net Profit / [Loss] |
[284,193.19] |
FINANCIAL
ANALYSIS
|
ITEM |
UNIT |
2014 |
|
|
|
|
|
LIQUIDITY RATIO |
|
|
|
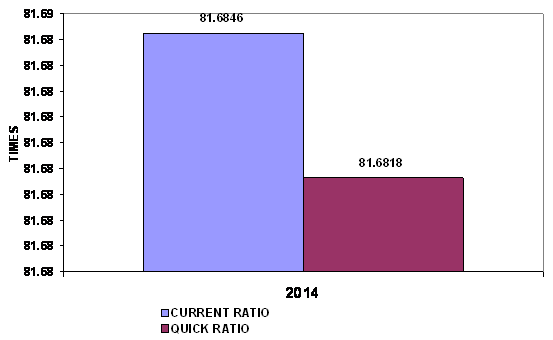
CURRENT RATIO |
TIMES |
81.68 |
|
QUICK RATIO |
TIMES |
81.68 |
|
|
|
|
|
ACTIVITY RATIO |
|
|
|
FIXED ASSETS TURNOVER |
TIMES |
- |
|
TOTAL ASSETS TURNOVER |
TIMES |
0.52 |
|
INVENTORY CONVERSION PERIOD |
DAYS |
- |
|
INVENTORY TURNOVER |
TIMES |
- |
|
RECEIVABLES CONVERSION PERIOD |
DAYS |
- |
|
RECEIVABLES TURNOVER |
TIMES |
- |
|
PAYABLES CONVERSION PERIOD |
DAYS |
- |
|
CASH CONVERSION CYCLE |
DAYS |
- |
|
|
|
|
|
PROFITABILITY
RATIO |
|
|
|
COST OF GOODS SOLD |
% |
91.51 |
|
SELLING & ADMINISTRATION |
% |
40.06 |
|
INTEREST |
% |
- |
|
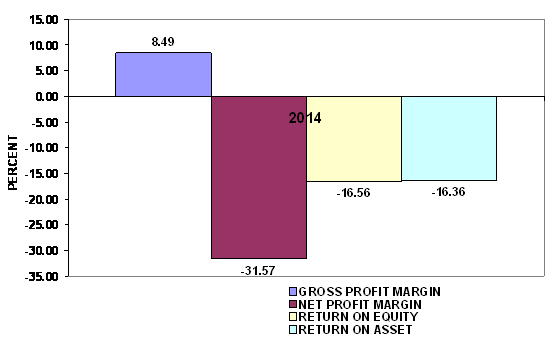
GROSS PROFIT MARGIN |
% |
8.49 |
|
NET PROFIT MARGIN BEFORE EX. ITEM |
% |
(31.57) |
|
NET PROFIT MARGIN |
% |
(31.57) |
|
RETURN ON EQUITY |
% |
(16.56) |
|
RETURN ON ASSET |
% |
(16.36) |
|
EARNING PER SHARE |
BAHT |
(14.21) |
|
|
|
|
|
LEVERAGE RATIO |
|
|
|
DEBT RATIO |
TIMES |
0.01 |
|
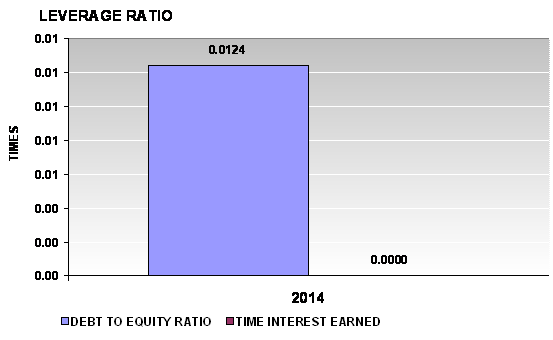
DEBT TO EQUITY RATIO |
TIMES |
0.01 |
|
TIME INTEREST EARNED |
TIMES |
- |
PROFITABILITY:
RISKY
PROFITABILITY
RATIO
|
Gross Profit Margin |
8.49 |
Deteriorated |
Industrial
Average |
100.32 |
|
Net Profit Margin |
(31.57) |
Deteriorated |
Industrial
Average |
6.11 |
|
Return on Assets |
(16.36) |
Deteriorated |
Industrial
Average |
9.23 |
|
Return on Equity |
(16.56) |
Deteriorated |
Industrial
Average |
22.07 |
Gross Profit Margin used to assess a firm's financial health by revealing
the proportion of money left over from revenues after accounting for the cost
of goods sold. Gross profit margin serves as the source for paying additional
expenses and future savings. The company's figure is 8.49%. When compared with
the industry average, the ratio of the company was lower. This indicated that
company may have problems with control over its costs.
Net Profit Margin is the indicator of the company's efficiency in that
net profit takes into consideration all expenses of the company. A low profit
margin indicates a low margin of safety, higher risk that a decline in sales
will erase profits and result in a net loss. The company's figure is -31.57%.
When compared with the industry average, the ratio of the company was lower.
Return on Assets measures how efficiently profits are being generated
from the assets employed in the business when compared with the ratios of firms
in a similar business. A low ratio in comparison with industry averages
indicates an inefficient use of business assets. When compared with the
industry average, it was lower, the company's figure is -16.36%.
Return on Equity indicates how profitable a company is by comparing its
net income to its average shareholders' equity, ROE measures how much the
shareholders earned for their investment in the company. When compared with the
industry average, it was lower, the company's figure is -16.56%.
Trend of the
average competitors in the same industry for last 5 years
Return on Assets Uptrend
Return on Equity Uptrend
LIQUIDITY :
SATISFACTORY
LIQUIDITY RATIO
|
Current Ratio |
81.68 |
Impressive |
Industrial
Average |
2.21 |
|
Quick Ratio |
81.68 |
|
|
|
|
Cash Conversion Cycle |
- |
|
|
|
The Current Ratio is to ascertain whether a company's short-term assets
are readily available to pay off its short-term liabilities. The company's
figure is 81.68 times in 2014, increased from 0 times, then it is generally
considered to have good short-term financial strength. When compared with the
industry average, the ratio of the company was higher, indicated that company
was an efficient operator in a dominant position within its industry.
The Quick Ratio is a liquidity indicator that further refines the
current ratio by measuring the amount of the most liquid current assets there
are to cover current liabilities. The company's figure is 81.68 times in 2014,
increased from 0 times, although excluding inventory so the company still have
good short-term financial strength.
Trend of the
average competitors in the same industry for last 5 years
Current Ratio Uptrend
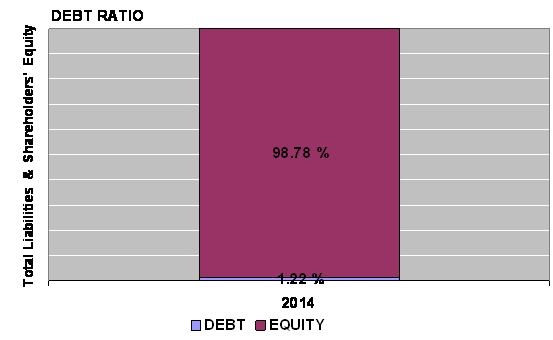
LEVERAGE :
EXCELLENT
LEVERAGE RATIO
|
Debt Ratio |
0.01 |
Impressive |
Industrial
Average |
0.60 |
|
Debt to Equity Ratio |
0.01 |
Impressive |
Industrial
Average |
1.48 |
|
Times Interest Earned |
- |
|
Industrial
Average |
- |
Debt to Equity Ratio a measurement of how much suppliers, lenders,
creditors and obligors have committed to the company versus what the
shareholders have committed. A lower the percentage means that the company is
using less leverage and has a stronger equity position.
Debt Ratio shows the proportion of a company's assets which are financed
through debt. The company's figure is 0.01 less than 0.5, most of the company's
assets are financed through equity.
Trend of the
average competitors in the same industry for last 5 years
Debt Ratio Uptrend
Times Interest Earned Stable
ACTIVITY : RISKY
ACTIVITY RATIO
|
Fixed Assets Turnover |
- |
|
Industrial
Average |
- |
|
Total Assets Turnover |
0.52 |
Deteriorated |
Industrial
Average |
1.50 |
|
Inventory Conversion Period |
- |
|
|
|
|
Inventory Turnover |
- |
|
Industrial
Average |
7.04 |
|
Receivables Conversion Period |
- |
|
|
|
|
Receivables Turnover |
- |
|
Industrial
Average |
5.20 |
|
Payables Conversion Period |
- |
|
|
|
The company's Total Asset Turnover is calculated as 0.52 times and 0
times in 2014 and 0 respectively. This ratio is determined by dividing total
assets into total sales turnover. The ratio measures the activity of the assets
and the ability of the firm to generate sales through the use of the assets.
Trend of the
average competitors in the same industry for last 5 years
Fixed Assets Turnover Stable
Total Assets Turnover Downtrend
Inventory Turnover Downtrend
Receivables Turnover Uptrend
FOREIGN EXCHANGE RATES
|
Currency |
Unit
|
Indian Rupees |
|
US Dollar |
1 |
Rs.65.93 |
|
|
1 |
Rs.102.75 |
|
Euro |
1 |
Rs.75.13 |
INFORMATION DETAILS
|
Analysis Done by
: |
KIN |
|
|
|
|
Report Prepared
by : |
NIT |
RATING EXPLANATIONS
|
RATING |
STATUS |
PROPOSED CREDIT LINE |
|
|
|
>86 |
Aaa |
Possesses an extremely sound financial base with the strongest
capability for timely payment of interest and principal sums |
Unlimited |
|
|
71-85 |
Aa |
Possesses adequate working capital. No caution needed for credit
transaction. It has above average (strong) capability for payment of interest
and principal sums |
Large |
|
|
56-70 |
A |
Financial & operational base are regarded healthy. General unfavourable
factors will not cause fatal effect. Satisfactory capability for payment of
interest and principal sums |
Fairly Large |
|
|
41-55 |
Ba |
Overall operation is considered normal. Capable to meet normal
commitments. |
Satisfactory |
|
|
26-40 |
B |
Capability to overcome financial difficulties seems comparatively
below average. |
Small |
|
|
11-25 |
Ca |
Adverse factors are apparent. Repayment of interest and principal sums
in default or expected to be in default upon maturity |
Limited with
full security |
|
|
<10 |
C |
Absolute credit risk exists. Caution needed to be exercised |
Credit not
recommended |
|
|
-- |
NB |
New Business |
-- |
|
This score serves as a reference to assess SC’s
credit risk and to set the amount of credit to be extended. It is calculated
from a composite of weighted scores obtained from each of the major sections of
this report. The assessed factors and their relative weights (as indicated
through %) are as follows:
Financial
condition (40%) Ownership
background (20%) Payment
record (10%)
Credit history
(10%) Market trend (10%) Operational size
(10%)
This report is issued at your request without any
risk and responsibility on the part of MIRA INFORM PRIVATE LIMITED (MIPL) or
its officials.