MIRA INFORM REPORT
|
Report No. : |
341811 |
|
Report Date : |
22.09.2015 |
IDENTIFICATION DETAILS
|
Name : |
ARTEK-92 OOD |
|
|
|
|
Registered Office : |
J.K. Lyulin, BL.033, VH.G, ET.5, AP.10 1000 Sofia |
|
|
|
|
Country : |
Bulgaria |
|
|
|
|
Financials (as on) : |
31.12.2014 |
|
|
|
|
Year of Establishment : |
2001 |
|
|
|
|
Legal Form : |
Limited Liability Company
(OOD) |
|
|
|
|
Line of Business : |
|
|
|
|
|
No. of Employees : |
38 |
RATING & COMMENTS
|
MIRA’s Rating : |
Ba |
|
RATING |
STATUS |
PROPOSED CREDIT LINE |
|
|
41-55 |
Ba |
Overall operation is considered normal. Capable to meet normal
commitments. |
Satisfactory |
|
Status : |
Satisfactory |
|
|
|
|
Payment Behaviour : |
No Complaints |
|
|
|
|
Litigation : |
Clear |
NOTES:
Any query related to this report can be made on
e-mail: infodept@mirainform.com
while quoting report number, name and date.
ECGC Country Risk Classification List – March 31, 2015
|
Country Name |
Previous Rating (31.12.2014) |
Current Rating (31.03.2015) |
|
Bulgaria |
A2 |
A2 |
|
Risk Category |
ECGC
Classification |
|
Insignificant |
A1 |
|
Low |
A2 |
|
Moderate |
B1 |
|
High |
B2 |
|
Very High |
C1 |
|
Restricted |
C2 |
|
Off-credit |
D |
BULGARIA - ECONOMIC OVERVIEW
Bulgaria, a former Communist country that entered the EU on 1 January 2007, averaged more than 6% annual growth from 2004 to 2008, driven by significant amounts of bank lending, consumption, and foreign direct investment. Successive governments have demonstrated a commitment to economic reforms and responsible fiscal planning, but the global downturn sharply reduced domestic demand, exports, capital inflows, and industrial production. GDP contracted by 5.5% in 2009, and has been slow to recover in the years since. Despite having a favorable investment regime, including low, flat corporate income taxes, significant challenges remain. Corruption in public administration, a weak judiciary, and the presence of organized crime continue to hamper the country's investment climate and economic prospects.
|
Source
: CIA |
COMPANY
DETAILS
COMPANY DETAILS
Local name: ARTEK-92 OOD
International name: ARTEK-92 LTD
Registered address:
J.K.
Lyulin, Bl.033, Vh.G, Et.5, Ap.10
1000 Sofia
Bulgaria
Telephone: +359 2 9284351
Fax: +359 2 9361204
E-Mail: office@artek-bg.com
Internet: http://www.artek-bg.com
Head office:
ul.Nedelcho
Bonchev 29
1528 Sofia
Bulgaria
Telephone: +359 2 936 12 04, +359 2 928 43 51, +359 887 21 08 71
Fax: +3592 423 84 11
E-Mail: info@artek-bg.com
Internet: http://www.artek-bg.com
Branch office:
bul.
Rojen No. 18
1220 Sofia
Bulgaria
Telephone: +359-2-9294141
Fax: +359-2-9294141
E-Mail: info@dilios.bg
Internet: http://dilios.bg
ESTABLISHMENT & REGISTRATION:
Established:
2001
Registered at Sofia Town Court
Court number 11487/2001
Bulstat/VAT number: 130748285
Status of the company:
Active
LEGAL FORM:
Limited
Liability Company (OOD)
REGISTERED CAPITAL:
BGN
516 000.00
SHAREHOLDERS/MANAGEMENT
SHAREHOLDERS:
|
LYUBOMIRA NIKOLAEVA VASILEVA |
50% |
|
ID
5303080735,nikolaeva@artek-bg.com |
|
|
GEORGI VALENTINOV FILIPOV |
50% |
|
ID
7711206244,george@artek-bg.com |
|
MANAGEMENT:
|
LYUBOMIRA NIKOLAEVA VASILEVA |
- Manager |
|
|
GEORGI VALENTINOV FILIPOV |
- Manager |
RELATED COMPANIES:
|
Company
ID |
Company
Name |
|
131114387 |
ARTEK TEKSTAYLS |
|
130748328 |
GEORGTEKS |
BUSINESS
ACTIVITY
BUSINESS OPERATION:
NACE
1.1: 52.12 Other retail sale in non-specialized stores
Activity:
Artek-92
is the biggest Bulgarian importer of bedding textiles with paid rights. The
company has its own lable DILIOS.
NUMBER OF EMPLOYEES:
|
As
at date |
Value |
|
31.12.2006 |
23 |
|
31.12.2007 |
25 |
|
31.12.2008 |
32 |
|
31.12.2009 |
22 |
|
31.12.2010 |
21 |
|
14.11.2011 |
25 |
|
31.12.2011 |
20 |
|
24.07.2012 |
27 |
|
31.12.2012 |
28 |
|
31.12.2013 |
28 |
|
14.08.2014 |
33 |
|
31.12.2014 |
33 |
|
Latest stand |
38 |

EXPORT:
Italy,
Serbia, Greece
IMPORT:
Hungary,
England, Turkey, Italy
REAL ESTATE:
Offices
are rented.
FINANCIAL
DATA
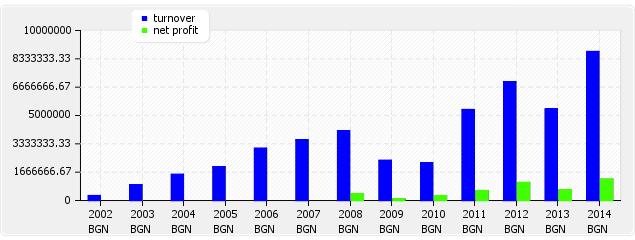
TURNOVER:
|
Year |
Currency |
Value |
|
2002 |
BGN |
288 000.00 |
|
2003 |
BGN |
913 000.00 |
|
2004 |
BGN |
1 542 000.00 |
|
2005 |
BGN |
1 985 000.00 |
|
2006 |
BGN |
3 076 000.00 |
|
2007 |
BGN |
3 565 000.00 |
|
2008 |
BGN |
4 099 000.00 |
|
2009 |
BGN |
2 367 000.00 |
|
2010 |
BGN |
2 214 000.00 |
|
2011 |
BGN |
5 350 000.00 |
|
2012 |
BGN |
6 988 000.00 |
|
2013 |
BGN |
5 383 000.00 |
|
2014 |
BGN |
8 764 000.00 |
MODES OF PAYMENT:
Payments
are made within agreed terms.
DEBT COLLECTION:
No
debt collection cases are registered against the company.
BANK DISTRAINTS:
No
shares of the company are under bank distraint.
UNPAID TAXES/ CONTRIBUTIONS TO GOVERNMENT:
There
is no publication about overdue unpaid taxes.
INVOLVEMENT IN LEGAL DISPUTES:
There
is no publication about legal claims or disputes against the company.
OTHER PAYMENT INFORMATION:
No
adverse payment information is available.
BRANCH INDICATOR:
The
company's payment behaviour is average for the branch.
Exchange
rate since 1998 is 1 BGN (denominated lev) = 0.51 EUR
|
Ratio |
2011 |
2012 |
2013 |
2014 |
|
Accounting
period: |
1.1.2011
- |
1.1.2012
- |
1.1.2013
- |
1.1.2014
- |
|
Debt ratio |
0.48 |
0.37 |
0.43 |
0.48 |
|
Quick ratio |
2.85 |
1.94 |
1.09 |
0.77 |
|
Current ratio |
3.45 |
3.48 |
1.99 |
1.52 |
|
Days purchase in payables |
73.06 |
74.02 |
181.96 |
184.55 |
|
Operating margin in % |
14.59 |
19.73 |
15.60 |
18.72 |
|
Cash ratio (acid ratio) |
0.12 |
0.03 |
0.02 |
0.18 |
|
Return on sales ROS in % |
13.12 |
17.74 |
14.03 |
16.83 |
|
Return on assets ROA in % |
17.02 |
23.50 |
10.25 |
13.87 |
|
Return on equity ROE in % |
32.73 |
37.50 |
17.95 |
26.71 |
|
Days supply in inventory |
44.31 |
114.09 |
162.97 |
138.39 |
|
Days sales in receivables |
199.38 |
141.01 |
195.07 |
108.11 |
|
BALANCE
SHEET in BGN'000 |
2011 |
2012 |
2013 |
2014 |
|
Accounting
period: |
1.1.2011
- |
1.1.2012
- |
1.1.2013
- |
1.1.2014
- |
|
A.UNPAID
CAPITAL |
|
|
|
|
|
B.
FIXED ASSETS |
|
|
|
|
|
I
Fixed Intangible Assets: |
|
|
|
|
|
R&D Products |
|
|
|
|
|
Concessions, patents,
trade-marks |
|
|
|
|
|
Goodwill |
|
|
|
|
|
Intangible fixed assets under
construction |
|
|
|
|
|
thereof advances |
|
|
|
|
|
Total
I: |
|
|
|
|
|
II
Fixed Tangible Assets |
|
|
|
|
|
Land and Buildings |
22 |
22 |
1366 |
1366 |
|
thereof Land |
22 |
22 |
1366 |
1366 |
|
thereof Buildings |
|
|
|
|
|
Machines, Vehicles |
3 |
7 |
17 |
17 |
|
Equipment |
229 |
156 |
143 |
91 |
|
Tangible fixed assets under
construction |
54 |
54 |
54 |
1746 |
|
thereof advances |
|
54 |
|
|
|
Total
II |
308 |
239 |
1580 |
3220 |
|
III.
Fixed Financial Assets |
|
|
|
|
|
Shares in group companies |
|
|
|
|
|
Loans granted to group
companies |
|
|
|
|
|
Shares in joint ventures |
|
|
|
|
|
Long term investments |
|
|
|
|
|
Other loans |
|
|
|
|
|
Bought back own shares |
|
|
|
|
|
Total
III |
|
|
|
|
|
IV.
Deferred Taxes |
|
|
|
|
|
B.
FIXED ASSETS TOTAL |
308 |
239 |
1580 |
3220 |
|
C.
CURRENT ASSETS |
|
|
|
|
|
I.
Inventories |
|
|
|
|
|
Raw Materials |
24 |
1497 |
1247 |
2202 |
|
Work in progress |
|
|
|
|
|
thereof young animals |
|
|
|
|
|
Trading goods |
520 |
402 |
753 |
673 |
|
thereof production |
1 |
21 |
35 |
32 |
|
thereof goods for sale |
519 |
381 |
718 |
641 |
|
Advances |
|
|
|
|
|
Total
I |
544 |
1899 |
2000 |
2875 |
|
II.
Receivables |
|
|
|
|
|
Receivables from customers |
2425 |
2330 |
2234 |
2115 |
|
thereof more than 1 year |
|
|
|
|
|
Receivables from group
companies |
|
|
|
|
|
thereof more than 1 year |
|
|
|
|
|
Receivables from joint
ventures |
|
|
|
|
|
thereof more than 1 year |
|
|
|
|
|
Other receivables |
23 |
17 |
160 |
131 |
|
thereof more than 1 year |
|
|
|
|
|
Total
II |
2448 |
2347 |
2394 |
2246 |
|
III.
Current Financial Assets |
|
|
|
|
|
Current investments in related
companies |
|
|
|
|
|
Bought back own shares |
|
|
|
|
|
Other current financial assets |
|
|
|
|
|
Total
III |
|
|
|
|
|
IV.
Cash equivalents |
|
|
|
|
|
Cash and accounts in the
country |
|
39 |
51 |
706 |
|
thereof cash |
48 |
13 |
|
|
|
Thereof cash in foreign currency
(equivalent) |
|
|
|
|
|
thereof current accounts |
59 |
26 |
51 |
706 |
|
thereof blocked accounts |
|
|
|
|
|
thereof cash equivalents |
|
|
|
|
|
Cash and accounts abroad |
|
|
|
|
|
thereof cash |
|
|
|
|
|
Thereof cash in foreign
currency (equivalent) |
|
|
|
|
|
thereof current accounts |
|
|
|
|
|
thereof blocked accounts |
|
|
|
|
|
Total
IV |
107 |
39 |
51 |
706 |
|
C.
CURRENT ASSETS TOTAL |
3099 |
4285 |
4445 |
5827 |
|
D. Deferred
expenses |
|
|
21 |
28 |
|
TOTAL
ASSETS |
3407 |
4524 |
6046 |
9075 |
|
A.
OWNERS EQUITY |
|
|
|
|
|
I.
Share capital |
5 |
5 |
5 |
5 |
|
II.
Issue premium |
|
|
|
|
|
III.
Revaluation reserves |
|
|
|
|
|
thereof revaluation reserves
of financial instruments |
|
|
|
|
|
IV.
Reserves |
|
|
|
|
|
legal reserves |
|
|
|
|
|
reserve related to bought back
own shares |
|
|
|
|
|
reserve from company
foundation |
|
|
|
|
|
other reserves |
418 |
418 |
418 |
418 |
|
Total
IV |
418 |
418 |
418 |
418 |
|
V.
Result from previous period |
|
|
|
|
|
Undistributed profit |
769 |
1349 |
2412 |
3032 |
|
Uncovered loss |
|
|
|
|
|
Total
V |
769 |
1349 |
2412 |
3032 |
|
VI. Current
result profit (loss) |
580 |
1063 |
620 |
1259 |
|
A.
OWNERS EQUITY TOTAL |
1772 |
2835 |
3455 |
4714 |
|
B.
PROVISIONS |
|
|
|
|
|
Provisions for pensions |
|
|
|
|
|
Provisions for taxes |
|
|
|
|
|
thereof deferred taxes |
|
|
|
|
|
Other provisions |
|
|
|
|
|
B.
PROVISIONS TOTAL |
|
|
|
|
|
C.
LIABILITIES |
|
|
|
|
|
Bond-backed loans |
|
|
|
|
|
less than 1 year |
|
|
|
|
|
more than 1 year |
|
|
|
|
|
Bank loans |
|
201 |
1357 |
2875 |
|
less than 1 year |
|
201 |
1357 |
2875 |
|
more than 1 year |
|
|
|
|
|
Advances received |
|
|
|
|
|
less than 1 year |
|
|
|
|
|
more than 1 year |
|
|
|
|
|
Payables to suppliers |
787 |
941 |
862 |
939 |
|
less than 1 year |
787 |
941 |
862 |
939 |
|
more than 1 year |
|
|
|
|
|
Liabilities on policies |
|
|
|
|
|
less than 1 year |
|
|
|
|
|
more than 1 year |
|
|
|
|
|
Liabilities to group companies |
|
|
|
|
|
less than 1 year |
|
|
|
|
|
more than 1 year |
|
|
|
|
|
Liabilities to joint-venture
companies |
|
|
|
|
|
less than 1 year |
|
|
|
|
|
more than 1 year |
|
|
|
|
|
Other liabilities |
848 |
547 |
372 |
547 |
|
less than 1 year |
110 |
90 |
14 |
20 |
|
more than 1 year |
738 |
457 |
358 |
527 |
|
thereof to personnel |
7 |
7 |
9 |
13 |
|
less than 1 year |
7 |
7 |
9 |
13 |
|
more than 1 year |
|
|
|
|
|
thereof to social insurance |
3 |
3 |
4 |
6 |
|
less than 1 year |
3 |
3 |
4 |
6 |
|
more than 1 year |
|
|
|
|
|
thereof for taxes |
100 |
80 |
1 |
1 |
|
less than 1 year |
100 |
80 |
1 |
1 |
|
more than 1 year |
|
|
|
|
|
C.
LIABILITIES TOTAL |
1635 |
1689 |
2591 |
4361 |
|
less than 1 year |
897 |
1232 |
2233 |
3834 |
|
more than 1 year |
738 |
457 |
358 |
527 |
|
D.
FINANCING AND DEFERRED INCOME |
|
|
|
|
|
thereof |
|
|
|
|
|
Financing |
|
|
|
|
|
Deferred income |
|
|
|
|
|
TOTAL
EQUITY AND LIABILITIES |
3407 |
4524 |
6046 |
9075 |
|
P&L
ACCOUNT in BGN'000 |
2011 |
2012 |
2013 |
2014 |
|
Accounting
period: |
1.1.2011
- |
1.1.2012
- |
1.1.2013
- |
1.1.2014
- |
|
A.
EXPENSES |
|
|
|
|
|
I.
OPERATION EXPENSES |
|
|
|
|
|
Decrease of inventories |
7 |
|
131 |
3 |
|
thereof for materials |
1875 |
2363 |
1369 |
1548 |
|
thereof for services |
524 |
608 |
758 |
616 |
|
Personnel expenses |
111 |
127 |
139 |
219 |
|
thereof wages |
93 |
107 |
117 |
185 |
|
thereof social insurance |
18 |
20 |
22 |
34 |
|
thereof pensions |
2 |
5 |
6 |
9 |
|
Depreciation |
85 |
78 |
87 |
88 |
|
thereof Depreciation of fixed
assets |
85 |
78 |
87 |
88 |
|
Other expenses |
2112 |
2615 |
2161 |
4795 |
|
thereof Book value of sold assets
(without production) |
2103 |
2609 |
2155 |
4735 |
|
I.
OPERATION EXPENSES TOTAL |
4714 |
5791 |
4645 |
7269 |
|
II.
Financial expenditures |
|
|
|
|
|
Depreciation of financial
assets |
15 |
39 |
|
|
|
thereof exchange rate losses |
15 |
39 |
|
|
|
Paid interest |
12 |
16 |
57 |
112 |
|
thereof interest to group
companies |
|
|
|
|
|
Thereof expenditures for
securities operations |
|
|
33 |
19 |
|
II.
Financial expenditures Total |
27 |
55 |
57 |
112 |
|
B. Profit
on ordinary activity |
645 |
1182 |
689 |
1400 |
|
III.
Extraordinary expenses |
|
|
|
|
|
thereof expenses on disasters
and emergency expenses |
|
|
|
|
|
C.
Total expenses (I+II+III) |
4741 |
5846 |
4702 |
7381 |
|
D.
Accounting profit |
645 |
1182 |
689 |
1400 |
|
IV.
Taxation on profit |
65 |
119 |
69 |
141 |
|
V.
Other taxes |
|
|
|
|
|
E.
Net profit |
580 |
1063 |
620 |
1259 |
|
Total
expenses |
5386 |
7028 |
5391 |
8781 |
|
A.
REVENUES |
|
|
|
|
|
I .
OPERATING REVENUES |
|
|
|
|
|
Net
sales |
4420 |
5992 |
4418 |
7479 |
|
Production |
2303 |
3169 |
2521 |
2310 |
|
Goods |
2117 |
2823 |
1892 |
5150 |
|
Services |
|
|
5 |
19 |
|
Increase of production and
work in progress |
|
165 |
|
|
|
Expenses on acquisition of
assets |
|
|
|
|
|
Other revenues |
930 |
831 |
965 |
1285 |
|
thereof financing |
|
|
|
|
|
I.
TOTAL OPERATING REVENUES |
5350 |
6988 |
5383 |
8764 |
|
II
FINANCIAL REVENUES |
|
|
|
|
|
Income from shares |
|
|
|
|
|
thereof income from shares in
group companies |
|
|
|
|
|
Income from investments and
loans |
|
|
|
|
|
thereof from investments in
group companies |
|
|
|
|
|
Income from interest |
|
40 |
8 |
17 |
|
thereof from interest from
group companies |
|
|
|
|
|
II
FINANCIAL REVENUES TOTAL |
36 |
40 |
8 |
17 |
|
TOTAL
REVENUES FROM ORDINARY ACTIVITIES |
5386 |
7028 |
5391 |
8781 |
|
LOSS |
|
|
|
|
|
Extraordinary revenues |
|
|
|
|
|
AFTER
TAX LOSS |
|
|
|
|
|
TOTAL
REVENUES |
5386 |
7028 |
5391 |
8781 |
FOREIGN EXCHANGE RATES
|
Currency |
Unit
|
Indian Rupees |
|
US Dollar |
1 |
Rs.65.75 |
|
UK Pound |
1 |
Rs.102.17 |
|
Euro |
1 |
Rs.74.38 |
INFORMATION DETAILS
|
Analysis Done by
: |
KIN |
|
|
|
|
Report Prepared
by : |
VNT |
RATING EXPLANATIONS
|
RATING |
STATUS |
PROPOSED CREDIT LINE |
|
|
|
>86 |
Aaa |
Possesses an extremely sound financial base with the strongest
capability for timely payment of interest and principal sums |
Unlimited |
|
|
71-85 |
Aa |
Possesses adequate working capital. No caution needed for credit
transaction. It has above average (strong) capability for payment of interest
and principal sums |
Large |
|
|
56-70 |
A |
Financial & operational base are regarded healthy. General
unfavourable factors will not cause fatal effect. Satisfactory capability for
payment of interest and principal sums |
Fairly Large |
|
|
41-55 |
Ba |
Overall operation is considered normal. Capable to meet normal
commitments. |
Satisfactory |
|
|
26-40 |
B |
Capability to overcome financial difficulties seems comparatively
below average. |
Small |
|
|
11-25 |
Ca |
Adverse factors are apparent. Repayment of interest and principal sums
in default or expected to be in default upon maturity |
Limited with
full security |
|
|
<10 |
C |
Absolute credit risk exists. Caution needed to be exercised |
Credit not
recommended |
|
|
-- |
NB |
New Business |
-- |
|
This score serves as a reference to assess
SC’s credit risk and to set the amount of credit to be extended. It is
calculated from a composite of weighted scores obtained from each of the major sections
of this report. The assessed factors and their relative weights (as indicated
through %) are as follows:
Financial
condition (40%) Ownership
background (20%) Payment
record (10%)
Credit history
(10%) Market trend (10%) Operational size
(10%)
This report is issued at your request without any risk
and responsibility on the part of MIRA INFORM PRIVATE LIMITED (MIPL) or its
officials.