|
|
|

MIRA INFORM REPORT
|
Report No. : |
501447 |
|
Report Date : |
03.04.2018 |
IDENTIFICATION DETAILS
|
Name : |
PROVIMI ANIMAL NUTRITION INDIA PRIVATE LIMITED (w.e.f.
23.10.2009) |
|
|
|
|
Formerly Known
As : |
TETRAGON CHEMIE PRIVATE LIMITED |
|
|
|
|
Registered
Office : |
IS-40, KHB Industrial Area, Yelahanka New Town, Bangalore – 560064,
Karnataka |
|
Mobile No.: |
91-9379157877 (Ms. Apurva) |
|
|
|
|
Country : |
India |
|
|
|
|
Financials (as
on) : |
31.03.2017 |
|
|
|
|
Date of Incorporation
: |
11.03.1983 |
|
|
|
|
Com. Reg. No.: |
08-005213 |
|
|
|
|
Capital
Investment / Paid-up Capital : |
INR 41.929 Million |
|
|
|
|
CIN No.: [Company Identification
No.] |
U24111KA1983PTC005213 |
|
|
|
|
IEC No.: [Import-Export
Code No.] |
Not Divulged |
|
|
|
|
GSTN : [Goods & Service Tax
Registration No.] |
29AAACT4909N1ZU |
|
|
|
|
TAN No.: [Tax Deduction &
Collection Account No.] |
Not Available |
|
|
|
|
PAN No.: [Permanent Account No.] |
AAACT4909N |
|
|
|
|
Legal Form : |
Private Limited Liability Company |
|
|
|
|
Line of Business
: |
Manufacturing, purchase and sales of animal related health care products, constituting. [Registered Activity] Note: Line of business is updated as per latest annual report 2017. |
|
|
|
|
No. of Employees
: |
Information denied by the management |
RATING & COMMENTS
(Mira Inform has adopted New Rating mechanism w.e.f. 23rd
January 2017)
|
MIRA’s Rating : |
A+ |
|
Credit Rating |
Explanation |
Rating Comments |
|
A+ |
Low Risk |
Business dealings permissible with low
risk of default |
|
Maximum Credit Limit : |
USD 5500000 |
|
|
|
|
Status : |
Good |
|
|
|
|
Payment Behaviour : |
Regular |
|
|
|
|
Litigation : |
Clear |
|
|
|
|
Comments : |
Subject is
a subsidiary of “Cargill Asia Pacific Holdings Pte Limited” based in
Singapore and it was incorporated in the year 1983. As per
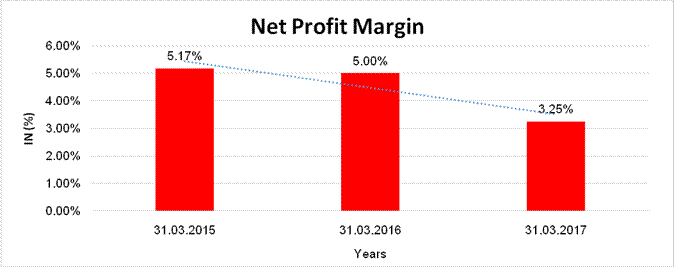
financials of March 2017, the company has registered a growth of 8.53% in its
revenue as compared to its previous year’s revenue and has reported of
average profit margin of 3.25%. Rating
takes into consideration the company’s established track record of business
operations marked by healthy net worth base along with zero debt balance
sheet and good liquidity position. Rating
also takes into account the strong financial and managerial support received
from its holding entity and well experienced management. Further,
the company has reported a good earnings per share of INR 387.17 against its
face value of INR 100. Payment terms
seems to be regular. In view
of aforesaid, the company can be considered good for business dealings at
usual trade terms and conditions. Note: Information regarding No. of Employee, Import & Export,
Payments Terms and Customer’s and Suppliers are not available from any
sources and management also denied to provide the information on the same. |
NOTES :
Any query related to this report can be made
on e-mail : infodept@mirainform.com
while quoting report number, name and date.
ECGC Country Risk Classification List
|
Country Name |
Previous Rating (30.09.2017) |
Current Rating (31.12.2017) |
|
India |
A1 |
A1 |
|
Risk Category |
ECGC
Classification |
|
Insignificant |
A1 |
|
Low Risk |
A2 |
|
Moderately Low Risk |
B1 |
|
Moderate Risk |
B2 |
|
Moderately High Risk |
C1 |
|
High Risk |
C2 |
|
Very High Risk |
D |
EXTERNAL AGENCY RATING
NOT AVAILABLE
RBI DEFAULTERS’ LIST STATUS
Subject’s name is not enlisted as a defaulter in
the publicly available RBI Defaulters’ list.
EPF (Employee Provident Fund) DEFAULTERS’ LIST STATUS
Subject’s name is not enlisted as a defaulter
in the publicly available EPF (Employee Provident Fund) Defaulters’ list as of
31-03-2016.
BIFR (Board for Industrial & Financial Reconstruction) LISTING
STATUS
Subject’s name is not listed as a Sick Unit in
the publicly available BIFR (Board for Industrial & Financial
Reconstruction) list as of 03.04.2018
IBBI (Insolvency and Bankruptcy Board of India) LISTING STATUS
Subject’s name is not listed in the publicly
available IBBI (Insolvency and Bankruptcy Board of India) list as of report
date.
INFORMATION DENIED
Management Non-Cooperative (91-9379157877)
91-80-33680021 – out of services
91-80-28460060/2055/33680002/33680022
– not working
91-80-33680001-
not exist
LOCATIONS
|
Registered Office : |
IS-40, KHB Industrial Area, Yelahanka New Town, Bangalore – 560064,
Karnataka, India |
|
Tel. No.: |
Not Available |
|
Mobile No.: |
91-9379157877 (Ms. Apurva) |
|
Fax No.: |
Not Available |
|
E-Mail : |
|
|
Website: |
|
|
|
|
|
Factory 2 : |
C-7/22, KSSIDC (I. A) Yelahanka New Town, Bangalore – 560 064,
Karnataka, India |
|
|
|
|
Factory 3 : |
No. 4/8E-3, KSSIDC Industrial Estate, Dodaballapur, Bangalore - 561
203, Karnataka, India |
|
|
|
|
Branches : |
Located at:
|
|
|
|
|
Overseas Office: |
Veerian 17-23, 3072, AN Rotterdam, Postibus 59009 3008 Pad Rotterdam
The Netherlands |
|
Tel No.: |
+ 31 (0) 10-4239500 |
|
Fax No.: |
+31 (0) 10-4239624 |
|
E mail: |
DIRECTORS
AS ON 31.03.2017
|
Name : |
Mr. Robert Brian Schubert |
|
Designation : |
Managing Director |
|
Address : |
2088 CR 108 Lincoln TX 78948 United States |
|
Date of Birth/Age : |
24.10.1979 |
|
Qualification: |
Bsc, Agriculture |
|
Date of Appointment : |
27.04.2015 |
|
DIN No.: |
07120816 |
|
|
|
|
Name : |
Mr. Raghavendra Shankarrao Joshi |
|
Designation : |
Director |
|
Address : |
No. 369, ‘Girishankar’, 17th Main, 2nd Cross,
Nandini Layout, 4th Block, Bangalore – 560096, Karnataka, India |
|
Date of Birth/Age : |
26.01.1971 |
|
Date of Appointment : |
30.09.2013 |
|
DIN No.: |
06499606
|
|
PAN No.: |
AEAPJ3966L |
|
|
|
|
Name : |
Mr. Shrikant Haribhau Salpekar |
|
Designation : |
Additional Director |
|
Address : |
Flat No 407 J S Sunflower Apartment No 42, Doddaballapura
Road, Ananthapura Village, Yelahanka – 560064, Karnataka, India |
|
Date of Appointment : |
04.01.2018 |
|
DIN No.: |
08022621 |
Note: As per our previous database, Mr. Trideep Chowdhary, was the director of the company, however, he
does not appear in the current government registry records and the same could
not be confirmed with the management as well.
KEY EXECUTIVES
|
Name : |
Ms. Apurva |
|
Designation : |
Manager |
MAJOR SHAREHOLDERS
AS ON 31.03.2017
|
Names of Shareholders |
|
No. of Shares |
|
Cargill Asia Pacific Holdings Pte Limited, Singapore |
|
419288 |
|
Cargill Investment BV, Netherlands |
|
1 |
|
Total |
|
419289 |
Equity Share Break up (Percentage of Total Equity)
AS ON 26.09.2017
|
Category |
Percentage |
|
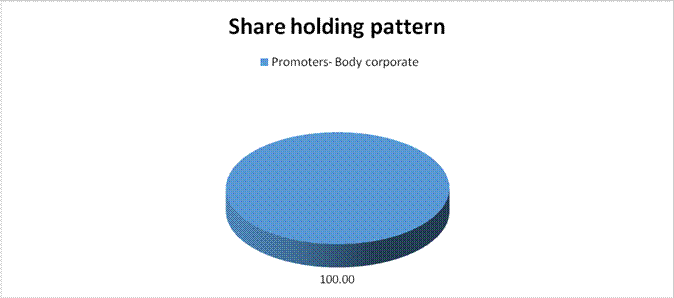
Promoters- Body corporate |
100.00 |
|
Total |
100.00 |
BUSINESS DETAILS
|
Line of Business
: |
Manufacturing, purchase and sales of animal related health care products, constituting. [Registered Activity] Note: Line of business is updated as per latest annual report 2017. |
||||||
|
|
|
||||||
|
Products / Services
: |
|
||||||
|
|
|
||||||
|
Brand Names : |
Not Available |
||||||
|
|
|
||||||
|
Agencies Held : |
Not Available |
||||||
|
|
|
||||||
|
Exports : |
Not Divulged |
||||||
|
|
|
||||||
|
Imports : |
Not Divulged |
||||||
|
|
|
||||||
|
Terms : |
Not Divulged |
PRODUCTION STATUS – (NOT AVAILABLE)
GENERAL INFORMATION
|
Suppliers : |
|
||||||||||||||||||||||
|
|
|
||||||||||||||||||||||
|
Customers : |
|
||||||||||||||||||||||
|
|
|
||||||||||||||||||||||
|
No. of Employees : |
Information denied by the management |
||||||||||||||||||||||
|
|
|
||||||||||||||||||||||
|
Bankers : |
|
|
Auditors : |
|
|
Name : |
Deloitte Haskins and Sells Chartered Accountants |
|
Address : |
Deloitte Centre, Anchorage Ii, 100/2, Richmond Road, Bangalore – 560025, Karnataka, India |
|
Tel. No.: |
91-80-66276000 |
|
Fax No.: |
91-80-66276011 |
|
PAN N Income-tax PAN of auditor or auditor's firm : |
AACFD3771D |
|
|
|
|
Memberships : |
Not Available |
|
|
|
|
Collaborators : |
Not Available |
|
|
|
|
Ultimate Holding
Company: |
|
|
|
|
|
Intermediate
Holding Companies: |
|
|
|
|
|
Holding Company: |
|
|
|
|
|
Subsidiary: |
|
|
|
|
|
Fellow subsidiaries
with whom the Company had transactions in the year: |
|
CAPITAL STRUCTURE
AS ON 31.03.2017
Authorised Capital :
|
No. of Shares |
Type |
Value |
Amount |
|
|
|
|
|
|
500000 |
Equity Shares |
INR 100/- each |
INR 50.000 Million |
|
|
|
|
|
Issued, Subscribed & Paid-up Capital :
|
No. of Shares |
Type |
Value |
Amount |
|
|
|
|
|
|
419289 |
Equity Shares |
INR 100/- each |
INR 41.929 Million |
|
|
|
|
|
FINANCIAL DATA
[all figures are
INR Million]
ABRIDGED
BALANCE SHEET (STANDALONE)
|
SOURCES OF FUNDS |
31.03.2017 |
31.03.2016 |
31.03.2015 |
|
I.
EQUITY
AND LIABILITIES |
|
|
|
|
(1)Shareholders' Funds |
|
|
|
|
(a) Share Capital |
41.929 |
41.929 |
41.929 |
|
(b) Reserves and Surplus |
1880.326 |
1717.992 |
1487.634 |
|
(c) Money
received against share warrants |
0.000 |
0.000 |
0.000 |
|
|
|
|
|
|
(2) Share Application money pending
allotment |
0.000 |
0.000 |
0.000 |
|
Total
Shareholders’ Funds (1) + (2) |
1922.255 |
1759.921 |
1529.563 |
|
|
|
|
|
|
(3)
Non-Current Liabilities |
|
|
|
|
(a) long-term borrowings |
0.000 |
0.000 |
0.000 |
|
(b) Deferred tax liabilities (Net) |
0.000 |
0.000 |
0.000 |
|
(c) Other long-term
liabilities |
43.382 |
34.902 |
25.559 |
|
(d) long-term
provisions |
12.628 |
12.953 |
7.716 |
|
Total Non-current
Liabilities (3) |
56.010 |
47.855 |
33.275 |
|
|
|
|
|
|
(4)
Current Liabilities |
|
|
|
|
(a) Short-term
borrowings |
0.000 |
0.000 |
0.000 |
|
(b) Trade
payables |
677.321 |
798.657 |
561.142 |
|
(c) Other current
liabilities |
22.986 |
23.533 |
47.883 |
|
(d) Short-term
provisions |
39.098 |
64.417 |
67.775 |
|
Total Current
Liabilities (4) |
739.405 |
886.607 |
676.800 |
|
|
|
|
|
|
TOTAL |
2717.670 |
2694.383 |
2239.638 |
|
|
|
|
|
|
II.
ASSETS |
|
|
|
|
(1)
Non-current assets |
|
|
|
|
(a) Fixed
Assets |
|
|
|
|
(i)
Tangible assets |
354.028 |
334.394 |
341.038 |
|
(ii)
Intangible Assets |
0.000 |
1.082 |
15.596 |
|
(iii) Tangible assets
capital work-in-progress |
16.462 |
17.883 |
44.537 |
|
(iv)
Intangible assets under development |
0.000 |
0.000 |
0.000 |
|
(b) Non-current Investments |
1.865 |
1.865 |
1.865 |
|
(c) Deferred tax assets (net) |
28.764 |
30.495 |
3.028 |
|
(d)
Long-term loans and advances |
160.977 |
134.589 |
106.535 |
|
(e) Other Non-current
assets |
0.000 |
0.000 |
0.000 |
|
Total Non-Current
Assets |
562.096 |
520.308 |
512.599 |
|
|
|
|
|
|
(2)
Current assets |
|
|
|
|
(a)
Current investments |
0.000 |
0.000 |
0.000 |
|
(b)
Inventories |
801.040 |
893.769 |
611.038 |
|
(c) Trade
receivables |
803.734 |
777.537 |
668.896 |
|
(d) Cash and
bank balances |
481.576 |
437.380 |
402.788 |
|
(e)
Short-term loans and advances |
66.157 |
61.782 |
40.604 |
|
(f) Other
current assets |
3.067 |
3.607 |
3.713 |
|
Total
Current Assets |
2155.574 |
2174.075 |
1727.039 |
|
|
|
|
|
|
TOTAL |
2717.670 |
2694.383 |
2239.638 |
PROFIT
& LOSS ACCOUNT (STANDALONE)
|
|
PARTICULARS |
31.03.2017 |
31.03.2016 |
31.03.2015 |
|
|
SALES |
|
|
|
|
|
Income |
5000.737 |
4607.872 |
4547.561 |
|
|
Other Income |
68.381 |
62.338 |
29.338 |
|
|
TOTAL |
5069.118 |
4670.210 |
4576.899 |
|
|
|
|
|
|
|
Less |
EXPENSES |
|
|
|
|
|
Cost of Materials
Consumed |
1981.948 |
1720.004 |
1330.804 |
|
|
Purchases of
Stock-in-Trade |
1224.311 |
1496.028 |
1617.156 |
|
|
Changes in inventories of
finished goods, work-in-progress and Stock-in-Trade |
255.409 |
(210.531) |
(53.286) |
|
|
Employee benefit expense |
494.645 |
474.501 |
412.600 |
|
|
CSR expenditure |
6.083 |
9.822 |
0.000 |
|
|
Other expenses |
783.370 |
748.344 |
812.651 |
|
|
TOTAL |
4745.766 |
4238.168 |
4119.925 |
|
|
|
|
|
|
|
|
PROFIT/
(LOSS) BEFORE INTEREST, TAX,
DEPRECIATION AND AMORTISATION |
323.352 |
432.042 |
456.974 |
|
|
|
|
|
|
|
Less |
FINANCIAL
EXPENSES |
0.000 |
0.000 |
0.000 |
|
|
|
|
|
|
|
|
PROFIT / (LOSS) BEFORE TAX, DEPRECIATION AND AMORTISATION |
323.352 |
432.042 |
456.974 |
|
|
|
|
|
|
|
Less/ Add |
DEPRECIATION/
AMORTISATION |
53.486 |
85.362 |
113.060 |
|
|
|
|
|
|
|
|
PROFIT/ (LOSS)
BEFORE TAX |
269.866 |
346.680 |
343.914 |
|
|
|
|
|
|
|
Less |
TAX |
107.532 |
116.322 |
108.990 |
|
|
|
|
|
|
|
|
PROFIT/ (LOSS)
AFTER TAX |
162.334 |
230.358 |
234.924 |
|
|
|
|
|
|
|
|
EARNINGS IN FOREIGN
CURRENCY |
|
|
|
|
|
F.O.B. Value of Exports |
991.112 |
1042.800 |
1022.195 |
|
|
TOTAL EARNINGS |
991.112 |
1042.800 |
1022.195 |
|
|
|
|
|
|
|
|
IMPORTS |
|
|
|
|
|
Raw Materials |
1400.225 |
838.376 |
645.343 |
|
|
Components and spare
parts |
833.815 |
1123.469 |
0.000 |
|
|
Capital Goods |
5.822 |
1.041 |
0.000 |
|
|
TOTAL IMPORTS |
2239.861 |
1962.886 |
645.343 |
|
|
|
|
|
|
|
|
Earnings / (Loss) Per
Share (INR) |
387.17 |
549.40 |
560.29 |
CURRENT MATURITIES
OF LONG TERM DEBT DETAILS
|
Particulars |
31.03.2017 |
31.03.2016 |
31.03.2015 |
|
Current Maturities of Long term debt |
NA |
NA |
NA |
|
|
|
|
|
|
Cash generated from operations |
NA |
NA |
NA |
|
|
|
|
|
|
Net cash flows from (used in) operations |
276.262 |
233.179 |
320.382 |
|
|
|
|
|
|
Net cash flows from (used in) operating activities |
90.229 |
64.610 |
160.301 |
KEY
RATIOS
EFFICIENCY RATIOS
|
PARTICULARS |
31.03.2017 |
31.03.2016 |
31.03.2015 |
|
Average Collection Days (Sundry
Debtors / Income * 365 Days) |
58.66 |
61.59 |
53.69 |
|
|
|
|
|
|
Account Receivables Turnover (Income / Sundry Debtors) |
6.22 |
5.93 |
6.80 |
|
|
|
|
|
|
Average Payment Days (Sundry Creditors / Purchases * 365 Days) |
77.11 |
90.64 |
69.48 |
|
|
|
|
|
|
Inventory Turnover (Operating Income / Inventories) |
0.40 |
0.48 |
0.75 |
|
|
|
|
|
|
Asset Turnover (Operating Income / Net Fixed Assets) |
0.87 |
1.22 |
1.14 |
LEVERAGE RATIOS
|
PARTICULARS |
31.03.2017 |
31.03.2016 |
31.03.2015 |
|
Debt Ratio ((Borrowing
+ Current Liabilities) / Total Assets) |
0.27 |
0.33 |
0.30 |
|
|
|
|
|
|
Debt Equity Ratio (Total Liability / Networth) |
0.00 |
0.00 |
0.00 |
|
|
|
|
|
|
Current Liabilities to Networth (Current Liabilities / Net Worth) |
0.38 |
0.50 |
0.44 |
|
|
|
|
|
|
Fixed Assets to Networth (Net Fixed Assets / Networth) |
0.19 |
0.20 |
0.26 |
|
|
|
|
|
|
Interest Coverage Ratio (PBIT / Financial Charges) |
0.00 |
0.00 |
0.00 |
PROFITABILITY RATIOS
|
PARTICULARS |
|
31.03.2017 |
31.03.2016 |
31.03.2015 |
|
Net Profit Margin ((PAT / Sales) * 100) |
% |
3.25 |
5.00 |
5.17 |
|
|
|
|
|
|
|
Return on Total Assets ((PAT / Total Assets) * 100) |
% |
5.97 |
8.55 |
10.49 |
|
|
|
|
|
|
|
Return on Investment (ROI) ((PAT / Networth) * 100) |
% |
8.44 |
13.09 |
15.36 |
SOLVENCY RATIOS
|
PARTICULARS |
31.03.2017 |
31.03.2016 |
31.03.2015 |
|
Current Ratio (Current
Assets / Current Liabilities) |
2.92 |
2.45 |
2.55 |
|
|
|
|
|
|
Quick Ratio ((Current Assets – Inventories) / Current
Liabilities) |
1.83 |
1.44 |
1.65 |
|
|
|
|
|
|
G-Score Ratio Financial (Networth / Total Assets) |
0.71 |
0.65 |
0.68 |
|
|
|
|
|
|
G-Score Ratio Debt (Debts / Equity Capital) |
0.00 |
0.00 |
0.00 |
|
|
|
|
|
|
G-Score Ratio Liquidity (Total Current Assets / Total Current Liabilities) |
2.92 |
2.45 |
2.55 |
Total
Liability = Short-term Debt + Long-term Debt + Current Maturities of Long-term
debts
FINANCIAL ANALYSIS
[all figures are
INR Million]
DEBT EQUITY RATIO
|
Particular |
31.03.2015 |
31.03.2016 |
31.03.2017 |
|
|
(INR
In Million) |
(INR
In Million) |
(INR
In Million) |
|
Share Capital |
41.929 |
41.929 |
41.929 |
|
Reserves & Surplus |
1487.634 |
1717.992 |
1880.326 |
|
Money received against share
warrants |
0.000 |
0.000 |
0.000 |
|
Share Application money
pending allotment |
0.000 |
0.000 |
0.000 |
|
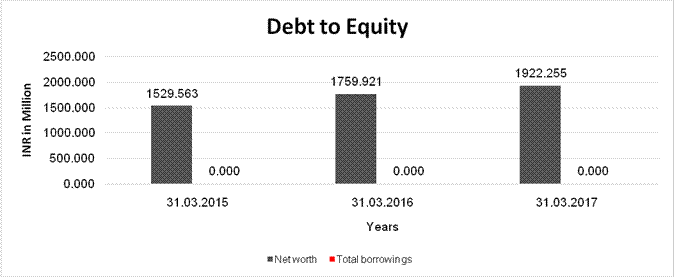
Net
worth |
1529.563 |
1759.921 |
1922.255 |
|
|
|
|
|
|
Long-term borrowings |
0.000 |
0.000 |
0.000 |
|
Short term borrowings |
0.000 |
0.000 |
0.000 |
|
Total
borrowings |
0.000 |
0.000 |
0.000 |
|
Debt/Equity
ratio |
0.000 |
0.000 |
0.000 |
YEAR-ON-YEAR GROWTH
|
Year
on Year Growth |
31.03.2015 |
31.03.2016 |
31.03.2017 |
|
|
(INR
In Million) |
(INR
In Million) |
(INR
In Million) |
|
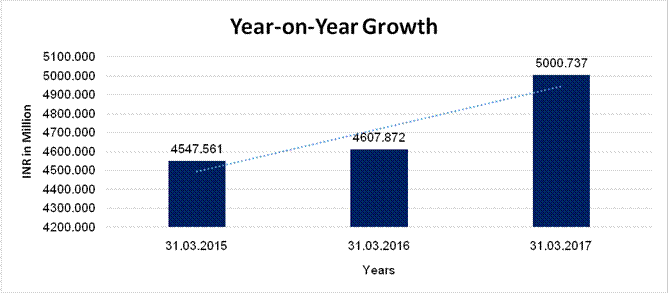
Sales |
4547.561 |
4607.872 |
5000.737 |
|
|
|
1.326 |
8.526 |
NET PROFIT MARGIN
|
Net
Profit Margin |
31.03.2015 |
31.03.2016 |
31.03.2017 |
|
|
(INR
In Million) |
(INR
In Million) |
(INR
In Million) |
|
Sales |
4547.561 |
4607.872 |
5000.737 |
|
Profit/ (Loss) |
234.924 |
230.358 |
162.334 |
|
|
5.17
% |
5.00
% |
3.25
% |
ABRIDGED
BALANCE SHEET (CONSOLIDATED)
|
SOURCES OF FUNDS |
|
31.03.2017 |
31.03.2016 |
|
I.
EQUITY
AND LIABILITIES |
|
|
|
|
(1)Shareholders' Funds |
|
|
|
|
(a) Share Capital |
|
41.929 |
41.929 |
|
(b) Reserves and Surplus |
|
2245.216 |
1856.023 |
|
(c) Money
received against share warrants |
|
0.000 |
0.000 |
|
(d) Minority interest |
|
0.011 |
0.004 |
|
|
|
|
|
|
(2) Share Application money pending allotment |
|
0.000 |
0.000 |
|
Total
Shareholders’ Funds (1) + (2) |
|
2287.145 |
1897.952 |
|
|
|
|
|
|
(3)
Non-Current Liabilities |
|
|
|
|
(a) long-term borrowings |
|
0.000 |
0.000 |
|
(b) Deferred tax liabilities (Net) |
|
0.000 |
0.000 |
|
(c) Other long-term
liabilities |
|
43.382 |
34.902 |
|
(d) long-term
provisions |
|
12.628 |
12.953 |
|
Total Non-current
Liabilities (3) |
|
56.010 |
47.855 |
|
|
|
|
|
|
(4)
Current Liabilities |
|
|
|
|
(a) Short-term
borrowings |
|
0.000 |
0.000 |
|
(b) Trade
payables |
|
733.707 |
810.107 |
|
(c) Other
current liabilities |
|
23.403 |
24.247 |
|
(d) Short-term
provisions |
|
39.098 |
64.416 |
|
Total Current
Liabilities (4) |
|
796.208 |
898.770 |
|
|
|
|
|
|
TOTAL |
|
3139.374 |
2844.581 |
|
|
|
|
|
|
II.
ASSETS |
|
|
|
|
(1)
Non-current assets |
|
|
|
|
(a) Fixed
Assets |
|
|
|
|
(i)
Tangible assets |
|
373.518 |
341.192 |
|
(ii)
Intangible Assets |
|
0.000 |
1.082 |
|
(iii) Tangible assets
capital work-in-progress |
|
16.462 |
17.883 |
|
(iv)
Intangible assets under development |
|
0.000 |
0.000 |
|
(b) Non-current Investments |
|
0.000 |
0.000 |
|
(c) Deferred tax assets (net) |
|
28.764 |
30.495 |
|
(d)
Long-term loans and advances |
|
123.701 |
93.414 |
|
(e) Other Non-current
assets |
|
0.000 |
0.000 |
|
Total Non-Current
Assets |
|
542.445 |
484.066 |
|
|
|
|
|
|
(2)
Current assets |
|
|
|
|
(a)
Current investments |
|
0.000 |
0.000 |
|
(b)
Inventories |
|
1016.434 |
945.162 |
|
(c) Trade
receivables |
|
813.713 |
750.791 |
|
(d) Cash and
bank balances |
|
691.079 |
542.514 |
|
(e)
Short-term loans and advances |
|
71.672 |
63.772 |
|
(f) Other
current assets |
|
4.031 |
58.276 |
|
Total
Current Assets |
|
2596.929 |
2360.515 |
|
|
|
|
|
|
TOTAL |
|
3139.374 |
2844.581 |
PROFIT
& LOSS ACCOUNT (CONSOLIDATED)
|
|
PARTICULARS |
|
31.03.2017 |
31.03.2016 |
|
|
SALES |
|
|
|
|
|
Income |
|
5033.415 |
4568.045 |
|
|
Other Income |
|
24.750 |
65.759 |
|
|
TOTAL |
|
5058.165 |
4633.804 |
|
|
|
|
|
|
|
Less |
EXPENSES |
|
|
|
|
|
Cost of Materials
Consumed |
|
1692.638 |
1625.605 |
|
|
Purchases of
Stock-in-Trade |
|
1224.312 |
1496.028 |
|
|
Changes in inventories of
finished goods, work-in-progress and Stock-in-Trade |
|
272.232 |
(227.385) |
|
|
Employee benefit expense |
|
500.904 |
478.261 |
|
|
CSR expenditure |
|
6.083 |
9.822 |
|
|
Other expenses |
|
814.225 |
756.961 |
|
|
TOTAL |
|
4510.394 |
4139.292 |
|
|
|
|
|
|
|
|
PROFIT/
(LOSS) BEFORE INTEREST, TAX,
DEPRECIATION AND AMORTISATION |
|
547.771 |
494.512 |
|
|
|
|
|
|
|
Less |
FINANCIAL
EXPENSES |
|
0.000 |
0.000 |
|
|
|
|
|
|
|
|
PROFIT / (LOSS) BEFORE TAX, DEPRECIATION AND AMORTISATION |
|
547.771 |
494.512 |
|
|
|
|
|
|
|
Less/ Add |
DEPRECIATION/
AMORTISATION |
|
60.412 |
91.931 |
|
|
|
|
|
|
|
|
PROFIT/ (LOSS)
BEFORE TAX |
|
487.359 |
402.581 |
|
|
|
|
|
|
|
Less |
TAX |
|
105.518 |
116.322 |
|
|
|
|
|
|
|
|
PROFIT/ (LOSS) AFTER
TAX |
|
381.841 |
286.259 |
|
|
|
|
|
|
|
|
PROFIT (LOSS) OF MINORITY
INTEREST |
|
(0.011) |
(0.004) |
|
|
|
|
|
|
|
|
TOTAL
PROFIT (LOSS) FOR PERIOD |
|
381.830 |
286.256 |
|
|
|
|
|
|
|
|
Earnings / (Loss) Per
Share (INR) |
|
910.69 |
682.73 |
LOCAL AGENCY FURTHER INFORMATION
|
Sr. No. |
Check list by
info agents |
Available in
Report (Yes/No) |
|
1 |
Year of establishment |
Yes |
|
2 |
Constitution of the entity -Incorporation
details |
Yes |
|
3 |
Locality of the entity |
Yes |
|
4 |
Premises details |
No |
|
5 |
Buyer visit details |
-- |
|
6 |
Contact numbers |
Yes |
|
7 |
Name of the person contacted |
No |
|
8 |
Designation of contact person |
No |
|
9 |
Promoter’s background |
Yes |
|
10 |
Date of Birth of Proprietor / Partners /
Directors |
Yes |
|
11 |
Pan Card No. of Proprietor / Partners |
No |
|
12 |
Voter Id Card No. of Proprietor / Partners |
No |
|
13 |
Type of business |
Yes |
|
14 |
Line of Business |
Yes |
|
15 |
Export/import details (if applicable) |
No |
|
16 |
No. of employees |
No |
|
17 |
Details of sister concerns |
Yes |
|
18 |
Major suppliers |
No |
|
19 |
Major customers |
No |
|
20 |
Banking Details |
No |
|
21 |
Banking facility details |
No |
|
22 |
Conduct of the banking account |
-- |
|
23 |
Financials, if provided |
Yes |
|
24 |
Capital in the business |
Yes |
|
25 |
Last accounts filed at ROC, if applicable |
Yes |
|
26 |
Turnover of firm for last three years |
Yes |
|
27 |
Reasons for variation <> 20% |
-- |
|
28 |
Estimation for coming financial year |
No |
|
29 |
Profitability for last three years |
Yes |
|
30 |
Major shareholders, if available |
Yes |
|
31 |
External Agency Rating, if available |
No |
|
32 |
Litigations that the firm/promoter
involved in |
-- |
|
33 |
Market information |
-- |
|
34 |
Payments terms |
No |
|
35 |
Negative Reporting by Auditors in the
Annual Report |
No |
INDEX OF CHARGE:
|
SNO |
SRN |
CHARGE ID |
CHARGE HOLDER NAME |
DATE OF CREATION |
DATE OF MODIFICATION |
DATE OF SATISFACTION |
AMOUNT |
ADDRESS |
|
1 |
Y10296654 |
90194755 |
KARNATKA STATE
FINANCIAL CORPROATION |
27/06/1985 |
- |
- |
120000.0 |
CHURCH
STREETBANGALOREKA560001IN |
|
2 |
Y10296641 |
90194742 |
KARNATKA STATE
FINANCIAL CORPROATION |
14/03/1985 |
- |
- |
59000.0 |
CHURCH STREETBANGALOREKA560001IN |
|
3 |
Y10296615 |
90194716 |
KARNATKA STATE
FINANCIAL CORPROATION |
26/12/1983 |
- |
- |
104000.0 |
CHURCH
STREETBANGALOREKA560001IN |
|
4 |
B36810224 |
90194795 |
STATE BANK OF
MYSORE |
07/11/1986 |
- |
29/02/2012 |
120000.0 |
RAJMAHAL VILAS
EXTN BRANCHBANGALOREKA560080IN |
|
5 |
B36809697 |
90194883 |
STATE BANK OF
MYSORE |
28/10/1988 |
- |
29/02/2012 |
120600.0 |
RAJMAHAL VILAS
EXTN BRANCHBANGALOREKA560080IN |
|
6 |
B36810521 |
80064848 |
STATE BANK OF
MYSORE |
25/07/1984 |
- |
29/02/2012 |
375000.0 |
RAJMAHAL VILAS
EXTENSION BRANCHBANGALOREKA560080IN |
|
7 |
B36811313 |
90194728 |
STATE BANK OF
MYSORE |
25/07/1984 |
- |
29/02/2012 |
450000.0 |
RAJMAHAL VILAS
EXTENSION BRANCHBANGALOREKA560080IN |
|
8 |
B36810927 |
90194797 |
STATE BANK OF
MYSORE |
19/11/1986 |
- |
29/02/2012 |
400000.0 |
RAJMAHAL VILAS
EXTN BRANCHBANGALOREKA560080IN |
|
9 |
B31553365 |
90194708 |
STATE BANK OF
MYSORE |
03/06/1983 |
05/10/2009 |
01/10/2011 |
150000000.0 |
RAJMAHAL VILAS
EXTENSION BRANCH6TH "A" CROSS, 10TH MAIN ROAD,
SADASHIVANAGARBANGALOREKA560080IN |
|
10 |
Y10298068 |
90196169 |
KARNATKA STATE
FINANCIAL CORPROATION |
13/10/1995 |
- |
28/04/1999 |
5000000.0 |
NO25; MG
ROADSHANKARANARAYANABANGALOREKA560001IN |
FIXED ASSETS:
Tangible assets
- Land
- Buildings
- Furniture and fixtures
- Vehicles
- Office equipment
- Computer equipments
- Plant and equipment
Intangible assets
- Brands and trade marks
- Computer software
CMT REPORT (Corruption, Money Laundering & Terrorism]
The Public Notice information has been collected from various sources
including but not limited to: The Courts,
1] INFORMATION ON
DESIGNATED PARTY
No records exist designating subject or any of its beneficial owners, controlling
shareholders or senior officers as terrorist or terrorist organization or whom
notice had been received that all financial transactions involving their assets
have been blocked or convicted, found guilty or against whom a judgement or
order had been entered in a proceedings for violating money-laundering,
anti-corruption or bribery or international economic or anti-terrorism sanction
laws or whose assets were seized, blocked, frozen or ordered forfeited for
violation of money laundering or international anti-terrorism laws.
2] Court Declaration :
No records exist to suggest that subject is
or was the subject of any formal or informal allegations, prosecutions or other
official proceeding for making any prohibited payments or other improper payments
to government officials for engaging in prohibited transactions or with
designated parties.
3] Asset Declaration :
No records exist to suggest that the property or assets of the subject
are derived from criminal conduct or a prohibited transaction.
4] Record on Financial
Crime :
Charges or conviction
registered against subject: None
5] Records on Violation of
Anti-Corruption Laws :
Charges or
investigation registered against subject: None
6] Records on Int’l Anti-Money
Laundering Laws/Standards :
Charges or
investigation registered against subject: None
7] Criminal Records
No
available information exist that suggest that subject or any of its principals
have been formally charged or convicted by a competent governmental authority
for any financial crime or under any formal investigation by a competent
government authority for any violation of anti-corruption laws or international
anti-money laundering laws or standard.
8] Affiliation with
Government :
No record
exists to suggest that any director or indirect owners, controlling
shareholders, director, officer or employee of the company is a government
official or a family member or close business associate of a Government
official.
9] Compensation Package :
Our market
survey revealed that the amount of compensation sought by the subject is fair
and reasonable and comparable to compensation paid to others for similar
services.
10] Press Report :
No press reports / filings exists on
the subject.
CORPORATE GOVERNANCE
MIRA INFORM as part of its Due Diligence do provide comments on
Corporate Governance to identify management and governance. These factors often
have been predictive and in some cases have created vulnerabilities to credit
deterioration.
Our Governance Assessment focuses principally on the interactions
between a company’s management, its Board of Directors, Shareholders and other
financial stakeholders.
CONTRAVENTION
Subject is not known to have contravened any existing local laws, regulations
or policies that prohibit, restrict or otherwise affect the terms and
conditions that could be included in the agreement with the subject.
FOREIGN EXCHANGE RATES
|
Currency |
Unit
|
INR |
|
US Dollar |
1 |
INR 65.04 |
|
|
1 |
INR 92.28 |
|
Euro |
1 |
INR 80.62 |
INFORMATION DETAILS
|
Information
Gathered by : |
SAV |
|
|
|
|
Analysis Done by
: |
VIV |
|
|
|
|
Report Prepared
by : |
KVT |
SCORE FACTORS
|
DEMERIT POINTS |
|
|
|
--BANK CHARGES |
YES/NO |
NO |
|
--LITIGATION |
YES/NO |
NO |
|
--OTHER ADVERSE INFORMATION |
YES/NO |
NO |
|
MERIT POINTS |
|
|
|
--SOLE DISTRIBUTORSHIP |
YES/NO |
NO |
|
--EXPORT ACTIVITIES |
YES/NO |
NO |
|
--AFFILIATION |
YES/NO |
YES |
|
--LISTED |
YES/NO |
NO |
|
--OTHER MERIT FACTORS |
YES/NO |
YES |
RATING EXPLANATIONS
|
Credit Rating |
Explanation |
Rating Comments |
|
A++ |
Minimum Risk |
Business dealings permissible with minimum
risk of default |
|
A+ |
Low Risk |
Business dealings permissible with low
risk of default |
|
A |
Acceptable Risk |
Business dealings permissible with
moderate risk of default |
|
B |
Medium Risk |
Business dealings permissible on a regular
monitoring basis |
|
C |
Medium High Risk |
Business dealings permissible preferably
on secured basis |
|
D |
High Risk |
Business dealing not recommended or on
secured terms only |
|
NB |
New Business |
No recommendation can be done due to
business in infancy stage |
|
NT |
No Trace |
No recommendation can be done as the
business is not traceable |
NB is stated where there is insufficient information to facilitate rating. However, it is not to be considered as unfavourable.
This score serves as a reference to assess
SC’s credit risk and to set the amount of credit to be extended. It is
calculated from a composite of weighted scores obtained from each of the major
sections of this report. The assessed factors are as follows:
·
Financial
condition covering various ratios
·
Company
background and operations size
·
Promoters
/ Management background
·
Payment
record
·
Litigation
against the subject
·
Industry
scenario / competitor analysis
·
Supplier
/ Customer / Banker review (wherever available)
This report is issued at
your request without any risk and responsibility on the part of MIRA INFORM
PRIVATE LIMITED (MIPL) or its officials.