|
|
|


MIRA INFORM REPORT
|
Report No. : |
501578 |
|
Report Date : |
04.04.2018 |
IDENTIFICATION DETAILS
|
Name : |
RAMKRISHNA FORGINGS LIMITED |
|
|
|
|
Registered
Office : |
Ramkrishna Chambers, 72, Shakespeare Sarani, Kolkata – 700017, |
|
Tel. No.: |
91-33-39840900/0999 |
|
|
|
|
Country : |
India |
|
|
|
|
Financials (as
on) : |
31.03.2017 |
|
|
|
|
Date of
Incorporation : |
12.11.1981 |
|
|
|
|
Com. Reg. No.: |
21-034281 |
|
|
|
|
Capital
Investment / Paid-up Capital : |
INR 286.699 Million |
|
|
|
|
CIN No.: [Company Identification
No.] |
L74210WB1981PLC034281 |
|
|
|
|
IEC No.: |
Not Divulged |
|
|
|
|
TAN No.: [Tax Deduction &
Collection Account No.] |
Not Available |
|
|
|
|
PAN No.: [Permanent Account No.] |
Not Divulged |
|
|
|
|
GST No.: |
Not Divulged |
|
|
|
|
Legal Form : |
A Public Limited Liability Company. The Company’s Shares are Listed on
the Stock Exchanges. |
|
|
|
|
Line of Business
: |
Manufacturer of Forgings. [Registered Activity] |
|
|
|
|
No. of Employees
: |
1611 (Approximately) |
RATING & COMMENTS
(Mira Inform has adopted New Rating mechanism w.e.f. 23rd
January 2017)
|
MIRA’s Rating : |
A+ |
|
Credit Rating |
Explanation |
Rating Comments |
|
A+ |
Low Risk |
Business dealings permissible with low
risk of default |
|
Status : |
Good |
|
|
|
|
Payment Behaviour : |
Regular |
|
|
|
|
Litigation : |
Clear |
|
|
|
|
Comments : |
Subject
was incorporated in the year 1981 and it is a manufacturer and exporter of forged
and rolled components for the railways, automobile etc. As per
financials of March 2017, the company has registered marginal decline in its
revenue and has reported average profit margin. Rating takes
into consideration the company’s established track record of business
operations marked by healthy net worth base along with average debt coverage
indicators and good liquidity position. Rating
also takes into account the established position of the company as a supplier
of forged components with increasing proportion of value-added products in
its portfolio. Share are
quoted high on stock exchanges. (Share are traded at a price of INR 765
against its face value of INR 10. However,
ratings strength is partially offset by sales concentration in the domestic
CV segment along with high working capital intensity of the export business
and exposure to the cyclicality inherent in CV and steel Industries. As per
unaudited quarterly financials of December 2017, the company has achieved a
revenue of INR 4,000.74 million and has reported good profit margin of 6.93%. Payments
terms seems to be regular. In view
of aforesaid, the company can be considered good for business dealings at
usual trade terms and conditions. |
NOTES :
Any query related to this report can be made
on e-mail : infodept@mirainform.com
while quoting report number, name and date.
ECGC Country Risk Classification List
|
Country Name |
Previous Rating (30.09.2017) |
Current Rating (31.12.2017) |
|
India |
A1 |
A1 |
|
Risk Category |
ECGC
Classification |
|
Insignificant |
A1 |
|
Low Risk |
A2 |
|
Moderately Low Risk |
B1 |
|
Moderate Risk |
B2 |
|
Moderately High Risk |
C1 |
|
High Risk |
C2 |
|
Very High Risk |
D |
EXTERNAL AGENCY RATING
|
Rating Agency Name |
ICRA |
|
Rating |
Long Term Rating = A- |
|
Rating Explanation |
Adequate degree of safety and low credit risk |
|
Date |
28.02.2018 |
|
Rating Agency Name |
ICRA |
|
Rating |
Short Term Rating = A2+ |
|
Rating Explanation |
Strong degree of safety and low credit risk |
|
Date |
28.02.2018 |
RBI DEFAULTERS’ LIST STATUS
Subject’s name is not enlisted as a defaulter
in the publicly available RBI Defaulters’ list.
EPF (Employee Provident Fund) DEFAULTERS’ LIST STATUS
Subject’s name is not enlisted as a defaulter
in the publicly available EPF (Employee Provident Fund) Defaulters’ list as of
31-03-2016.
BIFR (Board for Industrial & Financial Reconstruction) LISTING STATUS
Subject’s name is not listed as a Sick Unit in
the publicly available BIFR (Board for Industrial & Financial
Reconstruction) list as of 04.04.2018
IBBI (Insolvency and Bankruptcy Board of India) LISTING STATUS
Subject’s name is not listed in the publicly
available IBBI (Insolvency and Bankruptcy Board of India) list as of report
date.
INFORMATION DECLINED
MANAGEMENT NON-COOPERATIVE [91-33-39840999/ 39840900]
LOCATIONS
|
Registered/ Corporate Office : |
Ramkrishna Chambers, 72, Shakespeare Sarani, Kolkata – 700017, West
Bengal, India |
|
Tel. No.: |
91-33-39840900/0999 |
|
Fax No.: |
91-33-39840999/ 3984 0998 |
|
E-Mail : |
|
|
Website : |
|
|
|
|
|
Factory 1 : |
Plot No. M-6, Phase VI, Gamaria, Jamshedpur - 832108, Jharkhand, India |
|
Tel. No.: |
91-657-3984900/ 3984997/ 3984996 |
|
|
|
|
Factory 2 : |
7/40, |
|
Tel. No.: |
91-33-26548062/ 39840921/ 26548063 |
|
|
|
|
Factory 3 : |
Plot No. M-15,16 and NS-26, Phase VII, Adityapur Industrial Area, Jamshedpur - 832109, Jharkhand, India |
|
Tel. No.: |
91-657-3984900 |
|
Fax No.: |
91-657-3984998 |
|
|
|
|
Factory 4 : |
Village Baliguma, P.O. Kolabira, Thana: Sareikela, District Sareikela Kharsawan – 833220, Jharkhand, (India) |
DIRECTORS
AS ON: 31.03.2017
|
Name : |
Mr. Padam Kumar
Khaitan |
|
Designation : |
Director |
|
Address : |
3, Queens Park, Kolkata-700019, West Bengal, India |
|
Date of Appointment : |
25.07.2005 |
|
DIN No.: |
00019700 |
|
|
|
|
Name : |
Mr. Sandipan Chakravortty |
|
Designation : |
Director |
|
Address : |
Flat No. 9CD, Ashoka Apartments, 111, Southern Avenue, Kolkata-700029,
West Bengal, India |
|
Date of Birth/Age : |
23.09.1949 |
|
Date of Appointment : |
21.05.2016 |
|
DIN No.: |
00053550 |
|
|
|
|
Name : |
Mr. Ram Tawakya Singh |
|
Designation : |
Director |
|
Address : |
46, Nildih Enclave Nildih Colony, Telco Jamshedpur-
831003, Jharkhand, India |
|
Date of Appointment : |
12.05.2012 |
|
DIN No.: |
00276330 |
|
|
|
|
Name : |
Mrs. Partha Sarathi Bhattacharyya |
|
Designation : |
Director |
|
Address : |
NA 15, Sanjeeva Town, Konchpukur New Town, Rajarhat North 24, Parganas, Kolkata-700102, West Bengal, India |
|
Date of Appointment : |
21.05.2016 |
|
DIN No.: |
00329479 |
|
|
|
|
Name : |
Mr. Mahabir Prasad Jalan |
|
Designation : |
Wholetime Director |
|
Address : |
4A, Hastings Park Road, German Consulate, 2nd Floor, Flat- 2, Kolkata-700027, West Bengal, India |
|
Date of Birth/Age : |
10.04.1949 |
|
Date of Appointment : |
12.11.1981 |
|
DIN No.: |
00354690 |
|
|
|
|
Name : |
Mr. Naresh Jalan |
|
Designation : |
Managing Director |
|
Address : |
4A, Hastings Park Road, German Consulate, 2nd Floor, Flat- 2, Kolkata-700027, West Bengal, India |
|
Date of Birth/Age : |
04.10.1975 |
|
Date of Appointment : |
25.01.1995 |
|
DIN No.: |
00375462 |
|
|
|
|
Name : |
Mr. Pawan Kumar Kedia |
|
Designation : |
Wholetime Director |
|
Address : |
Clubtown, BIK-1/2 - C, VIP Road, Kolkata 700052, West Bengal, India |
|
Date of Birth/Age : |
16.09.1957 |
|
Date of Appointment : |
15.09.2003 |
|
DIN No.: |
00375557 |
|
|
|
|
Name : |
Mrs. Amitabha Guha |
|
Designation : |
Director |
|
Address : |
DL-182, Salt Lake, Sector II, Bidhannagar (East), North 24, Parganas, Kolkata-700091, West Bengal, India |
|
Date of Appointment : |
14.08.2014 |
|
DIN No.: |
02836707 |
|
|
|
|
Name : |
Mr. Yudhisthir Lal Madan |
|
Designation : |
Director |
|
Address : |
SD-209, Ground Floor, Tower Apartment, Pitampura, New Delhi -110088, India |
|
Date of Appointment : |
12.05.2012 |
|
DIN No.: |
05123237 |
|
|
|
|
Name : |
Mrs. Aditi Bagri |
|
Designation : |
Director |
|
Address : |
C-1301, Oberoi Gardens, Thakur Village, Kandivali (East), Mumbai-400101, Maharashtra, India |
|
Date of Appointment : |
01.11.2014 |
|
DIN No.: |
06943139 |
KEY EXECUTIVES
|
Name : |
Mr. Rajesh Mundhra |
|
Designation : |
Company Secretary |
|
Address : |
12/1B, Bosepukur Road, 2nd Floor, Suranjali Apartment,
Kolkata-700042, West Bengal, India |
|
Date of Appointment : |
11.12.2003 |
|
PAN No.: |
AEKPM8901N |
|
|
|
|
Name : |
Mr. Sikander Yadav |
|
Designation : |
Chief Financial officer |
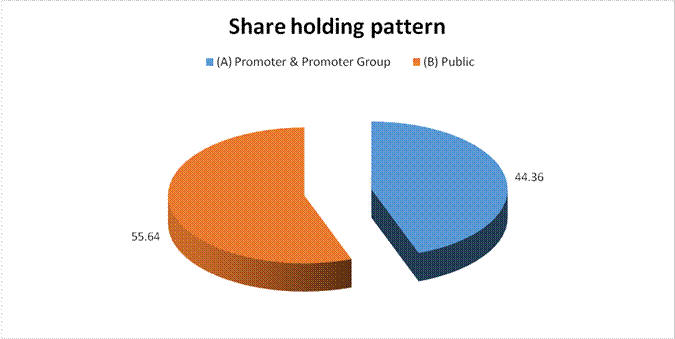
MAJOR SHAREHOLDERS / SHAREHOLDING PATTERN
AS ON: 31.12.2017
|
Category of shareholder |
Total nos. shares held |
Shareholding as a % of total no. of shares
(calculated as per SCRR, 1957)As a % of (A+B+C2) |
|
|
(A) Promoter &
Promoter Group |
14458169 |
44.36 |
|
|
(B) Public |
18133339 |
55.64 |
|
|
Grand Total |
32591508 |
100.00 |
Statement showing
shareholding pattern of the Promoter and Promoter Group
|
Category of shareholder |
Total nos. shares held |
Shareholding as a % of total no. of shares (calculated
as per SCRR, 1957)As a % of (A+B+C2) |
|
|
A1) Indian |
0.00 |
||
|
Individuals/Hindu
undivided Family |
1551350 |
4.76 |
|
|
NARESH JALAN HUF |
268750 |
0.82 |
|
|
MAHABIR PRASAD
JALAN HUF |
120000 |
0.37 |
|
|
MAHABIR PRASAD
JALAN |
451000 |
1.38 |
|
|
NARESH JALAN |
285750 |
0.88 |
|
|
RASHMI JALAN |
418750 |
1.28 |
|
|
CHAITANYA JALAN |
7100 |
0.02 |
|
|
Any Other
(specify) |
12906819 |
39.60 |
|
|
EASTERN CREDIT
CAPITAL PRIVATE LIMITED |
5618500 |
17.24 |
|
|
RIDDHI PORTFOLIO
PRIVATE LTD |
7288319 |
22.36 |
|
|
RAMKRISHNA RAIL
& INFRASTRUCTURE PVT LTD |
0.00 |
||
|
Sub Total A1 |
14458169 |
44.36 |
|
|
A2) Foreign |
0.00 |
||
|
A=A1+A2 |
14458169 |
44.36 |
Statement showing
shareholding pattern of the Public shareholder
|
Category & Name of the Shareholders |
Total no. shares held |
Shareholding % calculated as per SCRR, 1957
As a % of (A+B+C2) |
|
|
B1) Institutions |
0.00 |
||
|
Mutual Funds/ |
4316953 |
13.25 |
|
|
KOTAK EMERGING
EQUITY SCHEME |
511676 |
1.57 |
|
|
PRINCIPAL TRUSTEE COMPANY
PVT LTD A/C PRINCIPAL MUTUAL FUND - PRINCIPAL PERSONAL TAX SAVER FUND |
471600 |
1.45 |
|
|
RELIANCE CAPITAL
TRUSTEE CO. LTD. - A/C RELIANCE TAX SAVER (ELSS) FUND |
900000 |
2.76 |
|
|
FRANKLIN INDIA
SMALLER COMPANIES FUND |
1029347 |
3.16 |
|
|
BNP PARIBAS
MONTHLY INCOME PLAN |
855069 |
2.62 |
|
|
Foreign Portfolio
Investors |
5667219 |
17.39 |
|
|
ICG Q LIMITED |
700000 |
2.15 |
|
|
INDIA MIDCAP
(MAURITIUS) LTD. |
958733 |
2.94 |
|
|
INDUS INDIA FUND
(SV) LIMITED |
412503 |
1.27 |
|
|
AMANSA HOLDINGS
PRIVATE LIMITED |
2372440 |
7.28 |
|
|
Financial
Institutions/ Banks |
19131 |
0.06 |
|
|
Insurance
Companies |
330598 |
1.01 |
|
|
TATA AIA LIFE
INSURANCE CO LTD-WHOLE LIFE MID CAP |
330598 |
1.01 |
|
|
Any Other
(specify) |
1044215 |
3.20 |
|
|
INTERNATIONAL
FINANCE CORPORATION |
1044215 |
3.20 |
|
|
Sub Total B1 |
11378116 |
34.91 |
|
|
B2) Central
Government/ State Government(s)/ President of India |
0.00 |
||
|
B3)
Non-Institutions |
0.00 |
||
|
Individual share
capital up to INR 0.200 Million |
2043333 |
6.27 |
|
|
Individual share capital
in excess of INR 0.200 Million |
2241066 |
6.88 |
|
|
LATA BHANSHALI |
1058975 |
3.25 |
|
|
NBFCs registered
with RBI |
14204 |
0.04 |
|
|
Any Other
(specify) |
2456620 |
7.54 |
|
|
Trusts |
400 |
0.00 |
|
|
NRI – Repat |
159640 |
0.49 |
|
|
Clearing Members |
35645 |
0.11 |
|
|
NRI – Non- Repat |
19875 |
0.06 |
|
|
Bodies Corporate |
1897009 |
5.82 |
|
|
CHARTERED FINANCE
AND LEASING LIMITED |
511713 |
1.57 |
|
|
Unclaimed or
Suspense or Escrow Account |
1671 |
0.01 |
|
|
ALTERNATIVE
INVESTMENT FUND |
342380 |
1.05 |
|
|
Sub Total B3 |
6755223 |
20.73 |
|
|
B=B1+B2+B3 |
18133339 |
55.64 |
BUSINESS DETAILS
|
Line of Business : |
Manufacturer of Forgings. [Registered Activity] |
|
|
|
|
Brand Names : |
Not Available |
|
|
|
|
Agencies Held : |
Not Available |
|
|
|
|
Exports : |
Not Divulged |
|
|
|
|
Imports : |
Not Divulged |
|
|
|
|
Terms : |
|
|
Selling : |
Not Divulged |
|
|
|
|
Purchasing : |
Not Divulged |
PRODUCTION STATUS: NOT AVAILABLE
GENERAL INFORMATION
|
Suppliers : |
|
||||||||||||||||||||||||||||||
|
|
|
||||||||||||||||||||||||||||||
|
Customers : |
|
||||||||||||||||||||||||||||||
|
|
|
||||||||||||||||||||||||||||||
|
No. of Employees : |
1611 (Approximately) |
||||||||||||||||||||||||||||||
|
|
|
||||||||||||||||||||||||||||||
|
Bankers : |
· State Bank of India · IDBI Bank Limited · Export Import Bank of India · DBS Bank Limited · DCB Bank Limited · ICICI Bank Limited · Standard Chartered Bank · RBL Bank Limited · Karur Vyasa Bank Limited · Federal Bank Limited · International Finance Corporation · Landesbank Baden, Wurttemberg |
||||||||||||||||||||||||||||||
|
|
|
||||||||||||||||||||||||||||||
|
Facilities : |
|
|
|
|
|
Statutory Auditors
: |
|
|
Name : |
Singhi and Company Chartered Accountants |
|
Address : |
161, Sarat Bose Road, Kolkata – 700026, West Bengal, India |
|
|
|
|
Cost Auditors |
|
|
Name : |
U. Sharma and Associates Cost and Management Accountants |
|
Address : |
Hotel
Mayur Building, 1st Floor, Diagonal Road, Bistupur Jamshedpur- 831001, West Bengal,
India |
|
|
|
|
Memberships : |
Not Available |
|
|
|
|
Collaborators : |
Not Available |
|
|
|
|
Enterprises over
which Key Management Personnel and their relatives are able to exercise
significant influence: |
· Riddhi Portfolio Private Limited · Eastern Credit Capital Private Limited · Ramkrishna Rail & Infrastructure Private Limited · Clifftop Infrabuild Private Limited · Northeast Infra Properties Private Limited · Dove Airlines Private Limited * Note: * M/s. Dove
Airlines Private Limited has become 100% subsidiary of M/s. Riddhi Portfolio
Pvt. Ltd. with effect from 15th July 2016. |
|
|
|
|
Subsidiary of the
Company |
· Globe Forex and Travels Limited · Ramkrishna Aviation Land Systems Maritime Private Limited** Notes: ** M/s. Ramkrishna Aviation Land Systems Maritime Pvt. Ltd. has become 100% subsidiary with effect from 20th July 2016 |
|
|
|
|
ESOP Trust of the
Company : |
Ramkrishna Forgings Employee Welfare Trust |
CAPITAL STRUCTURE
AS ON: 31.03.2017
Authorised Capital:
|
No. of Shares |
Type |
Value |
Amount |
|
|
|
|
|
|
29750000 |
Equity Shares |
INR 10/- each |
INR 297.500 Million |
|
|
|
|
|
Issued, Subscribed & Paid-up Capital:
|
No. of Shares |
Type |
Value |
Amount |
|
|
|
|
|
|
28669940 |
Equity Shares |
INR 10/- each |
INR 286.699
Million |
|
|
|
|
|
Reconciliation of the
number of Shares outstanding:
|
Equity Shares |
AS ON 31.03.2017 |
|
Outstanding at the beginning of the year |
28669940 |
|
Add: Shares issued on conversion of warrants |
-- |
|
|
|
|
Outstanding at
the end of the period |
28669940 |
The Company does not
have any Holding Company.
Right, Preference and
restrictions attached to Shares:
The Company has one class of equity shares having a par
value of INR 10/- per share. Each share holder is eligible for one vote per
share held. The dividend proposed by the Board of Director is subject to the
approval of the shareholderes in the ensuing Annual General meeting, except in
case of interim dividend. In the event of liquidation, the equity shareholders
are eligible to receive the remaining assets of the Company after distribution
of all preferential amount, in proportion to their shareholding.
For the year ended 31st March, 2017, the Board of Directors
of the Company has recommended dividend of INR 1/- per share (Previous year INR
2/- per share) to equity shareholders aggregating to INR 28.670 million
(Previous year INR 57.340 million).
Shareholder holding
more than 5 percent shares of the Company:-
|
Name of
Shareholders |
31.03.2017 |
|
|
|
No. of Shares
held |
% of Holding |
|
Riddhi Portfolio Private Limited |
7288319 |
25.42 |
|
Eastern Credit Capital Private Limited |
5618500 |
19.60 |
The Company during
the preceding 5 years -
i. Has not allotted shares pursuant to contracts without payment received in cash.
ii.
Has not allotted shares as fully paid up by way
of bonus shares
iii.
Has not bought back any shares
There are no calls
unpaid by Directors / Officers.
The Company has not
converted any securities into equity shares /preference shares during this
financial year.
The Company has not
forfeited any shares during this financial year.
FINANCIAL DATA
[all figures are
in INR Million]
ABRIDGED
BALANCE SHEET
|
SOURCES OF FUNDS |
31.03.2017 |
31.03.2016 |
31.03.2015 |
|
I.
EQUITY AND LIABILITIES |
|
|
|
|
(1)Shareholders' Funds |
|
|
|
|
(a) Share Capital |
286.699 |
286.699 |
274.699 |
|
(b) Reserves & Surplus |
4622.441 |
4428.317 |
3778.381 |
|
(c) Money received against share warrants |
0.000 |
0.000 |
58.000 |
|
|
|
|
|
|
(2) Share
Application money pending allotment |
0.000 |
0.000 |
0.000 |
|
Total
Shareholders’ Funds (1) + (2) |
4909.140 |
4715.016 |
4111.080 |
|
|
|
|
|
|
(3)
Non-Current Liabilities |
|
|
|
|
(a) Long-term borrowings |
4301.612 |
5072.031 |
4430.287 |
|
(b) Deferred tax liabilities (Net) |
600.987 |
542.709 |
344.409 |
|
(c)
Other long term liabilities |
114.314 |
105.369 |
50.840 |
|
(d)
long-term provisions |
16.099 |
14.108 |
9.782 |
|
Total
Non-current Liabilities (3) |
5033.012 |
5734.217 |
4835.318 |
|
|
|
|
|
|
(4) Current Liabilities |
|
|
|
|
(a)
Short term borrowings |
3398.173 |
3016.288 |
2459.687 |
|
(b)
Trade payables |
2702.649 |
1447.741 |
1334.187 |
|
(c)
Other current liabilities |
1657.708 |
1351.890 |
1245.516 |
|
(d)
Short-term provisions |
7.487 |
75.800 |
74.433 |
|
Total
Current Liabilities (4) |
7766.017 |
5891.719 |
5113.823 |
|
|
|
|
|
|
TOTAL |
17708.169 |
16340.952 |
14060.221 |
|
|
|
|
|
|
II.
ASSETS |
|
|
|
|
(1) Non-current assets |
|
|
|
|
(a)
Fixed Assets |
|
|
|
|
(i)
Tangible assets |
9514.485 |
9367.495 |
5206.665 |
|
(ii)
Intangible Assets |
33.749 |
25.289 |
32.040 |
|
(iii)
Capital work-in-progress |
275.863 |
350.628 |
3156.832 |
|
(iv) Intangible assets under development |
0.000 |
0.000 |
0.000 |
|
(b) Non-current
Investments |
193.032 |
67.032 |
67.032 |
|
(c) Deferred tax assets
(net) |
0.000 |
0.000 |
0.000 |
|
(d) Long-term Loan
and Advances |
697.344 |
765.286 |
571.784 |
|
(e)
Other Non-current assets |
0.000 |
0.000 |
0.000 |
|
Total
Non-Current Assets |
10714.473 |
10575.730 |
9034.353 |
|
|
|
|
|
|
(2) Current assets |
|
|
|
|
(a)
Current investments |
0.000 |
0.000 |
0.000 |
|
(b)
Inventories |
3219.717 |
2200.542 |
1756.055 |
|
(c)
Trade receivables |
3029.377 |
2853.555 |
2618.693 |
|
(d)
Cash and cash equivalents |
10.764 |
14.339 |
4.835 |
|
(e)
Short-term loans and advances |
614.533 |
550.607 |
476.327 |
|
(f)
Other current assets |
119.305 |
146.179 |
169.958 |
|
Total
Current Assets |
6993.696 |
5765.222 |
5025.868 |
|
|
|
|
|
|
TOTAL |
17708.169 |
16340.952 |
14060.221 |
PROFIT
& LOSS ACCOUNT
|
|
PARTICULARS |
31.03.2017 |
31.03.2016 |
31.03.2015 |
|
|
|
SALES |
|
|
|
|
|
|
|
Revenue from Operations [Net] |
8755.105 |
8971.537 |
7407.595 |
|
|
|
Other Income |
25.258 |
34.296 |
57.332 |
|
|
|
TOTAL |
8780.363 |
9005.833 |
7464.927 |
|
|
|
|
|
|
|
|
Less |
EXPENSES |
|
|
|
|
|
|
|
Cost of Materials Consumed |
4219.233 |
4072.890 |
3550.647 |
|
|
|
Changes in inventories of finished goods, work-in-progress
and Stock-in-Trade |
(762.435) |
(358.231) |
148.122 |
|
|
|
Employees benefits expense |
808.019 |
738.708 |
446.810 |
|
|
|
Other expenses |
1968.300 |
2044.199 |
1436.937 |
|
|
|
Power & Fuel |
876.542 |
706.846 |
557.695 |
|
|
|
Exceptional Items |
0.000 |
0.000 |
-74.622 |
|
|
|
TOTAL |
7109.659 |
7204.412 |
6065.589 |
|
|
|
|
|
|
|
|
|
PROFIT
BEFORE INTEREST, TAX, DEPRECIATION AND AMORTISATION |
1670.704 |
1801.421 |
1399.338 |
|
|
|
|
|
|
|
|
|
Less |
FINANCIAL
EXPENSES |
731.588 |
523.861 |
302.955 |
|
|
|
|
|
|
|
|
|
|
PROFIT/
(LOSS) BEFORE TAX, DEPRECIATION AND AMORTISATION |
939.116 |
1277.560 |
1096.383 |
|
|
|
|
|
|
|
|
|
Less/ Add |
DEPRECIATION/
AMORTISATION |
690.435 |
530.225 |
312.165 |
|
|
|
|
|
|
|
|
|
|
PROFIT/ (LOSS)
BEFORE TAX |
248.681 |
747.335 |
784.218 |
|
|
|
|
|
|
|
|
|
Less |
TAX |
58.291 |
198.441 |
36.859 |
|
|
|
|
|
|
|
|
|
|
PROFIT/ (LOSS)
AFTER TAX |
190.390 |
548.894 |
747.359 |
|
|
|
|
|
|
|
|
|
|
EARNINGS IN
FOREIGN CURRENCY |
|
|
|
|
|
|
|
Export of goods calculated on F.O.B. basis |
2432.921 |
3888.538 |
3399.789 |
|
|
|
Die design & preparation charged (Recovered) |
155.159 |
42.198 |
251.092 |
|
|
|
Remittance of Foreign currency on A/c of Dividend to Non-Resident Shareholders |
0.000 |
0.000 |
5.938 |
|
|
TOTAL EARNINGS |
2588.080 |
3930.736 |
3656.819 |
|
|
|
|
|
|
|
|
|
|
IMPORTS |
|
|
|
|
|
|
|
Components and Spare parts |
55.001 |
26.716 |
35.546 |
|
|
|
Capital Goods |
169.312 |
503.999 |
1243.769 |
|
|
TOTAL IMPORTS |
224.313 |
530.715 |
1279.315 |
|
|
|
|
|
|
|
|
|
|
Earnings/ (Loss)
Per Share (INR) |
|
|
|
|
|
|
Basic
|
6.64 |
19.64 |
27.61 |
|
|
|
Diluted
|
6.64 |
19.64 |
26.93 |
|
CURRENT MATURITIES OF LONG TERM DEBT DETAILS
|
PARTICULARS |
31.03.2017 |
31.03.2016 |
31.03.2015 |
|
Current Maturities of Long term debt |
838.939 |
538.961 |
312.536 |
|
|
|
|
|
|
Cash generated from operations |
NA |
NA |
NA |
|
|
|
|
|
|
Net Cash From/(Used In) Operating Activities |
1529.673 |
1092.524 |
488.695 |
KEY
RATIOS
EFFICIENCY RATIOS
|
PARTICULARS |
31.03.2017 |
31.03.2016 |
31.03.2015 |
|
Average Collection Days (Sundry
Debtors / Income * 365 Days) |
126.29 |
116.09 |
129.03 |
|
|
|
|
|
|
Account Receivables Turnover (Income / Sundry Debtors) |
2.89 |
3.14 |
2.83 |
|
|
|
|
|
|
Average Payment Days (Sundry Creditors / Purchases * 365 Days) |
233.80 |
129.74 |
137.15 |
|
|
|
|
|
|
Inventory Turnover (Operating Income / Inventories) |
0.52 |
0.82 |
0.80 |
|
|
|
|
|
|
Asset Turnover (Operating Income / Net Fixed Assets) |
0.17 |
0.18 |
0.17 |
LEVERAGE RATIOS
|
PARTICULARS |
31.03.2017 |
31.03.2016 |
31.03.2015 |
|
Debt Ratio ((Borrowing
+ Current Liabilities) / Total Assets) |
0.73 |
0.70 |
0.70 |
|
|
|
|
|
|
Debt Equity Ratio (Total Liability / Networth) |
1.74 |
1.83 |
1.75 |
|
|
|
|
|
|
Current Liabilities to Networth (Current Liabilities / Net Worth) |
1.58 |
1.25 |
1.24 |
|
|
|
|
|
|
Fixed Assets to Networth (Net Fixed Assets / Networth) |
2.00 |
2.07 |
2.04 |
|
|
|
|
|
|
Interest Coverage Ratio (PBIT / Financial Charges) |
2.28 |
3.44 |
4.62 |
PROFITABILITY RATIOS
|
PARTICULARS |
|
31.03.2017 |
31.03.2016 |
31.03.2015 |
|
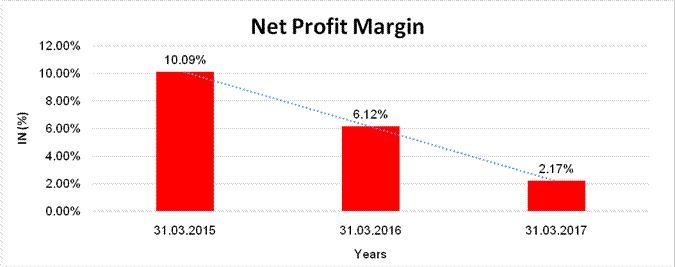
Net Profit Margin ((PAT / Sales) * 100) |
% |
2.17 |
6.12 |
10.09 |
|
|
|
|
|
|
|
Return on Total Assets ((PAT / Total Assets) * 100) |
% |
1.08 |
3.36 |
5.32 |
|
|
|
|
|
|
|
Return on Investment (ROI) ((PAT / Networth) * 100) |
% |
3.88 |
11.64 |
18.18 |
SOLVENCY RATIOS
|
PARTICULARS |
31.03.2017 |
31.03.2016 |
31.03.2015 |
|
Current Ratio (Current
Assets / Current Liabilities) |
0.90 |
0.98 |
0.98 |
|
|
|
|
|
|
Quick Ratio ((Current Assets – Inventories) / Current Liabilities) |
0.49 |
0.61 |
0.64 |
|
|
|
|
|
|
G-Score Ratio Financial (Networth / Total Assets) |
0.28 |
0.29 |
0.29 |
|
|
|
|
|
|
G-Score Ratio Debt (Debts / Equity Capital) |
29.78 |
30.09 |
26.22 |
|
|
|
|
|
|
G-Score Ratio Liquidity (Total Current Assets / Total Current Liabilities) |
0.90 |
0.98 |
0.98 |
Total
Liability = Short-term Debt + Long-term Debt + Current Maturities of Long-term
debts
STOCK
PRICES
|
Face Value |
INR 10.00/- |
|
|
|
|
Market Value |
INR 765.00/- |
FINANCIAL ANALYSIS
[all figures are
in INR Million]
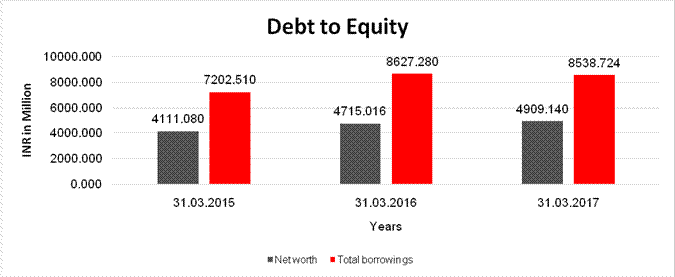
DEBT EQUITY RATIO
|
Particular |
31.03.2015 |
31.03.2016 |
31.03.2017 |
|
|
INR
In Million |
INR
In Million |
INR
In Million |
|
Share Capital |
274.699 |
286.699 |
286.699 |
|
Reserves & Surplus |
3778.381 |
4428.317 |
4622.441 |
|
Money received against share
warrants |
58.000 |
0.000 |
0.000 |
|
Share Application money
pending allotment |
0.000 |
0.000 |
0.000 |
|
Net
worth |
4111.080 |
4715.016 |
4909.140 |
|
|
|
|
|
|
long-term borrowings |
4430.287 |
5072.031 |
4301.612 |
|
Short term borrowings |
2459.687 |
3016.288 |
3398.173 |
|
Current Maturities of Long
term debt |
312.536 |
538.961 |
838.939 |
|
Total
borrowings |
7202.510 |
8627.280 |
8538.724 |
|
Debt/Equity
ratio |
1.752 |
1.830 |
1.739 |
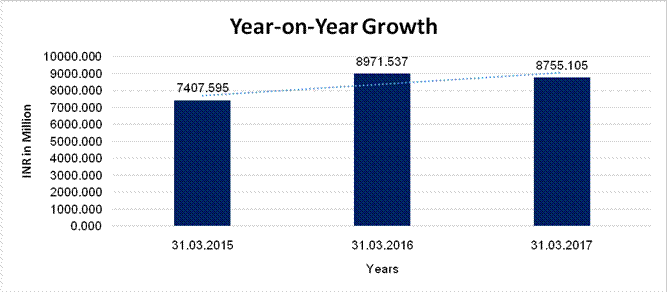
YEAR-ON-YEAR GROWTH
|
Year
on Year Growth |
31.03.2015 |
31.03.2016 |
31.03.2017 |
|
|
INR
In Million |
INR
In Million |
INR
In Million |
|
Sales |
7407.595 |
8971.537 |
8755.105 |
|
|
|
21.113 |
-2.412 |
NET PROFIT MARGIN
|
Net
Profit Margin |
31.03.2015 |
31.03.2016 |
31.03.2017 |
|
|
INR
In Million |
INR
In Million |
INR
In Million |
|
Sales |
7407.595 |
8971.537 |
8755.105 |
|
Profit/ (Loss) |
747.359 |
548.894 |
190.390 |
|
|
10.09% |
6.12% |
2.17% |
LOCAL AGENCY FURTHER INFORMATION
|
Sr. No. |
Check list by
info agents |
Available in
Report (Yes/No) |
|
1 |
Year of establishment |
Yes |
|
2 |
Constitution of the entity -Incorporation
details |
Yes |
|
3 |
Locality of the entity |
Yes |
|
4 |
Premises details |
No |
|
5 |
Buyer visit details |
-- |
|
6 |
Contact numbers |
Yes |
|
7 |
Name of the person contacted |
No |
|
8 |
Designation of contact person |
No |
|
9 |
Promoter’s background |
Yes |
|
10 |
Date of Birth of Proprietor / Partners /
Directors |
Yes |
|
11 |
Pan Card No. of Proprietor / Partners |
No |
|
12 |
Voter Id Card No. of Proprietor / Partners |
No |
|
13 |
Type of business |
Yes |
|
14 |
Line of Business |
Yes |
|
15 |
Export/import details (if applicable) |
No |
|
16 |
No. of employees |
Yes |
|
17 |
Details of sister concerns |
Yes |
|
18 |
Major suppliers |
No |
|
19 |
Major customers |
No |
|
20 |
Banking Details |
Yes |
|
21 |
Banking facility details |
Yes |
|
22 |
Conduct of the banking account |
-- |
|
23 |
Financials, if provided |
Yes |
|
24 |
Capital in the business |
Yes |
|
25 |
Last accounts filed at ROC, if applicable |
Yes |
|
26 |
Turnover of firm for last three years |
Yes |
|
27 |
Reasons for variation <> 20% |
-- |
|
28 |
Estimation for coming financial year |
No |
|
29 |
Profitability for last three years |
Yes |
|
30 |
Major shareholders, if available |
Yes |
|
31 |
External Agency Rating, if available |
Yes |
|
32 |
Litigations that the firm/promoter
involved in |
-- |
|
33 |
Market information |
-- |
|
34 |
Payments terms |
No |
|
35 |
Negative Reporting by Auditors in the
Annual Report |
No |
INDEX OF CHARGES
|
CHARGES REGISTERED |
||||||||
|
SNO |
SRN |
CHARGE ID |
CHARGE HOLDER NAME |
DATE OF CREATION |
DATE OF MODIFICATION |
DATE OF SATISFACTION |
AMOUNT |
ADDRESS |
|
1 |
G76469840 |
100153468 |
INDUSIND BANK LTD. |
15/01/2018 |
- |
- |
550000000.0 |
SAVITRI TOWERS3A UPPER WOOD STREETKOLKATAWB700017IN |
|
2 |
G73280471 |
100146080 |
DCB BANK LIMITED |
05/01/2018 |
- |
- |
220000000.0 |
601 & 602, PENINSULA BUSINESS PARK, 6TH FLOOR,TOWER A, SENAPATI BAPAT MARG, LOWER PAREL,MUMBAIMA400013IN |
|
3 |
G77469559 |
100156311 |
ICICI BANK LIMITED |
20/12/2017 |
- |
- |
999900.0 |
ICICI BANK TOWER, NEAR CHAKLI CIRCLE,OLD PADRA ROADVADODARAGU390007IN |
|
4 |
G76720184 |
100154086 |
ICICI BANK LIMITED |
27/11/2017 |
- |
- |
999900.0 |
ICICI BANK TOWER, NEAR CHAKLI CIRCLE,OLD PADRA ROADVADODARAGU390007IN |
|
5 |
G61653614 |
100133232 |
RBL BANK LIMITED |
13/11/2017 |
- |
- |
250000000.0 |
SHAHUPURI,KOLHAPUR,KOLHAPURMA416001IN |
|
6 |
G56949183 |
100128088 |
AXIS BANK LIMITED |
18/09/2017 |
- |
- |
500000000.0 |
CORPORATE BANKING BRANCH (CBB)1, SHAKESPEARE SARANI, AC MARKET, 3RD FLOORKOLKATAWB700071IN |
|
7 |
G39567235 |
100086510 |
ICICI BANK LIMITED |
29/03/2017 |
- |
- |
250000000.0 |
ICICI BANK TOWER, NEAR CHAKLI CIRCLE,OLD PADRA ROADVADODARAGU390007IN |
|
8 |
G39578034 |
100086541 |
ICICI BANK LIMITED |
29/03/2017 |
- |
- |
500000000.0 |
ICICI BANK TOWER, NEAR CHAKLI CIRCLE,OLD PADRA ROADVADODARAGU390007IN |
|
9 |
G39196944 |
100085512 |
ICICI BANK LIMITED |
25/03/2017 |
- |
- |
500000000.0 |
ICICI BANK TOWER, NEAR CHAKLI CIRCLE,OLD PADRA ROADVADODARAGU390007IN |
|
10 |
G08398430 |
100042149 |
HDFC BANK LIMITED |
20/06/2016 |
- |
- |
10600000.0 |
HDFC BANK HOUSESENAPATI BAPAT MARG, LOWER PAREL (WEST)MUMBAIMH400013IN |
UNSECURED LOANS
|
PARTICULARS |
31.03.2017 (INR
In Million) |
31.03.2016 (INR
In Million) |
|
LONG-TERM BORROWINGS |
|
|
|
From Banks |
|
|
|
Term Loan |
0.000 |
250.000 |
|
|
|
|
|
SHORT TERM BORROWINGS |
|
|
|
Loan repayable on
demand |
|
|
|
From Bank |
194.720 |
395.092 |
|
|
|
|
|
Total |
194.720 |
645.092 |
CONTINGENT
LIABILITIES:
|
Particulars |
31.03.2017 (INR
In Million) |
31.03.2016 (INR
In Million) |
|
Claims against the
Company not acknowledged as debt |
|
|
|
Electricity charges demand of Jharkhand State Electricity Board. (Pending before High Court, Jharkhand) |
4.524 |
4.524 |
|
Demand for Sales Tax for the FY 2003-04 (Appeal pending before the Joint Commissioner of Sales Tax
(Appeal), Jamshedpur) (Paid/Deposit INR 0.022 Million) |
0.022 |
0.022 |
|
Demand for Sales Tax for the FY 2004-05 (Appeal pending before the Joint Commissioner of Sales Tax
(Appeal), Jamshedpur) (Paid/Deposit INR 0.190 Million) |
0.190 |
0.190 |
|
Demand for Sales Tax for the FY 2005-06 (Appeal pending before the Joint Commissioner of Sales Tax
(Appeal), Jamshedpur) (Paid/Deposit INR 0.916 Million) |
0.916 |
0.916 |
|
Demand for Sales Tax for the FY 2015-16 for disallowance of ITC on Consumables and Intra State Stock Transafer (Appeal pending before the Hon'ble Ranchi High Court) |
12.482 |
0.000 |
|
Demand for Sales Tax for the FY 13-14, 14-15 & 15-16 for disallowance of ITC on Consumables and Intra State Stock Transafer (Appeal pending before Commissioner of Sales Tax) |
21.996 |
0.000 |
|
Demand for Sales Tax for the FY 2015-16 regarding ITC disallowed on Sales to Railways / Sales to the extaned to CST liabilities. (Appeal pending before the Hon'ble Ranchi High Court of
INR 2.590 Million & Dy. Commissioner of INR 1.376 Million) |
3.966 |
0.000 |
|
Demand for Service Tax for the FY 2012-13 to 2015-16 towards service tax liabilities on Die Tooling Charges (Appeal pending before the Hon'ble Ranchi High Court of
INR 45.060 Million & Commissioner Appeal of INR 3.339 Million) |
48.399 |
0.000 |
|
Demand for Income Tax for the AY 2007-08 (Appeal pending before the Assistant Commissioner of Income
Tax (Appeals), Kolkata)-(During the year favarable Order received) |
0.000 |
2.838 |
|
Demand for Income Tax for the AY 2010-11 (Appeal pending before the Assistant Commissioner of Income
Tax (Appeals), Kolkata)-(During the year favarable Order received) |
0.000 |
0.016 |
|
Demand for Income Tax for the AY 2011-12 (Appeal pending before the Assistant Commissioner of Income
Tax (Appeals), Kolkata)-(During the year favarable Order received) |
0.000 |
0.007 |
|
Demand for Income
Tax for the AY 2012-13 |
23.362 |
0.000 |
|
(Company has paid Tax as per MAT u/s 115JB of the Income Tax
Act, 1961 for the AY 12-13 after setting off brought forward losses of
earlier years. The demand arises due to disallownace of additional
depreciation and Claim received on Capital Account being treated as Income by
the Assessing Officer. Consequently, as per the A.O. order there is no loss
for the A.Y. 2009-10 which can be set off with the taxable income for the
A.Y. 2012-13. On Appeal with the CIT for the A.Y. 2009-10, the CIT granted
relief to the company on the above points. However, the department has filed
appeal before Income Tax Appellate Tribunal, Kolkata). |
|
|
|
Demand for Service Tax for the FY 2004-05, 2005-06, 2006-07 (upto July 2006) (Appeal pending before the Excise & Service Tax
Appellate Tribunal, Kolkata) (Deposit INR 0.200 Million) |
3.598 |
3.298 |
|
Demand for Service Tax for the FY 2007-08 to 2011-12 (Appeal pending before the Commissioner Central Exices
(Appeals-II), Kolkata) (Deposit INR 0.115 Million) |
3.077 |
1.534 |
|
Demand for Service Tax for the FY 2009-10 (Appeal pending before the Commissioner(Appeals-1),
Kolkata) (Deposit INR 0.037 Million)-(During the year favarable Order
received) |
0.000 |
0.974 |
|
Demand for Central Excise for the FY 2010-11 & FY 2011-12 (Appeal pending before the Commissioner Central Excise
& Service Tax (Appeals-I), Kolkata) (Deposit INR 0.133 Million) |
3.544 |
3.544 |
|
Demand for short deduction of TDS for AY 2015-16 towards foreign payment and Technical Services u/s 195 (Appeal pending before the CIT (A) - 22/Kol) |
0.228 |
0.000 |
|
Demand for short deduction of TDS for AY 2014-15 towards Commitment Fees paid to LBBW, Germany u/s 195 (Appeal pending before the CIT (A) - 22/Kol) |
3.039 |
0.000 |
|
Bank Guarantee |
56.763 |
56.763 |
|
Custom duty on Capital goods imported under EPCG Scheme /
Advance Licence, against which export obligation of INR 42,58.881 Million
(Previous year INR 46,52.835 Million) is to be fulfiled |
612.709 |
636.669 |
|
Corporate guarantee given to State Bank of India, Commercial Branch, Jamshedpur, on behalf of Globe Forex & Travels Ltd, wholly owned Subsidiary of the Company. (Amount outstanding as on 31/03/2017 is INR Nil, Previous year was INR 1,66.947 Million |
0.000 |
220.000 |
|
Corporate guarantee given to ICICI Bank Ltd. RN Mukherjee Branch, Kolkata on behalf of Globe Forex & Travels Ltd, wholly owned Subsidiary of the Company. (Amount outstanding as on 31/03/2017 is INR Nil, Previous year was INR 20.514 Million) |
0.000 |
50.000 |
|
Corporate guarantee given to Axis Bank Limited, Kolkata - INR 250.000 Million on behalf of Globe Forex & Travels Ltd., wholly owned Subsidiary of the Company. (Amount outstanding as on 31/03/2017 is INR 185.114 Million Previous year was INR Nil Million) |
250.000 |
0.000 |
|
Corporate guarantee given to RBL Bank Limited, Kolkata - INR 70.000 Million on behalf of Globe Forex & Travels Ltd., wholly owned Subsidiary of the Company. (Amount outstanding as on 31/03/2017 is INR 34.748 Million, Previous year was INR Nil Million) |
70.000 |
0.000 |
UNAUDITED
FINANCIAL RESULTS FOR THE QUARTER AND HALF YEAR ENDED 31.12.2017
(INR IN MILLION)
|
Particulars |
Six Months Ended 31.12.2017 |
Six Months Ended 30.09.2017 |
Nine Months Ended 31.12.2017 |
|
|
(Unaudited) |
(Unaudited) |
(Unaudited) |
|
|
|
|
|
|
Income
from operations |
|
|
|
|
Revenue from operations |
4000.741 |
3329.851 |
10088.020 |
|
Other Income |
6.517 |
11.525 |
29.208 |
|
Total
Income |
4007.258 |
3341.376 |
10117.228 |
|
|
|
|
|
|
Expenses |
|
|
|
|
Cost of Materials Consumed |
1992.792 |
1764.764 |
5023.016 |
|
Changes in
inventories of finished goods, work-in-progress and Stock-in-Trade |
108.752 |
(144.519) |
(213.831) |
|
Employee benefits expense |
216.973 |
254.783 |
684.074 |
|
Power and Fuel |
328.886 |
296.899 |
888.153 |
|
Finance Costs |
145.879 |
189.908 |
521.170 |
|
Depreciation and
amortisation expense |
204.993 |
198.300 |
597.896 |
|
Excise Duty |
0.000 |
-2.765 |
178.577 |
|
Other expenditure |
582.103 |
509.562 |
1597.826 |
|
Total
Expenses |
3580.378 |
3066.932 |
9276.881 |
|
|
|
|
|
|
Profit
before tax (7-8) |
426.880 |
274.444 |
840.347 |
|
Tax expense |
149.575 |
39.140 |
236.915 |
|
Profit/
loss for the period |
277.305 |
235.304 |
603.432 |
|
Other
comprehensive income |
|
|
|
|
Item that will not be reclassified to profit or loss |
0.695 |
0.696 |
2.086 |
|
income tax relating to items that will not be reclassified to profit or loss |
(0.241) |
(0.240) |
(0.722) |
|
|
0.454 |
0.456 |
1.364 |
|
Item that will be reclassified to profit or loss |
-- |
-- |
-- |
|
income tax relating to items that will be reclassified to profit or loss |
-- |
-- |
-- |
|
Total
comprehensive income |
0.454 |
0.456 |
1.364 |
|
Total
comprehensive income for the period |
277.759 |
235.760 |
604.796 |
|
Paid
- up Equity Share Capital (Face
value of INR 10/- per share) |
325.914 |
325.914 |
325.914 |
|
Earnings Per Share (EPS) |
|
|
|
|
a)
Basic |
8.51 |
7.41 |
19.46 |
|
b)
Diluted |
8.51 |
7.41 |
19.46 |
NOTES:
- The above results have been reviewed by the Audit Committee and approved by the Board of Directors of the Company at their respective meetings held on January 28, 2018 and January 29, 2018. The Statutory Auditors of the Company have carried out a "Limited Review" of the results for the quarter and nine months ended December 31, 2017.
- The Company adopted Indian
Accounting Standards (“Ind AS") from April 01, 2017 and accordingly,
the transition was carried out, from the accounting principles generally
accepted in India as specified under Section 133 of the Companies Act,
2013 read with rule 7 of the Companies (Accounts) Rules, 2014 (previous
GAAP), in accordance with IND AS - 101 "First Time adoption of Indian
Accounting Standards". Accordingly, the impact on transition has been
recorded in retained earnings as April 1, 2016 and the periods presented
have been restated. The reconciliation of the equity for the previous year
ended March 31, 2017 shall be provided while submitting the audited yearly
balance sheet for the year ending March 31, 2018. There is a possibility
that these quarterly and nine months ended financial results may require
adjustment before constituting the final Ind AS financial statements as at
and for the year ending March 31, 2018 due to changes in financial
reporting requirements arising from new or revised standards or
interpretations issued by MCA / appropriate authority or changes in the
use of one or more optional exemptions from full retrospective application
of certain Ind AS as permitted under Ind AS- 101.
The Ind AS financial results and financial information for the comparative quarter and nine months ended December 31, 2016 have not been subjected to any review/ audit. However, the Company's management has exercised necessary' due diligence to ensure that such financial results provide a true and fair view of its results and affairs.
- The Company manufactures “Forging components" and the management reviews the performance of the Company as a single operating segment in accordance with Ind AS 108 "Operating Segments” notified pursuant to Companies (Accounting Standards) Rule, 2015. Accordingly, no separate segment information has been furnished herewith.
- The Company has opted to
publish only standalone unaudited financial results. The Company would be
consolidating and presenting its Consolidated Financial Statements as
at and for the year ending March 31, 2018.
- The Company on July 20, 2017 issued and allotted 39,21,568 equity shares of face value INR 10/- at an issue price of INR 510/- per equity share to raise INR 1,99,99,99,680 by way of Qualified Institutional Placement (“Q1P”) under Chapter VIII of the Securities and Exchange Board of India (Issue of Capital and Disclosure Requirements) Regulations, 2009 thereby increasing the Issued, Subscribed and Paid-up Capital from INR 2,86.699 million to INR 3,25.914 million.
The purpose of fund raising was for
capital expenditure for ongoing and future expansion projects, acquisition,
working capital, repayment of loans and for general corporate purposes.
The expenses incurred in relation to QIP amounting to INR 32.226 million had
been adjusted from Securities Premium Account during the nine months ended
December 31, 2017. The balance proceeds of INR 19,677.73 million has been
utilized for the purpose as mentioned above.
- In accordance with the
requirements of Ind AS, Revenue from Operations of the Company for the
quarter and nine months ended December 31, 2017 and quarter ended September
30, 2017 is net of Goods and Service Tax (GST). Revenue for the period
upto June 30, 2017 including that for the quarter and nine months ended
December 31, 2016 was inclusive of Excise Duly
STATE OF COMPANY’S
AFFAIRS AND FUTURE OUTLOOK
Financial Performance
• Net Sales declined by 2.41 percent from INR 8971.537 million in 2015-16 to INR 8755.105 million in 2016-17.
• Export Sales declined by 35.92 percent from INR 4014.763 Million in 2015-16 to INR 2572.513 Million in 2016-17.
• EBIDTA (excluding other income) decreased by 6.89 percent from INR 1767.125 million in 2015-16 to INR 16,45.446 million in 2016- 17.
• PAT showed a decline of 65.31 percent from INR 548.894 Million in 2015-16 to INR 190.390 Million in 2016-17.
After a decent growth in the first quarter, the M&HCV
industry suffered due to weak replacement demand and deferment of purchase by
fleet operators on uncertainty related to the impact of GST on vehicle prices.
The M&HCV (Truck) segment registered healthy growth during the last quarter
of 2016-17, as the impact of demonetisation was offset by a pick-up on account
of subdued pre-buying related to BS IV implementation. On a overall basis,
M&HCV Production increased by 0.42 % from 341,287 vehicles in 2015-16 to
342,733 vehicles in 2016-17. The sales of M&HCV increased 0.04 % from
302,397 vehicles in 2015-16 to 302,529 vehicles in 2016-17. However, the
exports of the M&HCV vehicles registered an increase of 24.21 % from 35,197
vehicles in 2015-16 to 43,719 vehicles in 2016-17.
MANAGEMENT DISCUSSION
AND ANALYSIS
GLOBAL ECONOMY
Performance: Global GDP growth slowed marginally to 3.1% year-on-year, as deceleration in key emerging and developing economies overshadowed a modest recovery in major developed countries. This deceleration was accompanied by modest increase in commodity prices, subdued global trade, bouts of financial market volatility, and weakening capital flows. Global industrial production (IP) growth slowed to 1.5% year-on-year in 2016, after growing by 1.8% in 2015. IP in OECD (Organisation for Economic Co-operation and Development) countries eased to 0.3% year-on-year in 2016, after growing by 0.8% in 2015.
This could have been worse had it not been for a healthy
uptick in the global economy during the second half of 2016 especially in
advanced economies. Growth picked up in the United States as firms grew more
confident about future demand, and inventories started contributing positively
to growth (after five quarters of drag).
Challenges: Recent political developments highlight a fraying consensus about the benefits of cross-border economic integration. A potential widening of global imbalances coupled with sharp exchange rate movements, should those occur in response to major policy shifts, could further intensify protectionist pressures.
Promise: Consistently good economic news since the summer of 2016 is starting to add up to a brightening global outlook. With buoyant financial markets and a long-awaited cyclical recovery in manufacturing and trade under way, world growth is projected to rise from 3.1% in 2016 to 3.5% in 2017 and 3.6% in 2018.
Activity is projected to pick up markedly in emerging
markets and developing economies because the conditions leading to commodity
exporters experiencing macroeconomic strains are gradually expected to improve,
supported by the partial recovery in commodity prices, while growth is
projected to remain strong in China and many other commodity importers. In
advanced economies, the pickup will be primarily driven by higher projected
growth in the United States, where activity was held back in 2016 by inventory
adjustment and weak investment.
INDIAN ECONOMY
The Indian economy has been growing at an accelerated pace
since 2014, supported by favorable government reforms and stringent fiscal
regime that reigned in inflation. India emerged as a ‘bright spot’ in an
otherwise subdued world economy when it overtook China in 2015-16 as the
fastest-growing major economy in the world.
Despite prevailing headwinds in India and across the globe, India managed to sustain its 7% plus GDP growth momentum registered over the last three years. India’s strong fundamentals enabled it to clock a 7.1% GDP growth in 2016-17, a marginal slip from 7.9% in 2015- 16 – primarily owing to policy initiatives like demonetisation that curbed liquidity in a cashbased consumption economy. (Source: Business Standard)
The industrial sector growth remained lackluster with the Index of Industrial Production (IIP), a measure of industrial performance, registering a 5% in 2016-17, against 3.4% growth in the previous year.
The halving of global oil prices that began in late 2014, boosted economic activity in India, further improved the external current account and fiscal positions and helped lower inflation in the past.
Challenges: A key concern for the country is the health of the banking system, which continues to battle with rising bad loans and heightened corporate vulnerabilities in certain key sectors of the economy. Besides, the firming up of crude oil prices in the end of 2016 at about USD 55/barrel against about USD 45/barrel earlier, reduced commodity exports and almost stagnant non commodity exports in 2016-17 could adversely impact the trade and current account deficits
Outlook: India’s economic growth is expected to improve in 2017-18. This optimism is based on two critical realities. The adoption of the Goods and Service Tax (GST) promises to create a single national market which will enhance efficiency of the movement of goods and services. This critical fiscal policy could make an important contribution to raise India’s medium-term GDP growth momentum to over 8% (Source: IMF).
In addition, the Finance Minister has given a massive thrust on infrastructure development in India – with a budgetary allocation of Rs 396,315 crore towards infrastructure creation and modernization. Further, the Union Budget 2017-18, Agenda to Transform, Energise & Clean India (TEC India) puts an unprecedented thrust on rural infrastructure development. These initiatives are expected to have a multisector cascading impact and promise to make an important contribution to India’s economic resurgence
FORGING INDUSTRY
Forging is about shaping metal blocks into desired shapes by applying compressive forces. This technique enhances the mechanical properties of the block giving it significant additional strength. Hence, forging is generally preferred over other metal shaping techniques.
The Indian forging industry is recognised globally for its technical capabilities. With an installed capacity of around 37.7 lakh TPA, the Indian forging industry has a capability to forge variety of raw materials like carbon steel, alloy steel, stainless steel, super alloy, titanium and aluminum. As a result, forgings are used by almost the entire manufacturing sector, positioning the forging space as an important contributor to the stability and growth of the manufacturing sector.
The Indian forging industry is highly fragment with more than 80% of the units featuring in the small and very small category i.e. below 12,500 TPA capacity.
The automotive sector currently accounts for about 60% of the forging sales. To reduce its dependence on the automotive sector, the Indian forging industry is consciously making efforts towards upgrading technologies and diversifying product range to expand its customer base to emerging sectors including aerospace, energy, oil & gas, heavy engine parts, defence, construction equipment, power generation, power transmission and distribution.
The Indian forging industry is likely to grow at CAGR of
9.5% by 2018, production wise, and reach to 2.97 mn MT in FY 2017-18 from 2.25
mn MT during FY 2014-15, according to Association of Indian Forging Industry.
This optimism is primarily due to the Government thrust on the manufacturing
sector with initiatives like ‘Make in India’ and ‘Skill India’ promising to
catalyse demand over the medium term. Many global OEMs and Tier-I players are
setting up purchasing offices in India to procure high quality forging
products.
Since the Indian forging industry is primarily influenced by the automotive sector, globally and in India, it would be relevant to analyse its performance and prospects in light of the automotive sector. Moreover, as Ramkrishna Forging has a business-critical exposure to the commercial vehicle space globally and in India it would be more appropriate to focus the discussion on this vertical within the automotive space.
After two years of decline that encompassed nearly every major developing market, the global commercial vehicle (CV) market returned to growth in 2016. It is estimated that new CV registrations across 60 markets rose by a combined total of 3.7% to 13.3m, nearly at par with 2013’s record. Even Latin America and the Transition Economies reported a growth, although it was not strong enough to make up for their recent slumps. Nevertheless, a few key markets continued to decline in 2016, including Brazil and Indonesia. They were joined by the US, where weak business investment prompted a 10.7% fall in sales of medium and heavy vehicles.
Overall, it is expected that CV sales could rise at a CAGR
of 4.6% over the 2017-21 forecast period. The strongest growth is likely to be
in Latin America and the Transition Economies (both 6.2%) as they rebound from
their slumps, with Asia not far behind on 5.5%. The slowest CAGR over the
forecast period is expected to be in Western Europe (1.7% in 2017- 21), as it
can fall back from the current surge. However, low commodity prices will continue
to affect companies in many resource dependent emerging markets, notably
Russia, Brazil and the Middle East, preventing them from regaining all the lost
ground.
OUTLOOK 2018-2022
The next five years are expected to be brighter for the
industry
The Truck and Bus Manufacturing industry is expected to grow over the next five years. Industry revenue is forecast to rise at an annualized rate of 1.0% to US$30.1 billion over the five years to 2022. As the global economy continues to improve, international trade and freight levels will rise, creating a greater need for new trucks. Additionally, ageing fleets will become a concern for trucking operators, and companies will invest in new trucks as freight demand grows. These new investments will primarily center on hybrid trucks as freight companies increase demand for cleaner-burning vehicles in anticipation of increased truck regulation.
As the US economy continues to improve, new and replacement demand will support industry growth. Freight demand depends on nearly every sector of the economy. For example, imports of vehicles, clothing and consumer electronics will grow over the next five years as consumer confidence continues to improve; therefore, trucks will be needed to transport these goods. As a result, trucking businesses will keep growing and eventually demand new trucks. Furthermore, a built-up inventory of old trucks will push demand upward, as new trucks are needed to replace aging fleets and accommodate the uptick in freight volume.
However, despite expected revenue growth in the United States, emerging overseas economies will continue enticing manufacturers to focus efforts abroad.
THE INDIAN AUTOMOBILE
SECTOR
The Indian auto industry is one of the largest in the world. The industry accounts for 7.1% of the country’s Gross Domestic Product (GDP). India is also a prominent auto exporter and has strong export growth expectations for the near future.
In terms of volume, India is the biggest market for tractors
as well as two-wheelers. It is also one of the Top five and Top ten markets for
Medium & Heavy Commercial Vehicles (M&HCVs) and Passenger Vehicles,
respectively.
Demographically and economically, India’s automotive industry is well-positioned for growth, servicing both domestic
THE COMMERCIAL
VEHICLE SECTOR
India has emerged as one of the largest markets for commercial vehicles globally. Growth of India commercial vehicles market is underpinned by various macro and micro economic factors which impact the allied industries responsible for generating commercial vehicles demand in the country. Construction, logistics, mining and passenger transportation are few of the major allied industries that require commercial vehicles. Most of the industry players in India in commercial vehicles market have their production facility in the country to cater to domestic demands along with exports to various countries.
Performance: After a healthy growth in the first quarter, the CV industry suffered due to weak replacement demand and After a healthy growth in the first quarter, the CV industry suffered due to weak replacement demand and demand and increasingly export opportunities. A predicted increase in India’s working-age population is likely to help stimulate the burgeoning market for private vehicles. Rising prosperity, easier access to finance and increasing affordability is expected to see four-wheelers gaining volumes, although two wheelers will remain the primary choice for the majority of purchasers, buoyed by greater appetite from rural areas, the youth market and women.
Going forward, The Automotive Mission Plan 2016-26 (AMP
2026) targets a four-fold growth in the automotive industry.
FIXED ASSETS:
TANGIBLE ASSETS
·
Land & Land Development
·
Factory Shed & Building
·
Office Building
·
Plant and Equipment
·
Vehicles
· Furniture’s & Fixtures
·
Computer
·
Office Equipments
·
Air Condition Machine
INTANGIBLE ASSETS
·
Computer Software
CMT REPORT (Corruption, Money Laundering & Terrorism]
The Public Notice information has been collected from various sources
including but not limited to: The Courts, India Prisons Service,
Interpol, etc.
1] INFORMATION ON
DESIGNATED PARTY
No exist designating subject or any of its beneficial owners, controlling
shareholders or senior officers as terrorist or terrorist organization or whom
notice had been received that all financial transactions involving their assets
have been blocked or convicted, found guilty or against whom a judgement or
order had been entered in a proceedings for violating money-laundering,
anti-corruption or bribery or international economic or anti-terrorism sanction
laws or whose assets were seized, blocked, frozen or ordered forfeited for
violation of money laundering or international anti-terrorism laws.
2] Court Declaration :
No records exist to suggest that subject is
or was the subject of any formal or informal allegations, prosecutions or other
official proceeding for making any prohibited payments or other improper payments
to government officials for engaging in prohibited transactions or with
designated parties.
3] Asset Declaration :
No records exist to suggest that the property or assets of the subject
are derived from criminal conduct or a prohibited transaction.
4] Record on Financial
Crime :
Charges or conviction
registered against subject: None
5] Records on Violation of
Anti-Corruption Laws :
Charges or
investigation registered against subject: None
6] Records on Int’l Anti-Money
Laundering Laws/Standards :
Charges or
investigation registered against subject: None
7] Criminal Records
No
available information exist that suggest that subject or any of its principals have
been formally charged or convicted by a competent governmental authority for
any financial crime or under any formal investigation by a competent government
authority for any violation of anti-corruption laws or international anti-money
laundering laws or standard.
8] Affiliation with
Government :
No record
exists to suggest that any director or indirect owners, controlling
shareholders, director, officer or employee of the company is a government
official or a family member or close business associate of a Government
official.
9] Compensation Package :
Our market
survey revealed that the amount of compensation sought by the subject is fair
and reasonable and comparable to compensation paid to others for similar
services.
10] Press Report :
No press reports / filings exists on
the subject.
CORPORATE GOVERNANCE
MIRA INFORM as part of its Due Diligence do provide comments on
Corporate Governance to identify management and governance. These factors often
have been predictive and in some cases have created vulnerabilities to credit
deterioration.
Our Governance Assessment focuses principally on the interactions
between a company’s management, its Board of Directors, Shareholders and other
financial stakeholders.
CONTRAVENTION
Subject is not known to have contravened any existing local laws,
regulations or policies that prohibit, restrict or otherwise affect the terms
and conditions that could be included in the agreement with the subject.
FOREIGN EXCHANGE RATES
|
Currency |
Unit
|
INR |
|
US Dollar |
1 |
INR 65.02 |
|
UK Pound |
1 |
INR 91.46 |
|
Euro |
1 |
INR 80.09 |
INFORMATION DETAILS
|
Information
Gathered by : |
SUP |
|
|
|
|
Analysis Done by
: |
VIV |
|
|
|
|
Report Prepared
by : |
RUP |
SCORE FACTORS
|
DEMERIT POINTS |
|
|
|
--BANK CHARGES |
YES/NO |
YES |
|
--LITIGATION |
YES/NO |
NO |
|
--OTHER ADVERSE INFORMATION |
YES/NO |
NO |
|
MERIT POINTS |
|
|
|
--SOLE DISTRIBUTORSHIP |
YES/NO |
NO |
|
--EXPORT ACTIVITIES |
YES/NO |
NO |
|
--AFFILIATION |
YES/NO |
YES |
|
--LISTED |
YES/NO |
YES |
|
--OTHER MERIT FACTORS |
YES/NO |
YES |
RATING EXPLANATIONS
|
Credit Rating |
Explanation |
Rating Comments |
|
A++ |
Minimum Risk |
Business dealings permissible with minimum
risk of default |
|
A+ |
Low Risk |
Business dealings permissible with low
risk of default |
|
A |
Acceptable Risk |
Business dealings permissible with
moderate risk of default |
|
B |
Medium Risk |
Business dealings permissible on a regular
monitoring basis |
|
C |
Medium High Risk |
Business dealings permissible preferably
on secured basis |
|
D |
High Risk |
Business dealing not recommended or on
secured terms only |
|
NB |
New Business |
No recommendation can be done due to
business in infancy stage |
|
NT |
No Trace |
No recommendation can be done as the
business is not traceable |
NB is stated where there is insufficient information to facilitate rating. However, it is not to be considered as unfavourable.
This score serves as a reference to assess
SC’s credit risk and to set the amount of credit to be extended. It is
calculated from a composite of weighted scores obtained from each of the major
sections of this report. The assessed factors are as follows:
·
Financial
condition covering various ratios
·
Company
background and operations size
·
Promoters
/ Management background
·
Payment
record
·
Litigation
against the subject
·
Industry
scenario / competitor analysis
·
Supplier
/ Customer / Banker review (wherever available)
This report is issued at
your request without any risk and responsibility on the part of MIRA INFORM
PRIVATE LIMITED (MIPL) or its officials.