|
|
|

MIRA
INFORM REPORT
|
Report No. : |
501859 |
|
Report Date : |
04.04.2018 |
IDENTIFICATION DETAILS
|
Name : |
SCG PERFORMANCE
CHEMICALS CO., LTD. |
|
|
|
|
Registered Office : |
1st Floor, 26
Building, 1 Siam Cement Road, Bangsue, Bangkok 10800 |
|
|
|
|
Country : |
Thailand |
|
|
|
|
Financials (as on) : |
31.12.2016 |
|
|
|
|
Date of Incorporation : |
01.07.2008 |
|
|
|
|
Com. Reg. No.: |
0105551069531 |
|
|
|
|
Legal Form : |
Private Limited Company |
|
|
|
|
Line of Business : |
The subject is engaged
in distributing petrochemical specialized
in Polyolefin products,
such as Polyethylene [PE], Polypropylene [PP], High Density
Polyethylene [HDPE], Medium
Density Polyethylene
[MDPE], Low Density Polyethylene [LDPE], Linear
Low Density Polyethylene [LLDPE],
as well as Masterbatch and
Polyethylene Wax for various
industries, such as
plastic & rubber products,
flexible packaging, wires & cables, medical
equipment and automotive
parts industries. |
|
|
|
|
No. of Employees : |
120 |
RATING & COMMENTS
(Mira Inform has adopted New Rating mechanism w.e.f. 23rd
January 2017)
|
MIRA’s Rating : |
A |
|
Credit Rating |
Explanation |
Rating Comments |
|
A |
Acceptable Risk |
Business dealings permissible with
moderate risk of default |
|
Status : |
Satisfactory |
|
|
|
|
Payment Behaviour : |
No Complaints |
|
|
|
|
Litigation : |
Clear |
NOTES:
Any query related to this report can be made
on e-mail: infodept@mirainform.com
while quoting report number, name and date.
ECGC Country Risk Classification List
|
Country Name |
Previous Rating (30.09.2017) |
Current Rating (31.12.2017) |
|
Thailand |
A2 |
A2 |
|
Risk Category |
ECGC Classification |
|
Insignificant |
A1 |
|
Low Risk |
A2 |
|
Moderately Low Risk |
B1 |
|
Moderate Risk |
B2 |
|
Moderately High Risk |
C1 |
|
High Risk |
C2 |
|
Very High Risk |
D |
THAILAND - ECONOMIC OVERVIEW
With a relatively well-developed infrastructure, a free-enterprise
economy, and generally pro-investment policies, Thailand is highly dependent on
international trade, with exports accounting for about two-thirds of GDP.
Thailand’s exports include electronics, agricultural commodities, automobiles
and parts, and processed foods. The industry and service sectors produce about
90% of GDP. The agricultural sector, comprised mostly of small-scale farms,
contributes only 10% of GDP but employs about one-third of the labor force.
Thailand has attracted an estimated 3.0-4.5 million migrant workers, mostly
from neighboring countries.
Over the last few decades, Thailand has sustained strong growth and has
reduced poverty substantially. In 2013, the Thai Government implemented a
nationwide 300 baht (roughly $10) per day minimum wage policy and deployed new
tax reforms designed to lower rates on middle-income earners.
Growth has slowed in the last few years, however, due to domestic
political turmoil and sluggish global demand. Nevertheless, Thailand’s economic
fundamentals are sound, with low inflation, low unemployment, and reasonable
public and external debt levels. Tourism and government spending - mostly on
infrastructure and short-term stimulus measures – have helped to boost the
economy, and The Bank of Thailand has been supportive, with several interest
rate reductions.
Over the longer-term, Thailand faces labor shortages, and domestic debt
levels, political uncertainty, and an aging population pose risks to growth.
|
Source
: CIA |
Company name
SCG PERFORMANCE
CHEMICALS CO., LTD.
SUMMARY
BUSINESS ADDRESS : 1ST FLOOR, 26
BUILDING, 1 SIAM CEMENT ROAD,
BANGSUE,
BANGKOK 10800, THAILAND
TELEPHONE : [66] 2586-4115-7,
2586-1118, 2586-5874, 2586-6883
FAX : [66] 2586-5488,
2586-3676
E-MAIL ADDRESS : scgchemicals@scg.com
REGISTRATION ADDRESS : SAME
AS BUSINESS ADDRESS
ESTABLISHED : 2008
REGISTRATION NO. : 0105551069531
TAX ID NO. : 3033154689
CAPITAL REGISTERED : BHT.
5,000,000
CAPITAL PAID-UP : BHT.
2,500,000
SHAREHOLDER’S PROPORTION : THAI
: 100%
FISCAL YEAR CLOSING DATE : DECEMBER 31
LEGAL STATUS : PRIVATE LIMITED COMPANY
EXECUTIVE : MR. SAKCHAI PATIPARNPREECHAVUD, THAI
MANAGING
DIRECTOR
NO. OF STAFF : 120
LINES OF BUSINESS : PETROCHEMICAL [OLEFINS]
EXPORTER
AND DISTRIBUTOR
CORPORATE PROFILE
OPERATING TREND : STABLE
PRESENT SITUATION : OPERATING NORMALLY
REPUTATION : GOOD
WITH NORMAL BUSINESS
ENGAGEMENT
MANAGEMENT STANDARD : MANAGEMENT WITH
FAIR PERFORMANCE
HISTORY
The subject was established on July
1, 2008 as a
private limited company
under the name
SCG PERFORMANCE CHEMICALS
CO., LTD., by Thai groups,
with the
initial business objective to
manufacture plastic resin.
On September 29,
2009, the subject
was ordered by
The Administrative Court for
an interim injunction of the
plant construction, due to the
community protection for health
and environment purposes
in the Mab
Ta Phut Industrial
Estate area. Therefore,
its business become
to distribute and
export petrochemical [Olefins]
products. The subject currently employs
approximately 120 staff.
The subject is
a wholly owned
subsidiary of SCG
Chemicals Co., Ltd.,
which is a
subsidiary of The
Siam Cement Public Company
Limited, and both
are also member
of the SCG
Group of companies [former :
Siam Cement Group].
The subject’s registered
address is 1st Floor,
26 Building, 1
Siam Cement Rd.,
Bangsue, Bangkok 10800,
and this is
the subject’s current
operation address.
THE BOARD OF DIRECTOR
|
Name |
|
Nationality |
Age |
|
|
|
|
|
|
Mr. Cholanat Yanaranop |
|
Thai |
57 |
|
Mr. Sakchai Patiparnpreechavud |
|
Thai |
49 |
|
Mr. Chaovalit Ekabut |
|
Thai |
58 |
|
Mr. Somchai Wangwattanapanich |
|
Thai |
58 |
AUTHORIZED PERSON
Any two of
the above directors
can jointly sign
on behalf of
the subject with
company’s affixed.
MANAGEMENT
Mr. Sakchai Patiparnpreechavud is
the Managing Director.
He is Thai
nationality with the
age of 49 years
old.
Mr. Nonthapong Isarapakdee is
the Products Manager.
He is Thai
nationality.
Mr. Nitiruk Sirithammapan is
the Sales Manager.
He is Thai
nationality.
BUSINESS OPERATIONS
The subject is engaged
in distributing petrochemical
specialized in Polyolefin
products, such as Polyethylene
[PE], Polypropylene [PP], High
Density Polyethylene [HDPE],
Medium Density Polyethylene [MDPE], Low Density
Polyethylene [LDPE], Linear Low Density
Polyethylene [LLDPE], as well as
Masterbatch and Polyethylene
Wax for various industries,
such as plastic
& rubber products, flexible
packaging, wires &
cables, medical equipment
and automotive parts
industries.
PURCHASE
100% of the products is
purchased from local
suppliers.
MAJOR SUPPLIERS
Thai Polypropylene Co.,
Ltd.
Thai Polyethylene Co.,
Ltd.
Maptaphut Olefins Co.,
Ltd.
Rayong Olefins Co.,
Ltd.
Thai Plastic and
Chemicals Public Company
Limited
SCG Plastics Co.,
Ltd.
SALES
90% of the
products is exported
to Republic of
China, Vietnam, Philippines,
Myanmar, Japan, Indonesia, India, Malaysia, Hong Kong,
Taiwan, New Zealand, Pakistan,
Australia, Dubai, Korea,
Laos, Russia, Singapore
and the countries
in Europe, Middle
East and Africa,
the remaining 10%
is sold locally.
MAJOR CUSTOMERS
Pun Pun Play
Ground and Toys
Co., Ltd. : Thailand
Dadex Eternit Ltd. : Pakistan
SUBSIDIARY AND AFFILIATED COMPANY
The subject is
not found to have
any subsidiary or
affiliated company here
in Thailand.
LITIGATION
Bankruptcy and Receivership
There are no
litigation on bankruptcy and
receivership cases filed
against the subject
found at Legal
Execution Department for
the past five
years.
Others
There are no
legal suits filed
against the subject
according to the
past two years.
CREDIT
Sales are by
cash or on
the credits term
of 30-60 days.
Local bills are
paid by cash
or on the
credits term of
30-60 days.
Exports are against
T/T.
BANKING
Bangkok Bank Public
Company Limited
Kasikornbank Public Company
Limited
The Siam Commercial
Bank Public Company
Limited
EMPLOYMENT
The subject employs
approximately 120 staff.
LOCATION DETAILS
The premise is
rented for administrative office
at the heading
address. Premise is
located in commercial/residential area.
Warehouse is located in
Rayong province.
COMMENT
Subject was formed in 2008 as a distributor and exporter of plastic
resin. The products are for plastic industry.
In 2016 the
chemicals industry was
experiencing an upswing,
due to the
dwindling output from
new derivatives plants.
As well, increase
in supply was
lower than the
growing demand in the market,
which contributed to
the subject’s improvement.
FINANCIAL INFORMATION
The capital was registered at
Bht. 5,000,000 divided
into 50,000 shares
of Bht. 100 each, with
the current capital
paid-up at Bht. 2,500,000 or 50,000
shares of Bht.
50 each.
THE SHAREHOLDERS LISTED
WERE : [as
at April 18,
2016] at Bht.
2,500,000 of capitalization
|
NAME |
HOLDING |
% |
|
|
|
|
|
SCG Chemicals Co.,
Ltd. Nationality: Thai Address : 1
Siam Cement Rd.,
Bangsue, Bangkok |
49,998 |
100.00 |
|
Mr. Veera Khamwongsa Nationality: Thai Address : 143/161
Rimklongprapa Rd., Bangsue,
Bangkok |
1 |
- |
|
Mrs. Veeranuch Sethameteekul Nationality: Thai Address : 40/29 Moo 6, Kukot, Lamlukka, Pathumthani |
1 |
- |
Total Shareholders : 3
Share Structure [as
at April 18,
2016]
|
Nationality |
Shareholders |
No. of Share |
% Shares |
|
|
|
|
|
|
Thai |
3 |
50,000 |
100.00 |
|
Foreign |
- |
- |
- |
|
Total |
3 |
50,000 |
100.00 |
NAME OF AUDITOR & CERTIFIED PUBLIC
ACCOUNTANT NO :
Ms. Dussanee Yimsuwan No. 10235
BALANCE SHEET
[BAHT]
The latest financial
figures published for
December 31, 2016,
2015 and 2014
were:
ASSETS
|
Current Assets |
2016 |
2015 |
2014 |
|
|
|
|
|
|
Cash and Cash Equivalents |
42,089,861 |
162,318,486 |
108,935,157 |
|
Trade Accounts and
Other Receivable |
3,774,392,143 |
3,094,007,900 |
3,365,788,072 |
|
Inventories |
394,923,359 |
366,788,604 |
362,232,262 |
|
Other Current Assets
|
35,558,291 |
25,051,745 |
646,446,908 |
|
Total Current
Assets |
4,246,963,654 |
3,648,166,735 |
4,483,402,399 |
|
Other Long-term Investment |
121,000 |
116,914 |
120,621 |
|
Property, Plant and Equipment |
7,906,464 |
9,524,942 |
11,894,792 |
|
Intangible Assets |
535,889 |
202,576 |
265,166 |
|
Other Non-current Assets |
38,124,743 |
43,305,160 |
47,473,316 |
|
Total Assets
|
4,293,651,750 |
3,701,316,327 |
4,543,156,294 |
LIABILITIES &
SHAREHOLDERS' EQUITY [BAHT]
|
Current
Liabilities |
2016 |
2015 |
2014 |
|
|
|
|
|
|
Bank Overdraft and Short-term Loan from Financial Institutions |
- |
- |
27,891,789 |
|
Trade Accounts and Other
Payable |
3,813,718,769 |
2,692,244,375 |
3,526,927,749 |
|
Short-term Loan |
176,733,890 |
937,765,420 |
871,326,959 |
|
Accrued Income Tax |
30,976,568 |
5,826,513 |
12,739,503 |
|
Other Current Liabilities |
2,023,936 |
2,158,969 |
2,535,047 |
|
Total Current
Liabilities |
4,023,453,163 |
3,637,995,277 |
4,441,421,047 |
|
Deferred Income Tax
Liabilities |
4,867,902 |
5,548,731 |
- |
|
Provision for Employee
Benefits |
22,350,745 |
15,014,389 |
20,753,482 |
|
Other Non-current Liabilities |
- |
- |
12,938,608 |
|
Total Liabilities |
4,050,671,810 |
3,658,558,397 |
4,475,113,137 |
|
|
|
|
|
|
Shareholders'
Equity |
|
|
|
|
|
|
|
|
|
Share capital : Baht 100 par value
Authorized and
issued share capital 50,000 shares |
5,000,000 |
5,000,000 |
5,000,000 |
|
Capital Paid |
2,500,000 |
2,500,000 |
2,500,000 |
|
Retained Earning Appropriated statutory reserve |
500,000 |
500,000 |
500,000 |
|
Unappropriated |
239,952,950 |
39,734,209 |
65,016,470 |
|
Other Components of Equity |
26,990 |
23,721 |
26,687 |
|
Total Shareholders' Equity |
242,979,940 |
42,757,930 |
68,043,157 |
|
Total Liabilities
and Shareholders' Equity |
4,293,651,750 |
3,701,316,327 |
4,543,156,294 |
PROFIT &
LOSS ACCOUNT
|
Revenue |
2016 |
2015 |
2014 |
|
|
|
|
|
|
Sales or Services Income |
38,986,232,979 |
34,153,523,756 |
41,119,264,549 |
|
Interest Income |
58,428 |
64,299 |
92,911 |
|
Other Income |
86,853,751 |
13,494,913 |
35,594,402 |
|
Total Revenues
|
39,073,145,158 |
34,167,082,968 |
41,154,951,862 |
|
Expenses |
|
|
|
|
|
|
|
|
|
Cost of Goods
Sold or Services |
37,568,533,741 |
32,855,537,223 |
39,837,929,604 |
|
Selling Expenses |
557,114,679 |
602,046,305 |
650,746,042 |
|
Administrative Expenses |
635,999,431 |
575,611,231 |
522,423,808 |
|
Other Expenses |
- |
55,344,827 |
22,859,449 |
|
Total Expenses |
38,761,647,851 |
34,088,539,586 |
41,033,958,903 |
|
Profit /[Loss] before Financial
Cost & Income Tax |
311,497,307 |
78,543,382 |
120,992,959 |
|
Financial Cost |
[19,966,716] |
[34,025,395] |
[40,958,912] |
|
Profit/ [Loss] before Income
tax |
291,530,591 |
44,517,987 |
80,034,047 |
|
Expenses [Income] Income
Tax |
[56,311,850] |
[7,300,248] |
[15,433,579] |
|
Net Profit / [Loss] |
235,218,741 |
37,217,739 |
64,600,469 |
FINANCIAL ANALYSIS
|
ITEM |
UNIT |
2016 |
2015 |
2014 |
|
|
|
|
|
|
|
LIQUIDITY RATIO |
|
|
|
|
|
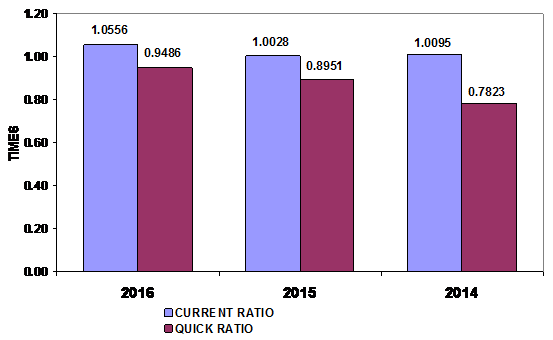
CURRENT RATIO |
TIMES |
1.06 |
1.00 |
1.01 |
|
QUICK RATIO |
TIMES |
0.95 |
0.90 |
0.78 |
|
|
|
|
|
|
|
ACTIVITY RATIO |
|
|
|
|
|
FIXED ASSETS TURNOVER |
TIMES |
4,930.93 |
3,585.69 |
3,456.91 |
|
TOTAL ASSETS TURNOVER |
TIMES |
9.08 |
9.23 |
9.05 |
|
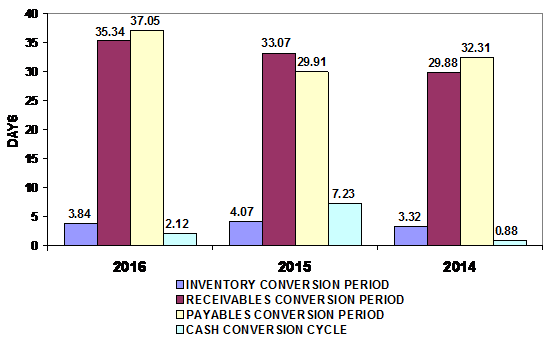
INVENTORY CONVERSION PERIOD |
DAYS |
3.84 |
4.07 |
3.32 |
|
INVENTORY TURNOVER |
TIMES |
95.13 |
89.58 |
109.98 |
|
RECEIVABLES CONVERSION PERIOD |
DAYS |
35.34 |
33.07 |
29.88 |
|
RECEIVABLES TURNOVER |
TIMES |
10.33 |
11.04 |
12.22 |
|
PAYABLES CONVERSION PERIOD |
DAYS |
37.05 |
29.91 |
32.31 |
|
CASH CONVERSION CYCLE |
DAYS |
2.12 |
7.23 |
0.88 |
|
|
|
|
|
|
|
PROFITABILITY
RATIO |
|
|
|
|
|
COST OF GOODS SOLD |
% |
96.36 |
96.20 |
96.88 |
|
SELLING & ADMINISTRATION |
% |
3.06 |
3.45 |
2.85 |
|
INTEREST |
% |
0.05 |
0.10 |
0.10 |
|
GROSS PROFIT MARGIN |
% |
3.86 |
3.84 |
3.20 |
|
NET PROFIT MARGIN BEFORE EX. ITEM |
% |
0.80 |
0.23 |
0.29 |
|
NET PROFIT MARGIN |
% |
0.60 |
0.11 |
0.16 |
|
RETURN ON EQUITY |
% |
96.81 |
87.04 |
94.94 |
|
RETURN ON ASSET |
% |
5.48 |
1.01 |
1.42 |
|
EARNING PER SHARE |
BAHT |
9,408.75 |
1,488.71 |
2,584.02 |
|
|
|
|
|
|
|
LEVERAGE RATIO |
|
|
|
|
|
DEBT RATIO |
TIMES |
0.94 |
0.99 |
0.99 |
|
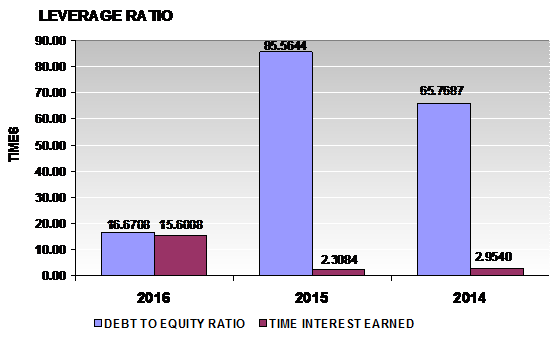
DEBT TO EQUITY RATIO |
TIMES |
16.67 |
85.56 |
65.77 |
|
TIME INTEREST EARNED |
TIMES |
15.60 |
2.31 |
2.95 |
|
|
|
|
|
|
|
ANNUAL GROWTH |
|
|
|
|
|
SALES GROWTH |
% |
14.15 |
(16.94) |
|
|
OPERATING PROFIT |
% |
296.59 |
(35.08) |
|
|
NET PROFIT |
% |
532.01 |
(42.39) |
|
|
FIXED ASSETS |
% |
(16.99) |
(19.92) |
|
|
TOTAL ASSETS |
% |
16.00 |
(18.53) |
|
ANNUAL GROWTH :
IMPRESSIVE
An annual sales growth is 14.15%. Turnover has increased from THB
34,153,523,756.00 in 2015 to THB 38,986,232,979.00 in 2016. While net profit
has increased from THB 37,217,739.00 in 2015 to THB 235,218,741.00 in 2016. And
total assets has increased from THB 3,701,316,327.00 in 2015 to THB
4,293,651,750.00 in 2016.
PROFITABILITY :
RISKY

PROFITABILITY
RATIO
|
Gross Profit Margin |
3.86 |
Deteriorated |
Industrial Average |
35.44 |
|
Net Profit Margin |
0.60 |
Deteriorated |
Industrial Average |
4.84 |
|
Return on Assets |
5.48 |
Deteriorated |
Industrial Average |
42.13 |
|
Return on Equity |
96.81 |
Satisfactory |
Industrial Average |
177.23 |
Gross Profit Margin used to assess a firm's financial health by
revealing the proportion of money left over from revenues after accounting for
the cost of goods sold. Gross profit margin serves as the source for paying
additional expenses and future savings. The company's figure is 3.86%. When
compared with the industry average, the ratio of the company was lower. This
indicated that company may have problems with control over its costs.
Net Profit Margin is the indicator of the company's efficiency in that
net profit takes into consideration all expenses of the company. A low profit
margin indicates a low margin of safety, higher risk that a decline in sales
will erase profits and result in a net loss. The company's figure is 0.6%. When
compared with the industry average, the ratio of the company was lower.
Return on Assets measures how efficiently profits are being generated
from the assets employed in the business when compared with the ratios of firms
in a similar business. A low ratio in comparison with industry averages
indicates an inefficient use of business assets. When compared with the
industry average, it was lower, the
company's figure is 5.48%.
Return on Equity indicates how profitable a company is by comparing its
net income to its average shareholders' equity, ROE measures how much the
shareholders earned for their investment in the company. When compared with the
industry average, it was lower, the company's figure is 96.81%.
Trend of the
average competitors in the same industry for last 5 years
Return on Assets Downtrend
Return on Equity Downtrend
LIQUIDITY :
SATISFACTORY
LIQUIDITY RATIO
|
Current Ratio |
1.06 |
Satisfactory |
Industrial Average |
1.15 |
|
Quick Ratio |
0.95 |
|
|
|
|
Cash Conversion Cycle |
2.12 |
|
|
|
The Current Ratio is to ascertain whether a company's short-term assets
are readily available to pay off its short-term liabilities. The company's
figure is 1.06 times in 2016, increase from 1 time, then it is generally
considered to have good short-term financial strength. When compared with the
industry average, the ratio of the company was lower.
The Quick Ratio is a liquidity indicator that further refines the
current ratio by measuring the amount of the most liquid current assets there
are to cover current liabilities. The company's figure is 0.95 times in 2016,
increase from 0.9 times, by excluding inventory, the company may have problems
meeting current liabilities.
The Cash Conversion Cycle measures the number of days a company's cash
is tied up in the production and sales process of its operations and the
benefit from payment terms from its creditors. It meant the company could
survive when no cash inflow was received from sale for 3 days.
Trend of the
average competitors in the same industry for last 5 years
Current Ratio Downtrend
LEVERAGE :
ACCEPTABLE

LEVERAGE RATIO
|
Debt Ratio |
0.94 |
Acceptable |
Industrial Average |
0.75 |
|
Debt to Equity Ratio |
16.67 |
Risky |
Industrial Average |
3.06 |
|
Times Interest Earned |
15.60 |
Impressive |
Industrial Average |
- |
Debt to Equity Ratio a measurement of how much suppliers, lenders,
creditors and obligors have committed to the company versus what the
shareholders have committed. A higher the percentage means that the company is
using less equity and has stronger leverage position.
Times Interest Earned measuring a company's ability to meet its debt
obligations. Ratio is 15.61 higher than 1, so the company can pay interest
expenses on outstanding debt.
Debt Ratio shows the proportion of a company's assets which are financed
through debt. The company's figure is 0.94 greater than 0.5, most of the
company's assets are financed through debt.
Trend of the
average competitors in the same industry for last 5 years
Debt Ratio Downtrend
Times Interest Earned Stable
ACTIVITY :
IMPRESSIVE
ACTIVITY RATIO
|
Fixed Assets Turnover |
4,930.93 |
Impressive |
Industrial Average |
- |
|
Total Assets Turnover |
9.08 |
Impressive |
Industrial Average |
8.70 |
|
Inventory Conversion Period |
3.84 |
|
|
|
|
Inventory Turnover |
95.13 |
Impressive |
Industrial Average |
49.52 |
|
Receivables Conversion Period |
35.34 |
|
|
|
|
Receivables Turnover |
10.33 |
Satisfactory |
Industrial Average |
10.51 |
|
Payables Conversion Period |
37.05 |
|
|
|
The company's Account Receivable Ratio is calculated as 10.33 and 11.04
in 2016 and 2015 respectively. This ratio measures the efficiency of the
company in managing its trade debtors to generate revenue. A lower ratio may
indicate over extension and collection problems. Conversely, a higher ratio may
indicate an overtly stringent policy. In this case, the company's A/R ratio in
2016 decreased from 2015. This would suggest the company had deteriorated in
the management of its debt collections.
Inventory Turnover in Days Ratio indicates the liquidity of inventory.
It estimates the number of days that it will take to sell the current
inventory. Inventory is particularly sensitive to change in business
activities. The inventory turnover in days is 4 days at the end of 2015, same
number of days
as in 2016. This represents a positive trend. And
Inventory turnover has increased from 89.58 times in year 2015 to 95.13 times
in year 2016.
The company's Total Asset Turnover is calculated as 9.08 times and 9.23 times
in 2016 and 2015 respectively. This ratio is determined by dividing total
assets into total sales turnover. The ratio measures the activity of the assets
and the ability of the firm to generate sales through the use of the assets.
Trend of the average
competitors in the same industry for last 5 years
Fixed Assets Turnover Stable
Total Assets Turnover Uptrend
Inventory Turnover Uptrend
Receivables Turnover Uptrend
FOREIGN EXCHANGE RATES
|
Currency |
Unit
|
Indian Rupees |
|
US Dollar |
1 |
INR 65.02 |
|
|
1 |
INR 91.46 |
|
Euro |
1 |
INR 80.09 |
|
Thai Baht |
1 |
INR 2.09 |
Note :
Above are approximate rates obtained from sources believed to be correct
INFORMATION DETAILS
|
Analysis Done by
: |
VIV |
|
|
|
|
Report Prepared
by : |
NIT |
RATING EXPLANATIONS
|
Credit Rating |
Explanation |
Rating Comments |
|
A++ |
Minimum Risk |
Business dealings permissible with minimum
risk of default |
|
A+ |
Low Risk |
Business dealings permissible with low
risk of default |
|
A |
Acceptable Risk |
Business dealings permissible with
moderate risk of default |
|
B |
Medium Risk |
Business dealings permissible on a regular
monitoring basis |
|
C |
Medium High Risk |
Business dealings permissible preferably
on secured basis |
|
D |
High Risk |
Business dealing not recommended or on
secured terms only |
|
NB |
New Business |
No recommendation can be done due to
business in infancy stage |
|
NT |
No Trace |
No recommendation can be done as the
business is not traceable |
NB is stated where there is insufficient information to facilitate rating. However, it is not to be considered as unfavourable.
This score serves as a reference to assess
SC’s credit risk and to set the amount of credit to be extended. It is
calculated from a composite of weighted scores obtained from each of the major
sections of this report. The assessed factors are as follows:
·
Financial
condition covering various ratios
·
Company
background and operations size
·
Promoters
/ Management background
·
Payment
record
·
Litigation
against the subject
·
Industry
scenario / competitor analysis
·
Supplier
/ Customer / Banker review (wherever available)
This report is issued at
your request without any risk and responsibility on the part of MIRA INFORM
PRIVATE LIMITED (MIPL) or its officials.