|
|
|


MIRA INFORM REPORT
|
Report No. : |
502819 |
|
Report Date : |
10.04.2018 |
IDENTIFICATION DETAILS
|
Name : |
NMDC LIMITED |
|
|
|
|
Formerly Known
As : |
NATIONAL MINERAL DEVELOPMENT CORPORATION LIMITED NATIONAL MINERAL DEVELOPMENT CORPORATION PRIVATE LIMITED |
|
|
|
|
Registered
Office : |
Khanjhi Bhavan, 10-3-311 / A, Castle Hills, Masab Tank,
Hyderabad-500028, Andhra Pradesh |
|
Tel. No.: |
91-40- 23538713-21 (9 Lines) / 23538711 |
|
|
|
|
Country : |
India |
|
|
|
|
Financials (as
on) : |
31.03.2017 |
|
|
|
|
Date of
Incorporation : |
15.11.1958 |
|
|
|
|
Com. Reg. No.: |
01-001674 |
|
|
|
|
Capital
Investment / Paid-up Capital : |
INR 3163.900 Million |
|
|
|
|
CIN No.: [Company Identification
No.] |
L13100AP1958GOI001674 |
|
|
|
|
IEC No.: |
Not Divulged |
|
|
|
|
TAN No.: [Tax Deduction &
Collection Account No.] |
Not Available |
|
|
|
|
GSTN : [Goods & Service Tax
Registration No.] |
Not Divulged |
|
|
|
|
PAN No.: [Permanent Account No.] |
Not Divulged |
|
|
|
|
Legal Form : |
A Public Limited Liability Company. The Company’s Shares are Listed on
the Stock Exchanges. |
|
|
|
|
Line of Business
: |
The subject is engaged in Exploration and Production of Iron
Ore, Copper along with Diamond, production and sale of Sponge Iron and
Generation and sale of Wind Power. [Confirmed by Management] |
|
|
|
|
No. of Employees
: |
5490 (Approximately) |
RATING & COMMENTS
(Mira Inform has adopted New Rating mechanism w.e.f. 23rd
January 2017)
|
MIRA’s Rating : |
A++ |
|
Credit Rating |
Explanation |
Rating Comments |
|
A++ |
Minimum Risk |
Business dealings permissible with minimum
risk of default |
|
Maximum Credit Limit : |
USD 640000000 |
|
|
|
|
Status : |
Excellent |
|
|
|
|
Payment Behaviour : |
Regular |
|
|
|
|
Litigation : |
Exist |
|
|
|
|
Comments : |
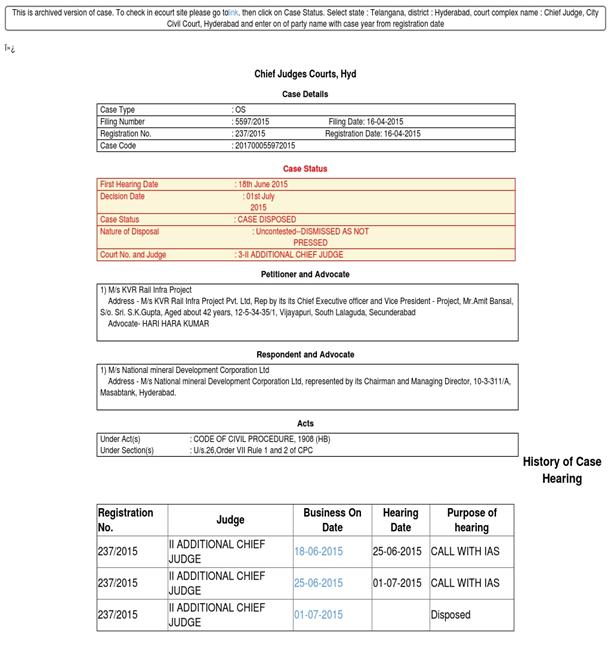
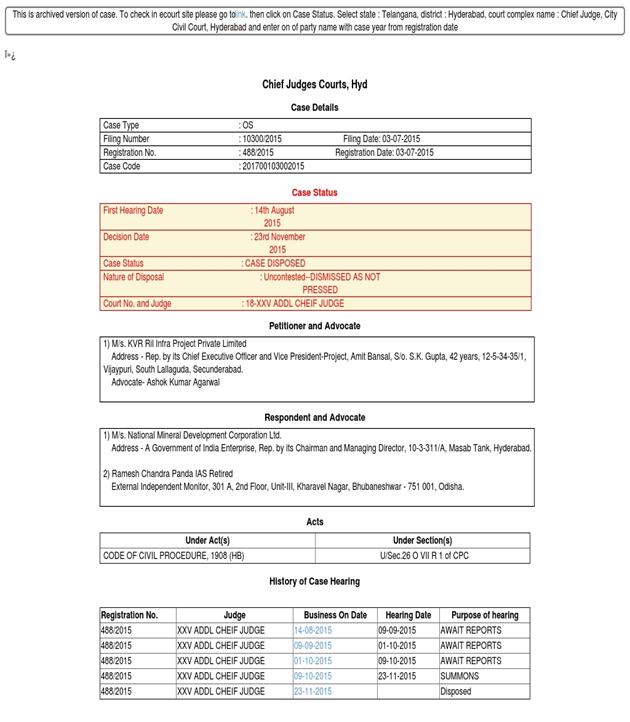
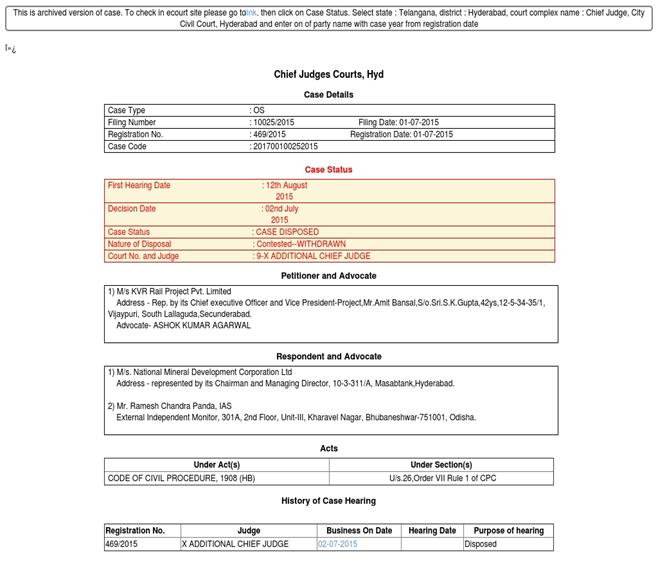
Subject is a state-controlled mineral producer of the Government of India. It is owned by the Government of India and is under administrative control of the Ministry of Steel. It was incorporated in the year 1958 and is engaged in the exploration of oil and minerals. It is an old and well-established company having an excellent track record. For the financial year 2017, the company has increased its revenue from operation as compared to previous year and maintained healthy profit margin of 29.32%. The rating draw comfort from the strong financial profile of the company marked by a robust capital structure and debt protection metrics. The ratings continue to reflect the strategic importance and expectation of continued support from the Government of India, over 30 years of reserves in existing mines and Valid Mining Licences. Share price are quoted high on stock exchange (Share Price of INR 132 with face value of INR 01). Trade relations are reported as fair. Payments are reported to be regular and as per commitments. In view of strong financial base and established market position, the company can be considered good for normal business dealings at usual trade terms and conditions. |
NOTES :
Any query related to this report can be made
on e-mail : infodept@mirainform.com
while quoting report number, name and date.
ECGC Country Risk Classification List
|
Country Name |
Previous Rating (30.09.2017) |
Current Rating (31.12.2017) |
|
India |
A1 |
A1 |
|
Risk Category |
ECGC
Classification |
|
Insignificant |
A1 |
|
Low Risk |
A2 |
|
Moderately Low Risk |
B1 |
|
Moderate Risk |
B2 |
|
Moderately High Risk |
C1 |
|
High Risk |
C2 |
|
Very High Risk |
D |
EXTERNAL AGENCY RATING
|
Rating Agency Name |
INDIA RATING |
|
Rating |
Bank Facility = AAA |
|
Rating Explanation |
Highest degree of safety and carry lowest credit risk. |
|
Date |
29.12.2016 |
|
Rating Agency Name |
INDIA RATING |
|
Rating |
Non Fund Based Limit = A1+ |
|
Rating Explanation |
Very strong degree of safety and carry lowest credit risk |
|
Date |
29.12.2016 |
RBI DEFAULTERS’ LIST STATUS
Subject’s name is not enlisted as a defaulter
in the publicly available RBI Defaulters’ list.
EPF (Employee Provident Fund) DEFAULTERS’ LIST STATUS
Subject’s name is not enlisted as a defaulter in
the publicly available EPF (Employee Provident Fund) Defaulters’ list as of
31-03-2016.
BIFR (Board for Industrial & Financial Reconstruction) LISTING
STATUS
Subject’s name is not listed as a Sick Unit in
the publicly available BIFR (Board for Industrial & Financial
Reconstruction) list as of 10.04.2018
IBBI (Insolvency and Bankruptcy Board of India) LISTING STATUS
Subject’s name is not listed in the publicly
available IBBI (Insolvency and Bankruptcy Board of India) list as of report
date.
INFORMATION PARTED BY [GENERAL DETAILS]
|
Name : |
Mr. Mahendra Kashyap |
|
Designation : |
Production Department Manager |
|
Contact No.: |
91-7857-230356 |
|
Date : |
09.04.2018 |
LOCATIONS
|
Registered/ Correspondence:
Office:
|
Khanjhi Bhavan, 10-3-311 / A, Castle Hills, Masab Tank,
Hyderabad-500028, Andhra Pradesh, India |
|
Tel. No.: |
91-40- 23538713-21 (9 Lines) / 23538711 |
|
Mobile No.: |
91-9425266438 [Mr. Narayana Asampally] |
|
Fax No.: |
91-40-23538711 |
|
E-Mail : |
|
|
Website : |
|
|
Location : |
Owned |
|
Locality : |
Commercial |
|
|
|
|
Factories : |
PLANT / MINE LOCATIONS: The mines / units of
the Company are located in the following locations: ·
Bailadila Iron Ore Mine Kirandul
Complex P.O. Kirandul District:
Dantewada, Chhattisgarh, India ·
Bailadila Iron Ore Mine Bacheli
Complex P.O. Bacheli District,
Dantewada Chhattisgarh - 494553, India ·
Donimalai Iron Ore Mine Donimalai
Township District Bellary - 583 118, Karnataka ,India ·
Diamond Mining Project Majhgawan, Panna
- 488 001, Madhya Pradesh, India ·
Sponge Iron Unit, NMDC Limited, SIIL
Campus, Paloncha - 507 154, District Khammam, Andhra Pradesh, India ·
Post Nagarnar District Bastar-494001,
Chhattisgarh, India |
DIRECTORS
AS ON: 31.03.2017
|
Name : |
Mr. Ramakishan Ramakishan Tanugula |
|
Designation : |
Director |
|
Address : |
Plot No. 62, Maithri Enclave, Near Tulasi Gardens, Yapral, Secunderabad, Hyderabad-500087, Telangana, India |
|
Date of Appointment : |
17.11.2014 |
|
DIN No.: |
01312449 |
|
|
|
|
Name : |
Bhagwati Devi Baldwa |
|
Designation : |
Director |
|
Address : |
8-2-684/11/2, Road No. 12 Banjara Hills Hyderabad 500034, Andhra Pradesh, India |
|
Date of Appointment : |
13.11.2015 |
|
DIN No.: |
01537251 |
|
|
|
|
Name : |
Mr. Arun Kumar Srivastava |
|
Designation : |
Director |
|
Address : |
B 3/12, Vishal Khand 3, Lucknow 226010, Uttar Pradesh, India |
|
Date of Appointment : |
13.11.2015 |
|
DIN No.: |
01940109 |
|
|
|
|
Name : |
Mr. Pradip Bhargava |
|
Designation : |
Director |
|
Address : |
C-2/21 Charimli, Bhopal-462016, Madhya Pradesh, India |
|
Date of Appointment : |
27.11.2015 |
|
DIN No.: |
01986827 |
|
|
|
|
Name : |
Mr. Devinder Singh Ahluwalia |
|
Designation : |
Director |
|
Address : |
Dda Flat No. 17, Pocket-Mgi Block-M, Vikash Puri, New Delhi-110018, India |
|
Date of Appointment : |
29.09.2015 |
|
DIN No.: |
02164448 |
|
|
|
|
Name : |
Mr. Narendra Kumar Nanda |
|
Designation : |
Wholetime Director |
|
Address : |
F.No.101, Hno. 8-1-305 & 306, Anand Brindavan Apts Puranbagh, Tolichowki, Golconda Hyderabad 500008, Telangana, India |
|
Date of Appointment : |
07.12.2008 |
|
DIN No.: |
02455894 |
|
|
|
|
Name : |
Mr. Rajesh Kumar Mangal |
|
Designation : |
Director |
|
Address : |
482, Mahavir Nagar - Pratham, Durgapura, Ward No. 21, Jaipur-302018, Rajasthan, India |
|
Date of Appointment : |
13.11.2015 |
|
DIN No.: |
03033081 |
|
|
|
|
Name : |
Mr. Baijendra Kumar Narayanan Nair |
|
Designation : |
Managing Director |
|
Address : |
D-I/5 Officers Colony Devendranagar Raipur 492001, Chhattisgarh, India |
|
Date of Appointment : |
06.09.2017 |
|
DIN No.: |
03289526 |
|
|
|
|
Name : |
Mr. Ashok Kumar Angurana |
|
Designation : |
Additional Director |
|
Address : |
26, Road No 57 Punjabi Bagh (West), New Delhi-110026, India |
|
Date of Appointment : |
16.11.2017 |
|
DIN No.: |
06600185 |
|
|
|
|
Name : |
Mr. Pradip Satpathy Kumar |
|
Designation : |
Director |
|
Address : |
Qtr No. V/2, Biom Bacheli Complex Po-Bacheli, Dantewada-494553, Madhya Pradesh, India |
|
Date of Appointment : |
13.12.2014 |
|
DIN No.: |
07036432 |
|
|
|
|
Name : |
Mr. Sunil Barthwal |
|
Designation : |
Nominee Director |
|
Address : |
D-I/84, Satya Marg Chanakya Puri New Delhi 110021, India |
|
Date of Appointment : |
11.10.2017 |
|
DIN No.: |
07066759 |
|
|
|
|
Name : |
Mr. Sandeep Tula |
|
Designation : |
Director |
|
Address : |
Flat No.308, Vijaya Sree Apartment Santosh Nagar Colony, Mehadipatnam, Asif Nagar, Hyderabad-500028, Telangana, India |
|
Date of Appointment : |
08.08.2016 |
|
DIN No.: |
07261884 |
|
|
|
|
Name : |
Mr. Shyam Murari Nigam |
|
Designation : |
Director |
|
Address : |
Block E, Flat No.4-1, Sector -13 R.K. Puram, New Delhi-110066, India |
|
Date of Appointment : |
27.11.2015 |
|
DIN No.: |
07355272 |
|
|
|
|
Name : |
Mrs. Syamal Kumar Sarkar |
|
Designation : |
Director |
|
Address : |
C-11/125, Satya Marg Chanakya Puri, New Delhi-110021, India |
|
Date of Appointment : |
27.11.2015 |
|
DIN No.: |
07387840 |
|
|
|
|
Name : |
Mrs. Saraswati Prasad |
|
Designation : |
Director |
|
Address : |
D-9, 9th Floor, Tower 9 New Moti Bagh, Delhi-110023, India |
|
Date of Appointment : |
08.02.2017 |
|
DIN No.: |
07729788 |
KEY EXECUTIVES
|
Name : |
Mr. Devinder Singh Ahluwalia |
|
Designation : |
Chief Finance Officer |
|
Address : |
DDA Flat No. 17, Pocket-Mgi Block-M, Vikash Puri, New Delhi-110018, India |
|
Date of Appointment : |
01.01.2015 |
|
PAN No.: |
ABZPA3153E |
|
|
|
|
Name : |
Mr. Akella Sri Pardha Saradhi |
|
Designation : |
Company Secretary |
|
Address : |
10-3-311/A, NMDC Ltd Khanij Bhawan, Masabtank, Hyderabad-500028, Telangana, India |
|
Date of Appointment : |
22.01.2015 |
|
PAN No.: |
ADNPA7837P |
|
|
|
|
Name : |
Mr. Mahendra Kashyap |
|
Designation : |
Production Department Manager |
MAJOR SHAREHOLDERS / SHAREHOLDING PATTERN
AS ON: 31.12.2017
|
Category of shareholder |
Total nos. shares held |
Shareholding as a % of total no. of shares
(calculated as per SCRR, 1957)As a % of (A+B+C2) |
|
|
(A) Promoter &
Promoter Group |
2371126192 |
74.94 |
|
|
(B) Public |
792764282 |
25.06 |
|
|
Grand Total |
3163890474 |
100.00 |
Statement showing
shareholding pattern of the Promoter and Promoter Group
|
Category of shareholder |
Total nos. shares held |
Shareholding as a % of total no. of shares (calculated
as per SCRR, 1957)As a % of (A+B+C2) |
|
|
A1) Indian |
0.00 |
||
|
Central
Government/ State Government(s) |
2371126192 |
74.94 |
|
|
PRESIDENT OF INDIA |
2371126192 |
74.94 |
|
|
Sub Total A1 |
2371126192 |
74.94 |
|
|
A2) Foreign |
0.00 |
||
|
A=A1+A2 |
2371126192 |
74.94 |
Statement showing
shareholding pattern of the Public shareholder
|
Category & Name of the Shareholders |
Total no. shares held |
Shareholding % calculated as per SCRR, 1957
As a % of (A+B+C2) |
|
|
B1) Institutions |
0.00 |
||
|
Mutual Funds/ |
24753778 |
0.78 |
|
|
Foreign Portfolio
Investors |
113790310 |
3.60 |
|
|
Financial
Institutions/ Banks |
104036630 |
3.29 |
|
|
LIC OF INDIA
PENSION PLUS MIXED FUND |
63892411 |
2.02 |
|
|
Insurance
Companies |
421369958 |
13.32 |
|
|
LIFE INSURANCE
CORPORATION OF INDIA |
389938677 |
12.32 |
|
|
Any Other
(specify) |
694515 |
0.02 |
|
|
Foreign
Institutional Investors |
694515 |
0.02 |
|
|
Sub Total B1 |
664645191 |
21.01 |
|
|
B2) Central
Government/ State Government(s)/ President of India |
0.00 |
||
|
B3)
Non-Institutions |
0.00 |
||
|
Individual share
capital up to INR 0.200 Million |
90914167 |
2.87 |
|
|
Individual share
capital in excess of INR 0.200 Million |
4233074 |
0.13 |
|
|
NBFCs registered
with RBI |
269355 |
0.01 |
|
|
Employee Trusts |
51657 |
0.00 |
|
|
Any Other
(specify) |
32650838 |
1.03 |
|
|
NRI – Non- Repat |
1477995 |
0.05 |
|
|
NRI – Repat |
4164788 |
0.13 |
|
|
Bodies Corporate |
17703616 |
0.56 |
|
|
Clearing Members |
2920351 |
0.09 |
|
|
Trusts |
6379309 |
0.20 |
|
|
Unclaimed or Suspense
or Escrow Account |
1840 |
0.00 |
|
|
IEPF |
2939 |
0.00 |
|
|
Sub Total B3 |
128119091 |
4.05 |
|
|
B=B1+B2+B3 |
792764282 |
25.06 |
Details of Shares
which remain unclaimed for Public
|
Serial No. |
Number of shareholders |
Outstanding shares held in demat or
unclaimed suspense account |
voting rights which are frozen |
Disclosure of notes on shares which remain
unclaimed for public shareholders |
|
|
1 |
23 |
1840 |
1840 |
BUSINESS DETAILS
|
Line of Business : |
The subject is engaged in Exploration and Production of
Iron Ore, Copper along with Diamond, production and sale of Sponge Iron and
Generation and sale of Wind Power. [Confirmed by Management] |
|
|
|
|
Brand Names : |
Not Available |
|
|
|
|
Agencies Held : |
Not Available |
|
|
|
|
Exports : |
Not Available |
|
|
|
|
Imports : |
Not Available |
|
|
|
|
Terms : |
|
|
Selling : |
Advance Payments and Others [RTGS, NEFT] |
|
|
|
|
Purchasing : |
Advance Payments and Others [RTGS, NEFT] |
PRODUCTION STATUS: [NOT AVAILABLE]
GENERAL INFORMATION
|
Suppliers : |
|
||||||||||||||||||||||
|
|
|
||||||||||||||||||||||
|
Customers : |
Wholesaler, End Users and Manufacturers · Rashtriya Ispat Nigam Limited, (VSP) · KIOCL Limited · Essar Steels Limited · JSW Steel Limited · Ispat Industries Limited · CG based Sponge Iron Units · Welspun Max Steel Limited ·
Visveswaraya Iron & Steel Plant |
||||||||||||||||||||||
|
|
|
||||||||||||||||||||||
|
No. of Employees : |
5490 (Approximately) |
||||||||||||||||||||||
|
|
|
||||||||||||||||||||||
|
Bankers : |
·
State Bank of India |
||||||||||||||||||||||
|
|
|
||||||||||||||||||||||
|
Facilities : |
|
|
|
|
|
Auditors : |
|
|
Name : |
Venugopal and Chenoy Chartered Accountants |
|
|
|
|
Statutory Auditors : |
|
|
Name: |
Tej Raj and Pal Chartered Accountants |
|
Address: |
Hyderabad, Telangana, India |
|
|
|
|
Branch Auditors : |
|
|
Name: |
O P Totla and Company Chartered Accountants |
|
Address: |
Raipur, Chhattisgarh, India |
|
|
|
|
Name: |
Vijay Panchappa and Company Chartered Accountants |
|
Address: |
Dharwad, Karnataka, India |
|
|
|
|
Name: |
Amit OM and Company Chartered Accountants |
|
Address: |
Allahabad, Uttar Pradesh, India |
|
|
|
|
Secretarial Auditors : |
|
|
Name: |
D. Hanumanta Raju and Company Chartered Accountants |
|
Address: |
Hyderabad, Telangana, India |
|
|
|
|
Cost Auditors : |
|
|
Name: |
Prasad Bharathula and Associates Cost Accountants |
|
Address: |
Hyderabad, Telangana India |
|
|
|
|
Memberships : |
Not Available |
|
|
|
|
Collaborators : |
Not Available |
|
|
|
|
Subsidiary
Companies: |
· Legacy Iron Ore Limited · J & K Mineral Development Corporation Limited · NMDC Power Limited · Karnataka Vijaynagar Steel Limited · NMDC Steel Limited · Jharkhand Kolhan Steel Limited · NMDC-SARL, Madagaskar (Under closure) |
|
|
|
|
Joint Venture
Companies : |
· Kopano-NMDC Minerals (Proprietary) Limited · Jharkhand National Mineral Development Corporation Limited · NMDC-CMDC Limited. Raipur · NMDC-SAIL Limited · Bastar Railway Private Limited |
|
|
|
|
Associate Companies
: |
· Romelt-Sail (India) Limited* · International Coal Ventures Private Limited · Krishnapatnam Railway Company Limited · Chhattisgarh Mega Steel Limited · Neelachal Ispat Nigam Limited |
* In the process of liquidation. Public notice has been
issued by GOI, Ministry of Corporate affairs vide their notice dated 27.04.2017
to remove/strike off the name of the Company from the Registrar of Companies
unless a cause is shown to the contrary within 30 days from the date of notice.
CAPITAL STRUCTURE
AS ON: 31.03.2017
Authorised Capital:
|
No. of Shares |
Type |
Value |
Amount |
|
|
|
|
|
|
4000000000 |
Equity Shares |
INR 1/- each |
INR 4000.000 Million |
|
|
|
|
|
Issued, Subscribed & Paid-up Capital:
|
No. of Shares |
Type |
Value |
Amount |
|
|
|
|
|
|
3964716000 |
Equity Shares |
INR 1/- each |
INR 3964.700
Million |
|
800825526 |
Repurchase of Equity shares |
INR 1/- each |
INR 800.800
Million |
|
|
|
|
|
|
|
Total |
|
INR 4765.500 Million |
ADDL. NOTES:
No new shares were issued during the current year.
Board of Directors of the Company in its meeting held on 7th June 2016 approved buyback of 80,08,25,526 equity shares @ INR 94/- for an aggregate consideration of INR 75277.600 million. The buyback offer of shares was closed on 30th September 2016 and the process for buyback was been completed on 10th October 2016. The buyback offer was fully subscribed.
Terms/Rights attached to equity shares: “The Company has only one class of equity shares having par value of INR 1/- each and each holder of equity shares is entitled to one vote per share.
The details of shares in the company held by each shareholder holding more than 5% shares:
|
Name of the Share
holders |
31-Mar-2017 |
|
|
|
% of share Holding |
Number of shares |
|
President of India |
74.94 |
2371126192 |
|
LIC of India (incl all schemes) |
12.32 |
389938677 |
FINANCIAL DATA
[all figures are
in INR Million]
ABRIDGED
BALANCE SHEET [STANDALONE]
|
SOURCES OF FUNDS |
31.03.2017 |
31.03.2016 |
31.03.2015 |
|
I.
EQUITY AND LIABILITIES |
|
|
|
|
(1)Shareholders' Funds |
|
|
|
|
(a) Share Capital |
3163.900 |
3964.700 |
3964.700 |
|
(b) Reserves & Surplus |
222025.500 |
287211.200 |
319009.000 |
|
(c) Money received against share warrants |
0.000 |
0.000 |
0.000 |
|
|
|
|
|
|
(2) Share Application
money pending allotment |
0.000 |
0.000 |
0.000 |
|
Total
Shareholders’ Funds (1) + (2) |
225189.400 |
291175.900 |
322973.700 |
|
|
|
|
|
|
(3)
Non-Current Liabilities |
|
|
|
|
(a) Long-term borrowings |
0.000 |
0.000 |
0.000 |
|
(b) Deferred tax liabilities (Net) |
0.000 |
0.000 |
0.000 |
|
(c)
Other long term liabilities |
0.000 |
0.000 |
0.000 |
|
(d)
long-term provisions |
6112.000 |
3534.500 |
3133.300 |
|
Total
Non-current Liabilities (3) |
6112.000 |
3534.500 |
3133.300 |
|
|
|
|
|
|
(4) Current Liabilities |
|
|
|
|
(a)
Short term borrowings |
0.000 |
14969.500 |
0.000 |
|
(b)
Trade payables |
1987.800 |
3244.200 |
2262.400 |
|
(c)
Other current liabilities |
20671.100 |
13096.700 |
12345.700 |
|
(d)
Short-term provisions |
3060.300 |
692.800 |
628.500 |
|
Total
Current Liabilities (4) |
25719.200 |
32003.200 |
15236.600 |
|
|
|
|
|
|
TOTAL |
257020.600 |
326713.600 |
341343.600 |
|
|
|
|
|
|
II.
ASSETS |
|
|
|
|
(1) Non-current assets |
|
|
|
|
(a)
Fixed Assets |
|
|
|
|
(i)
Tangible assets |
17307.600 |
16499.600 |
12279.200 |
|
(ii)
Intangible Assets |
2220.500 |
2684.900 |
905.500 |
|
(iii)
Capital work-in-progress |
118313.600 |
97228.800 |
77188.200 |
|
(iv) Intangible assets under development |
0.000 |
0.000 |
0.000 |
|
(b) Non-current
Investments |
7269.800 |
6954.100 |
5619.300 |
|
(c) Deferred tax assets
(net) |
4533.600 |
2631.700 |
1778.800 |
|
(d) Long-term Loan
and Advances |
924.800 |
862.100 |
843.000 |
|
(e)
Other Non-current assets |
20601.200 |
12206.900 |
21661.800 |
|
Total
Non-Current Assets |
171171.100 |
139068.100 |
120275.800 |
|
|
|
|
|
|
(2) Current assets |
|
|
|
|
(a)
Current investments |
0.000 |
0.000 |
0.000 |
|
(b)
Inventories |
5400.400 |
6220.500 |
6827.300 |
|
(c)
Trade receivables |
10435.200 |
7960.700 |
9478.200 |
|
(d)
Cash and cash equivalents |
52892.800 |
147635.700 |
184431.400 |
|
(e)
Short-term loans and advances |
0.000 |
0.000 |
0.000 |
|
(f)
Other current assets |
17121.100 |
25828.600 |
20330.900 |
|
Total
Current Assets |
85849.500 |
187645.500 |
221067.800 |
|
|
|
|
|
|
TOTAL |
257020.600 |
326713.600 |
341343.600 |
PROFIT
& LOSS ACCOUNT
|
|
PARTICULARS |
31.03.2017 |
31.03.2016 |
31.03.2015 |
|
|
|
SALES |
|
|
|
|
|
|
|
Revenue from Operations |
88296.400 |
64572.700 |
123564.100 |
|
|
|
Other Income |
9088.100 |
18092.500 |
22654.000 |
|
|
|
TOTAL |
97384.500 |
82665.200 |
146218.100 |
|
|
|
|
|
|
|
|
Less |
EXPENSES |
|
|
|
|
|
|
|
Cost of Materials Consumed |
53.700 |
97.300 |
276.700 |
|
|
|
Changes in inventories of finished goods, work-in-progress and Stock-in-Trade |
988.700 |
631.200 |
(169.900) |
|
|
|
Employees benefits expense |
8855.800 |
6461.800 |
7000.900 |
|
|
|
Other expenses |
15219.400 |
12243.200 |
8203.500 |
|
|
|
Excise duty |
15.000 |
14.700 |
0.000 |
|
|
|
Consumption of stores & spares |
2640.800 |
2756.100 |
3201.700 |
|
|
|
Power and electricity |
876.000 |
676.700 |
642.200 |
|
|
|
Repairs & maintenance |
1122.200 |
1192.600 |
1041.400 |
|
|
|
Royalty & other levies |
15247.400 |
8823.100 |
13901.100 |
|
|
|
Selling expenses |
7259.300 |
4171.200 |
11683.000 |
|
|
|
Exceptional items |
0.000 |
1847.800 |
1130.100 |
|
|
|
TOTAL |
52278.300 |
38915.700 |
46910.700 |
|
|
|
|
|
|
|
|
|
PROFIT
BEFORE INTEREST, TAX, DEPRECIATION AND AMORTISATION |
45106.200 |
43749.500 |
99307.400 |
|
|
|
|
|
|
|
|
|
Less |
FINANCIAL
EXPENSES |
207.600 |
655.900 |
0.000 |
|
|
|
|
|
|
|
|
|
|
PROFIT/
(LOSS) BEFORE TAX, DEPRECIATION AND AMORTISATION |
44898.600 |
43093.600 |
99307.400 |
|
|
|
|
|
|
|
|
|
Less/ Add |
DEPRECIATION/
AMORTISATION |
1961.800 |
2166.000 |
1622.300 |
|
|
|
|
|
|
|
|
|
|
PROFIT/ (LOSS)
BEFORE TAX |
42936.800 |
40927.600 |
97685.100 |
|
|
|
|
|
|
|
|
|
Less |
TAX |
17045.400 |
13805.400 |
33466.500 |
|
|
|
|
|
|
|
|
|
|
PROFIT/ (LOSS)
AFTER TAX |
25891.400 |
27122.200 |
64218.600 |
|
|
|
|
|
|
|
|
|
|
IMPORTS |
|
|
|
|
|
|
|
Components & Spare part |
168.200 |
141.300 |
114.000 |
|
|
|
Capital Goods |
1697.700 |
2188.100 |
2152.400 |
|
|
TOTAL IMPORTS |
1865.900 |
2329.400 |
2266.400 |
|
|
|
|
|
|
|
|
|
|
Earnings/ (Loss)
Per Share (INR) |
7.22 |
6.84 |
16.2 |
|
CURRENT MATURITIES OF LONG TERM DEBT DETAILS
|
PARTICULARS |
31.03.2017 |
31.03.2016 |
31.03.2015 |
|
Current Maturities of Long term debt |
NA |
NA |
NA |
|
|
|
|
|
|
Cash generated from operations |
37222.000 |
35633.500 |
70386.200 |
|
|
|
|
|
|
Net Cash Flow from operating activities |
21333.000 |
18617.400 |
40072.200 |
KEY
RATIOS
EFFICIENCY RATIOS
|
PARTICULARS |
31.03.2017 |
31.03.2016 |
31.03.2015 |
|
Average Collection Days (Sundry
Debtors / Income * 365 Days) |
43.14 |
45.00 |
28.00 |
|
|
|
|
|
|
Account Receivables Turnover (Income / Sundry Debtors) |
8.46 |
8.11 |
13.04 |
|
|
|
|
|
|
Average Payment Days (Sundry Creditors / Purchases * 365 Days) |
13511.12 |
12169.92 |
2984.37 |
|
|
|
|
|
|
Inventory Turnover (Operating Income / Inventories) |
8.35 |
7.03 |
14.55 |
|
|
|
|
|
|
Asset Turnover (Operating Income / Net Fixed Assets) |
0.33 |
0.38 |
1.10 |
LEVERAGE RATIOS
|
PARTICULARS |
31.03.2017 |
31.03.2016 |
31.03.2015 |
|
Debt Ratio ((Borrowing
+ Current Liabilities) / Total Assets) |
0.10 |
0.10 |
0.04 |
|
|
|
|
|
|
Debt Equity Ratio (Total Liability / Networth) |
0.00 |
0.05 |
0.00 |
|
|
|
|
|
|
Current Liabilities to Networth (Current Liabilities / Net Worth) |
0.11 |
0.11 |
0.05 |
|
|
|
|
|
|
Fixed Assets to Networth (Net Fixed Assets / Networth) |
0.61 |
0.40 |
0.28 |
|
|
|
|
|
|
Interest Coverage Ratio (PBIT / Financial Charges) |
217.27 |
66.70 |
#DIV/0! |
PROFITABILITY RATIOS
|
PARTICULARS |
|
31.03.2017 |
31.03.2016 |
31.03.2015 |
|
Net Profit Margin ((PAT / Sales) * 100) |
% |
29.32 |
42.00 |
51.97 |
|
|
|
|
|
|
|
Return on Total Assets ((PAT / Total Assets) * 100) |
% |
10.07 |
8.30 |
18.81 |
|
|
|
|
|
|
|
Return on Investment (ROI) ((PAT / Networth) * 100) |
% |
11.50 |
9.31 |
19.88 |
SOLVENCY RATIOS
|
PARTICULARS |
31.03.2017 |
31.03.2016 |
31.03.2015 |
|
Current Ratio (Current
Assets / Current Liabilities) |
3.34 |
5.86 |
14.51 |
|
|
|
|
|
|
Quick Ratio ((Current Assets – Inventories) / Current
Liabilities) |
3.13 |
5.67 |
14.06 |
|
|
|
|
|
|
G-Score Ratio Financial (Networth / Total Assets) |
0.88 |
0.89 |
0.95 |
|
|
|
|
|
|
G-Score Ratio Debt (Debts / Equity Capital) |
0.00 |
3.78 |
0.00 |
|
|
|
|
|
|
G-Score Ratio Liquidity (Total Current Assets / Total Current Liabilities) |
3.34 |
5.86 |
14.51 |
Total
Liability = Short-term Debt + Long-term Debt + Current Maturities of Long-term
debts
STOCK
PRICES
|
Face Value |
INR 1.00/- |
|
|
|
|
Market Value |
INR 120.00/- |
FINANCIAL ANALYSIS
[all figures are
in INR Million]
DEBT EQUITY RATIO
|
Particulars |
31.03.2015 |
31.03.2016 |
31.03.2017 |
|
|
INR
In Million |
INR
In Million |
INR
In Million |
|
Share Capital |
3964.700 |
3964.700 |
3163.900 |
|
Reserves & Surplus |
319009.000 |
287211.200 |
222025.500 |
|
Share Application money
pending allotment |
0.000 |
0.000 |
0.000 |
|
Net
worth |
322973.700 |
291175.900 |
225189.400 |
|
|
|
|
|
|
long-term borrowings |
0.000 |
0.000 |
0.000 |
|
Short term borrowings |
0.000 |
14969.500 |
0.000 |
|
Total
borrowings |
0.000 |
14969.500 |
0.000 |
|
Debt/Equity
ratio |
0.000 |
0.051 |
0.000 |
YEAR-ON-YEAR GROWTH
|
Year
on Year Growth |
31.03.2015 |
31.03.2016 |
31.03.2017 |
|
|
INR
In Million |
INR
In Million |
INR
In Million |
|
Sales |
123564.100 |
64572.700 |
88296.400 |
|
|
|
(47.742) |
36.740 |
NET PROFIT MARGIN
|
Net
Profit Margin |
31.03.2015 |
31.03.2016 |
31.03.2017 |
|
|
INR
In Million |
INR
In Million |
INR
In Million |
|
Sales |
123564.100 |
64572.700 |
88296.400 |
|
Profit/ (Loss) |
64218.600 |
27122.200 |
25891.400 |
|
|
51.97% |
42.00% |
29.32% |
ABRIDGED
BALANCE SHEET [CONSOLIDATED]
|
SOURCES OF FUNDS |
|
31.03.2017 |
31.03.2016 |
|
I.
EQUITY AND LIABILITIES |
|
|
|
|
(1)Shareholders' Funds |
|
|
|
|
(a) Share Capital |
|
3163.900 |
3964.700 |
|
(b) Reserves & Surplus |
|
222658.200 |
287836.200 |
|
(c) Money received against share warrants |
|
0.000 |
0.000 |
|
Non-controlling interest |
|
153.900 |
168.500 |
|
(2) Share
Application money pending allotment |
|
0.000 |
0.000 |
|
Total
Shareholders’ Funds (1) + (2) |
|
225976.000 |
291969.400 |
|
|
|
|
|
|
(3)
Non-Current Liabilities |
|
|
|
|
(a) Long-term borrowings |
|
0.000 |
0.000 |
|
(b) Deferred tax liabilities (Net) |
|
0.000 |
0.000 |
|
(c)
Other long term liabilities |
|
0.000 |
0.000 |
|
(d)
long-term provisions |
|
6113.200 |
3535.100 |
|
Total
Non-current Liabilities (3) |
|
6113.200 |
3535.100 |
|
|
|
|
|
|
(4) Current Liabilities |
|
|
|
|
(a)
Short term borrowings |
|
0.000 |
14969.500 |
|
(b)
Trade payables |
|
1989.000 |
3245.200 |
|
(c)
Other current liabilities |
|
20697.800 |
13144.800 |
|
(d)
Short-term provisions |
|
3060.600 |
693.800 |
|
Total
Current Liabilities (4) |
|
25747.400 |
32053.300 |
|
|
|
|
|
|
TOTAL |
|
257836.600 |
327557.800 |
|
|
|
|
|
|
II.
ASSETS |
|
|
|
|
(1) Non-current assets |
|
|
|
|
(a)
Fixed Assets |
|
|
|
|
(i)
Tangible assets |
|
17333.900 |
16527.700 |
|
(ii)
Intangible Assets |
|
2678.500 |
3118.000 |
|
(iii)
Capital work-in-progress |
|
118554.500 |
97470.800 |
|
(iv) Intangible assets under development |
|
0.000 |
0.000 |
|
(b) Non-current
Investments |
|
6123.000 |
5916.400 |
|
(c) Deferred tax assets
(net) |
|
4533.600 |
2631.800 |
|
(d) Long-term Loan and
Advances |
|
924.800 |
862.500 |
|
(e)
Other Non-current assets |
|
26987.600 |
18730.900 |
|
(f)Goodwill |
|
938.900 |
938.900 |
|
Total
Non-Current Assets |
|
178074.800 |
146197.000 |
|
|
|
|
|
|
(2) Current assets |
|
|
|
|
(a)
Current investments |
|
0.000 |
0.000 |
|
(b)
Inventories |
|
5400.400 |
6220.500 |
|
(c)
Trade receivables |
|
10435.200 |
7960.700 |
|
(d)
Cash and cash equivalents |
|
53205.100 |
148061.400 |
|
(e)
Short-term loans and advances |
|
0.000 |
0.000 |
|
(f)
Other current assets |
|
10721.100 |
19118.200 |
|
Total
Current Assets |
|
79761.800 |
181360.800 |
|
|
|
|
|
|
TOTAL |
|
257836.600 |
327557.800 |
PROFIT
& LOSS ACCOUNT
|
|
PARTICULARS |
|
31.03.2017 |
31.03.2016 |
|
|
|
SALES |
|
|
|
|
|
|
|
Revenue from Operations |
|
88296.400 |
64572.700 |
|
|
|
Other Income |
|
9101.700 |
18106.800 |
|
|
|
TOTAL |
|
97398.100 |
82679.500 |
|
|
|
|
|
|
|
|
Less |
EXPENSES |
|
|
|
|
|
|
|
Cost of Materials Consumed |
|
53.700 |
97.300 |
|
|
|
Changes in inventories of finished goods, work-in-progress and Stock-in-Trade |
|
988.700 |
631.200 |
|
|
|
Employees benefits expense |
|
8887.500 |
6498.100 |
|
|
|
Other expenses |
|
15255.500 |
12286.900 |
|
|
|
Excise duty |
|
15.000 |
14.700 |
|
|
|
Consumption of stores & spares |
|
2640.800 |
2756.100 |
|
|
|
Power and electricity |
|
876.500 |
676.900 |
|
|
|
Repairs & maintenance |
|
1123.700 |
1193.900 |
|
|
|
Royalty & other levies |
|
15247.400 |
8826.800 |
|
|
|
Selling expenses |
|
7259.300 |
4171.200 |
|
|
|
Exceptional items |
|
0.000 |
1847.800 |
|
|
|
TOTAL |
|
52348.100 |
39000.900 |
|
|
|
|
|
|
|
|
|
PROFIT
BEFORE INTEREST, TAX, DEPRECIATION AND AMORTISATION |
|
45050.000 |
43678.600 |
|
|
|
|
|
|
|
|
|
Less |
FINANCIAL
EXPENSES |
|
207.800 |
656.500 |
|
|
|
|
|
|
|
|
|
|
PROFIT/
(LOSS) BEFORE TAX, DEPRECIATION AND AMORTISATION |
|
44842.200 |
43022.100 |
|
|
|
|
|
|
|
|
|
Less/ Add |
DEPRECIATION/
AMORTISATION |
|
1966.500 |
2180.200 |
|
|
|
|
|
|
|
|
|
|
PROFIT/ (LOSS)
BEFORE TAX |
|
42875.700 |
40841.900 |
|
|
|
|
|
|
|
|
|
Less |
TAX |
|
17045.400 |
13805.400 |
|
|
|
|
|
|
|
|
|
|
PROFIT/ (LOSS) FOR
THE YEAR |
|
25830.300 |
27036.500 |
|
|
|
|
|
|
|
|
|
|
Share of non-controlling interest (Loss) |
|
11.500 |
20.200 |
|
|
|
|
|
|
|
|
|
|
Share of Losses of Associates |
|
(403.200) |
(1595.700) |
|
|
|
|
|
|
|
|
|
|
PROFIT AFTER ADJUSTING
MINORITY INTEREST AND SHARE OF LOSS OF ASSOCIATES |
|
25438.600 |
25461.000 |
|
|
|
|
|
|
|
|
|
|
Earnings/ (Loss)
Per Share (INR) |
|
7.10 |
6.42 |
|
LEGAL CASES

LOCAL AGENCY FURTHER INFORMATION
|
Sr. No. |
Check list by
info agents |
Available in
Report (Yes/No) |
|
1 |
Year of establishment |
Yes |
|
2 |
Constitution of the entity -Incorporation
details |
Yes |
|
3 |
Locality of the entity |
Yes |
|
4 |
Premises details |
No |
|
5 |
Buyer visit details |
-- |
|
6 |
Contact numbers |
Yes |
|
7 |
Name of the person contacted |
Yes |
|
8 |
Designation of contact person |
Yes |
|
9 |
Promoter’s background |
Yes |
|
10 |
Date of Birth of Proprietor / Partners /
Directors |
No |
|
11 |
Pan Card No. of Proprietor / Partners |
No |
|
12 |
Voter Id Card No. of Proprietor / Partners |
No |
|
13 |
Type of business |
Yes |
|
14 |
Line of Business |
Yes |
|
15 |
Export/import details (if applicable) |
No |
|
16 |
No. of employees |
Yes |
|
17 |
Details of sister concerns |
Yes |
|
18 |
Major suppliers |
No |
|
19 |
Major customers |
Yes |
|
20 |
Banking Details |
Yes |
|
21 |
Banking facility details |
Yes |
|
22 |
Conduct of the banking account |
-- |
|
23 |
Financials, if provided |
Yes |
|
24 |
Capital in the business |
Yes |
|
25 |
Last accounts filed at ROC, if applicable |
Yes |
|
26 |
Turnover of firm for last three years |
Yes |
|
27 |
Reasons for variation <> 20% |
-- |
|
28 |
Estimation for coming financial year |
No |
|
29 |
Profitability for last three years |
Yes |
|
30 |
Major shareholders, if available |
Yes |
|
31 |
External Agency Rating, if available |
Yes |
|
32 |
Litigations that the firm/promoter
involved in |
Yes |
|
33 |
Market information |
-- |
|
34 |
Payments terms |
Yes |
|
35 |
Negative Reporting by Auditors in the
Annual Report |
No |
MANAGEMENT DISCUSSION
& ANALYSIS
NMDC: AN OVERVIEW
INTRODUCTION
NMDC, incorporated in 1958, is the largest iron ore mining company in India. With iron-ore production of around 34 million tonnes per annum (MTPA) in FY'17, it has a market share of about 25% domestically (excluding captive iron ore production). Average grade of iron ore of NMDC sold in the market is ~64% Fe, which is one of the best globally.
With a Profit (before tax) of INR 42930.000 MILLION in FY'17, it is one of the top profit-making 'Navratna' public sector companies in the country. It has a net worth of INR 225190.000 million (as on 31st March, 2017). It has a strong history of rewarding investors with an average dividend payment of over 800% in the last 5 years.
NMDC continues to pursue policies and programmes to deliver
long term value to all its stakeholders. NMDC has also invested substantially
in the socio-economic development of the local communities, especially near its
mining projects.
OPERATING PROJECTS
NMDC is operating three highly-mechanised iron ore mine complexes. Two complexes are located in Dantewada (Chhattisgarh) namely Bailadila Iron Ore Mine, Kirandul Complex & Bailadiala Iron Ore Mine, Bacheli Complex with yearly production of around 22 MT. One complex in Donimalai Iron Ore Complex, located in Bellary (Karnataka) produces 12 MT per annum
NMDC is also operating a diamond mine namely Diamond Mining Project, Panna (M.P.), which is the only mechanized diamond mine in Asia, with yearly production of around 35,000 carats. NMDC also has a sponge iron unit of 200 TPD, at Paloncha (Telangana).
GLOBAL PRESENCE
Spreading its footprint globally, NMDC has a majority stake of 78.56% in Legacy Iron Ore limited, Australia which has iron ore, gold, base metal interests (19 tenements) in Western Australia.
ICVL, a JV company of SAIL, RINL, NTPC, CIL and NMDC acquired a coking/thermal coal mine in Mozambique. Operations were discontinued due to the depressed coking coal prices from December 2015. In view of upswing in the coking coal prices, ICVL is in the process of restarting operations at the Benga Mine.
NMDC is in the process of setting up of a pilot-scale
processing plant for gold in its mining lease in Tanzania.
GROWTH PLAN
NMDC has made a comprehensive plan to enhance iron ore production capacity to 67 MTPA by FY'22 to meet the growing requirements of iron ore of the Indian Steel sector. The strategy focuses on growth largely through brown field expansion of existing mines and improving evacuation along with it
Development of a green- field mines (Deposit 13) has also been planned through Joint Venture with the Chhattisgarh State Mining development Corporation.
NMDC is in the process of setting up a slurry pipeline in phases for evacuation of iron ore at economical cost to such locations from where the pellets /ore are made available to industry. Efforts to increase evacuation capacity through doubling of Kirandul-Kothavalasa (KK) line is also in full swing.
NMDC is developing iron ore stockyard in Chhattisgarh for uninterrupted supplies to customers
For further expansion in capacity, NMDC is pursuing allocation of new iron ore deposits both through participation in auction and reservation through government dispensation route ( section 17A(2A) of the revised MMDR Act, 2015).
Besides, as a part of its diversification and forward
integration plan, it is setting up a 3.0 MTPA green field Steel Plant at
Nagarnar in Chhattisgarh, which is in advanced stage of construction. It also
has forayed in pellet-making with a 1.2 MTPA pellet plant started trial at
Donimalai. Another 2 MTPA pellet plant is in the process of being set up at
Nagarnar, Chattisgarh.
MARKET ENVIRONMENT:
ECONOMY:
GLOBAL:
Global growth for 2016 is estimated at 3.2 percent, from a level of 3.4 percent in 2015. Going ahead, pick-up in the global growth has been projected to 3.5 percent in 2017 and 3.6 percent in 2018. Economic activity in both advanced economies and emerging & developing economies is forecasted to accelerate in 2017, to 2 percent and 4.6 percent respectively.
INDIA
India has emerged as the world's fastest economy, with policies and reforms by the Government supporting higher growth. Prudent fiscal regime and calibrated monetary policy has reigned in inflation and strengthened macro-economic stability. Lower crude oil prices globally have also helped Indian economy reduce current account deficit and boost the overall economy of the country
India's economy is estimated to grow by 7.1% in FY 2016-17 as per Central Statistics Office (CSO) from 7.9% recorded in the previous financial year. The growth momentum of the Indian economy is expected to rise with measures by the Government in areas such as, taxation (Goods & Service Tax), ease of doing business, Foreign Direct Investment (FDI) reforms, etc. Another major factor helping India's economy is the expected lower global oil prices, which has a significant impact on the country's import bill, improving fiscal condition.
The thrust of Government of India to enhance spending on
infrastructure augurs well for the Steel industry and thereby, the iron ore
sector.
IRON ORE INDUSTRY
OUTLOOK:
GLOBAL:
The steel industry witnessed a major growth cycle in the last
two decades, driven by China's growth. It, in-turn, stimulated a massive
increase in global iron ore production, more than doubling from 950 million
tonnes per annum (Mtpa) in 2000 to over 2200 Mtpa in 2016. These market
fundamentals incentivized new iron ore producers to enter the industry, and
encouraged existing players to expand their operations, to meet this
unprecedented demand. However, the iron ore industry is currently passing
through a phase where supply is exceeding demand globally and this surplus
scenario is likely to continue in the coming years. As a result, the prices of
iron ore have come down in the recent past and are likely to remain subdued in
the near future.
UNAUDITED
FINANCIAL RESULTS FOR THE QUARTER AND NINE MONTHS YEAR ENDED 31.12.2017
(INR IN MILLION)
|
|
Particulars |
Six Months Ended 31.12.2017 |
Six Months Ended 30.09.2017 |
Nine Months Ended 31.12.2017 |
|
|
|
(Unaudited) |
(Unaudited) |
(Unaudited) |
|
|
|
|
|
|
|
1. |
Income from operations |
|
|
|
|
|
Net Sales (Net or Excise Duty) |
24690.300 |
24213.300 |
77319.000 |
|
|
Other operating Income |
1111.400 |
1098.500 |
3495.800 |
|
|
Total Income from operations (Net) |
25801.700 |
25311.800 |
80814.800 |
|
|
|
|
|
|
|
2. |
Expenses |
|
|
|
|
|
Consumption of Raw Material |
24.400 |
41.500 |
65.900 |
|
|
Excise Duty |
0.000 |
0.000 |
0.100 |
|
|
Consumption of stores and spares |
601.500 |
510.400 |
1668.500 |
|
|
Changes in inventories of finished goods, work-in-progress
and Stock-in-Trade |
(280.800) |
1325.400 |
767.000 |
|
|
Employee
benefits expense |
2183.600 |
2123.800 |
6343.300 |
|
|
Royalty and other levies |
5176.200 |
3475.000 |
13578.600 |
|
|
Selling
Exps. including freight |
1080.500 |
1392.500 |
4656.000 |
|
|
Depreciation
and amortisation expense |
771.700 |
619.600 |
1858.200 |
|
|
Finance cost |
111.800 |
101.700 |
295.000 |
|
|
Other
expenditure |
3806.300 |
3314.600 |
11161.800 |
|
|
Total Expenses |
13475.200 |
12904.500 |
40394.400 |
|
|
|
|
|
|
|
7. |
Profit from ordinary activities before exceptional Items and Tax |
12326.500 |
12407.300 |
40420.400 |
|
8. |
Exceptional
Items |
(1449.400) |
0.000 |
(1449.400) |
|
9. |
Profit Before Tax |
13775.900 |
12407.300 |
41869.800 |
|
10. |
Tax
expense |
4909.500 |
3963.300 |
14866.800 |
|
11. |
Net profit from ordinary activities after
tax |
8866.400 |
8444.000 |
27003.000 |
|
|
Loss from discontinued operations |
(1.600) |
(1.600) |
(4.100) |
|
|
Tax Expense of discontinued operations |
(0.500) |
(0.600) |
(1.400) |
|
|
Loss
from discontinued operations [after tax] |
(1.100) |
(1.000) |
(2.700) |
|
|
Profit/ Loss for the year |
8865.300 |
8443.000 |
27000.300 |
|
|
Other
comprehensive income |
(167.700) |
(167.600) |
(503.000) |
|
|
Total comprehensive income |
8697.600 |
8275.400 |
26497.300 |
|
14. |
Paid - up Equity Share Capital |
3163.900 |
3163.900 |
3163.900 |
|
|
Face value of per share (Re) |
1 |
1 |
1 |
|
|
Other equity excluding revaluation reserve |
|
|
|
|
15. |
Earnings Per Share (EPS) |
|
|
|
|
|
Basic and diluted EPS before exceptional
Items for the period (INR) |
2.80 |
2.67 |
8.53 |
SEGMENT WISE REVENUE, RESULTS AND CAPITAL EMPLOYED
|
Particulars |
Six Months Ended 31.12.2017 |
Six Months Ended 30.09.2017 |
Nine Months Ended 31.12.2017 |
|
|
(Unaudited) |
(Unaudited) |
(Unaudited) |
|
|
|
|
|
|
1] Segment Revenue |
|
|
|
|
(Sale/ Income from each segment ) |
|
|
|
|
Iron Ore |
24289.400 |
23952.600 |
76422.800 |
|
Other Minerals and Services |
400.900 |
260.700 |
896.200 |
|
Total |
24690.300 |
24213.300 |
77319.000 |
|
Less: Inter Segment Revenue |
0.000 |
0.000 |
0.000 |
|
Sale/ Income from Operations |
24690.300 |
24213.300 |
77319.000 |
|
|
|
|
|
|
2] Segment Results |
|
|
|
|
(Profit (+)/ Loss (-) before tax and interest
from each segment) |
|
|
|
|
Iron Ore |
13568.800 |
11889.800 |
41109.200 |
|
Other Minerals and Services |
(222.300) |
(348.500) |
(620.900) |
|
Total |
13346.500 |
11541.300 |
40488.300 |
|
Less: Finance Cost |
111.800 |
101.700 |
295.000 |
|
Add: Other Un-Allocable Income net off
Un-Allocable Expenditure |
539.600 |
966.100 |
1672.400 |
|
Profit Before Tax (Including discontinued operations) |
13774.300 |
12405.700 |
41865.700 |
|
|
|
|
|
|
3] Segment Assets |
|
|
|
|
Iron Ore |
57951.900 |
57184.800 |
57951.900 |
|
Other Minerals and Services |
6665.100 |
6783.200 |
6665.100 |
|
Un-allocated
|
209476.200 |
205523.100 |
209476.200 |
|
Total Assets |
274093.200 |
269491.100 |
274093.200 |
|
|
|
|
|
|
4] Segment Liabilities |
|
|
|
|
Iron Ore |
18016.900 |
16876.100 |
18016.900 |
|
Other Minerals and Services |
347.800 |
339.900 |
347.800 |
|
Un-allocated
|
12536.000 |
17758.200 |
12536.000 |
|
Total Liabilities |
30900.700 |
34974.200 |
30900.700 |
|
|
|
|
|
|
5] Capital Employed |
|
|
|
|
(Segment assets-Segment liabilities) |
|
|
|
|
Iron Ore |
39935.000 |
40308.700 |
39935.000 |
|
Other Minerals and Services |
6317.300 |
6443.300 |
6317.300 |
|
Un-allocated
|
196940.200 |
187764.900 |
196940.200 |
|
Total |
243192.500 |
234516.900 |
243192.500 |
Notes:
- The Company opts to publish the financial results on Standalone basis.
- The unaudited financial results of the company for the quarter/nine months ended 31st December 2017 duly reviewed by the Audit Committee have been approved by the Board of Directors at its meeting held on 13th February 2018.
- An amount of INR 453.000 million for the quarter and INR 956.700 million up to the quarter ended December 2017 are included under the head “Other Expenses” towards expenditure on enabling facilities towards doubling of railway line between Kirandul - Jagdalpur and railway line between Jagdalpur – Ambagaon, required for augmentation of evacuation capacity of Bailadila sector and otheINR
- An amount of INR 762.500 million for the quarter and INR 2307.400 million up to the quarter ended December 2017 towards expected credit loss (ECL) are included under the head “Other Expenses”.
- An amount of INR 238.900 million for the quarter and INR 681.700 million up to the quarter ended December 2017 towards mines closure obligation are included under “Other Expenses”.
- Consequent upon the judgement of Hon’ble Supreme Court of India dated 13th October 2017 in TC (Civil) no 43/2016 regarding determination of effective date of liability towards District Mineral Fund (DMF), the company has reversed a net amount of Rs.144.94 million which pertains to the period prior to the effective date (17th Sep 2015) and included in “Exceptional items”.
- The Company has been legally advised that there is no impact of the Hon’ble Supreme Court of India judgement with reference to the writ petition (Civil) no. 114 of 2014 dated 2nd August 2017 on NMDC. However, in case it is found applicable to NMDC at a later date, it may impact the profits of the company.
- The financial results have been reviewed by the Statutory Auditors as required under regulation 33 of Securities and Exchange Board of India (Listing Obligations and Disclosure Requirements) Regulations, 2015.
- Figures for the previous period have been regrouped wherever considered necessary so as to conform to the classification of the current period.
CONTINGENT
LIABILITIES:
|
Particulars |
31.03.2017 (INR
In Million) |
31.03.2016 (INR
In Million) |
|
Claims against the
company not acknowledged as debts consisting of: |
|
|
|
Disputed claims under Property tax, Export tax,
Conservancy Tax, Sales Tax, Service Tax, Income tax etc. |
18772.800 |
21149.400 |
|
Claims by contractors under arbitration |
1733.000 |
-- |
|
On capital account |
-- |
-- |
|
On revenue account |
-- |
1.600 |
|
Other claims on company not acknowledged as debts |
850.800 |
884.400 |
|
Contingent liability on bills discounted/ LCs/BG's |
5887.100 |
3.000 |
The Company has issued letter of comfort in favour of International Coal Venture (P) Limited (ICVL) in furtherance for providing Corporate Guarantee of US$ 30 Mn by them to EXIM Bank on behalf of Minas De Benga Limitada, Mozambique (Borrower), a downstream operating subsidiary of ICVL, New Delhi in respect of short term working capital loan. The said letter of comfort does not in any way constitute the guarantee or security by the Company of the duties of the borrower to meet its obligation under the said facility.
FIXED ASSETS:
- Land
- Buildings
- Plant & Machinery
- Heavy Mobile Equipment
- Furniture & fittings
- Vehicles
- Office Equipment
- Roads, bridges etc.
- Dams, Wells & Pools
- Railway sidings
- Locomotives
- Electrical Installations
- Sanitary & W. S. Installations
CMT REPORT (Corruption, Money Laundering & Terrorism]
The Public Notice information has been collected from various sources
including but not limited to: The Courts, India Prisons Service,
Interpol, etc.
1] INFORMATION ON
DESIGNATED PARTY
No exist designating subject or any of its beneficial owners, controlling
shareholders or senior officers as terrorist or terrorist organization or whom
notice had been received that all financial transactions involving their assets
have been blocked or convicted, found guilty or against whom a judgement or
order had been entered in a proceedings for violating money-laundering,
anti-corruption or bribery or international economic or anti-terrorism sanction
laws or whose assets were seized, blocked, frozen or ordered forfeited for
violation of money laundering or international anti-terrorism laws.
2] Court Declaration :
No records exist to suggest that subject is
or was the subject of any formal or informal allegations, prosecutions or other
official proceeding for making any prohibited payments or other improper payments
to government officials for engaging in prohibited transactions or with
designated parties.
3] Asset Declaration :
No records exist to suggest that the property or assets of the subject
are derived from criminal conduct or a prohibited transaction.
4] Record on Financial
Crime :
Charges or conviction
registered against subject: None
5] Records on Violation of
Anti-Corruption Laws :
Charges or
investigation registered against subject: None
6] Records on Int’l
Anti-Money Laundering Laws/Standards :
Charges or
investigation registered against subject: None
7] Criminal Records
No
available information exist that suggest that subject or any of its principals
have been formally charged or convicted by a competent governmental authority for
any financial crime or under any formal investigation by a competent government
authority for any violation of anti-corruption laws or international anti-money
laundering laws or standard.
8] Affiliation with
Government :
No record
exists to suggest that any director or indirect owners, controlling
shareholders, director, officer or employee of the company is a government
official or a family member or close business associate of a Government
official.
9] Compensation Package :
Our market survey
revealed that the amount of compensation sought by the subject is fair and
reasonable and comparable to compensation paid to others for similar services.
10] Press Report :
No press reports / filings exists on
the subject.
CORPORATE GOVERNANCE
MIRA INFORM as part of its Due Diligence do provide comments on
Corporate Governance to identify management and governance. These factors often
have been predictive and in some cases have created vulnerabilities to credit
deterioration.
Our Governance Assessment focuses principally on the interactions
between a company’s management, its Board of Directors, Shareholders and other
financial stakeholders.
CONTRAVENTION
Subject is not known to have contravened any existing local laws,
regulations or policies that prohibit, restrict or otherwise affect the terms
and conditions that could be included in the agreement with the subject.
FOREIGN EXCHANGE RATES
|
Currency |
Unit
|
INR |
|
US Dollar |
1 |
INR 64.93 |
|
UK Pound |
1 |
INR 91.50 |
|
Euro |
1 |
INR 79.69 |
INFORMATION DETAILS
|
Information
Gathered by : |
SHR |
|
|
|
|
Analysis Done by
: |
PRS |
|
|
|
|
Report Prepared
by : |
RUP |
SCORE FACTORS
|
DEMERIT POINTS |
|
|
|
--BANK CHARGES |
YES/NO |
YES |
|
--LITIGATION |
YES/NO |
YES |
|
--OTHER ADVERSE INFORMATION |
YES/NO |
NO |
|
MERIT POINTS |
|
|
|
--SOLE DISTRIBUTORSHIP |
YES/NO |
NO |
|
--EXPORT ACTIVITIES |
YES/NO |
NO |
|
--AFFILIATION |
YES/NO |
YES |
|
--LISTED |
YES/NO |
YES |
|
--OTHER MERIT FACTORS |
YES/NO |
YES |
RATING EXPLANATIONS
|
Credit Rating |
Explanation |
Rating Comments |
|
A++ |
Minimum Risk |
Business dealings permissible with minimum
risk of default |
|
A+ |
Low Risk |
Business dealings permissible with low
risk of default |
|
A |
Acceptable Risk |
Business dealings permissible with
moderate risk of default |
|
B |
Medium Risk |
Business dealings permissible on a regular
monitoring basis |
|
C |
Medium High Risk |
Business dealings permissible preferably
on secured basis |
|
D |
High Risk |
Business dealing not recommended or on
secured terms only |
|
NB |
New Business |
No recommendation can be done due to
business in infancy stage |
|
NT |
No Trace |
No recommendation can be done as the
business is not traceable |
NB is stated where there is insufficient information to facilitate rating. However, it is not to be considered as unfavourable.
This score serves as a reference to assess
SC’s credit risk and to set the amount of credit to be extended. It is
calculated from a composite of weighted scores obtained from each of the major
sections of this report. The assessed factors are as follows:
·
Financial
condition covering various ratios
·
Company
background and operations size
·
Promoters
/ Management background
·
Payment
record
·
Litigation
against the subject
·
Industry
scenario / competitor analysis
·
Supplier
/ Customer / Banker review (wherever available)
This report is issued at
your request without any risk and responsibility on the part of MIRA INFORM
PRIVATE LIMITED (MIPL) or its officials.