|
|
|


MIRA INFORM REPORT
|
Report No. : |
504215 |
|
Report Date : |
16.04.2018 |
IDENTIFICATION DETAILS
|
Name : |
SUNIL HEALTHCARE LIMITED (w.e.f. 2004) |
|
|
|
|
Formerly Known
As : |
SUNIL SYNCHEM LIMITED |
|
|
|
|
Registered
Office : |
Vijay
Tower, 38E/252-A, Shahpurjat, Panchsheel Commercial Complex, New Delhi –
110 049 |
|
Tel. No.: |
91-11-49435500 |
|
|
|
|
Country : |
India |
|
|
|
|
Financials (as
on) : |
31.03.2017 |
|
|
|
|
Date of
Incorporation : |
05.02.1973 |
|
|
|
|
Com. Reg. No.: |
55-189662 |
|
|
|
|
Capital
Investment / Paid-up Capital : |
INR 102.548 Million |
|
|
|
|
CIN No.: [Company Identification
No.] |
L24302DL1973PLC189662 |
|
|
|
|
IEC No.: [Import-Export Code No.] |
588067407 |
|
|
|
|
TIN No: |
07740051960 |
|
|
|
|
GSTN : [Goods & Service Tax
Registration No.] |
07AACCS9198Q1ZA |
|
|
|
|
TAN No.: [Tax Deduction &
Collection Account No.] |
Not Available |
|
|
|
|
PAN No.: [Permanent Account No.] |
AACCS9198Q |
|
|
|
|
Legal Form : |
A Public Limited Liability Company. The Company’s Shares are Listed on
the Stock Exchanges. |
|
|
|
|
Line of Business
: |
Manufacturing of Hard Gelatin Capsule
Shells and also doing Trading of Food items and Empty Capsule. (Registered Activity) |
|
|
|
|
No. of Employees
: |
167 (Approximately) |
RATING & COMMENTS
(Mira Inform has adopted New Rating mechanism w.e.f. 23rd
January 2017)
|
MIRA’s Rating : |
A |
|
Credit Rating |
Explanation |
Rating Comments |
|
A |
Acceptable Risk |
Business dealings permissible with
moderate risk of default |
|
Maximum Credit Limit : |
USD 1100000 |
|
|
|
|
Status : |
Satisfactory |
|
|
|
|
Payment Behaviour : |
Usually correct |
|
|
|
|
Litigation : |
Clear |
|
|
|
|
Comments : |
Subject is a manufacturer of Empty Gelatin Capsule Shells and
commenced operations in 1973 by the name of Sunil Synchem Limited. The company presently manufactures Empty Hard Core Gelatin Capsules
which is sold across India as well as exported to Africa, Middle East, OECD
and Asian Countries. In 2004, the company was renamed to Sunil Healthcare
Limited. The company is certificated by WHO-GMP and is also accredited with DMF
IV registration by United States Food and Drug Administration (US FDA). It
has satisfactory track record. As per the financial record of 2017, the company has achieved decent
growth in its revenues as compared to previous year along with steady growth
in its operating margins. Rating takes into consideration the satisfactory financial risk
profile marked by healthy net worth base and strong debt protection metrics. Rating continues to derive strength from its long and established
track record of tis business operation and highly experienced management team
in their respective domains. Further, the company is listed on BSE at the price of INR 73.10
against its face value of INR 10. However, rating gets partially offset by working capital intensive
nature of operations, inherent commodity price risk associated with its
trading operations, regulatory policy and competitive pharmaceutical
industry. Payments seems to be usually correct. In view of aforesaid, the company can be considered for business
dealings at usual trade terms and conditions.
|
NOTES:
Any query related to this report can be made
on e-mail: infodept@mirainform.com
while quoting report number, name and date.
ECGC Country Risk Classification List
|
Country Name |
Previous Rating (30.09.2017) |
Current Rating (31.12.2017) |
|
India |
A1 |
A1 |
|
Risk Category |
ECGC
Classification |
|
Insignificant |
A1 |
|
Low Risk |
A2 |
|
Moderately Low Risk |
B1 |
|
Moderate Risk |
B2 |
|
Moderately High Risk |
C1 |
|
High Risk |
C2 |
|
Very High Risk |
D |
EXTERNAL AGENCY RATING
|
Rating Agency Name |
CARE |
|
Rating |
Long Term Rating (BBB) |
|
Rating Explanation |
Moderate degree of safety and moderate credit risk. |
|
Date |
05.10.2017 |
|
Rating Agency Name |
CARE |
|
Rating |
Short Term Rating (A3+) |
|
Rating Explanation |
Moderate degree of safety and higher credit risk. |
|
Date |
05.10.2017 |
RBI DEFAULTERS’ LIST STATUS
Subject’s name is not enlisted as a defaulter
in the publicly available RBI Defaulters’ list.
EPF (Employee Provident Fund) DEFAULTERS’ LIST STATUS
Subject’s name is not enlisted as a defaulter
in the publicly available EPF (Employee Provident Fund) Defaulters’ list as of
31-03-2016.
BIFR (Board for Industrial & Financial Reconstruction) LISTING
STATUS
Subject’s name is not listed as a Sick Unit in
the publicly available BIFR (Board for Industrial & Financial
Reconstruction) list as of 16.04.2018
IBBI (Insolvency and Bankruptcy Board of India) LISTING STATUS
Subject’s name is not listed in the publicly
available IBBI (Insolvency and Bankruptcy Board of India) list as of report
date.
INFORMATION PARTED BY (GENERAL DETAILS)
|
Name : |
Mrs. Anita |
|
Designation : |
Senior Manager |
|
Contact No.: |
91-11-49435500 |
|
Date : |
14.04.2018 |
LOCATIONS
|
Registered Office/ Corporate Office : |
Vijay
Tower, 38E/252-A, Shahpurjat, Opposite Panchsheel Commercial Complex,
New Delhi – 110 049, India |
|
Tel. No.: |
91-11-49435500/ 55/ 66/ 77/ 88/ 99 |
|
Fax No.: |
91-11-43850087 |
|
E-Mail : |
|
|
Website : |
|
|
|
|
|
Factory : |
17/18, Old Industrial Area, Alwar – 301 001, Rajasthan, India |
|
Tel. No.: |
91-144-3014222-23-24 |
|
Fax No.: |
91-144-2373826 |
|
|
|
|
Branch Office : |
Located at: · Kolkata · Ahmedabad · Bangalore · Chennai ·
Secunderabad |
DIRECTORS
As on 31.03.2017
|
Name : |
Mr. Anil Kumar Khaitan |
|
Designation : |
Managing Director |
|
Address : |
Satyaa, 221, Church Road, Vasant Kunj, New Delhi -110070, India |
|
Date of Birth/Age : |
01.01.1956 |
|
Qualification : |
B.Com and MBA from IMI, Geneva |
|
Date of Appointment : |
01.08.2007 |
|
DIN No: |
00759951 |
|
|
|
|
Name : |
Mr. Ramesh Chander Khurana |
|
Designation : |
Director |
|
Address : |
202, Saket Nagar, Indore- 452018 Madhya Pradesh, India |
|
Date of Birth/Age : |
01.10.1952 |
|
Date of Appointment : |
09.02.2013 |
|
DIN No: |
00017354 |
|
|
|
|
Name : |
Mr. Sanjay Kumar Kaushik |
|
Designation : |
Director |
|
Address : |
Kaushik Bhawan, Near Poddar Well Bhargav Chowk, W. No 26, Ratangarh-331022, Rajasthan, India |
|
Date of Birth/Age : |
01.01.1969 |
|
Date of Appointment : |
03.06.2003 |
|
DIN No: |
00329013 |
|
|
|
|
Name : |
Mr. Bharatur Parthasarathy Srinivasan |
|
Designation : |
Director |
|
Address : |
H. No. D-3, College of Pharmacy, Campus Pushpa Vihar, Sector-3, New Delhi- 110017, India |
|
Date of Birth/Age : |
26.08.1948 |
|
Date of Appointment : |
31.01.2009 |
|
DIN No: |
02543837 |
|
|
|
|
Name : |
Mrs. Lata Singh |
|
Designation : |
Director |
|
Address : |
222, Sectors -15A, G.B. Nagar, Noida-201301, Uttar Pradesh, India |
|
Date of Birth/Age : |
05.07.1937 |
|
Qualification : |
PHD from I.I.T., Delhi and B. A. (Hons.), M. A. (Mathematics). |
|
Date of Appointment : |
13.08.2014 |
|
DIN No: |
06947846 |
|
|
|
|
Name : |
Mr. Rakesh Mohan |
|
Designation : |
Director |
|
Address : |
K-6C, SFC Flats, Saket, New Delhi- 110017, India |
|
Date of Birth/Age : |
02.01.1952 |
|
Qualification : |
Electrical Engineering from Ohio State University, MS from USA. B.Sc. Honours (Physics) from Delhi University and M.Sc. |
|
Date of Appointment : |
11.11.2016 |
|
DIN No: |
07352915 |
KEY EXECUTIVES
|
Name : |
Mr. Dharman Gnanasekaran |
|
Designation : |
Chief Executive Office |
|
Address : |
Arunodhayan No. 10, R. V. Nagar, Main Road, Anna Nagar (East), Chennai – 600102, Tamilnadu, India |
|
Date of Appointment : |
06.06.2014 |
|
PAN No.: |
AACPG4388H |
|
|
|
|
Name : |
Mr. Pawan Rathi |
|
Designation : |
Chief Finance Officer |
|
Address : |
H. No. -C-41/2, Street No.7, Brahampuri, Bhajanpura, North East, Delhi-110053, India |
|
Date of Appointment : |
24.05.2014 |
|
PAN No.: |
AGCPR7353R |
|
|
|
|
Name : |
Mr. Santosh Kumar Sharma |
|
Designation : |
Company Secretary |
|
Address : |
Plot No. 51, 2A,Ompee Plaza, Dharam Colony, Palam Vihar Extension, Gurugram-122017, Haryana, India |
|
Date of Appointment : |
12.02.2018 |
|
PAN No.: |
BKRPS3933C |
|
|
|
|
Name : |
Mr. Virendra Garg |
|
Designation : |
AGM Legal cum Company Secretary |
|
|
|
|
Name : |
Mrs. Anita |
|
Designation : |
Senior Manager |
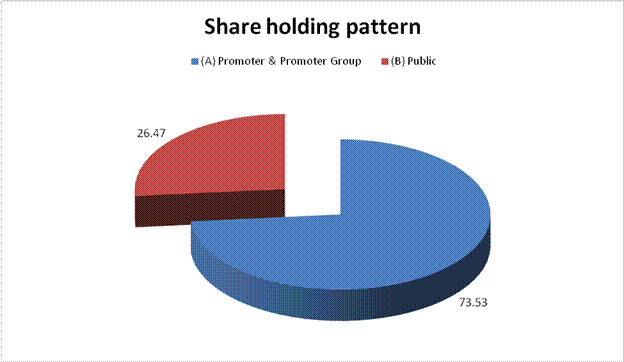
MAJOR SHAREHOLDERS
As on MARCH 2018
|
Category of shareholder |
No. of fully paid up equity shares held |
Shareholding as a % of total no. of shares (calculated as per SCRR,
1957)As a % of (A+B+C2) |
|
|
(A) Promoter & Promoter Group |
7540305 |
73.53 |
|
|
(B) Public |
2714445 |
26.47 |
|
|
Grand Total |
10254750 |
100.00 |
Statement showing
shareholding pattern of the Promoter and Promoter Group
|
Category of
shareholder |
No. of fully paid
up equity shares held |
Shareholding as a %
of total no. of shares (calculated as per SCRR, 1957)As a % of (A+B+C2) |
|
|
A1) Indian |
0.00 |
||
|
Individuals/Hindu undivided
Family |
7540305 |
73.53 |
|
|
Magnum Computers Private
Limited |
1327211 |
12.94 |
|
|
Renu Modi |
270600 |
2.64 |
|
|
Anil Kumar Khaitan |
5942494 |
57.95 |
|
|
Sub Total A1 |
7540305 |
73.53 |
|
|
A2) Foreign |
0.00 |
||
|
A=A1+A2 |
7540305 |
73.53 |
Statement showing
shareholding pattern of the Public shareholder
|
Category & Name
of the Shareholders |
No. of fully paid
up equity shares held |
Shareholding %
calculated as per SCRR, 1957 As a % of (A+B+C2) |
|
|
B1) Institutions |
0 |
0.00 |
|
|
Financial Institutions/ Banks |
10476 |
0.10 |
|
|
Sub Total B1 |
10476 |
0.10 |
|
|
B2) Central Government/ State
Government(s)/ President of India |
0 |
0.00 |
|
|
B3) Non-Institutions |
0 |
0.00 |
|
|
Individual share capital upto
INR 0.200 million |
1318734 |
12.86 |
|
|
Individual share capital in
excess of INR 0.200 million |
413144 |
4.03 |
|
|
Japan Mahesh Vyas |
105000 |
1.02 |
|
|
Kanchan Sunil Singhania |
283822 |
2.77 |
|
|
Any Other (specify) |
972091 |
9.48 |
|
|
Clearing Members |
7338 |
0.07 |
|
|
Bodies Corporate |
842278 |
8.21 |
|
|
Magadh Traders Limited |
158066 |
1.54 |
|
|
Sunloc Foods Private Limited (Formerly
known as SNK Executive Search Private Limited) |
543690 |
5.30 |
|
|
Non-Resident Indian (NRI) |
46806 |
0.46 |
|
|
HUF |
75669 |
0.74 |
|
|
Sub Total B3 |
2703969 |
26.37 |
|
|
B=B1+B2+B3 |
2714445 |
26.47 |
BUSINESS DETAILS
|
Line of Business
: |
Manufacturing of Hard Gelatin Capsule
Shells and also doing Trading of Food items and Empty Capsule. (Registered Activity) |
||||||
|
|
|
||||||
|
Products / Services
: |
|
||||||
|
|
|
||||||
|
Brand Names : |
Not Available |
||||||
|
|
|
||||||
|
Agencies Held : |
Not Available |
||||||
|
|
|
||||||
|
Exports : |
Not Divulged |
||||||
|
|
|
||||||
|
Imports : |
Not Divulged |
||||||
|
|
|
||||||
|
Terms : |
Not Divulged |
PRODUCTION STATUS – (NOT AVAILABLE)
GENERAL INFORMATION
|
Suppliers : |
|
||||||||||||||||||||||||||||||
|
|
|
||||||||||||||||||||||||||||||
|
Customers : |
|
||||||||||||||||||||||||||||||
|
|
|
||||||||||||||||||||||||||||||
|
No. of Employees : |
167 (Approximately) |
||||||||||||||||||||||||||||||
|
|
|
||||||||||||||||||||||||||||||
|
Bankers : |
|
||||||||||||||||||||||||||||||
|
|
|
||||||||||||||||||||||||||||||
|
Facilities : |
NOTE:
|
|
Auditors 1: |
|
|
Name : |
Jitendra K. Agarwal and Associates Chartered Accountants |
|
Address : |
209, Hans Bhawan 1, Bahadur Shah Zafar marg, New Delhi – 110002, india
|
|
Mobile No.: |
91-9015157141/ 9891751595 |
|
E-Mail : |
|
|
|
|
|
Auditors 2: |
|
|
Name : |
Singhi and Company Chartered Accountants |
|
Address : |
402-403, Pragati House, 47-48 Nehru Place, New Delhi – 110019, India |
|
Tel No.: |
91-11-30820179/30820180/41018091 |
|
Email: |
|
|
Website: |
|
|
|
|
|
Memberships : |
Not Available |
|
|
|
|
Collaborators : |
Not Available |
|
|
|
|
Associates/Subsidiaries : |
---- |
CAPITAL STRUCTURE
AS ON: 31.03.2017
Authorised Capital :
|
No. of Shares |
Type |
Value |
Amount |
|
|
|
|
|
|
10800000 |
Equity Shares |
INR 10/- each |
INR 108.000 Million |
|
20000 |
Redeemable Cumulative Preferences Shares |
INR 100/- each |
INR 2.000 Million |
|
|
Total |
|
INR 110.000
Million |
Issued, Subscribed & Paid-up Capital :
|
No. of Shares |
Type |
Value |
Amount |
|
|
|
|
|
|
10254750 |
Equity Shares |
INR 10/- each |
INR 102.548 Million |
|
|
Total |
|
INR 102.548
Million |
a)
Terms
/ rights attached to equity shares
Each holder of equity share is entitled to one vote per share. In the event of liquidation of the Company the holder of equity share will be entitled to receive remaining assets of the Company after preferential distribution. The distribution will be in proportion to the number of equity shares held by the shareholders. There is no restriction on distribution of dividends. However same is subject to the approval of the shareholders in the Annual General Meeting.
b) Shares held by
holding / ultimate holding company and / or their subsidiaries / associates
|
Particulars |
31.03.2017 |
|
|
Number |
INR In Million |
|
|
Equity Shares outstanding at the beginning and end of the year |
10254750 |
INR 102.548 Million |
c) Details of
shareholders holding more than 5% of the shares in the Company
|
Particulars |
31.03.2017 |
|
|
Number |
% of holding |
|
|
Equity shares of INR 10/- each |
|
|
|
Mr. Anil Kumarr Khaitan |
5942494 |
57.95 |
|
M/S Magnum Computer Private Limited |
1327211 |
12.94 |
|
M/S SNK Executive Search Private Limited |
543690 |
5.30 |
FINANCIAL DATA
[all figures are
INR Million]
ABRIDGED
BALANCE SHEET (STANDALONE)
|
SOURCES OF FUNDS |
31.03.2017 |
31.03.2016 |
31.03.2015 |
|
I.
EQUITY
AND LIABILITIES |
|
|
|
|
(1)Shareholders' Funds |
|
|
|
|
(a) Share Capital |
102.548 |
102.548 |
102.548 |
|
(b) Reserves & Surplus |
269.097 |
208.056 |
156.164 |
|
(c) Money
received against share warrants |
0.000 |
0.000 |
0.000 |
|
|
|
|
|
|
(2) Share Application money pending
allotment |
0.000 |
0.000 |
0.000 |
|
Total
Shareholders’ Funds (1) + (2) |
371.645 |
310.604 |
258.712 |
|
|
|
|
|
|
(3)
Non-Current Liabilities |
|
|
|
|
(a) long-term borrowings |
128.203 |
91.616 |
57.030 |
|
(b) Deferred tax liabilities (Net) |
40.549 |
29.755 |
15.233 |
|
(c) Other long term
liabilities |
0.000 |
0.000 |
0.000 |
|
(d) long-term
provisions |
12.948 |
10.529 |
9.416 |
|
Total Non-current
Liabilities (3) |
181.700 |
131.900 |
81.679 |
|
|
|
|
|
|
(4)
Current Liabilities |
|
|
|
|
(a) Short
term borrowings |
275.712 |
249.307 |
170.352 |
|
(b) Trade
payables |
195.940 |
104.036 |
70.426 |
|
(c) Other
current liabilities |
78.772 |
54.917 |
44.091 |
|
(d) Short-term
provisions |
13.583 |
7.092 |
10.122 |
|
Total Current
Liabilities (4) |
564.007 |
415.352 |
294.991 |
|
|
|
|
|
|
TOTAL |
1117.352 |
857.856 |
635.382 |
|
|
|
|
|
|
II.
ASSETS |
|
|
|
|
(1)
Non-current assets |
|
|
|
|
(a) Fixed
Assets |
|
|
|
|
(i)
Tangible assets |
490.281 |
407.722 |
271.356 |
|
(ii)
Intangible Assets |
3.317 |
1.673 |
1.724 |
|
(iii)
Capital work-in-progress |
1.238 |
0.581 |
7.650 |
|
(iv)
Intangible assets under development |
0.000 |
0.000 |
0.000 |
|
(b) Non-current Investments |
0.000 |
0.000 |
0.000 |
|
(c) Deferred tax assets (net) |
0.000 |
0.000 |
0.000 |
|
(d) Long-term Loan and Advances |
7.732 |
6.196 |
21.070 |
|
(e) Other
Non-current assets |
0.000 |
0.000 |
0.000 |
|
Total Non-Current
Assets |
502.568 |
416.172 |
301.800 |
|
|
|
|
|
|
(2)
Current assets |
|
|
|
|
(a)
Current investments |
0.006 |
0.006 |
0.006 |
|
(b)
Inventories |
104.999 |
131.657 |
95.625 |
|
(c) Trade
receivables |
414.497 |
241.394 |
197.803 |
|
(d) Cash
and cash equivalents |
52.071 |
40.973 |
24.835 |
|
(e)
Short-term loans and advances |
22.966 |
15.153 |
9.472 |
|
(f) Other
current assets |
20.245 |
12.501 |
5.841 |
|
Total
Current Assets |
614.784 |
441.684 |
333.582 |
|
|
|
|
|
|
TOTAL |
1117.352 |
857.856 |
635.382 |
PROFIT
& LOSS ACCOUNT (STANDALONE)
|
|
PARTICULARS |
31.03.2017 |
31.03.2016 |
31.03.2015 |
|
|
SALES |
|
|
|
|
|
Income |
1089.462 |
868.853 |
726.361 |
|
|
Other Income |
15.229 |
13.255 |
9.606 |
|
|
TOTAL |
1104.691 |
882.108 |
735.967 |
|
|
|
|
|
|
|
Less |
EXPENSES |
|
|
|
|
|
Cost of Materials
Consumed |
301.506 |
277.642 |
226.458 |
|
|
Purchases of
Stock-in-Trade |
190.446 |
101.643 |
101.055 |
|
|
Changes in inventories of
finished goods, work-in-progress and Stock-in-Trade |
25.217 |
(26.033) |
(8.317) |
|
|
Employees benefits
expense |
109.122 |
94.175 |
86.249 |
|
|
Excity Duty |
68.534 |
52.616 |
|
|
|
Other expenses |
232.780 |
225.435 |
204.398 |
|
|
TOTAL |
927.605 |
725.478 |
609.843 |
|
|
|
|
|
|
|
|
PROFIT/ (LOSS) BEFORE INTEREST, TAX, DEPRECIATION AND
AMORTISATION |
177.086 |
156.630 |
126.124 |
|
|
|
|
|
|
|
Less |
FINANCIAL EXPENSES |
41.695 |
38.130 |
24.562 |
|
|
|
|
|
|
|
|
PROFIT / (LOSS) BEFORE
TAX, DEPRECIATION AND AMORTISATION |
135.391 |
118.500 |
101.562 |
|
|
|
|
|
|
|
Less/ Add |
DEPRECIATION/
AMORTISATION |
43.358 |
38.195 |
40.014 |
|
|
|
|
|
|
|
|
PROFIT/ (LOSS) BEFORE TAX |
92.033 |
80.305 |
61.548 |
|
|
|
|
|
|
|
Less |
TAX |
30.994 |
28.053 |
21.747 |
|
|
|
|
|
|
|
|
PROFIT/ (LOSS) AFTER TAX
|
61.039 |
52.252 |
39.801 |
|
|
|
|
|
|
|
|
EARNINGS IN FOREIGN
CURRENCY |
|
|
|
|
|
F.O.B. Value of Exports |
428.597 |
257.615 |
283.610 |
|
|
TOTAL EARNINGS |
428.597 |
257.615 |
283.610 |
|
|
|
|
|
|
|
|
IMPORTS |
|
|
|
|
|
Raw Materials |
20.088 |
79.199 |
59.615 |
|
|
Stores and Spares |
0.414 |
0.464 |
1.009 |
|
|
Capital Goods |
47.467 |
61.450 |
14.530 |
|
|
Traded Goods |
190.446 |
61.450 |
94.813 |
|
|
TOTAL IMPORTS |
258.415 |
202.563 |
169.967 |
|
|
|
|
|
|
|
|
Earnings / (Loss) Per
Share (INR) |
5.95 |
5.10 |
3.88 |
CURRENT MATURITIES
OF LONG TERM DEBT DETAILS
|
Particulars |
31.03.2017 |
31.03.2016 |
31.03.2015 |
|
Current Maturities of Long term debt |
41.790 |
29.677 |
24.280 |
|
Cash generated from operations |
119.152 |
97.046 |
91.122 |
|
Net cash flows from (used in) operations |
NA |
NA |
NA |
|
Net cash flows from (used in) operating activity |
105.064 |
77.666 |
58.817 |
QUARTERLY
RESULTS
|
Particulars |
30.06.2017 (Unaudited) |
30.09.2017 (Unaudited) |
31.12.2017 (Unaudited) |
|
|
1st Quarter |
2ND
Quarter |
2ND
Quarter |
|
Net Sales |
222.300 |
228.490 |
229.240 |
|
Total Expenditure |
182.690 |
197.020 |
195.550 |
|
PBIDT (Excl OI) |
39.610 |
31.470 |
33.690 |
|
Other Income |
3.110 |
1.920 |
3.700 |
|
Operating Profit |
42.720 |
33.390 |
37.390 |
|
Interest |
12.200 |
10.220 |
12.020 |
|
Exceptional Items |
NA |
NA |
NA |
|
PBDT |
30.520 |
23.170 |
25.3700 |
|
Depreciation |
11.480 |
11.720 |
11.500 |
|
Profit Before Tax |
19.040 |
11.450 |
13.870 |
|
Tax |
6.440 |
3.520 |
7.860 |
|
Provisions and
contingencies |
NA |
NA |
NA |
|
Profit After Tax |
12.600 |
7.930 |
6.010 |
|
Extraordinary Items |
NA |
NA |
NA |
|
Prior Period Expenses |
NA |
NA |
NA |
|
Other Adjustments |
NA |
NA |
NA |
|
Net Profit |
12.600 |
7.930 |
6.010 |
KEY
RATIOS
EFFICIENCY RATIOS
|
PARTICULARS |
31.03.2017 |
31.03.2016 |
31.03.2015 |
|
Average Collection Days (Sundry Debtors / Income * 365 Days) |
138.87 |
101.41 |
99.40 |
|
|
|
|
|
|
Account Receivables Turnover (Income / Sundry Debtors) |
2.63 |
3.60 |
3.67 |
|
|
|
|
|
|
Average Payment Days (Sundry Creditors
/ Purchases * 365 Days) |
145.38 |
100.12 |
78.49 |
|
|
|
|
|
|
Inventory Turnover (Operating Income
/ Inventories) |
1.69 |
1.19 |
1.32 |
|
|
|
|
|
|
Asset Turnover (Operating Income
/ Net Fixed Assets) |
0.36 |
0.38 |
0.45 |
LEVERAGE RATIOS
|
PARTICULARS |
31.03.2017 |
31.03.2016 |
31.03.2015 |
|
Debt Ratio ((Borrowing + Current Liabilities) / Total
Assets) |
0.66 |
0.63 |
0.59 |
|
|
|
|
|
|
Debt Equity Ratio (Total Liability
/ Networth) |
1.20 |
1.19 |
0.97 |
|
|
|
|
|
|
Current Liabilities to Networth (Current
Liabilities / Net Worth) |
1.52 |
1.34 |
1.14 |
|
|
|
|
|
|
Fixed Assets to Networth (Net Fixed Assets
/ Networth) |
1.33 |
1.32 |
1.09 |
|
|
|
|
|
|
Interest Coverage Ratio (PBIT / Financial
Charges) |
4.25 |
4.11 |
5.13 |
PROFITABILITY RATIOS
|
PARTICULARS |
|
31.03.2017 |
31.03.2016 |
31.03.2015 |
|
Net Profit Margin ((PAT / Sales) *
100) |
% |
5.60 |
6.01 |
5.48 |
|
|
|
|
|
|
|
Return on Total Assets ((PAT / Total
Assets) * 100) |
% |
5.46 |
6.09 |
6.26 |
|
|
|
|
|
|
|
Return on Investment (ROI) ((PAT / Networth)
* 100) |
% |
16.42 |
16.82 |
15.38 |
SOLVENCY RATIOS
|
PARTICULARS |
31.03.2017 |
31.03.2016 |
31.03.2015 |
|
Current Ratio (Current Assets / Current Liabilities) |
1.09 |
1.06 |
1.13 |
|
|
|
|
|
|
Quick Ratio ((Current Assets
– Inventories) / Current Liabilities) |
0.90 |
0.75 |
0.81 |
|
|
|
|
|
|
G-Score Ratio Financial (Networth / Total
Assets) |
0.33 |
0.36 |
0.41 |
|
|
|
|
|
|
G-Score Ratio Debt (Debts / Equity
Capital) |
4.35 |
3.61 |
2.45 |
|
|
|
|
|
|
G-Score Ratio Liquidity (Total Current
Assets / Total Current Liabilities) |
1.09 |
1.06 |
1.13 |
Total Liability = Short-term Debt + Long-term
Debt + Current Maturities of Long-term debts
STOCK
PRICES
|
Face Value |
INR 10.00/- |
|
Market Value |
INR 73.10/- |
FINANCIAL ANALYSIS
[all figures are
in INR Million]
DEBT EQUITY RATIO
|
Particular |
31.03.2015 |
31.03.2016 |
31.03.2017 |
|
|
INR
In Million |
INR
In Million |
INR
In Million |
|
Share Capital |
102.548 |
102.548 |
102.548 |
|
Reserves & Surplus |
156.164 |
208.056 |
269.097 |
|
Net
worth |
258.712 |
310.604 |
371.645 |
|
|
|
|
|
|
long-term borrowings |
57.030 |
91.616 |
128.203 |
|
Short term borrowings |
170.352 |
249.307 |
275.712 |
|
Current maturities of
long-term debts |
24.280 |
29.677 |
41.790 |
|
Total
borrowings |
251.662 |
370.600 |
445.705 |
|
Debt/Equity
ratio |
0.973 |
1.193 |
1.199 |

YEAR-ON-YEAR GROWTH
|
Year
on Year Growth |
31.03.2015 |
31.03.2016 |
31.03.2017 |
|
|
INR
In Million |
INR
In Million |
INR
In Million |
|
Sales |
726.361 |
868.853 |
1089.462 |
|
|
|
19.617 |
25.391 |

NET PROFIT MARGIN
|
Net
Profit Margin |
31.03.2015 |
31.03.2016 |
31.03.2017 |
|
|
INR
In Million |
INR
In Million |
INR
In Million |
|
Sales |
726.361 |
868.853 |
1089.462 |
|
Profit |
39.801 |
52.252 |
61.039 |
|
|
5.48% |
6.01% |
5.60% |

ABRIDGED
BALANCE SHEET (CONSOLIDATED)
|
SOURCES OF FUNDS |
|
|
31.03.2017 |
|
I.
EQUITY
AND LIABILITIES |
|
|
|
|
(1)Shareholders' Funds |
|
|
|
|
(a) Share Capital |
|
|
102.548 |
|
(b) Reserves & Surplus |
|
|
263.333 |
|
(c) Money
received against share warrants |
|
|
0.000 |
|
|
|
|
|
|
(2) Share Application money pending
allotment |
|
|
0.000 |
|
Total
Shareholders’ Funds (1) + (2) |
|
|
365.881 |
|
|
|
|
|
|
(3)
Non-Current Liabilities |
|
|
|
|
(a) long-term borrowings |
|
|
128.203 |
|
(b) Deferred tax liabilities (Net) |
|
|
40.549 |
|
(c) Other long term
liabilities |
|
|
0.000 |
|
(d) long-term
provisions |
|
|
12.948 |
|
Total Non-current Liabilities
(3) |
|
|
181.700 |
|
|
|
|
|
|
(4)
Current Liabilities |
|
|
|
|
(a) Short
term borrowings |
|
|
275.712 |
|
(b) Trade
payables |
|
|
196.744 |
|
(c) Other
current liabilities |
|
|
78.772 |
|
(d) Short-term
provisions |
|
|
13.583 |
|
Total Current
Liabilities (4) |
|
|
564.811 |
|
|
|
|
|
|
TOTAL |
|
|
1112.392 |
|
|
|
|
|
|
II.
ASSETS |
|
|
|
|
(1)
Non-current assets |
|
|
|
|
(a) Fixed
Assets |
|
|
|
|
(i)
Tangible assets |
|
|
490.281 |
|
(ii)
Intangible Assets |
|
|
3.317 |
|
(iii)
Capital work-in-progress |
|
|
1.238 |
|
(iv)
Intangible assets under development |
|
|
0.000 |
|
(b) Non-current Investments |
|
|
0.000 |
|
(c) Deferred tax assets (net) |
|
|
0.000 |
|
(d) Long-term Loan and Advances |
|
|
7.749 |
|
(e) Other
Non-current assets |
|
|
0.000 |
|
Total Non-Current
Assets |
|
|
502.585 |
|
|
|
|
|
|
(2)
Current assets |
|
|
|
|
(a)
Current investments |
|
|
0.006 |
|
(b)
Inventories |
|
|
107.400 |
|
(c) Trade
receivables |
|
|
410.046 |
|
(d) Cash
and cash equivalents |
|
|
52.087 |
|
(e)
Short-term loans and advances |
|
|
20.023 |
|
(f) Other
current assets |
|
|
20.245 |
|
Total
Current Assets |
|
|
609.807 |
|
|
|
|
|
|
TOTAL |
|
|
1112.392 |
PROFIT
& LOSS ACCOUNT (CONSOLIDATED)
|
|
PARTICULARS |
|
|
31.03.2017 |
|
|
SALES |
|
|
|
|
|
Income |
|
|
1084.842 |
|
|
Other Income |
|
|
15.228 |
|
|
TOTAL |
|
|
1100.070 |
|
|
|
|
|
|
|
Less |
EXPENSES |
|
|
|
|
|
Cost of Materials Consumed |
|
|
301.507 |
|
|
Purchases of Stock-in-Trade |
|
|
190.446 |
|
|
Changes in inventories of finished goods, work-in-progress
and Stock-in-Trade |
|
|
22.616 |
|
|
Employees benefits expense |
|
|
109.332 |
|
|
Excity Duty |
|
|
68.534 |
|
|
Other expenses |
|
|
236.459 |
|
|
TOTAL |
|
|
928.894 |
|
|
|
|
|
|
|
|
PROFIT/
(LOSS) BEFORE INTEREST, TAX,
DEPRECIATION AND AMORTISATION |
|
|
171.176 |
|
|
|
|
|
|
|
Less |
FINANCIAL
EXPENSES |
|
|
41.694 |
|
|
|
|
|
|
|
|
PROFIT
/ (LOSS) BEFORE TAX, DEPRECIATION AND AMORTISATION |
|
|
129.482 |
|
|
|
|
|
|
|
Less/
Add |
DEPRECIATION/
AMORTISATION |
|
|
43.358 |
|
|
|
|
|
|
|
|
PROFIT/ (LOSS)
BEFORE TAX |
|
|
86.124 |
|
|
|
|
|
|
|
Less |
TAX |
|
|
30.994 |
|
|
|
|
|
|
|
|
PROFIT/ (LOSS)
AFTER TAX |
|
|
55.130 |
|
|
|
|
|
|
|
|
Earnings
/ (Loss) Per Share (INR) |
|
|
5.38 |
LOCAL AGENCY FURTHER INFORMATION
|
Sr. No. |
Check list by info
agents |
Available in
Report (Yes/No) |
|
1 |
Year of establishment |
Yes |
|
2 |
Constitution of the entity -Incorporation
details |
Yes |
|
3 |
Locality of the entity |
Yes |
|
4 |
Premises details |
No |
|
5 |
Buyer visit details |
-- |
|
6 |
Contact numbers |
Yes |
|
7 |
Name of the person contacted |
Yes |
|
8 |
Designation of contact person |
Yes |
|
9 |
Promoter’s background |
Yes |
|
10 |
Date of Birth of Proprietor / Partners /
Directors |
Yes |
|
11 |
Pan Card No. of Proprietor / Partners |
No |
|
12 |
Voter Id Card No. of Proprietor / Partners |
No |
|
13 |
Type of business |
Yes |
|
14 |
Line of Business |
Yes |
|
15 |
Export/import details (if applicable) |
No |
|
16 |
No. of employees |
Yes |
|
17 |
Details of sister concerns |
No |
|
18 |
Major suppliers |
No |
|
19 |
Major customers |
No |
|
20 |
Banking Details |
Yes |
|
21 |
Banking facility details |
Yes |
|
22 |
Conduct of the banking account |
-- |
|
23 |
Financials, if provided |
Yes |
|
24 |
Capital in the business |
Yes |
|
25 |
Last accounts filed at ROC, if applicable |
Yes |
|
26 |
Turnover of firm for last two/ three years |
Yes |
|
27 |
Reasons for variation <> 20% |
-- |
|
28 |
Estimation for coming financial year |
No |
|
29 |
Profitability for last three years |
Yes |
|
30 |
Major shareholders, if available |
Yes |
|
31 |
External Agency Rating, if available |
Yes |
|
32 |
Litigations that the firm/promoter
involved in |
-- |
|
33 |
Market information |
-- |
|
34 |
Payments terms |
No |
|
35 |
Negative Reporting by Auditors in the
Annual Report |
No |
COMPANY OVERVIEW AND
STATE OF COMPANY' SAFFAIRS
The company is 2nd largest producer of Empty Hard Gelatin Capsules (EHGC) in India and Pioneer in Double Lock and Triple Lock Capsules in India. The company also have Global Presence with Subsidiaries in USA and Mexico during the year. The company is WHO-GMP certified Company and has also been recognized as “Star Export House” by GOI. The management is optimistic about the future outlook of the company in short, medium and long-term. The Company deals in Business segment of Manufacturing Hard Gelatin Capsule Shell and the size available is 00, OEL, 0,1,2,3, 4, 5. This segment the company has reached to installed capacity of 11952 million capsules at the existing facility. Their Presence in Over 30 Countries across the Globe. The management of the company Continued focus on achieving cost optimization and yield improvements through Economies of Scale. The company also renewed interest in the business with an aim to become top 3 manufactures of Empty Hard Gelatin Capsules in world.
The Company has forayed into the Food Business. Sunloc food is a division of Sunil Healthcare Limited. Sunloc foods offer a host of product ranging from food products, procurement of raw and processed Edible Nuts e. g, cashew nuts, almonds, pistachios, walnuts etc. They have earned the reputation of providing excellent quality in all their products and high levels of value for money satisfaction and also strong customer's relationship. Sunloc foods is equipped to handle a variety of requirements and delivers straight to customers location anywhere in the world confirming to international quality standards.
FINANCIALS
During the F.Y. 2016-17 (standalone) the performance of Company has improved in all aspect. Revenue from Operation is INR 1089.462 Million in 2016-17 against INR 868.853 Million in the F.Y. 2015-16. Revenue increased by 25.39%, Profit before depreciation and Finance Cost increased by 13.06 %, Profit before Tax increased by 14.60% and Profit after Tax increased by 16.82%. On a consolidated basis, the total revenue from the operation is INR 1100.070 Million, Profit before depreciation and Finance Cost is INR 171.176 Million, Profit before tax is INR 86.124 and Profit after Tax is INR 55.130 Million.
MANAGEMENT
DISCUSSIONS AND ANALYSIS REPORT:
OVERVIEW:
Sunil Healthcare limited, having plant at Alwar; Rajasthan for manufacture of Hard Gelatin Capsule Shells. The company was commenced its manufacturing operation in 1976 with installed capacity of 200 million Hard Gelatin Capsule Shell. With gradual expansion, now the installed capacity is 11952 million capsules p.a.
INDUSTRY OUTLOOK:
The product of the Company Hard Gelatin Capsule Shell is used by Pharmaceutical and Food supplement Companies as a container for administering medicines and food supplements. Therefore, the growth of the industry is dependent on the growth of pharmaceutical and food supplement companies domestically and globally.
"The Indian pharmaceutical industry is a success story providing employment for million and ensuring that essential drugs at affordable prices are available to the vast population of this sub-continent."
EXECUTIVE SUMMARY
Indian pharmaceutical sector accounts for about 2.4 per cent of the global pharmaceutical Industry in value terms and 10 per cent in volume terms. India accounts for 20 per cent of global exports in generics. In FY16, India exported pharmaceutical products worth USD16.89 billion, with the number expected to reach USD40 billion by 2020. The country's pharmaceutical industry is expected to expand at a CAGR of 12.89 per cent over 2015-20 to reach USD55 billion. Indian healthcare sector, one of the fastest growing sectors, is expected to advance at aCAGRof 17 per cent to reach USD250 billion over 2008-20 The generics market stood at USD26.1 billion in 2016 from USD21 billion in 2015. India's generics market has immense potential for growth. Pharmaceutical sector in India attracted 5 per cent of the total FDIs into India from April 2000 to September 16. Cumulative FDI inflows worth USD14.49 billion were made duringApril 2000 to September16.
Source: Indian Brand Equity Foundation ndia Biz, PWC, Department of Industrial Policy and Promotion, Deloitte, PharmaBiz, Frost and Sullivan Report on Indian Pharmaceutical Market, McKinsey,TechSci Research.
INTRODUCTION
The Indian pharmaceuticals market is the third largest in terms of volume and thirteenth largest in terms of value#. Branded generics dominate the pharmaceuticals market, constituting nearly 70 to 80 per cent of the market. India is the largest provider of generic drugs globally with the Indian generics accounting for 20 per cent of global exports in terms of volume. Of late, consolidation has become an important characteristic of the Indian pharmaceutical market as the industry is highly fragmented. India enjoys an important position in the global pharmaceuticals sector. The country also has a large pool of scientists and engineers who have the potential to steer the industry ahead to an even higher level. Presently over 80 per cent of the antiretroviral drugs used globally to combat AIDS (Acquired Immuno Deficiency Syndrome) are supplied by Indian pharmaceutical firms. The UN-backed Medicines Patent Pool has signed six sub-licences with Aurobindo, Cipla, Desano, Emcure, Hetero Labs and Laurus Labs, allowing them to make generic anti-AIDS medicine Tenofovir Alafenamide (TAF) for 112 developing countries.
MARKET SIZE
The Indian pharma industry, which is expected to grow over 15 per cent per annum between 2015 and 2020, will outperform the global pharma industry, which is set to grow at an annual rate of 5 per cent between the same periods. The market is expected to grow to US$ 55 billion by 2020, thereby emerging as the sixth largest pharmaceutical market globally by absolute size*. India has also maintained its lead over China in pharmaceutical exports with a year-on-year growth of 7.55 per cent to US$ 12.54 billion in 2015, according to data from the Ministry of Commerce and Industry. Overall drug approvals given by the US Food and Drug Administration (USFDA) to Indian companies have nearly doubled to 201 in FY 2015-16 from 109 in FY 2014-15 an increase of 84 per cent as per analysis by USFDA. India's biotechnology industry comprising bio-pharmaceuticals, bio-services, bio- agriculture, bio-industry and bioinformatics is expected grow at an average growth rate of around 30 per cent a year and reach US$ 100 billion by 2025. Biopharma, comprising vaccines, therapeutics and diagnostics, is the largest sub-sector contributing nearly 62 per cent of the total revenues at INR 126000.000 million (US$ 1.9 billion).
COMPANY OUTLOOK:
The company is 2nd largest producer of Empty Hard Gelatin Capsules (EHGC) in India and Pioneer in Double Lock and Triple Lock Capsules in India. The company also have Global Presence with Subsidiaries in USA and Mexico during the year. The company is WHO-GMP certified Company and has also been recognized as "Star Export House" by GOI. The management is optimistic about the future outlook of the company in short, medium and long-term. The Company deals in Business segment of Manufacturing Hard Gelatin Capsule Shells and the size available is 00, OEL, 0,1,2,3, 4, 5. This segment the company has reached to installed capacity of 11952 million capsules at the existing facility. Their Presence in Over 30 Countries across the Globe. The management of the company Continued focus on achieving cost optimization and yield improvements through Economies of Scale. The company also renewed interest in the business with an aim to become top 3 manufactures of Empty Hard Gelatin Capsules in world.
The Company has forayed into the Food Business. Sunloc food is a division of Sunil Healthcare Limited. Sunloc foods offer a host of product ranging from food products, procurement of raw and processed Edible Nuts e. g, cashew nuts, almonds, pistachios, walnuts etc. They have earned the reputation of providing excellent quality in all their products and high levels of value for money satisfaction and also strong customer's relationship. Sunloc foods is equipped to handle a variety of requirements and delivers straight to customers location anywhere in the world confirming to international quality standards.
NATURE OF OPERATION:
The company has manufacturing facility at Alwar (Rajasthan) for INR 11952.000 Million (Previous year INR 10930.000 Million) of Hard Gelatin Capsule Shells. Company is also doing Trading of Food items and Empty Capsule.
UNSECURED LOAN
|
PARTICULARS |
31.03.2017 (INR
in Million) |
31.03.2016 (INR
in Million) |
|
Long-term
Borrowings |
|
|
|
Loan from Bodies Corporate |
4.596 |
2.377 |
|
Short-term
borrowings |
|
|
|
Buyer's Credit from a Bank in Foreign Currency |
26.734 |
58.812 |
|
Total |
31.330 |
61.189 |
INDEX
OF CHARGES
|
SNo |
SRN |
Charge Id |
Charge Holder Name |
Date of Creation |
Date of Modification |
Date of Satisfaction |
Amount |
Address |
|
1 |
G68063155 |
100112046 |
State Bank of India |
27/06/2017 |
07/11/2017 |
- |
473600000.0 |
SME Branch,Chandni Chowk,Delhi |
|
2 |
G52943792 |
100113794 |
TATA CAPITAL FINANCIAL SERVICES LIMITED |
08/06/2017 |
30/08/2017 |
- |
82500000.0 |
One Forbes,Dr. V. B. Gandhi Marg, Fort,MumbaiMH400001IN |
|
3 |
G46374583 |
100104872 |
KOTAK MAHINDRA BANK LIMITED |
20/01/2017 |
- |
- |
1400000.0 |
27BKC, C 27, G BlockBandra Kurla Complex, Bandra (E),MumbaiMa400051IN |
|
4 |
G46657862 |
100104927 |
KOTAK MAHINDRA BANK LIMITED |
20/01/2017 |
- |
- |
2100000.0 |
27BKC, C 27, G BlockBandra Kurla Complex, Bandra (E),MumbaiMa400051IN |
|
5 |
G46654687 |
100104936 |
KOTAK MAHINDRA BANK LIMITED |
20/01/2017 |
- |
- |
2227722.0 |
27BKC, C 27, G BlockBandra Kurla Complex, Bandra (E),MumbaiMa400051IN |
|
6 |
G46657425 |
100104948 |
KOTAK MAHINDRA BANK LIMITED |
20/01/2017 |
- |
- |
3341583.0 |
27BKC, C 27, G BlockBandra Kurla Complex, Bandra (E),MumbaiMa400051IN |
|
7 |
G13159272 |
100052285 |
ICICI BANK LIMITED |
08/07/2016 |
- |
- |
15400000.0 |
LANDMARKRACE COURCE CIRCLEALKAPURIBARODAGu390015IN |
|
8 |
G31949589 |
100032940 |
TATA CAPITAL FINANCIAL SERVICES LIMITED |
16/04/2016 |
07/10/2016 |
- |
70600000.0 |
One Forbes,Dr. V. B. Gandhi Marg, FortMumbaiMH400001IN |
|
9 |
G05602768 |
100032632 |
HDFC BANK LIMITED |
12/04/2016 |
- |
- |
2800000.0 |
HDFC BANK HOUSE, SENAPATI BAPAT MARG,LOWER PAREL (WEST)MUMBAIMH400013IN |
|
10 |
G01483585 |
100019634 |
HDFC BANK LIMITED |
15/03/2016 |
- |
- |
560000.0 |
HDFC BANK HOUSE SENAPATI BAPAT MARGLOWER PAREL WMUMBAIMH400013IN |
CONTINGENT
LIABILITIES:
|
PARTICULARS |
31.03.2017 (INR
in Million) |
31.03.2016 (INR
in Million) |
|
Claims against the
company not acknowledged as debt: |
|
|
|
Demand for Octroi under disputes |
0.847 |
0.8747 |
|
Demand for Income Tax "(Paid under Protest INR 0.85 Previous year INR 0.85)" |
0.372 |
0.372 |
|
Customs duty on Raw Materials imported under Advance License, against which export obligation is to be fulfilled. |
10.818 |
50.497 |
|
The Company has procured certain capital goods under EPCG Scheme at concessional rate of duty. As on 31st March, 2017 the Company is contingently liable to pay differential custom duty 47.24 (Previous Year 47.24) on such procurement. In view of past export performance and future projections, the management is hopeful of completing the export obligation within stipulated time, and expect no cash on this account. The Company is hopeful of favourable decisions and expect no outflow of resources, hence no provision is made in the books of Accounts. |
||
UNAUDITED STANDALONE FINANCIAL RESULTS FOR THE QUARTER ENDED AND NINE
MONTHS DECEMBER 31, 2017
[INR
IN MILLION]
|
PARTICULARS |
3 Months |
9 Months |
|
|
|
31.12.2017 |
30.09.2017 |
31.12.2017 |
|
|
[Unaudited] |
[Unaudited] |
[Unaudited] |
|
1. Income from Operations |
|
|
|
|
Net Sales/income from operations |
229.242 |
228.493 |
680.031 |
|
Other Operating Income |
3.703 |
1.919 |
8.734 |
|
Total income from operations (net) |
232.945 |
230.412 |
688.765 |
|
|
|
|
|
|
Expenses |
|
|
|
|
Cost of materials consumed |
71.016 |
72.618 |
215.136 |
|
Purchases of stock-in trade |
30.812 |
42.844 |
73.656 |
|
Changes in inventories of finished goods. work-in-progress
and stock in trade |
(4.182) |
(4.135) |
(7.715) |
|
Employee benefits expense |
30.595 |
29.496 |
88.725 |
|
Depreciation and Amortization Expenses |
11.499 |
11.719 |
34.700 |
|
Other Expenses |
67.316 |
56.199 |
205.464 |
|
Finance Costs |
12.015 |
10.220 |
34.437 |
|
Total expenses |
219.071 |
218.961 |
644.403 |
|
Profit/ (Loss) from ordinary activities before tax |
13.874 |
11.451 |
44.362 |
|
Tax expenses |
7.867 |
3.519 |
17.821 |
|
Net Profit / (Loss) from ordinary activities after tax |
6.007 |
7.932 |
26.541 |
|
Extraordinary item (net of tax expense) |
0.000 |
0.000 |
0.000 |
|
Net Profit / (Loss) for the period |
6.007 |
7.932 |
26.541 |
|
Comprehensive Income |
(0.460) |
(0.459) |
(1.379) |
|
Net Profit/ (Loss) after taxes, minority interest and
share of profit/(loss) of associates |
5.547 |
7.473 |
25.162 |
|
|
|
|
|
|
Paid up equity share capital (Face Value of INR 10/-each) |
102.548 |
102.548 |
102.548 |
|
Reserve excluding Revaluation Reserve as per Balance Sheet
of previous accounting year |
|
|
|
|
Earnings per share (before extraordinary items) of INR
10/- each (not annualized): |
|
|
|
|
(a) Basic |
0.59 |
0.77 |
2.59 |
|
(b) Diluted |
0.59 |
0.77 |
2.59 |
SEGMENT
WISE PERFORMANCE
|
Sr. No. |
Particulars |
3 Months |
3 Months |
9 Months |
|
31.12.2017 |
30.09.2017 |
31.12.2017 |
||
|
[Unaudited] |
[Unaudited] |
[Unaudited] |
||
|
|
|
|
|
|
|
1 |
Segment revenue |
|
|
|
|
|
Empty Hard Gelatin Capsule |
198.353 |
186.115 |
606.764 |
|
|
Marketing of Food Product |
30.889 |
42.378 |
73.267 |
|
|
Total Income from
operation (Net) |
229.242 |
228.493 |
680.031 |
|
|
|
|
|
|
|
2 |
Segment Results |
|
|
|
|
|
Empty Hard Gelatin Capsule |
29.272 |
24.448 |
87.688 |
|
|
Marketing of Food Product |
(1.571) |
(0.506) |
(2.988) |
|
|
Profit/Loss Before finance Cost and Tax |
27.701 |
23.942 |
84.700 |
|
|
Less: Finance Cost |
12.015 |
10.220 |
34.437 |
|
|
Add: Un-allocable Expenses / Income (Net) |
1.812 |
2.271 |
5.901 |
|
|
Profit/Loss Before Tax |
13.874 |
11.451 |
44.362 |
|
|
|
|
|
|
|
3 |
Segment Assets |
|
|
|
|
|
Empty Hard Gelatin Capsule |
1263.561 |
1155.644 |
1263.561 |
|
|
Marketing of Food Product |
69.862 |
97.953 |
69.862 |
|
|
Add: Un-allocable |
53.586 |
45.600 |
53.586 |
|
|
Total |
1387.009 |
1299.197 |
1387.009 |
|
|
|
|
|
|
|
4 |
Segment
Liabilities |
|
|
|
|
|
Empty Hard Gelatin Capsule |
206.614 |
210.628 |
206.614 |
|
|
Marketing of Food Product |
32.135 |
60.771 |
32.135 |
|
|
Add: Un-allocable |
686.705 |
573.011 |
686.705 |
|
|
Total |
925.454 |
844.410 |
925.454 |
Note:
- The Company has adopted Ind AS (Indian Accounting Standards) notified by The Ministry of Corporate Affairs (MCA), w.e.f. 1st April, 2017. Accordingly, the financial results for quarter and nine months ended 31st December, 2017 and 31st December, 2016 are Ind-As compliant. The reconciliation of Profit after Tax as previously reported on account of transition from the previous Indian GAAP to Ind AS for the quarter and nine months ended 31st December, 2017
- In compliance to Ind AS-18 and SEBI (Listing Obligations and Disclosure Requirements) Regulation 2015, the reported revenue for the quarter and nine months ended 31st December, 2016 was inclusive of Excise duty. Goods and Service tax (GST) has been implemented w.e.f. 1st July, 2017 and as per Ind AS-18, the figures of revenue from operations for the quarter and nine months ended 31st December, 2017 is reported net of GST, hence not comparable with corresponding periods.
- The business activity of the Company falls within primary business segment viz ‘Capsules’ and 'Marketing of food products' and disclosured under Ind AS 108 ‘operating segments’.
- The above results were reviewed by the Audit Committee and approved by the Board of Directors in their respective meetings held on February 12, 2018. The Limited Review for the nine months and quarter ended on 31st December, 2017, has been carried out by the Statutory Auditors, as required under Regulation 33 of SEBI (LODR) Regulation, 2015.
FIXED ASSETS
- Land
- Building
- Furniture and Fixture
- Computer
- Plant and Machinery
- Electric Installations
- Improvement on Rented Premises
- Office Equipment
- Tools & Dies
- Vehicle
- Software
CMT REPORT (Corruption, Money Laundering
& Terrorism]
The Public Notice information has been collected from various sources
including but not limited to: The Courts,
1] INFORMATION ON
DESIGNATED PARTY
No exist designating subject or any of its beneficial owners,
controlling shareholders or senior officers as terrorist or terrorist
organization or whom notice had been received that all financial transactions
involving their assets have been blocked or convicted, found guilty or against
whom a judgement or order had been entered in a proceedings for violating
money-laundering, anti-corruption or bribery or international economic or
anti-terrorism sanction laws or whose assets were seized, blocked, frozen or
ordered forfeited for violation of money laundering or international
anti-terrorism laws.
2] Court Declaration :
No records exist to suggest that subject is
or was the subject of any formal or informal allegations, prosecutions or other
official proceeding for making any prohibited payments or other improper
payments to government officials for engaging in prohibited transactions or
with designated parties.
3] Asset Declaration :
No records exist to suggest that the property or assets of the subject
are derived from criminal conduct or a prohibited transaction.
4] Record on Financial
Crime :
Charges or conviction
registered against subject: None
5] Records on Violation of
Anti-Corruption Laws :
Charges or
investigation registered against subject: None
6] Records on Int’l
Anti-Money Laundering Laws/Standards :
Charges or
investigation registered against subject: None
7] Criminal Records
No available
information exist that suggest that subject or any of its principals have been
formally charged or convicted by a competent governmental authority for any
financial crime or under any formal investigation by a competent government
authority for any violation of anti-corruption laws or international anti-money
laundering laws or standard.
8] Affiliation with
Government :
No record
exists to suggest that any director or indirect owners, controlling
shareholders, director, officer or employee of the company is a government
official or a family member or close business associate of a Government
official.
9] Compensation Package :
Our market
survey revealed that the amount of compensation sought by the subject is fair
and reasonable and comparable to compensation paid to others for similar
services.
10] Press Report :
No press reports / filings exists on
the subject.
CORPORATE GOVERNANCE
MIRA INFORM as part of its Due Diligence do provide comments on
Corporate Governance to identify management and governance. These factors often
have been predictive and in some cases have created vulnerabilities to credit
deterioration.
Our Governance Assessment focuses principally on the interactions
between a company’s management, its Board of Directors, Shareholders and other
financial stakeholders.
CONTRAVENTION
Subject is not known to have contravened any existing local laws,
regulations or policies that prohibit, restrict or otherwise affect the terms
and conditions that could be included in the agreement with the subject.
FOREIGN EXCHANGE RATES
|
Currency |
Unit
|
INR |
|
US Dollar |
1 |
INR 65.22 |
|
|
1 |
INR 92.77 |
|
Euro |
1 |
INR 80.34 |
INFORMATION DETAILS
|
Information
Gathered by : |
SHY |
|
|
|
|
Analysis Done by
: |
NSG |
|
|
|
|
Report Prepared
by : |
MTN |
SCORE FACTORS
|
DEMERIT POINTS |
|
|
|
--BANK CHARGES |
YES/NO |
YES |
|
--LITIGATION |
YES/NO |
NO |
|
--OTHER ADVERSE INFORMATION |
YES/NO |
NO |
|
MERIT POINTS |
|
|
|
--SOLE DISTRIBUTORSHIP |
YES/NO |
NO |
|
--EXPORT ACTIVITIES |
YES/NO |
NO |
|
--AFFILIATION |
YES/NO |
NO |
|
--LISTED |
YES/NO |
YES |
|
--OTHER MERIT FACTORS |
YES/NO |
YES |
RATING EXPLANATIONS
|
Credit Rating |
Explanation |
Rating Comments |
|
A++ |
Minimum Risk |
Business dealings permissible with minimum
risk of default |
|
A+ |
Low Risk |
Business dealings permissible with low
risk of default |
|
A |
Acceptable Risk |
Business dealings permissible with
moderate risk of default |
|
B |
Medium Risk |
Business dealings permissible on a regular
monitoring basis |
|
C |
Medium High Risk |
Business dealings permissible preferably
on secured basis |
|
D |
High Risk |
Business dealing not recommended or on
secured terms only |
|
NB |
New Business |
No recommendation can be done due to
business in infancy stage |
|
NT |
No Trace |
No recommendation can be done as the
business is not traceable |
NB is stated where there is insufficient information to facilitate rating. However, it is not to be considered as unfavourable.
This score serves as a reference to assess
SC’s credit risk and to set the amount of credit to be extended. It is
calculated from a composite of weighted scores obtained from each of the major
sections of this report. The assessed factors are as follows:
·
Financial
condition covering various ratios
·
Company
background and operations size
·
Promoters
/ Management background
·
Payment
record
·
Litigation
against the subject
·
Industry
scenario / competitor analysis
·
Supplier
/ Customer / Banker review (wherever available)
This report is issued at
your request without any risk and responsibility on the part of MIRA INFORM
PRIVATE LIMITED (MIPL) or its officials.