|
|
|


MIRA INFORM REPORT
|
Report No. : |
488960 |
|
Report Date : |
01.02.2018 |
IDENTIFICATION DETAILS
|
Name : |
SINTEX INDUSTRIES LIMITED (w.e.f. 27.06.1995) |
|
|
|
|
Formerly Known
As : |
THE BHARAT VIJAY MILLS LIMITED |
|
|
|
|
Registered
Office : |
Kalol (N.G.), District: Gandhinagar – 382721, Gujarat |
|
Tel. No.: |
91-2764-223731 (6 Lines) / 253000 / 253500 |
|
|
|
|
Country : |
India |
|
|
|
|
Financials (as
on) : |
31.03.2017 |
|
|
|
|
Date of
Incorporation : |
01.06.1931 |
|
|
|
|
Com. Reg. No.: |
04-000454 |
|
|
|
|
Capital
Investment / Paid-up Capital : |
INR 544.700 Million |
|
|
|
|
CIN No.: [Company Identification
No.] |
L17110GJ1931PLC000454 |
|
|
|
|
IEC No.: |
0888003447 |
|
|
|
|
CST / TIN No.: |
24060100003 |
|
|
|
|
TAN No.: [Tax Deduction &
Collection Account No.] |
Not Available |
|
|
|
|
PAN No.: [Permanent Account No.] |
AADCS0858E |
|
|
|
|
GSTIN : |
24AADCS0858E2ZK |
|
|
|
|
Legal Form : |
A Public Limited Liability Company. The Company’s Shares are Listed on
the Stock Exchanges. |
|
|
|
|
Line of Business
: |
(Registered Activity) |
|
|
|
|
No. of Employees
: |
5307 (Approximately) |
RATING & COMMENTS
(Mira Inform has adopted New Rating mechanism w.e.f. 23rd
January 2017)
|
MIRA’s Rating : |
A++ |
|
Credit Rating |
Explanation |
Rating Comments |
|
A++ |
Minimum Risk |
Business dealings permissible with minimum
risk of default |
|
Maximum Credit Limit : |
USD 110000000 |
|
|
|
|
Status : |
Excellent |
|
|
|
|
Payment Behaviour : |
Regular |
|
|
|
|
Litigation : |
Exists |
|
|
|
|
Comments : |
Subject was incorporated in the year 1931 and it is a manufacturer of plastic products, cotton yarn, niche structured yarn dyed textiles related products. For the financial year 2017, the company has reported a decline in its revenue as compared to the previous year revenue but has managed to maintain a fair profitability margin of 8.91%. The company possesses strong financial position marked by healthy networth base, satisfactory liquidity position and comfortable debt level. The company has its share price trading at around INR 23.25 on BSE as January 30, 2018 as against the Face Value of INR 1. Business is active. Payments are seems to be regular and as per commitments.
In view of aforesaid, the company can be considered for business dealings at usual trade terms and condition. NOTE: The Company has entered into a Composite Scheme of Arrangement (‘the Scheme’) with Sintex Plastics Technology Limited, Sintex -BAPL Limited, Sintex Infra Projects Limited and their respective shareholders and creditors to transfer the Custom Moulding Undertakings and Prefab Undertakings to Sintex -BAPL Limited and Sintex Infra Projects Limited respectively. The Schme was sanctioned by the Hon’ble NCLT, Bench at Ahemdabad on March 23, 2017 and the Company has received the approval of the Reserve Bank of India (RBI) vide its letter dated May 12, 2017. On giving effect of the Scheme, with effect from the appointed date of the Scheme i.e. April 01, 2016, all the assets and liabilities of Custom Moulding business (including strategic investments in Sintex Holdings B.V., wholly owned subsidiary) and the Prefab business have been transferred and vested to Sintex-BAPL Limited and Sintex Infra Projects Limited respectively. Therefore operations of Custom Moulding business and Prefab business are considered as discontinued operations. |
NOTES :
Any query related to this report can be made
on e-mail : infodept@mirainform.com
while quoting report number, name and date.
ECGC Country Risk Classification List
|
Country Name |
Previous Rating (30.06.2017) |
Current Rating (30.09.2017) |
|
India |
A1 |
A1 |
|
Risk Category |
ECGC
Classification |
|
Insignificant |
A1 |
|
Low Risk |
A2 |
|
Moderately Low Risk |
B1 |
|
Moderate Risk |
B2 |
|
Moderately High Risk |
C1 |
|
High Risk |
C2 |
|
Very High Risk |
D |
EXTERNAL AGENCY RATING
|
Rating Agency Name |
CARE |
|
Rating |
Long Term Loans = A- (issuer Not
Cooperating) |
|
Rating Explanation |
Adequate degree of safety and low credit
risk |
|
Date |
04.01.2018 |
RBI DEFAULTERS’ LIST STATUS
Subject’s name is not enlisted as a defaulter
in the publicly available RBI Defaulters’ list.
EPF (Employee Provident Fund) DEFAULTERS’ LIST STATUS
Subject’s name is not enlisted as a defaulter
in the publicly available EPF (Employee Provident Fund) Defaulters’ list as of
31-03-2016.
BIFR (Board for Industrial & Financial
Reconstruction) LISTING STATUS
Subject’s name is
not listed as a Sick Unit in the publicly available BIFR (Board for Industrial
& Financial Reconstruction) list as of 01.02.2017
IBBI (Insolvency and Bankruptcy Board of India) LISTING STATUS
Subject’s name is not listed in the publicly
available IBBI (Insolvency and Bankruptcy Board of India) list as of report
date.
INFORMATION DENIED BY
MANAGEMENT NON-COOPERATIVE (TEL NO.: 91-2764-22373 / 253000)
LOCATIONS
|
Registered / Corporate Office / Plastic
Division / Head Office : |
Near Seven GarnalaKalol, (N.G.), District: Gandhinagar – 382721, Gujarat, India |
|
Tel. No.: |
91-2764-223731 (6 Lines) / 253000 / 253500 |
|
Fax No.: |
91-2764-220436 / 222868 / 253100 / 253800 / 220385 |
|
E-Mail : |
|
|
Website : |
|
|
Location : |
Owned |
|
Locality : |
Industrial |
|
|
|
|
Branch Office 1 : TEXTILE DIVISION |
No. 18, Ground Floor, The Arcade, World Trade Centre, Mumbai – 400005, Maharashtra, India |
|
Tel. No.: |
91-22-22165617 / 22165618 |
|
Fax No.: |
91-22-22188670 |
|
E-Mail : |
|
|
|
|
|
Branch Office 2 : TEXTILE DIVISION |
A-38, 2nd Floor, Above South City Ford, Mohan
Co-operative Industrial Estate, Mathura Road, New Delhi – 110044, India
|
|
Tel. No.: |
91-11-26991436 |
|
Fax No.: |
91-11-26991433 |
|
E-Mail : |
DIRECTORS
As on 31.03.2017
|
Name : |
Mr. Amit Dineshchandra Patel |
|
Designation : |
Managing Director |
|
Address : |
Vrindavan, Near Manali Apartment, B/H Apang, Manav Mandal Workshop, Dr. V.S. Road, Vastrapur, Ahmedabad - 380015, Gujarat, India |
|
Date of Birth/Age : |
29.01.1966 |
|
Qualification : |
B. Com., MT (USA) |
|
Experience : |
Industrialist with rich business experience in general. |
|
Date of Appointment : |
21.10.1993 |
|
DIN No.: |
00171035 |
|
|
|
|
Name : |
Mr. Rahul Arunprasad Patel |
|
Designation : |
Managing Director |
|
Address : |
112, Sunrise Park, Opposite Drive-In Cinema, Thaltej Road, Ahmedabad - 380054, Gujarat, India |
|
Date of Birth/Age : |
04.10.1959 |
|
Qualification : |
B. Com., MBA (USA) |
|
Experience : |
Industrialist with rich business experience in general. |
|
Date of Appointment : |
21.10.1993 |
|
DIN No.: |
00171198 |
|
|
|
|
Name : |
Mr. Ramniklal Hirachand Ambani |
|
Designation : |
Director |
|
Address : |
'Vimal House', Navrangpura, Ahmedabad - 380014, Gujarat, India |
|
Date of Appointment : |
23.11.1994 |
|
DIN No.: |
00004785 |
|
|
|
|
Name : |
Mr. Dineshchandra Bhikhabhai Patel |
|
Designation : |
Director |
|
Address : |
Vrindavan, B/H Atira, Near Manali Apartment, Dr. V.S. Road, Ahmedabad - 380006, Gujarat, India |
|
Date of Birth/Age : |
04.07.1934 |
|
Qualification : |
B.Sc. |
|
Expertise in specific functional Area : |
Industrialist with rich business experience in general. |
|
Date of Appointment : |
25.08.1972 |
|
DIN No.: |
00171089 |
|
|
|
|
Name : |
Mr. Rajeshbhai Balkrishnabhai Parikh |
|
Designation : |
Director |
|
Address : |
3, Nandanvan Society, Near. Sardar Garden, Taluka-Kalol, Gandhinagar, Kalol - 382721, Gujarat, India |
|
Date of Appointment : |
01.05.2004 |
|
DIN No.: |
00171231 |
|
|
|
|
Name : |
Mr. Arunprasad Purshottamdas Patel |
|
Designation : |
Director |
|
Address : |
Manglam, B/H. Apang Manav Mandal, Near Manali Apartment, Ahmedabad -380015, Gujarat, India |
|
Date of Birth/Age : |
06.04.1935 |
|
Qualification : |
B.Sc. |
|
Expertise in specific functional Area : |
Industrialist with rich business experience in general |
|
Date of Appointment : |
25.08.1972 |
|
DIN No.: |
00830809 |
|
|
|
|
Name : |
Dr. Lavkumar Kantilal Shah |
|
Designation : |
Director |
|
Address : |
C-10, 426 Apartment, Near Nehru Foundation, Bodakdev Circle, Ahmedabad -380054, Gujarat, India |
|
Date of Birth/Age : |
01.04.1957 |
|
Qualification : |
M.Sc., MBA, Ph.D., FTA |
|
Expertise in
specific functional Area : |
Industrialist and adviser with rich business experience in general. |
|
Date of Appointment : |
01.05.2004 |
|
DIN No.: |
01572788 |
|
|
|
|
Name : |
Mr. Narendra Kumar Bansal |
|
Designation : |
Director Appointed in Casual Vacancy |
|
Address : |
House No. D-44, Sector-49, Noida - 201304, Uttar Pradesh, India |
|
Date of Appointment : |
07.05.2013 |
|
DIN No.: |
03086069 |
|
|
|
|
Name : |
Mr. Sunil Kumar Kanojia |
|
Designation : |
Additional Director |
|
Address : |
B-302, Sundarvan Epitome, Satellite, Ahmedabad – 380015, Gujarat, India |
|
Date of Appointment : |
30.10.2017 |
|
DIN No.: |
00490259 |
|
|
|
|
Name : |
Maitri Kirankumar Mehta |
|
Designation : |
Additional Director |
|
Address : |
'Shrijay' Bunglow, Sterling Park, Near Sterling HOS Memnagar, Ahmedabad – 380052, Gujarat, India |
|
Date of Appointment : |
30.10.2017 |
|
DIN No.: |
07549243 |
KEY EXECUTIVES
|
Name : |
Mr. Hitesh Mehta |
|
Designation : |
Company Secretary |
|
Address : |
12-B, Dwarkesh Apartment, Near Laad Society, Opposite Pushpak Bunglow, Bodakdev, Vastrapur, Ahmedabad - 380015, Gujarat, India |
|
Date of Appointment : |
15.10.2013 |
|
PAN No.; |
AFJPM0982M |
|
|
|
|
Name : |
Mr. Prashant Dineshbhai Shah |
|
Designation : |
Chief Financial Officer |
|
Address : |
C - 404, Rosewood Estate, Jodhpur Char Rasta, Satellite, Ahmedabad - 380015, Gujarat, India |
|
Date of Appointment : |
05.08.2014 |
|
PAN No.; |
AFQPS3051L |
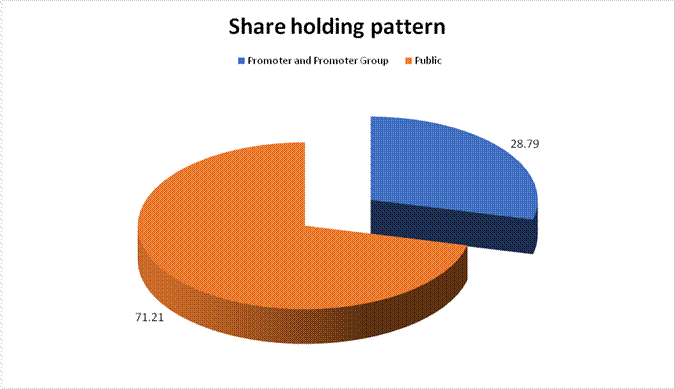
MAJOR SHAREHOLDERS / SHAREHOLDING PATTERN
As on 31.012.2017
|
Category of shareholder |
No. of fully paid up equity shares held |
Shareholding as a % of total no. of
shares |
|
|
Promoter and Promoter Group |
169981127 |
28.79 |
|
|
Public |
420454366 |
71.21 |
|
|
Grand Total |
590435493 |
100.00 |
STATEMENT
SHOWING SHAREHOLDING PATTERN OF THE PROMOTER AND PROMOTER GROUP
|
Category of shareholder |
No. of fully paid up equity shares held |
Shareholding as a % of total no. of
shares |
|
|
A1) Indian |
0.00 |
||
|
Individuals/Hindu undivided Family |
3004149 |
0.52 |
|
|
Pranay Arunprasad Patel |
758830 |
0.13 |
|
|
Rahulbhai Patel |
497090 |
0.09 |
|
|
Amit Patel |
398425 |
0.07 |
|
|
Deval Rahul Patel |
262500 |
0.05 |
|
|
Leena Arunprasad Patel |
177970 |
0.03 |
|
|
Arunprasad Purshottamdas Patel |
327710 |
0.06 |
|
|
Dineshchandra Patel |
290536 |
0.05 |
|
|
Kalavati Patel |
225468 |
0.04 |
|
|
Poonam Pranay Patel |
65620 |
0.01 |
|
|
Any Other (specify) |
166976978 |
28.85 |
|
|
BVM Finance Private Limited |
78103905 |
13.50 |
|
|
Opel Securities Private Limited |
30223452 |
5.22 |
|
|
Kolon Investment Private Limited |
55877110 |
9.66 |
|
|
Star Line Leasing Ltd. |
1713221 |
0.30 |
|
|
Som Shiva (Impex) Limited |
262500 |
0.05 |
|
|
Prominent Plastics Limited |
796790 |
0.14 |
|
|
Sub Total A1 |
169981127 |
29.37 |
|
|
A2) Foreign |
0.00 |
||
|
A=A1+A2 |
169981127 |
29.37 |
STATEMENT
SHOWING SHAREHOLDING PATTERN OF THE PUBLIC SHAREHOLDER
|
Category of shareholder |
No. of fully paid up equity shares held |
Shareholding as a % of total no. of
shares |
|
|
B1) Institutions |
0 |
0.00 |
|
|
Mutual Funds/ |
1692000 |
0.29 |
|
|
Foreign Portfolio Investors |
67105103 |
11.37 |
|
|
East Bridge Capital Master Fund Limited |
15246220 |
2.58 |
|
|
Government Pension Fund Global |
9559698 |
1.62 |
|
|
Vanguard Emerging Markets Stock Index Fund, Aseries Of Vanguard International Equity Inde X Fund |
6043284 |
1.02 |
|
|
Financial Institutions/ Banks |
6798519 |
1.15 |
|
|
Sub Total B1 |
75595622 |
12.80 |
|
|
B2) Central Government/ State Government(s)/ President of India |
0 |
0.00 |
|
|
Central Government/ State Government(s)/ President of India |
536486 |
0.09 |
|
|
Sub Total B2 |
536486 |
0.09 |
|
|
B3) Non-Institutions |
0 |
0.00 |
|
|
Individual share capital upto INR 0.200 Million |
245197541 |
41.53 |
|
|
Individual share capital in excess of INR 0.200 Million |
17047854 |
2.89 |
|
|
Any Other (specify) |
82076863 |
13.90 |
|
|
Trusts |
616973 |
0.10 |
|
|
Foreign Nationals |
1000 |
0.00 |
|
|
HUF |
9578464 |
1.62 |
|
|
NRI – Non- Repat |
2129294 |
0.36 |
|
|
NRI – Repat |
8746573 |
1.48 |
|
|
Foreign Portfolio Investors (Category III) |
100000 |
0.02 |
|
|
Clearing Members |
17598306 |
2.98 |
|
|
Bodies Corporate |
43303873 |
7.33 |
|
|
Associated Person |
2280 |
0.00 |
|
|
FCCB |
0 |
0.00 |
|
|
Directors/Relatives |
100 |
0.00 |
|
|
Sub Total B3 |
344322258 |
58.32 |
|
|
B=B1+B2+B3 |
420454366 |
71.21 |
BUSINESS DETAILS
|
Line of Business : |
(Registered Activity) |
||||
|
|
|
||||
|
Products : |
|
||||
|
|
|
||||
|
Brand Names : |
Not Divulged |
||||
|
|
|
||||
|
Agencies Held : |
Not Divulged |
||||
|
|
|
||||
|
Exports : |
Not Available |
||||
|
|
|
||||
|
Imports : |
Not Available |
||||
|
|
|
||||
|
Terms : |
Not Divulged |
PRODUCTION STATUS NOT AVAILABLE
GENERAL INFORMATION
|
Suppliers : |
|
|||||||||||||||||||||||||||||||||||||||
|
|
|
|||||||||||||||||||||||||||||||||||||||
|
Customers : |
|
|||||||||||||||||||||||||||||||||||||||
|
|
|
|||||||||||||||||||||||||||||||||||||||
|
No. of Employees : |
5307 (Approximately) |
|||||||||||||||||||||||||||||||||||||||
|
|
|
|||||||||||||||||||||||||||||||||||||||
|
Bankers : |
|
|||||||||||||||||||||||||||||||||||||||
|
|
|
|||||||||||||||||||||||||||||||||||||||
|
Facilities : |
NOTE : LONG-TERM
BORROWINGS 2,500 (Previous year 5,000) 9.41% Secured Redeemable Non Convertible debentures of INR 1.000/- each, are redeemable at par on 8th October, 2020. The Debentures are secured by first pari passu charge on fixed assets (excluding spinning unit) of the Company. 1,375 (Previous year 2,750) 10.70% Secured Redeemable Non Convertible debentures of INR 1.000/- each, are redeemable at par in three equal annual installments starting from 30th September, 2019. The Debentures are secured by first pari passu charge on fixed assets (excluding spinning unit) of the Company. 1,125 (Previous year 2,250) 10.70% Secured Redeemable Non Convertible debentures of INR 1.000/- each, are redeemable at par in three annual installments starting from 11th June, 2019. The Debentures are secured by first pari passu charge on fixed assets (excluding spinning unit) of the Company. Nil (Previous year 1,675) 11.5% Secured Redeemable Non Convertible debentures of INR 1.000/- each, are redeemable at par in three annual installments starting from 18th February, 2016. The Debentures are secured by first pari passu charge on all the movable and immovable assets, both present and future excluding assets of spinning unit of the Company. Term Loans from the banks and Financial Institution referred in point no (a),(b) and (f ) of Note (vii) below are secured by first charge on pari passu basis on all the immovable and movable properties of the Company, both present and future excluding properties of spinning unit and on specified current assets and book debts on which prior charge created in favour of the Banks for working capital facilities (refer note 23). Term Loans from the banks and Financial Institution referred in point no (c) and (d) of Note (vii) below from the banks and financial institution are secured by first charge on pari passu basis on entire fixed assets including immovable properties of the spinning unit. Terms of repayments of term loans (including current maturities of long term debt) carrying interest rate range of 2.4% to 11% p.a. are given below:- (a) Loan outstanding of Nil (previous year INR 2600.000 Million) - the overall loan repayment term includes annual installments of INR 162.500 Million each from 31st March, 2013 to 31st March, 2016 and INR 1300.000 Million each on 31st March, 2017 and 31st March, 2018. * (b) Foreign currency loan of B Nil (previous year INR 7960.000 Million) is repayable in three equal annual installment of INR 2653.300 Million at the end of 5th, 6th and 7th year i.e. starting from 14th December, 2017 till 14th December 2019.* (c) Loan outstanding of INR 12200.000 Million (previous year INR 12200.000 Million) - the overall loan repayment term includes 30 quarterly installment of INR 406.700 Million each starting from August, 2017 to November, 2024. (d) Loan outstanding of INR 12843.500 Million (previous year INR 2498.500 Million) - the overall loan repayment term includes 30 quarterly installment of INR 406.700 Million each starting from April, 2018 to September, 2025 and 36 quaterly installment INR 524.000 Million each starting from September, 2019 to June, 2028. (e) Loan outstanding of INR 825.000 Million (previous year Nil) - the loan repayment term includes 32 structured quarterly installment of INR 10.300 Million each starting from December, 2016 to September, 2021 and INR 41.250 Million starting from December, 2021 to September, 2025. (For Security Refer note (i) to (iv) above) (f) The Technology Upgradation Fund Scheme (TUFs) term loans include: (i) Loan outstanding of Nil (previous year INR 21.800 Million) - the overall loan repayment term includes 32 quarterly installment of INR 46.900 Million each starting from 30th June, 2008 till 30th May, 2016. (ii) Loan outstanding of Nil (previous year INR 23.400 Millions) - the overall loan repayment term includes 32 quarterly installment of INR 23.400 Million each starting from 17th October, 2008 to 17th April, 2016. (iii) Loan outstanding of INR 1293.300 Million (previous year INR 1543.300 Millions) – the overall loan repayment term includes 32 quarterly installment of INR 62.500 Million each starting from 1st October, 2014 till 1st July, 2022. (iv) Loan outstanding of INR 946.900 Million (previous year INR 1127.300 Million) – the overall loan repayment term includes 32 quarterly installment of INR 45.100 Million each commencing after 27 months moratorium period i.e. starting from 1st October, 2014 till 1st July, 2022. (v) Loan outstanding of INR 635.600 Million (previous year INR 760.700 Millions) - the overall loan repayment term includes 32 quarterly installment of INR 31.300 Million each commencing from 1st October , 2014 till 1st July, 2022. (viii) Foreign currency loan of Nil (previous year INR 1989.900 Million), carrying interest rate of 6 months LIBOR plus 340 bps pa - the overall loan repayment term includes 8 half yearly installment commencing from 21st November, 2018 till 20th May, 2022. (ix) Foreign currency loan of INR 630.200 Million (previous year Nil) payable in 2 yearly equal installment commencing from 5th April, 2021. SHORT-TERM BORROWINGS Loans from the banks are secured by first charge on the stocks and book debts of the Company, both present and future. |
|
Auditors : |
|
|
Name : |
Shah and Shah Associates Chartered Accountants |
|
Address : |
C.G. Road, Navranpura, Ahmedabad - 380009, Gujarat, India |
|
Tel No.: |
91-79-26465433 |
|
Fax No.: |
91-79-26406983 |
|
E-Mail: |
|
|
|
|
|
Memberships : |
Not Available |
|
|
|
|
Collaborators : |
Not Available |
|
|
|
|
Associate : |
Zillion Infra Projects Private Limited (till March 31, 2016) |
|
|
|
|
Subsidiaries : |
|
|
|
|
|
Enterprises over which Key Managerial Personnel are able to exercise
significant influence/control : |
|
CAPITAL STRUCTURE
After 26.09.2016
Authorised Capital : INR 650.000 Million
Issued Capital : INR 590.436 Million
As on 31.03.2017
Authorised Capital :
|
No. of Shares |
Type |
Value |
Amount |
|
|
|
|
|
|
650000000 |
Equity Shares |
INR 1/- each |
INR 650.000 Million |
|
|
|
|
|
Issued Capital :
|
No. of Shares |
Type |
Value |
Amount |
|
|
|
|
|
|
544727754 |
Equity Shares |
INR 1/- each |
INR 544.700
Million |
|
|
|
|
|
Subscribed & Paid-up Capital :
|
No. of Shares |
Type |
Value |
Amount |
|
|
|
|
|
|
544695954 |
Equity Shares |
INR 1/- each |
INR 544.696
Million |
|
|
|
|
|
(i) Reconciliation
of the number of shares and amount outstanding at the beginning and at the end
of the reporting period:
|
Particulars |
Opening
Balance |
Conversion of FCCB into equity shares during the year |
Rights issue during the year |
Conversion of share warrants into equity shares during the year |
Closing Balance |
|
Equity Shares |
|
|
|
|
|
|
Year ended 31st
March 2017 |
|
|
|
|
|
|
- Number of shares |
446550721 |
21223333 |
76921900 |
- |
544695954 |
|
- Amount in Million |
446.600 |
21.200 |
76.900 |
- |
544.700 |
(ii) Terms/ Rights
attached to equity shares
The Company has only one class of equity shares having a par value of B1/- per share. Each holder of equity share is entitled to one vote per share.
The Company declares and pays dividend in Indian rupees. The dividend proposed by the Board of Directors is subject to approval of shareholders in the ensuing AGM.
(iii) As at March 31
2017: 59278978 shares (as at March 31 2016: NIL shares; as at March 31 2015:
22112527 shares) were reserved for issuance as follows:
(a) NIL shares (as at March 31 2016: NIL shares; as at March 31 2015: 1923000 shares) of B1 each towards outstanding employee stock options granted / available for grant.
(b) 59278978 shares (as at March 31 2016: NIL shares; as at March 31 2015: 20189527 shares) of B1 each towards Foreign Currency Convertible Bonds (FCCB)
iv) Equity
shareholder holding more than 5% of equity shares along with the number of
equity shares held is as given below:
|
Class of shares
/ Name of shareholder |
As at March 31, 2017 |
|
|
No. of Shares held |
% holding in that class of shares |
|
|
Equity shares |
|
|
|
BVM Finance Private Limited |
78103905 |
14.34% |
|
Kolon Investment Private Limited |
55877110 |
10.26% |
|
Opel Securities Private Limited |
30223452 |
5.55% |
FINANCIAL DATA
[all figures are
in INR Million]
ABRIDGED
BALANCE SHEET
|
SOURCES OF FUNDS |
31.03.2017 |
31.03.2016 |
31.03.2015 |
|
|
|
|
|
|
I.
EQUITY AND LIABILITIES |
|
|
|
|
(1)Shareholders' Funds |
|
|
|
|
(a) Share Capital |
544.700 |
446.600 |
424.400 |
|
(b) Reserves &
Surplus |
38519.800 |
48796.800 |
41908.100 |
|
(c) Money received
against share warrants |
0.000 |
0.000 |
0.000 |
|
|
|
|
|
|
(2) Share Application
money pending allotment |
0.000 |
0.000 |
0.000 |
|
Total Shareholders’ Funds
(1) + (2) |
39064.500 |
49243.400 |
42332.500 |
|
|
|
|
|
|
(3) Non-Current
Liabilities |
|
|
|
|
(a) long-term borrowings |
36376.400 |
38766.500 |
26834.100 |
|
(b) Deferred tax
liabilities (Net) |
855.100 |
2056.200 |
4473.400 |
|
(c) Other long term
liabilities |
0.000 |
0.000 |
0.000 |
|
(d) long-term provisions |
131.800 |
201.600 |
164.900 |
|
Total Non-current Liabilities
(3) |
37363.300 |
41024.300 |
31472.400 |
|
|
|
|
|
|
(4) Current Liabilities |
|
|
|
|
(a) Short term borrowings |
3181.700 |
6513.100 |
7310.600 |
|
(b) Trade payables |
1984.000 |
2949.200 |
3771.500 |
|
(c) Other current liabilities |
2756.400 |
6711.400 |
6789.400 |
|
(d) Short-term provisions |
32.600 |
38.100 |
418.500 |
|
Total Current Liabilities
(4) |
7954.700 |
16211.800 |
18290.000 |
|
|
|
|
|
|
TOTAL |
84382.500 |
106479.500 |
92094.900 |
|
|
|
|
|
|
II.
ASSETS |
|
|
|
|
(1) Non-current assets |
|
|
|
|
(a) Fixed Assets |
|
|
|
|
(i) Tangible assets |
37610.900 |
63958.600 |
40529.200 |
|
(ii) Intangible Assets |
0.000 |
0.000 |
18.400 |
|
(iii) Capital
work-in-progress |
24932.300 |
1720.500 |
2041.900 |
|
(iv) Intangible assets
under development |
0.000 |
0.000 |
0.000 |
|
(b) Non-current
Investments |
161.900 |
3398.900 |
10117.700 |
|
(c) Deferred tax assets
(net) |
0.000 |
0.000 |
17254.400 |
|
(d) Long-term Loan and Advances |
54.700 |
1208.900 |
0.000 |
|
(e) Other Non-current
assets |
2288.400 |
8770.100 |
442.600 |
|
Total Non-Current Assets |
65048.200 |
79057.000 |
70404.200 |
|
|
|
|
|
|
(2) Current assets |
|
|
|
|
(a) Current investments |
184.300 |
175.100 |
118.300 |
|
(b) Inventories |
2050.600 |
1810.400 |
1625.200 |
|
(c) Trade receivables |
4780.900 |
15405.400 |
14466.300 |
|
(d) Cash and cash
equivalents |
7041.100 |
5204.900 |
3365.100 |
|
(e) Short-term loans and
advances |
4278.300 |
1070.100 |
1004.600 |
|
(f) Other current assets |
999.100 |
3756.600 |
1111.200 |
|
Total Current Assets |
19334.300 |
27422.500 |
21690.700 |
|
|
|
|
|
|
TOTAL |
84382.500 |
106479.500 |
92094.900 |
PROFIT
& LOSS ACCOUNT
|
|
PARTICULARS |
31.03.2017 |
31.03.2016 |
31.03.2015 |
|
|
SALES |
|
|
|
|
|
Income |
14304.500 |
9149.600 |
40060.600 |
|
|
Other Income |
837.100 |
759.400 |
1121.800 |
|
|
TOTAL |
15141.600 |
9909.000 |
41182.400 |
|
|
|
|
|
|
|
Less |
EXPENSES |
|
|
|
|
|
Cost of Materials
Consumed |
9163.500 |
5301.700 |
26188.400 |
|
|
Purchases of
Stock-in-Trade |
0.000 |
276.000 |
0.000 |
|
|
Changes in inventories of
finished goods, work-in-progress and Stock-in-Trade |
(251.100) |
8.000 |
36.400 |
|
|
Employees benefits
expense |
959.200 |
609.100 |
1276.800 |
|
|
Other expenses |
1738.300 |
895.600 |
3561.700 |
|
|
Exceptional
Items |
0.000 |
0.000 |
217.900 |
|
|
TOTAL |
11609.900 |
7090.400 |
31281.200 |
|
|
|
|
|
|
|
|
PROFIT/ (LOSS) BEFORE INTEREST, TAX, DEPRECIATION AND
AMORTISATION |
3531.700 |
2818.600 |
9901.200 |
|
|
|
|
|
|
|
Less |
FINANCIAL EXPENSES |
897.500 |
678.600 |
2285.300 |
|
|
|
|
|
|
|
|
PROFIT / (LOSS) BEFORE
TAX, DEPRECIATION AND AMORTISATION |
2634.200 |
2140.000 |
7615.900 |
|
|
|
|
|
|
|
Less/ Add |
DEPRECIATION/
AMORTISATION |
1322.200 |
725.300 |
1448.400 |
|
|
|
|
|
|
|
|
PROFIT/ (LOSS) BEFORE TAX |
1312.000 |
1414.700 |
6167.500 |
|
|
|
|
|
|
|
Less |
TAX |
37.200 |
311.500 |
1592.300 |
|
|
|
|
|
|
|
|
PROFIT/ (LOSS) AFTER TAX
|
1274.800 |
1103.200 |
4575.200 |
|
|
|
|
|
|
|
|
EARNINGS IN FOREIGN
CURRENCY |
|
|
|
|
|
F.O.B. Value of Exports |
NA |
632.400 |
331.500 |
|
|
TOTAL EARNINGS |
NA |
632.400 |
331.500 |
|
|
|
|
|
|
|
|
IMPORTS |
|
|
|
|
|
Raw Materials |
NA |
2480.200 |
3100.600 |
|
|
Components and Stores
parts |
NA |
265.500 |
158.400 |
|
|
Capital Goods |
NA |
22.400 |
25.800 |
|
|
TOTAL IMPORTS |
NA |
2768.100 |
3284.800 |
|
|
|
|
|
|
|
|
Earnings / (Loss) Per
Share (INR) |
2.62 |
12.45 |
12.48 |
CURRENT MATURITIES OF LONG TERM DEBT DETAILS
|
Particulars |
31.03.2017 |
31.03.2016 |
31.03.2015 |
|
Current Maturities of Long term debt |
1796.000 |
3539.000 |
5324.100 |
|
Cash generated from operations |
6520.600 |
10881.100 |
11458.300 |
|
Net cash flow from operating activity |
5628.100 |
8874.400 |
10095.300 |
QUARTERLY RESULTS
|
Particulars |
30.06.2017 |
30.09.2017 |
|
Audited / Unaudited |
Unaudited |
Unaudited |
|
|
1st Quarter |
2nd Quarter |
|
Net Sales |
4491.600 |
4606.600 |
|
Total Expenditure |
3757.200 |
3923.600 |
|
PBIDT (Excl OI) |
734.400 |
683.000 |
|
Other Income |
261.900 |
233.200 |
|
Operating Profit |
996.300 |
916.200 |
|
Interest |
258.600 |
225.800 |
|
Exceptional Items |
NA |
NA |
|
PBDT |
737.700 |
690.400 |
|
Depreciation |
339.200 |
343.100 |
|
Profit Before Tax |
389.500 |
347.300 |
|
Tax |
117.100 |
36.900 |
|
Provisions and contingencies |
NA |
NA |
|
Profit After Tax |
281.400 |
310.400 |
|
Extraordinary Items |
NA |
NA |
|
Prior Period Expenses |
NA |
NA |
|
Other Adjustments |
NA |
NA |
|
Net Profit |
281.400 |
310.400 |
KEY
RATIOS
EFFICIENCY RATIOS
|
PARTICULARS |
31.03.2017 |
31.03.2016 |
31.03.2015 |
|
Average Collection Days (Sundry Debtors / Income * 365 Days) |
121.99 |
614.56 |
131.81 |
|
|
|
|
|
|
Account Receivables Turnover (Income / Sundry
Debtors) |
2.99 |
0.59 |
2.77 |
|
|
|
|
|
|
Average Payment Days (Sundry Creditors
/ Purchases * 365 Days) |
79.03 |
192.99 |
52.57 |
|
|
|
|
|
|
Inventory Turnover (Operating Income
/ Inventories) |
1.72 |
1.56 |
6.09 |
|
|
|
|
|
|
Asset Turnover (Operating Income
/ Net Fixed Assets) |
0.06 |
0.04 |
0.23 |
LEVERAGE RATIOS
|
PARTICULARS |
31.03.2017 |
31.03.2016 |
31.03.2015 |
|
Debt Ratio ((Borrowing + Current Liabilities) / Total
Assets) |
0.55 |
0.55 |
0.55 |
|
|
|
|
|
|
Debt Equity Ratio (Total Liability
/ Networth) |
1.06 |
0.99 |
0.93 |
|
|
|
|
|
|
Current Liabilities to Networth (Current
Liabilities / Net Worth) |
0.20 |
0.33 |
0.43 |
|
|
|
|
|
|
Fixed Assets to Networth (Net Fixed Assets
/ Networth) |
1.60 |
1.33 |
1.01 |
|
|
|
|
|
|
Interest Coverage Ratio (PBIT / Financial
Charges) |
3.94 |
4.15 |
4.33 |
PROFITABILITY RATIOS
|
PARTICULARS |
|
31.03.2017 |
31.03.2016 |
31.03.2015 |
|
((PAT / Sales) * 100) |
% |
8.91 |
12.06 |
11.42 |
|
|
|
|
|
|
|
Return on Total Assets ((PAT / Total
Assets) * 100) |
% |
1.51 |
1.04 |
4.97 |
|
|
|
|
|
|
|
Return on Investment (ROI) ((PAT / Networth)
* 100) |
% |
3.26 |
2.24 |
10.81 |
SOLVENCY RATIOS
|
PARTICULARS |
31.03.2017 |
31.03.2016 |
31.03.2015 |
|
Current Ratio (Current Assets / Current Liabilities) |
2.43 |
1.69 |
1.19 |
|
|
|
|
|
|
Quick Ratio ((Current Assets
– Inventories) / Current Liabilities) |
2.17 |
1.58 |
1.10 |
|
|
|
|
|
|
G-Score Ratio Financial (Networth / Total
Assets) |
0.46 |
0.46 |
0.46 |
|
|
|
|
|
|
G-Score Ratio Debt (Debts / Equity
Capital) |
75.92 |
109.31 |
93.00 |
|
|
|
|
|
|
G-Score Ratio Liquidity (Total Current
Assets / Total Current Liabilities) |
2.43 |
1.69 |
1.19 |
Total Liability = Short-term Debt + Long-term
Debt + Current Maturities of Long-term debts
STOCK
PRICES
|
Face Value |
INR 1.00/- each |
|
Market Value |
INR 23.25/- each |
FINANCIAL ANALYSIS
[all figures are
INR Million]
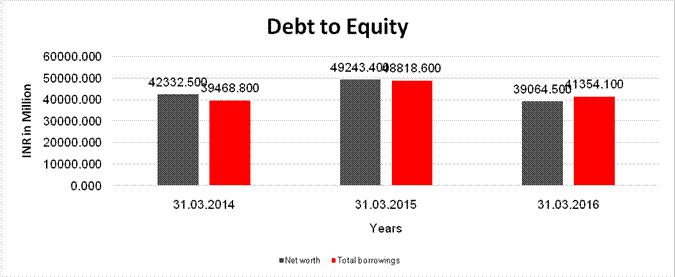
DEBT EQUITY RATIO
|
Particular |
31.03.2015 |
31.03.2016 |
31.03.2017 |
|
|
INR
In Million |
INR
In Million |
INR In
Million |
|
Share Capital |
424.400 |
446.600 |
544.700 |
|
Reserves & Surplus |
41908.100 |
48796.800 |
38519.800 |
|
Net
worth |
42332.500 |
49243.400 |
39064.500 |
|
|
|
|
|
|
Long Term borrowings |
26834.100 |
38766.500 |
36376.400 |
|
Short Term borrowings |
7310.600 |
6513.100 |
3181.700 |
|
Current Maturities of Long term debt |
5324.100 |
3539.000 |
1796.000 |
|
Total
borrowings |
39468.800 |
48818.600 |
41354.100 |
|
Debt/Equity
ratio |
0.932 |
0.991 |
1.059 |
YEAR-ON-YEAR GROWTH
|
Year
on Year Growth |
31.03.2015 |
31.03.2016 |
31.03.2017 |
|
|
INR
In Million |
INR
In Million |
INR
In Million |
|
Sales
|
40060.600 |
9149.600 |
14304.500 |
|
|
|
(77.161) |
56.340 |
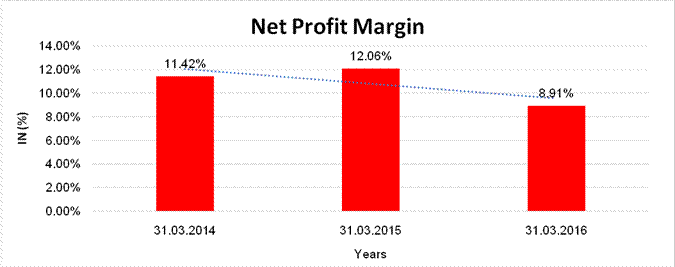
NET PROFIT MARGIN
|
Net
Profit Margin |
31.03.2015 |
31.03.2016 |
31.03.2017 |
|
|
INR
In Million |
INR
In Million |
INR
In Million |
|
Sales
|
40060.600 |
9149.600 |
14304.500 |
|
Profit |
4575.200 |
1103.200 |
1274.800 |
|
|
11.42% |
12.06% |
8.91% |
ABRIDGED
BALANCE SHEET (CONSOLIDATED)
|
SOURCES OF FUNDS |
|
31.03.2017 |
31.03.2016 |
|
|
|
|
|
|
I.
EQUITY AND LIABILITIES |
|
|
|
|
(1)Shareholders' Funds |
|
|
|
|
(a) Share Capital |
|
544.700 |
446.600 |
|
(b) Reserves &
Surplus |
|
38583.900 |
55083.100 |
|
(c) Money received
against share warrants |
|
0.000 |
0.000 |
|
|
|
|
|
|
(2) Share Application money
pending allotment |
|
0.000 |
0.000 |
|
(3) Non controlling
Interest |
|
0.000 |
20.700 |
|
Total Shareholders’ Funds
(1) + (2) |
|
39128.600 |
55550.400 |
|
|
|
|
|
|
(3) Non-Current
Liabilities |
|
|
|
|
(a) long-term borrowings |
|
36376.400 |
51413.600 |
|
(b) Deferred tax
liabilities (Net) |
|
855.100 |
2255.200 |
|
(c) Other long term
liabilities |
|
0.000 |
393.000 |
|
(d) long-term provisions |
|
131.800 |
224.600 |
|
Total Non-current
Liabilities (3) |
|
37363.300 |
54286.400 |
|
|
|
|
|
|
(4) Current Liabilities |
|
|
|
|
(a) Short term borrowings |
|
3880.800 |
6888.800 |
|
(b) Trade payables |
|
2953.600 |
7832.400 |
|
(c) Other current
liabilities |
|
2806.100 |
10003.900 |
|
(d) Short-term provisions |
|
57.400 |
1054.600 |
|
Total Current Liabilities
(4) |
|
9697.900 |
25779.700 |
|
|
|
|
|
|
TOTAL |
|
86189.800 |
135616.500 |
|
|
|
|
|
|
II.
ASSETS |
|
|
|
|
(1) Non-current assets |
|
|
|
|
(a) Fixed Assets |
|
|
|
|
(i) Tangible assets |
|
37610.900 |
74302.800 |
|
(ii) Intangible Assets |
|
24939.100 |
2804.400 |
|
(iii) Capital
work-in-progress |
|
0.000 |
1840.000 |
|
(iv) Intangible assets
under development |
|
0.000 |
10.100 |
|
(b) Non-current
Investments |
|
116.900 |
680.100 |
|
(c) Deferred tax assets
(net) |
|
0.000 |
29.500 |
|
(d) Long-term Loan and Advances |
|
54.700 |
194.400 |
|
(e) Other Non-current
assets |
|
2281.600 |
10629.300 |
|
Total Non-Current Assets |
|
65003.200 |
90490.600 |
|
|
|
|
|
|
(2) Current assets |
|
|
|
|
(a) Current investments |
|
184.300 |
2010.500 |
|
(b) Inventories |
|
2067.100 |
6063.900 |
|
(c) Trade receivables |
|
6270.200 |
22363.400 |
|
(d) Cash and cash
equivalents |
|
7149.000 |
7408.600 |
|
(e) Short-term loans and
advances |
|
4278.300 |
1089.900 |
|
(f) Other current assets |
|
1237.700 |
6189.600 |
|
Total Current Assets |
|
21186.600 |
45125.900 |
|
|
|
|
|
|
TOTAL |
|
86189.800 |
135616.500 |
PROFIT
& LOSS ACCOUNT (CONSOLIDATED)
|
|
PARTICULARS |
|
31.03.2017 |
31.03.2016 |
|
|
SALES |
|
|
|
|
|
Income |
|
19213.200 |
9408.600 |
|
|
Other Income |
|
971.600 |
763.800 |
|
|
TOTAL |
|
20184.800 |
10172.400 |
|
|
|
|
|
|
|
Less |
EXPENSES |
|
|
|
|
|
Cost of Materials
Consumed |
|
8998.800 |
5301.700 |
|
|
Purchases of
Stock-in-Trade |
|
4931.900 |
525.600 |
|
|
Changes in inventories of
finished goods, work-in-progress and Stock-in-Trade |
|
(251.100) |
8.000 |
|
|
Employees benefits
expense |
|
959.200 |
609.100 |
|
|
Other expenses |
|
1875.100 |
901.400 |
|
|
TOTAL |
|
16513.900 |
7345.800 |
|
|
|
|
|
|
|
|
PROFIT/ (LOSS) BEFORE INTEREST, TAX, DEPRECIATION AND
AMORTISATION |
|
3670.900 |
2826.600 |
|
|
|
|
|
|
|
Less |
FINANCIAL EXPENSES |
|
933.200 |
678.800 |
|
|
|
|
|
|
|
|
PROFIT / (LOSS) BEFORE
TAX, DEPRECIATION AND AMORTISATION |
|
2737.700 |
2147.800 |
|
|
|
|
|
|
|
Less/ Add |
DEPRECIATION/
AMORTISATION |
|
1322.200 |
725.300 |
|
|
|
|
|
|
|
|
PROFIT/ (LOSS) BEFORE TAX |
|
1415.500 |
1422.500 |
|
|
|
|
|
|
|
Less |
TAX |
|
73.000 |
314.100 |
|
|
|
|
|
|
|
|
PROFIT/ (LOSS) AFTER TAX
|
|
1342.500 |
1108.400 |
|
|
|
|
|
|
|
|
Earnings / (Loss) Per Share
(INR) |
|
2.76 |
14.23 |
LEGAL CASES
LOCAL AGENCY FURTHER INFORMATION
|
Sr. No. |
Check list by
info agents |
Available in
Report (Yes/No) |
|
1 |
Year of establishment |
Yes |
|
2 |
Constitution of the entity -Incorporation
details |
Yes |
|
3 |
Locality of the entity |
Yes |
|
4 |
Premises details |
No |
|
5 |
Buyer visit details |
-- |
|
6 |
Contact numbers |
Yes |
|
7 |
Name of the person contacted |
Yes |
|
8 |
Designation of contact person |
Yes |
|
9 |
Promoter’s background |
Yes |
|
10 |
Date of Birth of Proprietor / Partners /
Directors |
Yes |
|
11 |
Pan Card No. of Proprietor / Partners |
Yes |
|
12 |
Voter Id Card No. of Proprietor / Partners |
No |
|
13 |
Type of business |
Yes |
|
14 |
Line of Business |
Yes |
|
15 |
Export/import details (if applicable) |
No |
|
16 |
No. of employees |
Yes |
|
17 |
Details of sister concerns |
Yes |
|
18 |
Major suppliers |
No |
|
19 |
Major customers |
No |
|
20 |
Banking Details |
Yes |
|
21 |
Banking facility details |
Yes |
|
22 |
Conduct of the banking account |
-- |
|
23 |
Financials, if provided |
Yes |
|
24 |
Capital in the business |
Yes |
|
25 |
Last accounts filed at ROC, if applicable |
Yes |
|
26 |
Turnover of firm for last three years |
Yes |
|
27 |
Reasons for variation <> 20% |
-- |
|
28 |
Estimation for coming financial year |
No |
|
29 |
Profitability for last three years |
Yes |
|
30 |
Major shareholders, if available |
Yes |
|
31 |
External Agency Rating, if available |
Yes |
|
32 |
Litigations that the firm/promoter
involved in |
Yes |
|
33 |
Market information |
-- |
|
34 |
Payments terms |
No |
|
35 |
Negative Reporting by Auditors in the
Annual Report |
No |
FINANCIAL PERFORMANCE
The Company’s gross sales jumped by INR 5158.200 Million from INR 9180.200 Million in 2015-16 to INR 14338.400 Million in 2016-17 driven by robust growth in the Textile and Yarn Business. EBIDTA of Textile and Yarn Business increased by 25.30% from INR 281.86 Million in 2015-16 to INR 3531.700 Million in 2016-17 and the profit after tax for the year grew by 15.55% from INR 1103.200 Million in 2015-16 to INR 1274.800 Million in 2016-17. Consequently, the earnings per share (face value or B1) stood at INR 26.200 (basic) and INR 26.200 (diluted) for 2016-17 against INR 2.500 (basic) and INR 2.500 (diluted) for 2015-16. The Company repaid debts worth INR 600.600 Million. Besides, FCCBs worth US$ 29.00 million (of the US$ 110 million FCCB issue) were converted into Equity, which increased the Company’s net worth by INR 1916.100 Million, thus strengthening the financials of the Company.
STATE OF COMPANY’S
AFFAIRS
Sintex is globally-respected for the manufacture of structured fabrics addressing high-end fashion shirting manufacture. The Company’s fibre-to-fabric facility (Kalol) is one of the largest weaving Unit in India; the Company operates one of the largest corduroy facility in India. It produces multiple varieties of blended high-end shirting fabrics marketed under the BVM brand. To strengthen its presence in the Indian textile space, the Company is in the midst of setting up one of India’s largest compact yarn facilities in India housing 1 mn. spindles -to be commissioned in a phased manner.
MANAGEMENT DISCUSSION
AND ANALYSIS
Economic overview
Global economy
Global economic activity improved in the second half of CY2016, especially in advanced economies. Growth picked up in the US as firms grew more confident about future demand. The economy also recorded a lower rate of unemployment and buoyant consumer demand. In the aftermath of the Brexit vote, the Euro area growth was also resilient on the back of strong domestic demand and continued easing; the growth in the United Kingdom remained robust on the back of resilient spending. Japan’s performance has also been on the upside with strong exports.
However, the global economic growth, at 3.1% on a y-o-y basis, fell short of expectations in CY2016 as deceleration in key emerging markets and developing economies (EMDEs) overshadowed the modest recovery in major developed countries. The EMDEs contribute to more than half of the global economic growth rate. Their deceleration was accompanied by a modest increase in commodity prices, subdued global trade, financial market volatility and weakening capital flows. Although China’s growth turned out to be better than expected on the back of policy stimulus, it was lower than CY2015. India fared better than the world in terms of growth, even though the demonetisation exercise temporarily threw a challenge.
Outlook: There has been acceleration in growth in advanced economies, primarily owing to reduced inventories and marginal recovery in manufacturing output. Stronger activity and expectations of more robust global demand, coupled with agreed restrictions on oil supply, have helped commodity prices recover from their troughs in early 2016. Oil prices increased consequent to an agreement among major producers to trim supply. Activity is projected to pick up in emerging market and developing economies, because conditions in commodity exporters experiencing macroeconomic strains are gradually expected to improve.
According to the International Monetary Fund (IMF), the global economic activity is picking up with a long awaited cyclical recovery in investment, manufacturing, and trade. It has projected economic activities to improve in both advanced economies as well as EMDEs in CY 2017 and CY 2018, with global growth projections at 3.5% and 3.6%, respectively.
GENERAL INFORMATION
Sintex Industries Limited (“the Company”) is primarily engaged in the business of manufacture and sale of yarn and structured fabrics.
Sintex Industries Limited is a public limited company incorporated in India on June 01, 1931 under the Companies Act, 1956 and listed on the Bombay Stock Exchange and National Stock Exchange. The registered office of the Company is at Kalol (North Gujarat) – 382 721, India.
UNSECURED LOAN
|
Unsecured Loan |
31.03.2017 (INR
in Million) |
31.03.2016 (INR
in Million) |
|
Long-term
Borrowings |
|
|
|
Foreign Currency Convertible Bonds |
3930.300 |
0.000 |
|
Foreign Currency Term loans from banks |
630.200 |
1989.900 |
|
|
|
|
|
Short-term
borrowings |
|
|
|
Other loans |
0.000 |
560.000 |
|
|
|
|
|
Total |
4560.500 |
2549.900 |
INDEX
OF CHARGES:
|
SNo |
SRN |
Charge Id |
Charge Holder Name |
Date of Creation |
Date of Modification |
Date of Satisfaction |
Amount |
Address |
|
1 |
G60636966 |
100132008 |
PNB INVESTMENT SERVICES LIMITED |
18/08/2017 |
- |
- |
9600000000.0 |
10, Rakesh Deep Building,Yusuf Sarai Commercial Complex, Gulmohar EnclaveNew DelhiDL110049IN |
|
2 |
G49631088 |
100113567 |
RBL BANK LIMITED |
01/06/2017 |
- |
- |
2800000000.0 |
SHAHUPURI,KOLHAPUR,KOLHAPURMa416001IN |
|
3 |
G39676119 |
100080146 |
PNB INVESTMENT SERVICES LIMITED |
30/12/2016 |
15/03/2017 |
- |
18863800000.0 |
10, Rakesh Deep Building,Yusuf Sarai Commercial Complex, Gulmohar EnclaveNew DelhiDe110049IN |
|
4 |
G08577546 |
100043435 |
IL & FS TRUST COMPANY LIMITED |
16/07/2016 |
- |
- |
2000000000.0 |
IL & FS FINANCIAL CENTREPLOT NO C22 G BLOCK BANDRAKURLA COMPLEX BANDRA EASTMUMBAIMa400051IN |
|
5 |
G14497499 |
10614180 |
PNB INVESTMENT SERVICES LIMITED |
27/11/2015 |
03/08/2016 |
- |
3600000000.0 |
10, Rakesh Deep Building,Yusuf Sarai Commercial Complex, Gulmohar EnclaveNew DelhiDe110049IN |
|
6 |
C65689523 |
10594401 |
IL & FS TRUST COMPANY LIMITED |
03/10/2015 |
- |
- |
5000000000.0 |
IL & FS FINANCIAL CENTREPLOT NO C22 G BLOCK BANDRAKURLA COMPLEX BANDRA EASTMUMBAIMH400051IN |
|
7 |
G02623429 |
10604635 |
PNB INVESTMENT SERVICES LIMITED |
11/04/2015 |
28/03/2016 |
- |
12200000000.0 |
C/o Punjab National Bank,6th Floor, Gujarat Bhavan, Ellisbridge,AhmedabadGJ380006IN |
|
8 |
C52113560 |
10535484 |
IL & FS TRUST COMPANY LIMITED |
02/08/2014 |
30/04/2015 |
- |
2750000000.0 |
IL & FS FINANCIAL CENTREPLOT NO C22 G BLOCK BANDRAKURLA COMPLEX BANDRA EASTMUMBAIMH400051IN |
|
9 |
C52113453 |
10517328 |
IL & FS TRUST COMPANY LIMITED |
24/07/2014 |
30/04/2015 |
- |
2250000000.0 |
IL & FS FINANCIAL CENTREPLOT NO C22 G BLOCK BANDRAKURLA COMPLEX BANDRA EASTMUMBAIMH400051IN |
|
10 |
C21817127 |
10489935 |
PNB INVESTMENT SERVICES LIMITED |
17/04/2014 |
16/09/2014 |
- |
12200000000.0 |
C/o Punjab National Bank,6th Floor, Gujarat Bhavan, Ellisbridge,AhmedabadGJ380006IN |
CONTINGENT
LIABILITIES:
(INR in million)
|
PARTICULARS |
31.03.2017 |
31.03.2016 |
|
Company has imported machineries duty free under EPCG Scheme for which duty saved amount * |
3234.900 |
1033.100 |
|
Disputed demand not acknowledged as debt against which the Company has preferred appeal |
188.000 |
186.700 |
|
Corporate guarantees given to Financial Institution / Bank on behalf of Subsidiaries for facilities availed by them |
0.000 |
8676.300 |
|
Performance guarantees given to customers by bankers |
0.000 |
1446.800 |
|
Total |
3422.900 |
11342.900 |
FIXED ASSETS
- Freehold Land
- Leasehold land
- Buildings
- Plant and machinery
- Furniture, fixtures
- Office equipments
- Vehicles
UNAUDITED FINANCIAL RESULTS FOR THE QUARTER AND HALF YEAR ENDED SEPTEMBER 30, 2017
(Amount
In INR)
|
|
|
Particulars |
31.12.2017 (Quarter ended) |
30.09.2017 (Quarter ended) |
31.12.2017 (Nine Months ended) |
|
1 |
|
Income from
Operations |
|
|
|
|
|
|
a)
Revenue from Operations (Gross) |
5090.100 |
4606.600 |
14188.300 |
|
|
|
b)
Other Operating Income |
319.800 |
233.200 |
814.900 |
|
|
Total Income from
Operations (Net) |
5409.900 |
4839.800 |
15003.200 |
|
|
2 |
Expenses |
|
|
|
|
|
|
a) |
Cost of Materials consumed |
3470.100 |
3061.900 |
9675.400 |
|
|
b) |
Purchase of Stock-in-trade |
0.000 |
0.000 |
0.000 |
|
|
c) |
Changes in inventories of finished goods, work-in-progress and
stock-in-trade |
(21.100) |
(117.100) |
(444.200) |
|
|
d) |
Employee benefit expenses |
377.900 |
368.100 |
1029.900 |
|
|
e) |
Finance Costs |
251.000 |
225.800 |
735.400 |
|
|
f) |
Depreciation and amortization expense |
343.900 |
343.100 |
1026.200 |
|
|
g) |
Other expenses |
636.100 |
610.700 |
1882.700 |
|
|
Total Expenses |
5057.900 |
4492.500 |
13905.400 |
|
|
|
|
|
|
|
|
|
3 |
Profit before Tax |
352.000 |
347.300 |
1097.800 |
|
|
4 |
Tax Expense |
112.200 |
36.900 |
266.200 |
|
|
5 |
Net Profit for the
period after tax |
239.800 |
310.400 |
831.600 |
|
|
|
|
|
|
|
|
|
6 |
Other Comprehensive Income |
|
|
|
|
|
|
Items
that will not be classified of profit or loss |
(26.800) |
99.700 |
71.000 |
|
|
|
|
|
|
|
|
|
|
Total
Comprehensive Income |
213.000 |
410.100 |
902.600 |
|
|
|
|
|
|
|
|
|
|
Earnings / (Loss) Per
Share (INR) |
0.41 |
0.55 |
1.47 |
|
NOTE :
1. The above Standalone Un-Audited Financial Results of the Company for the Third Quarter and Nine Months ended 31st December, 2017, were reviewed by the Audit Committee and approved by the Board of Directors in their respective Meetings held on January 12, 2018. The Statutory Auditors of the Company have reviewed the said Results.
2. With respect to USD 110 Million Foreign Currency Convertible Bonds due 2022 (FCCBs) raised by the Company, during the Quarter ended 31st December, 2017, FCCBs aggregating to USD 16 Million have been converted into 11709425 equity shares resulting in increase in equity share capital by INR 11.700 Million and security premium by INR 104.71 INR. There are USD 18.5 Million FCCBs outstanding for conversion as on 31st December, 2017.
3. The listed Non-Convertible Debentures of the Company aggregating to INR 5000.000 Million outstanding as on 31st December, 2017 are secured by way of first pari passu charge on the Company’s certain properties and the asset cover thereof exceeds one hundred twenty five percent of the principal amount of the said debentures.
4. The Company operates in Textile business which is the only reportable segment in accordance with the requirements of Ind-AS 108 “Operating Segments”.
5. The figures of previous quarters/ year have been regrouped/ reclassified, wherever necessary.
PRESS RELEASE
DEMERGED SINTEX
INDUSTRIES SHARES SURGE 85% ON TRADING DEBUT
Sintex Industries shares now reflect the value of its textile business only. Textile is the oldest business of Sintex Industries.
HIGHLIGHTS
- Sintex Industries traded for first time today after demerger
- Sintex Industries shares now reflect value of its textile business only
- STPL shares will be listed separately within next 45-60 days
Sintex Industries shares surged as much as 85 per cent
to INR 34.500 on the Bombay Stock Exchange against its opening price
of INR 18.650 after it started trading ex-scheme of arrangement with
effect from today (Thursday). Sintex Industries had fixed May 26, 2017 as the
record date for the purpose of determination of entitlement for allotment of
equity shares of the demerged entity as per the composite scheme of
arrangement.
Last year in September, Sintex Industries board had approved demerger of its
'custom moulding business' and 'prefab business' from Sintex Industries to
Sintex-BAPL and Sintex Infra Projects, respectively as wholly owned
subsidiaries of Sintex Plastics Technology (SPTL). According to the company
this transaction is likely to unlock shareholder's value.
Under the scheme of arrangement, shareholders of erstwhile Sintex Industries will get one share of SPTL for every share of Sintex Industries held on the record date. STPL shares will be listed separately on BSE and NSE within next 45-60 days.
Sintex Industries shares now reflect the value of its textile business only. Textile is the oldest business of Sintex Industries. In FY16, the textile business of Sintex industries contributed 12 per cent to its overall revenue. It (textile business) focuses mainly on high-end jacquared fabric. Its key customers are Hugo Boss, Armani, Tommy Hilfiger, Van Heusen and Zara.
Sintex Industries shares closed INR 38.340 per cent higher at INR 25.800 against its opening price of INR 18.650.
CMT REPORT (Corruption, Money Laundering & Terrorism]
The Public Notice information has been collected from various sources
including but not limited to: The Courts, India Prisons Service,
Interpol, etc.
1] INFORMATION ON
DESIGNATED PARTY
No records exist designating subject or any of its beneficial owners,
controlling shareholders or senior officers as terrorist or terrorist
organization or whom notice had been received that all financial transactions
involving their assets have been blocked or convicted, found guilty or against
whom a judgement or order had been entered in a proceedings for violating
money-laundering, anti-corruption or bribery or international economic or
anti-terrorism sanction laws or whose assets were seized, blocked, frozen or
ordered forfeited for violation of money laundering or international
anti-terrorism laws.
2] Court Declaration :
No records exist to suggest that subject is
or was the subject of any formal or informal allegations, prosecutions or other
official proceeding for making any prohibited payments or other improper
payments to government officials for engaging in prohibited transactions or
with designated parties.
3] Asset Declaration :
No records exist to suggest that the property or assets of the subject
are derived from criminal conduct or a prohibited transaction.
4] Record on Financial
Crime :
Charges or conviction
registered against subject: None
5] Records on Violation of
Anti-Corruption Laws :
Charges or
investigation registered against subject: None
6] Records on Int’l
Anti-Money Laundering Laws/Standards :
Charges or
investigation registered against subject: None
7] Criminal Records
No
available information exist that suggest that subject or any of its principals
have been formally charged or convicted by a competent governmental authority
for any financial crime or under any formal investigation by a competent
government authority for any violation of anti-corruption laws or international
anti-money laundering laws or standard.
8] Affiliation with
Government :
No record
exists to suggest that any director or indirect owners, controlling
shareholders, director, officer or employee of the company is a government
official or a family member or close business associate of a Government
official.
9] Compensation Package :
Our market
survey revealed that the amount of compensation sought by the subject is fair
and reasonable and comparable to compensation paid to others for similar
services.
10] Press Report :
No press reports / filings exists on
the subject.
CORPORATE GOVERNANCE
MIRA INFORM as part of its Due Diligence do provide comments on
Corporate Governance to identify management and governance. These factors often
have been predictive and in some cases have created vulnerabilities to credit
deterioration.
Our Governance Assessment focuses principally on the interactions
between a company’s management, its Board of Directors, Shareholders and other
financial stakeholders.
CONTRAVENTION
Subject is not known to have contravened any existing local laws,
regulations or policies that prohibit, restrict or otherwise affect the terms
and conditions that could be included in the agreement with the subject.
FOREIGN EXCHANGE RATES
|
Currency |
Unit
|
INR |
|
US Dollar |
1 |
INR 64.10 |
|
|
1 |
INR 86.14 |
|
Euro |
1 |
INR 75.52 |
INFORMATION DETAILS
|
Analysis Done by
: |
NYT |
|
|
|
|
Report Prepared
by : |
KJL |
SCORE FACTORS
|
DEMERIT POINTS |
|
|
|
--BANK CHARGES |
YES/NO |
YES |
|
--LITIGATION |
YES/NO |
YES |
|
--OTHER ADVERSE INFORMATION |
YES/NO |
NO |
|
MERIT POINTS |
|
|
|
--SOLE DISTRIBUTORSHIP |
YES/NO |
NO |
|
--EXPORT ACTIVITIES |
YES/NO |
NO |
|
--AFFILIATION |
YES/NO |
YES |
|
--LISTED |
YES/NO |
YES |
|
--OTHER MERIT FACTORS |
YES/NO |
YES |
RATING EXPLANATIONS
|
Credit Rating |
Explanation |
Rating Comments |
|
A++ |
Minimum Risk |
Business dealings permissible with minimum
risk of default |
|
A+ |
Low Risk |
Business dealings permissible with low
risk of default |
|
A |
Acceptable Risk |
Business dealings permissible with
moderate risk of default |
|
B |
Medium Risk |
Business dealings permissible on a regular
monitoring basis |
|
C |
Medium High Risk |
Business dealings permissible preferably
on secured basis |
|
D |
High Risk |
Business dealing not recommended or on
secured terms only |
|
NB |
New Business |
No recommendation can be done due to
business in infancy stage |
|
NT |
No Trace |
No recommendation can be done as the
business is not traceable |
NB is stated where there is insufficient information to facilitate rating. However, it is not to be considered as unfavourable.
This score serves as a reference to assess
SC’s credit risk and to set the amount of credit to be extended. It is
calculated from a composite of weighted scores obtained from each of the major
sections of this report. The assessed factors are as follows:
·
Financial
condition covering various ratios
·
Company
background and operations size
·
Promoters
/ Management background
·
Payment
record
·
Litigation
against the subject
·
Industry
scenario / competitor analysis
·
Supplier
/ Customer / Banker review (wherever available)
This report is issued at
your request without any risk and responsibility on the part of MIRA INFORM
PRIVATE LIMITED (MIPL) or its officials.