|
|
|


MIRA INFORM REPORT
|
Report No. : |
490050 |
|
Report Date : |
06.02.2018 |
IDENTIFICATION DETAILS
|
Name : |
ASHOK LEYLAND LIMITED (w.e.f. July, 1955) “HINDUJA FOUNDRIES LIMITED” AMALGAMATED WITH “ASHOK LEYLAND LIMITED” |
|
|
|
|
Formerly Known
As : |
ASHOK MOTORS LIMITED |
|
|
|
|
Registered
Office : |
No. 1, Sardar
Patel Road, Guindy, Chennai – 600032, Tamilnadu |
|
Tel No.: |
91-44-22206000 |
|
|
|
|
Country : |
India |
|
|
|
|
Financials (as
on) : |
31.03.2017 |
|
|
|
|
Date of
Incorporation : |
07.09.1948 |
|
|
|
|
Com. Reg. No.: |
18-000105 |
|
|
|
|
Capital
Investment / Paid-up Capital : |
INR 2845.880 Million |
|
|
|
|
CIN No.: [Company Identification
No.] |
L34101TN1948PLC000105 |
|
|
|
|
IEC No.: |
0488014336 |
|
|
|
|
TAN No.: [Tax Deduction &
Collection Account No.] |
Not Available |
|
|
|
|
GST No.: |
33AAACA4651L1ZT |
|
|
|
|
TIN No.: |
08280602526 [Rajasthan] 33511080003 [Chennai] |
|
|
|
|
PAN No.: [Permanent Account No.] |
AAACA4651L |
|
|
|
|
Legal Form : |
A Public Limited Liability Company. The Company’s Shares are Listed on
the Stock Exchanges. |
|
|
|
|
Line of Business
: |
Manufacturer of Medium and Heavy Commercial Vehicle, Light Commercial Vehicles, Power Solutions Systems, Passenger Vehicles Services. [Registered Activity] |
|
|
|
|
No. of Employees
: |
11906 [Approximately] |
RATING & COMMENTS
|
MIRA’s Rating : |
A++ |
|
Credit Rating |
Explanation |
Rating Comments |
|
A++ |
Minimum Risk |
Business dealings permissible with minimum
risk of default |
|
Maximum Credit Limit : |
USD 175000000 |
|
|
|
|
Status : |
Excellent |
|
|
|
|
Payment Behaviour : |
Regular |
|
|
|
|
Litigation : |
Exist |
|
|
|
|
Comments : |
Ashok Leyland Limited (ALL) is a Flagship Company of the Hinduja Group, which is one of the largest commercial vehicle manufacturers in India. The company is one of the largest manufacturers of Medium and Heavy Commercial Vehicles (M&HCV) and also has significant presence in the Light Commercial Vehicle (LCV) segment.
Payments seems to be regular and as per commitment. In view of aforesaid, the company can be considered good for normal business dealings at usual trade terms and conditions.
NOTE: The Board
of Directors of the Company at their meeting held on September 14, 2016,
approved the draft scheme of amalgamation of Hinduja Foundries Limited (HFL)
with the subject Company and their respective shareholders and creditors,
under Sections 391 to 394 of the Companies Act, 1956 subject to regulatory
approvals. The Appointed Date for the scheme of amalgamation was October 1,
2016. The intended amalgamation had been approved by the shareholders at the
Court Convened Meeting held on January 23, 2017 and through Postal Ballot on
January 25, 2017. The Hon’ble National Company Law Tribunal, Chennai Bench
(NCLT) which heard the Company’s petition on April 18, 2017 sanctioned the
scheme of amalgamation of HFL with the subject Company and their respective
shareholders and creditors. The NCLT Order was filed with the Registrar of
Companies, Chennai and the scheme became effective on April 28, 2017. The
Board of Directors of the Company had formed a Committee of Directors
comprising of Mr. Dheeraj G Hinduja, Chairman, Mr. Vinod K Dasari, Chief
Executive Officer and Managing Director, Mr. D J Balaji Rao and Mr. Sanjay K
Asher, Directors as members of the Committee and authorised the Committee to
do all such acts, deeds, matters and things as may be necessary for the
purpose of giving effect to the Order of NCLT on the scheme of amalgamation
of HFL with the subject Company including but not limited to issue and
allotment of the equity shares of the Company to the eligible shareholders of
the Transferor Company as on the Record date. Further to the receipt of noted
letter from the designated stock exchange, the Board of Directors of the
Company had fixed Wednesday, June 7, 2017 as the ‘Record Date’ for
determining the shareholders of Hinduja Foundries Limited (Transferor
Company), entitled to receive the equity shares of Ashok Leyland Limited
(Transferee Company), under the Scheme of amalgamation sanctioned by NCLT.
Consequent to the above, the issued, subscribed and paid-up equity share
capital will stand increased from 2845876634 equity shares of INR 1/- each to
2926534926 equity shares of INR 1/- each. |
NOTES:
Any query related to this report can be made
on e-mail: infodept@mirainform.com
while quoting report number, name and date.
ECGC Country Risk Classification List
|
Country Name |
Previous Rating (30.06.2017) |
Current Rating (30.09.2017) |
|
India |
A1 |
A1 |
|
Risk Category |
ECGC
Classification |
|
Insignificant |
A1 |
|
Low Risk |
A2 |
|
Moderately Low Risk |
B1 |
|
Moderate Risk |
B2 |
|
Moderately High Risk |
C1 |
|
High Risk |
C2 |
|
Very High Risk |
D |
EXTERNAL AGENCY RATING
|
Rating Agency Name |
CARE |
|
Rating |
Long Term Bank Facilities = AA |
|
Rating Explanation |
High degree of safety and very low credit risk. |
|
Date |
19.09.2017 |
|
Rating Agency Name |
CARE |
|
Rating |
Short Term Bank Facilities = A1+ |
|
Rating Explanation |
Very strong degree of safety and carry lowest credit risk. |
|
Date |
19.09.2017 |
RBI DEFAULTERS’ LIST STATUS
Subject’s name is not enlisted as a defaulter
in the publicly available RBI Defaulters’ list.
EPF (Employee Provident Fund) DEFAULTERS’ LIST STATUS
Subject’s name is not enlisted as a defaulter in
the publicly available EPF (Employee Provident Fund) Defaulters’ list as of
31-03-2016.
BIFR (Board for Industrial & Financial Reconstruction) LISTING
STATUS
Subject’s name is not listed as a Sick Unit in
the publicly available BIFR (Board for Industrial & Financial
Reconstruction) list as of 06.02.2018.
IBBI (Insolvency and Bankruptcy Board of India) LISTING STATUS
Subject’s name is not listed in the publicly
available IBBI (Insolvency and Bankruptcy Board of India) list as of report
date.
INFORMATION DECLINED BY
|
Name : |
Mr. Rahul |
|
Designation : |
Finance Department |
|
Contact No.: |
91-44-22206000 |
|
Date : |
02.02.2018 |
Given number [91-44-33254500] ringing
LOCATIONS
|
Registered/ Corporate Office : |
No. 1, Sardar Patel
Road, Guindy, Chennai – 600032, Tamilnadu, India |
|
Tel. No.: |
91-44-22206000/ 22322414 |
|
Fax No.: |
91-44-22206001 |
|
E-Mail : |
|
|
Website : |
|
|
|
|
|
Factory 1: |
Matsya Industrial Area, Alwar - 301 030, Rajasthan, India |
|
Tel. No.: |
91-144-2881317/ 425/ 429/ 512/ 513/ 515/ 522 |
|
Fax No.: |
91-144-2881355 |
|
|
|
|
Factory 2: |
P.O. Box 15, Plot No. 1, MIDC Industrial Area, Gadegaon Lakhani Taluk, Bhandara - 441 904, Maharashtra, India |
|
Tel. No.: |
91-7184-274431/ 39/ 274606 |
|
Fax No.: |
91-7184-274431 |
|
|
|
|
Factory 3: |
Kathivakkam High Road, P. O. Box No. 3, Ennore, Chennai - 600 057, Tamilnadu, India |
|
Tel. No.: |
91-44-25751001/ 25750233 |
|
Fax No.: |
91-44-25751798 |
|
|
|
|
Factory 4: |
175, Hosur Sipcot Industrial Complex, Rajaji Nagar, Hosur - 635 126, Tamilnadu, India |
|
Tel. No.: |
91-4344 - 276631 to 276635/ 407000 |
|
Fax No.: |
91-4344 - 276067 / 276480 |
|
|
|
|
Factory 5: |
77, Electronic Complex, Perandapalli, Hosur – 635109, Tamilnadu, India |
|
Tel. No.: |
91-4344-269200 |
|
Fax No.: |
91-4344-260048 |
|
|
|
|
Factory 6: |
Plot No.1, Sector XIIIIE, Pant Nagar - 263 153, Uttarakhand, India |
|
|
|
|
Branch Office 1: |
Pride Postal, Ground Floor, St. No.- 103, Bahiratwadi Off, Senapati
Bapat Road, Shivaji Nagar, Pune-411006, Maharashtra, India |
|
|
|
|
Branch Office 2/ Factory 7 : |
Unit: Plot No K2, SIPCOT Industrial Estate, Arneri Village,
Sriperumbudur – 602105, Tamilnadu, India |
|
Tel. No.: |
91-44-33254500 |
|
|
|
|
Management
Development : |
Located at:
|
|
|
|
|
Technical Centre |
Vellivayal Chavadi, Via Manali New Town, Chennai - 600 103, Tamilnadu, India |
|
|
|
|
Area Offices : |
|
|
|
|
|
Central Region : |
Located At:
|
|
|
|
|
East Region : |
Located At:
|
|
|
|
|
North Region : |
Located At:
|
|
|
|
|
South Region: |
Located At:
|
|
|
|
|
West Region : |
Located At:
|
|
|
|
|
Regional Offices : |
|
|
Central Region |
Located At:
|
|
|
|
|
East Region : |
Located At:
|
|
|
|
|
North Region : |
Located At:
|
|
|
|
|
South Region: |
Located At:
|
|
|
|
|
West Region : |
Located At:
|
DIRECTORS
AS ON: 31.03.2017
|
Name : |
Mr. Sanjay Khatau Asher |
|
Designation : |
Director |
|
Address : |
32, Mody Street, Fort, Mumbai-400001, Maharashtra, India |
|
Date of Appointment : |
21.12.2010 |
|
DIN No.: |
00008221 |
|
|
|
|
Name : |
Mr. Balaji Rao Jagannathrao Doveton |
|
Designation : |
Director |
|
Address : |
D-103, Adarsh Residency, 47th Cross, 2nd Main Jayanagar, 8th Block, Bangalore-560082, Karnataka, India |
|
Date of Appointment : |
27.03.2002 |
|
DIN No.: |
00025254 |
|
|
|
|
Name : |
Mr. Dheeraj Gopichand Hinduja |
|
Designation : |
Director |
|
Address : |
24, Carlton House Terrace London Sw153ap Gb |
|
Date of Appointment : |
03.09.1996 |
|
DIN No.: |
00133410 |
|
|
|
|
Name : |
Mr. Vinod Kumar Dasari |
|
Designation : |
Managing Director |
|
Address : |
No.1, 2nd Cross Street Dhandayudhapani Nagar, Kotturpuram, Chennai-600085, Tamilnadu, India |
|
Date of Appointment : |
01.04.2014 |
|
DIN No.: |
00345657 |
|
|
|
|
Name : |
Mrs. Manisha Girotra |
|
Designation : |
Director |
|
Address : |
M-21, Greater Kailash II, New Delhi-110048, India |
|
Date of Appointment : |
08.09.2014 |
|
DIN No.: |
00774574 |
|
|
|
|
Name : |
Mr. Sudhindar Krishan Khanna |
|
Designation : |
Director |
|
Address : |
Flat No 9, 4th Floor, Nariman Building M K Marg, Cooperage Bandstand, Mumbai-400021, Maharashtra, India |
|
Date of Appointment : |
12.05.2015 |
|
DIN No.: |
01529178 |
|
|
|
|
Name : |
Mr. Andrew Charles Palmer |
|
Designation : |
Director |
|
Address : |
4 Church View Brackley Northamptonshire Nn137bb Gb |
|
Date of Appointment : |
04.11.2015 |
|
DIN No.: |
02155231 |
|
|
|
|
Name : |
Mr. Jean Brunol |
|
Designation : |
Director |
|
Address : |
34 Bd Victor Hugo Neuilly Sur Seine 92200 Fr |
|
Date of Appointment : |
20.10.2010 |
|
DIN No.: |
03044965 |
|
|
|
|
Name : |
Dr. Andreas Hubertus Biagosch |
|
Designation : |
Director |
|
Address : |
Irmgardstr, 10 Munchen 81479 De |
|
Date of Appointment : |
10.05.2013 |
|
DIN No.: |
06570499 |
|
|
|
|
Name : |
Jose Maria Alapont Alapont |
|
Designation : |
Additional Director |
|
Address : |
Flat 10 St James's Chambers Ryder Street London Swiy 6qa Gb |
|
Date of Appointment : |
25.01.2017 |
|
DIN No.: |
07712699 |
KEY EXECUTIVES
|
Name : |
Mr. Gopal Mahadevan |
|
Designation : |
Chief Finance Office |
|
Address : |
Abbotsbury, Door No 42, C P Ramasamy Road, Alwarpet, Chennai-600018, Tamilnadu, India |
|
Date of Appointment : |
22.05.2014 |
|
PAN No.: |
AACPG7248J |
|
|
|
|
Name : |
Mr. Natarajan Ramanathan |
|
Designation : |
Company Secretary |
|
Address : |
39,Ist Main Road, S-1 Madhusudan Flats, Nanganallur, Chennai-600061, Tamilnadu, India |
|
Date of Appointment : |
01.07.2013 |
|
PAN No.: |
AEGPR2435A |
|
|
|
|
Name : |
Mr. R J Shahaney |
|
Designation : |
Chairman Emeritus |
|
|
|
|
Senior Management: |
·
Mr. Anuj Kathuria ·
N V Balachandar ·
E Balasubramoniam ·
P G Chandramohan ·
P Harihar ·
Mr. Nandkumar Khandare ·
Mr.Nitin Seth ·
Mr. Rajive Saharia ·
K Ram Kumar ·
Dr. N Saravanan ·
Dr. Seshu Bhagavathula ·
R Sivanesan ·
T Venkataraman ·
Mr.Venkatesh Natarajan |
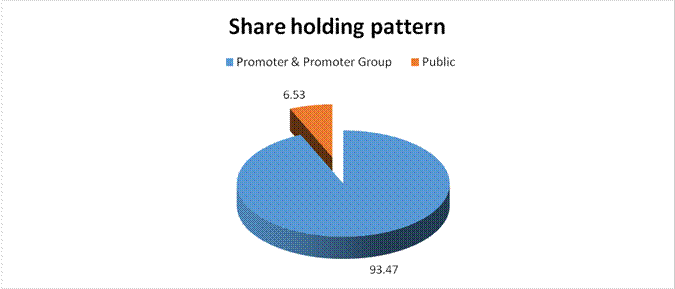
MAJOR SHAREHOLDERS / SHAREHOLDING PATTERN
AS ON: 31.12.2017
|
Category of shareholder |
Total nos. shares held |
Shareholding as a % of total no. of shares (calculated
as per SCRR, 1957)As a % of (A+B+C2) |
|
|
(A) Promoter &
Promoter Group |
329200140 |
51.27 |
|
|
(B) Public |
23001500 |
48.73 |
|
|
Grand Total |
352201640 |
100.0 |
STATEMENT SHOWING SHAREHOLDING PATTERN OF THE PROMOTER AND PROMOTER
GROUP
|
Category of shareholder |
No. of fully paid up equity shares held |
Shareholding as a % of total no. of shares
(calculated as per SCRR, 1957)As a % of (A+B+C2) |
|
|
A1) Indian |
0.00 |
||
|
A2) Foreign |
0.00 |
||
|
Any Other
(specify) |
1171460121 |
51.27 |
|
|
HINDUJA AUTOMOTIVE
LIMITED |
1019428678 |
34.83 |
|
|
AMAS BANK
(SWITZERLAND) LIMITED |
144904064 |
16.20 |
|
|
HINDUJA FOUNRIES
HOLDING LIMITED |
7127379 |
0.24 |
|
|
Sub Total A2 |
1171460121 |
51.27 |
|
|
A=A1+A2 |
1171460121 |
51.27 |
STATEMENT SHOWING SHAREHOLDING PATTERN OF THE PUBLIC SHAREHOLDER
|
Category & Name of the Shareholders |
No. of fully paid up equity shares held |
Shareholding % calculated as per SCRR, 1957
As a % of (A+B+C2) |
|
|
|||
|
|||
|
|||
|
B1) Institutions |
0 |
0.00 |
|
|
Mutual Funds/ |
160449477 |
5.48 |
|
|
Alternate Investment
Funds |
923813 |
0.03 |
|
|
Foreign Portfolio
Investors |
661997904 |
22.62 |
|
|
GOVERNMENT PENSION
FUND GLOBAL |
70163974 |
2.40 |
|
|
KUWAIT INVESTMENT
AUTHORITY FUND (Under different Sub accounts) |
36543409 |
1.25 |
|
|
AMANSA HOLDINGS
PRIVATE LIMITED |
29393000 |
1.00 |
|
|
GOVERNMENT OF
SINGAPORE |
40521249 |
1.38 |
|
|
Financial
Institutions/ Banks |
115112674 |
4.72 |
|
|
LIFE INSURANCE
CORPORATION OF INDIA |
105297950 |
3.60 |
|
|
Insurance
Companies |
35273667 |
1.21 |
|
|
Sub Total B1 |
973757535 |
34.05 |
|
|
B2) Central
Government/ State Government(s)/ President of India |
0 |
0.00 |
|
|
Central
Government/ State Government(s)/ President of India |
2209470 |
0.08 |
|
|
Sub Total B2 |
2209470 |
0.08 |
|
|
B3)
Non-Institutions |
0 |
0.00 |
|
|
Individual share capital
upto INR 0.200 Million |
272756529 |
9.32 |
|
|
Individual share
capital in excess of INR 0.200 Million |
8310239 |
0.28 |
|
|
NBFCs registered
with RBI |
195030 |
0.01 |
|
|
Any Other
(specify) |
146213537 |
5.00 |
|
|
ASSOCIATION OF
PERSONS |
225 |
0.00 |
|
|
Bodies Corporate |
54765894 |
1.87 |
|
|
Clearing Members |
2954058 |
0.10 |
|
|
CORPORATE BODY -
FOREIGN |
1200000 |
0.04 |
|
|
FOREIGN
INSTITUTIONAL INVESTOR |
2384925 |
0.08 |
|
|
Foreign Portfolio
Investors (Category III) |
58308868 |
1.99 |
|
|
LIMITED LIABILITY PARTNERSHIP |
1266343 |
0.04 |
|
|
NRI – Non- Repat |
4866269 |
0.17 |
|
|
NRI – Repat |
7322373 |
0.25 |
|
|
Overseas corporate
bodies |
2000 |
0.00 |
|
|
Trusts |
9687937 |
0.33 |
|
|
Unclaimed or
Suspense or Escrow Account |
1203281 |
0.04 |
|
|
Foreign
Individuals |
8497 |
0.00 |
|
|
IEPF AUTHORITY MCA |
2242867 |
0.08 |
|
|
Sub Total B3 |
427475335 |
14.61 |
|
|
B=B1+B2+B3 |
1403442340 |
48.73 |
BUSINESS DETAILS
|
Line of Business : |
Manufacturer of Medium and Heavy Commercial Vehicle, Light Commercial Vehicles, Power Solutions Systems, Passenger Vehicles Services. [Registered Activity] |
|
|
|
|
Brand Names : |
Not Divulged |
|
|
|
|
Agencies Held : |
Not Divulged |
|
|
|
|
Exports : |
Not Divulged |
|
|
|
|
Imports : |
Not Divulged |
|
|
|
|
Terms : |
Not Divulged |
PRODUCTION STATUS: (NOT AVAILABLE)
GENERAL INFORMATION
|
Suppliers : |
|
|||||||||||||||||||||||||||
|
|
|
|||||||||||||||||||||||||||
|
Customers : |
· Mahindra · Escorts · Avtec · Tata Motors · Tata · John Deere · JCB · FPT, etc. |
|||||||||||||||||||||||||||
|
|
|
|||||||||||||||||||||||||||
|
No. of Employees : |
11,906 [Approximately] |
|||||||||||||||||||||||||||
|
|
|
|||||||||||||||||||||||||||
|
Banker : |
· Bank of America · Bank of Baroda · Canara Bank · Central Bank of India · Citi Bank N A · Deutsche Bank A G · HDFC Bank Limited · ICICI Bank Limited · IDBI Bank Limited · Indian Bank · Punjab National Bank · Standard Chartered Bank · State Bank of India · The Bank of Tokyo - Mitsubishi UFJ Limited · Vijaya Bank |
|||||||||||||||||||||||||||
|
|
|
|||||||||||||||||||||||||||
|
Facilities : |
|
|
Auditors : |
|
|
Name1 : |
M S Krishnaswami and Rajan Chartered Accountants |
|
|
|
|
Name 2 : |
Deloitte Haskins and Sells LLP Chartered Accountants |
|
|
|
|
Cost Auditors : |
|
|
Name : |
Geeyes and Company Cost Accountants |
|
|
|
|
Memberships : |
Not Available |
|
|
|
|
Collaborators : |
Not Available |
|
|
|
|
Holding company : |
Hinduja Automotive Limited, United Kingdom |
|
|
|
|
Holding Company of
Hinduja Automotive Limited, United Kingdom : |
· Hinduja Automotive Limited, United Kingdom · Machen Holdings SA |
|
|
|
|
Holding Company of
Machen Holdings SA: |
Machen Development Corporation, Panama |
|
|
|
|
Holding Company of
Machen Development Corporation, Panama: |
Amas Holdings SA |
|
|
|
|
Subsidiaries : |
· Albonair (India) Private Limited · Ashok Leyland Vehicles Limited (formerly Ashok Leyland Nissan Vehicles Limited) · Ashley Powertrain Limited (formerly Nissan Ashok Leyland Powertrain Limited) · Ashok Leyland Technologies Limited (formerly Nissan Ashok Leyland Technologies Limited) · Albonair GmbH, Germany · Albonair Automotive Technology Co. Limited, China · Ashok Leyland (Nigeria) Limited · Ashok Leyland (UK) Limited (under liquidation) · Gulf Ashley Motor Limited · Optare plc · Optare UK Limited · Optare Group Limited · Jamesstan Investments Limited · Optare Holdings Limited · Optare (Leeds) Limited · East Lancashire Bus Builders Limited · Ashok Leyland (Chile) S.A. · Hinduja Leyland Finance Limited · Hinduja Housing Finance Limited · HLF Services Limited · Global TVS Bus Body Builders Limited · Ashok Leyland (UAE) LLC · Avia Ashok Leyland Motors s.r.o · Avia Trucks UK Limited, Great Britain · Avia Ashok Leyland Rus, Russia · LLC Ashok Leyland Russia · Ashok Leyland West Africa |
|
|
|
|
Fellow subsidiaries
: |
· Hinduja Auto Components Limited · Hinduja Automotive (UK) Limited · Gulf Oil Lubricants India Limited ·
Hinduja Foundries Limited |
|
|
|
|
Associates : |
· Ashley Aviation Limited · Ashok Leyland Defence Systems Limited · Lanka Ashok Leyland PLC · Mangalam Retail Services Limited |
|
|
|
|
Joint Ventures: |
· Ashley Alteams India Limited · Automotive Infotronics Limited (under liquidation) · Ashok Leyland John Deere Construction Equipment Company Private Limited · Ashok Leyland John Deere Construction Equipment Company Private Limited (Along with Gulf Ashley Motor Limited) · Ashok Leyland Vehicles Limited (formerly Ashok Leyland Nissan Vehicles Limited) · AshLey Powertrain Limited (formerly Nissan Ashok Leyland Powertrain Limited) · Nissan Ashok Leyland Powertrain Limited · Nissan Ashok Leyland Technologies Limited (formerly Nissan Ashok Leyland Technologies Limited) |
CAPITAL STRUCTURE
AFTER 21.07.2017
Authorised Capital: INR 35921.000 Million
Issued, Subscribed Capital & Paid-up: INR 2927.104
Million
AS ON: 31.03.2017
Authorised Capital:
|
No. of Shares |
Type |
Value |
Amount |
|
|
|
|
|
|
27856000000 |
Equity Shares |
INR 1/- each |
INR 27856.000 Million |
|
|
|
|
|
Issued, Subscribed Capital:
:
|
No. of Shares |
Type |
Value |
Amount |
|
|
|
|
|
|
2199766829 |
Equity Shares |
INR 1/- each |
INR 2199.767
Million |
|
646314480 |
Issued through Global Depository Receipts |
INR 1/- each |
INR 646.314 Million
|
|
|
|
|
|
|
|
Total |
|
INR 2846.081
Million |
Paid-up Capital:
|
No. of Shares |
Type |
Value |
Amount |
|
|
|
|
|
|
2199562154 |
Equity Shares |
INR 1/- each |
INR 2199.562
Million |
|
646314480 |
Issued through Global Depository Receipts |
INR 1/- each |
INR 646.314
Million |
|
|
Add: Forfeited
shares (amount originally paid up in respect of 760 shares) |
|
INR 0.004 Million |
|
|
|
|
|
|
|
Total |
|
INR 2845.880
Million |
Reconciliation of number
of equity shares subscribed
|
Particulars |
2017 |
|
Balance as at the beginning / end of the year |
2845876634 |
Shares issued in
preceding 5 years
a) The Company had issued and allotted during the year 2011-12, 1330338317 equity shares as fully paid-up bonus shares by utilisation of securities premium reserve in the ratio of 1:1.
b) As on March 31, 2017, there are 352245640 equity shares representing the outstanding Global Depository Receipts (GDRs). The balance GDRs have been converted into equity shares.
Shares held by the Holding Company
Hinduja Automotive Limited, the holding company, holds 1104646899 (2016: 1104646899, 2015: 1104646899) Equity shares and 5486669 (2016: 5486669, 2015: 54,86,669) Global Depository Receipts (GDRs) equivalent to 329200140 (2016: 329200140, 2015: 3292,00140) Equity shares of INR 1 (2016: INR 1, 2015: INR 1) each aggregating to 50.38% (2016: 50.38%, 2015: 50.38%) of the total share capital. Shareholders other than the Holding Company holding more than 5% of the equity share capital
Life Insurance Corporation of India holds 105,298,950 (2016: 128308174, 2015: 187602225) Equity shares of INR 1 (2016: INR 1, 2015: INR 1) each aggregating to 3.70% (2016: 4.51%, 2015: 6.59%).
Rights, preferences and restrictions in respect of equity shares and GDRs issued by the Company
a) The Equity share holders are entitled to receive dividends as and when declared; a right to vote in proportion to holding etc. and their rights, preferences and restrictions are governed by / in terms of their issue under the provisions of the Companies Act, 2013.
b) The rights, preferences and restrictions of the GDR holders are governed by the terms of their issue, and the provisions of the
Companies Act, 2013. Each GDR holder is entitled to receive 60 equity shares [ 2016: 60 equity shares, 2015: 60 equity shares] of INR 1 each, per GDR, and their voting rights can be exercised through the Depository.
Information relating to Employees Stock Option Plan including details of options outstanding as at March 31, 2017 - Refer Note 3.15.
FINANCIAL DATA
[all figures are
in INR Million]
ABRIDGED
BALANCE SHEET [STANDALONE]
|
SOURCES OF FUNDS |
31.03.2017 |
31.03.2016 |
31.03.2015 |
|
I.
EQUITY AND LIABILITIES |
|
|
|
|
(1)Shareholders' Funds |
|
|
|
|
(a) Share Capital |
2845.880 |
2845.880 |
2845.880 |
|
(b) Reserves & Surplus |
58414.796 |
51225.590 |
48341.058 |
|
(c) Money received against share warrants |
0.000 |
0.000 |
0.000 |
|
|
|
|
|
|
(2) Share Application
money pending allotment |
0.000 |
0.000 |
0.000 |
|
Total
Shareholders’ Funds |
61260.676 |
54071.470 |
51186.938 |
|
|
|
|
|
|
(3)
Non-Current Liabilities |
|
|
|
|
(a) Long-term borrowings |
11463.219 |
18210.444 |
25663.361 |
|
(b) Deferred tax liabilities (Net) |
1269.021 |
3291.042 |
5102.669 |
|
(c)
Other long term liabilities |
864.804 |
2034.722 |
20.604 |
|
(d)
long-term provisions |
1325.538 |
1228.065 |
969.175 |
|
Total
Non-current Liabilities |
14922.582 |
24764.273 |
31755.809 |
|
|
|
|
|
|
(4) Current Liabilities |
|
|
|
|
(a)
Short term borrowings |
1986.378 |
250.000 |
250.000 |
|
(b)
Trade payables |
30521.823 |
25626.881 |
28283.187 |
|
(c)
Other current liabilities |
24458.794 |
21134.400 |
19078.508 |
|
(d)
Short-term provisions |
4843.808 |
1890.514 |
2560.460 |
|
Total
Current Liabilities |
61810.803 |
48901.795 |
50172.155 |
|
|
|
|
|
|
(5)
Liability Directly associated with classified as held for sale |
1.500 |
0.000 |
0.000 |
|
|
|
|
|
|
TOTAL |
137995.561 |
127737.538 |
133114.902 |
|
|
|
|
|
|
II.
ASSETS |
|
|
|
|
(1) Non-current assets |
|
|
|
|
(a)
Fixed Assets |
|
|
|
|
(i)
Tangible assets |
46560.963 |
44537.032 |
48824.830 |
|
(ii)
Intangible Assets |
3147.118 |
3382.831 |
3730.699 |
|
(iii)
Capital work-in-progress |
1575.950 |
547.499 |
697.970 |
|
(iv) Intangible assets under development |
482.658 |
211.060 |
503.466 |
|
(b) Non-current
Investments |
20016.831 |
19804.373 |
22403.813 |
|
(c) Deferred tax assets (net) |
626.674 |
743.642 |
0.000 |
|
(d) Long-term Loan
and Advances |
1112.363 |
1349.176 |
9829.176 |
|
(e)
Other Non-current assets |
5876.921 |
5352.429 |
194.996 |
|
Total
Non-Current Assets |
79399.478 |
75928.042 |
86184.950 |
|
|
|
|
|
|
(2) Current assets |
|
|
|
|
(a)
Current investments |
8771.723 |
0.000 |
4084.520 |
|
(b)
Inventories |
25011.167 |
16250.135 |
13985.272 |
|
(c)
Trade receivables |
8599.016 |
12509.495 |
12426.694 |
|
(d)
Cash and cash equivalents |
9119.748 |
15931.314 |
7512.879 |
|
(e)
Short-term loans and advances |
34.646 |
706.005 |
5636.758 |
|
(f)
Other current assets |
5829.783 |
6412.547 |
3283.829 |
|
Total
Current Assets |
57366.083 |
51809.496 |
46929.952 |
|
|
|
|
|
|
(3)
Assets classified as held for sale |
1230.000 |
0.000 |
0.000 |
|
|
|
|
|
|
TOTAL |
137995.561 |
127737.538 |
133114.902 |
PROFIT & LOSS ACCOUNT
|
|
PARTICULARS |
31.03.2017 |
31.03.2016 |
31.03.2015 |
|
|
|
SALES |
|
|
|
|
|
|
|
Revenue from Operations [Net] |
213316.691 |
199929.742 |
135621.836 |
|
|
|
Other Income |
1362.701 |
1176.202 |
1244.713 |
|
|
|
TOTAL |
214679.392 |
201105.944 |
136866.549 |
|
|
|
|
|
|
|
|
Less |
EXPENSES |
|
|
|
|
|
|
|
Cost of Materials Consumed |
130587.020 |
120926.563 |
86266.352 |
|
|
|
Purchases of Stock-in-Trade |
16076.439 |
15312.255 |
13911.872 |
|
|
|
Changes in inventories of finished goods, work-in-progress
and Stock-in-Trade |
(7090.813) |
(4290.214) |
(526.126) |
|
|
|
Employees benefits expense |
15309.350 |
13850.628 |
11840.038 |
|
|
|
Other expenses |
23279.200 |
21027.497 |
13863.363 |
|
|
|
Exceptional Items |
3508.459 |
8152.235 |
(1009.359) |
|
|
|
Excise Duty |
13130.123 |
10556.702 |
0.000 |
|
|
|
Exchange gain/ (Loss) on swap contracts |
(153.974) |
(50.480) |
0.000 |
|
|
|
TOTAL |
194645.804 |
185485.186 |
124346.140 |
|
|
|
|
|
|
|
|
|
PROFIT/
(LOSS) BEFORE INTEREST, TAX, DEPRECIATION AND AMORTISATION |
20033.588 |
15620.758 |
12520.409 |
|
|
|
|
|
|
|
|
|
Less |
FINANCIAL
EXPENSES |
1553.787 |
2476.387 |
3935.075 |
|
|
|
|
|
|
|
|
|
|
PROFIT/
(LOSS) BEFORE TAX, DEPRECIATION AND AMORTISATION |
18479.801 |
13144.371 |
8585.334 |
|
|
|
|
|
|
|
|
|
Less/ Add |
DEPRECIATION/
AMORTISATION |
5178.939 |
4879.004 |
4163.367 |
|
|
|
|
|
|
|
|
|
|
PROFIT/ (LOSS)
BEFORE TAX |
13300.862 |
8265.367 |
4421.967 |
|
|
|
|
|
|
|
|
|
Less |
TAX |
1070.090 |
4369.382 |
1073.907 |
|
|
|
|
|
|
|
|
|
|
PROFIT/ (LOSS)
AFTER TAX |
12230.772 |
3895.985 |
3348.060 |
|
|
|
|
|
|
|
|
|
|
EARNINGS IN
FOREIGN CURRENCY |
|
|
|
|
|
|
|
Export of goods - FOB value |
17107.267 |
20090.328 |
19090.403 |
|
|
|
Interest and dividend |
317.867 |
262.309 |
131.540 |
|
|
|
Others (Includes freight, insurance and commission earned) |
836.841 |
818.423 |
628.963 |
|
|
TOTAL EARNINGS |
18261.975 |
21171.060 |
19850.906 |
|
|
|
|
|
|
|
|
|
|
IMPORTS |
|
|
|
|
|
|
|
Raw Materials and components |
2061.239 |
3201.155 |
3563.042 |
|
|
|
Trading goods and others |
654.474 |
436.390 |
655.540 |
|
|
|
Trading goods and others |
69.389 |
46.488 |
42.760 |
|
|
|
Capital items |
457.236 |
220.213 |
83.978 |
|
|
TOTAL IMPORTS |
3242.338 |
3904.246 |
4345.320 |
|
|
|
|
|
|
|
|
|
|
Earnings/ (Loss)
Per Share (INR) |
4.24 |
1.37 |
1.20 |
|
CURRENT MATURITIES OF LONG TERM DEBT DETAILS
|
PARTICULARS |
31.03.2017 |
31.03.2016 |
31.03.2015 |
|
Current Maturities of Long term debt |
7998.928 |
5689.395 |
7583.915 |
|
|
|
|
|
|
Cash generated from operations |
25023.908 |
21238.534 |
18268.928 |
|
|
|
|
|
|
Net cash from operating activities |
21547.712 |
16829.774 |
17767.038 |
KEY
RATIOS
EFFICIENCY RATIOS
|
PARTICULARS |
31.03.2017 |
31.03.2016 |
31.03.2015 |
|
Average Collection Days (Sundry
Debtors / Income * 365 Days) |
14.71 |
22.84 |
33.44 |
|
|
|
|
|
|
Account Receivables Turnover (Income / Sundry Debtors) |
24.81 |
15.98 |
10.91 |
|
|
|
|
|
|
Average Payment Days (Sundry Creditors / Purchases * 365 Days) |
75.96 |
68.66 |
103.05 |
|
|
|
|
|
|
Inventory Turnover (Operating Income / Inventories) |
0.80 |
0.96 |
0.90 |
|
|
|
|
|
|
Asset Turnover (Operating Income / Net Fixed Assets) |
0.39 |
0.32 |
0.23 |
LEVERAGE RATIOS
|
PARTICULARS |
31.03.2017 |
31.03.2016 |
31.03.2015 |
|
Debt Ratio ((Borrowing
+ Current Liabilities) / Total Assets) |
0.59 |
0.57 |
0.63 |
|
|
|
|
|
|
Debt Equity Ratio (Total Liability / Networth) |
0.35 |
0.45 |
0.65 |
|
|
|
|
|
|
Current Liabilities to Networth (Current Liabilities / Net Worth) |
1.01 |
0.90 |
0.98 |
|
|
|
|
|
|
Fixed Assets to Networth (Net Fixed Assets / Networth) |
0.85 |
0.90 |
1.05 |
|
|
|
|
|
|
Interest Coverage Ratio (PBIT / Financial Charges) |
12.89 |
6.31 |
3.18 |
PROFITABILITY RATIOS
|
PARTICULARS |
|
31.03.2017 |
31.03.2016 |
31.03.2015 |
|
Net Profit Margin ((PAT / Sales) * 100) |
% |
5.73 |
1.95 |
2.47 |
|
|
|
|
|
|
|
Return on Total Assets ((PAT / Total Assets) * 100) |
% |
8.86 |
3.05 |
2.52 |
|
|
|
|
|
|
|
Return on Investment (ROI) ((PAT / Networth) * 100) |
% |
19.97 |
7.21 |
6.54 |
SOLVENCY RATIOS
|
PARTICULARS |
31.03.2017 |
31.03.2016 |
31.03.2015 |
|
Current Ratio (Current
Assets / Current Liabilities) |
0.95 |
1.06 |
0.94 |
|
|
|
|
|
|
Quick Ratio ((Current Assets – Inventories) / Current Liabilities) |
0.54 |
0.73 |
0.66 |
|
|
|
|
|
|
G-Score Ratio Financial (Networth / Total Assets) |
0.44 |
0.42 |
0.38 |
|
|
|
|
|
|
G-Score Ratio Debt (Debts / Equity Capital) |
7.54 |
8.49 |
11.77 |
|
|
|
|
|
|
G-Score Ratio Liquidity (Total Current Assets / Total Current Liabilities) |
0.95 |
1.06 |
0.94 |
Total
Liability = Short-term Debt + Long-term Debt + Current Maturities of Long-term
debts
STOCK
PRICES
|
Face Value |
INR 1.00/- |
|
|
|
|
Market Value |
INR 122.25/- [BSE] |
FINANCIAL ANALYSIS
[all figures are
in Indian Rupees Million]
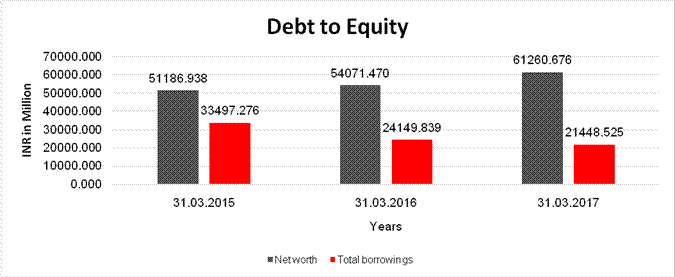
DEBT EQUITY RATIO
|
Particular |
31.03.2015 |
31.03.2016 |
31.03.2017 |
|
|
INR
In Million |
INR
In Million |
INR
In Million |
|
Share Capital |
2845.880 |
2845.880 |
2845.880 |
|
Reserves & Surplus |
48341.058 |
51225.590 |
58414.796 |
|
Share Application money
pending allotment |
0.000 |
0.000 |
0.000 |
|
Net
worth |
51186.938 |
54071.470 |
61260.676 |
|
|
|
|
|
|
long-term borrowings |
25663.361 |
18210.444 |
11463.219 |
|
Short term borrowings |
250.000 |
250.000 |
1986.378 |
|
Current Maturities of Long
term debt |
7583.915 |
5689.395 |
7998.928 |
|
Total
borrowings |
33497.276 |
24149.839 |
21448.525 |
|
Debt/Equity
ratio |
0.654 |
0.447 |
0.350 |
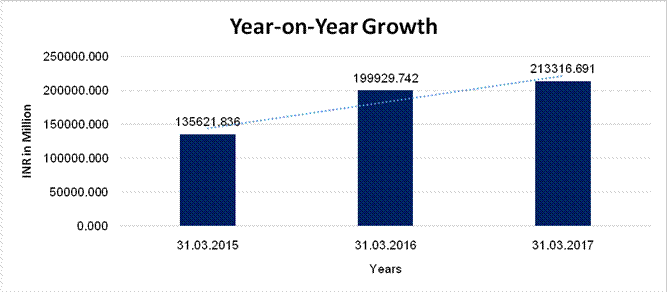
YEAR-ON-YEAR GROWTH
|
Year
on Year Growth |
31.03.2015 |
31.03.2016 |
31.03.2017 |
|
|
INR
In Million |
INR
In Million |
INR
In Million |
|
Sales |
135621.836 |
199929.742 |
213316.691 |
|
|
|
47.417 |
6.696 |
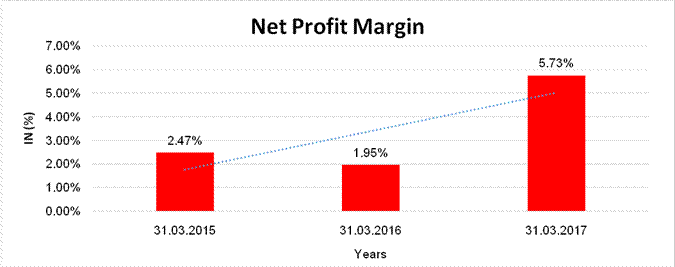
NET PROFIT MARGIN
|
Net
Profit Margin |
31.03.2015 |
31.03.2016 |
31.03.2017 |
|
|
INR
In Million |
INR
In Million |
INR
In Million |
|
Sales |
135621.836 |
199929.742 |
213316.691 |
|
Profit |
3348.060 |
3895.985 |
12230.772 |
|
|
2.47% |
1.95% |
5.73% |
ABRIDGED
BALANCE SHEET [CONSOLIDATED]
|
SOURCES OF FUNDS |
|
31.03.2017 |
31.03.2016 |
|
I.
EQUITY AND LIABILITIES |
|
|
|
|
(1)Shareholders' Funds |
|
|
|
|
(a) Share Capital |
|
2845.880 |
2845.880 |
|
(b) Reserves & Surplus |
|
61083.552 |
49791.134 |
|
(c) Money received against share warrants |
|
0.000 |
0.000 |
|
Minority Interest |
|
5889.910 |
4172.869 |
|
(2) Share
Application money pending allotment |
|
0.000 |
0.000 |
|
Total
Shareholders’ Funds |
|
69819.342 |
56809.883 |
|
|
|
|
|
|
(3)
Non-Current Liabilities |
|
|
|
|
(a) Long-term borrowings |
|
88764.206 |
75271.093 |
|
(b) Deferred tax liabilities (Net) |
|
1269.292 |
3291.000 |
|
(c)
Other long term liabilities |
|
945.639 |
2120.072 |
|
(d)
long-term provisions |
|
1891.593 |
2076.946 |
|
Total
Non-current Liabilities |
|
92870.730 |
82759.111 |
|
|
|
|
|
|
(4) Current Liabilities |
|
|
|
|
(a)
Short term borrowings |
|
17580.111 |
10726.786 |
|
(b)
Trade payables |
|
33853.402 |
27011.207 |
|
(c)
Other current liabilities |
|
46941.315 |
42671.346 |
|
(d)
Short-term provisions |
|
3211.704 |
2008.733 |
|
Total
Current Liabilities |
|
101586.532 |
82418.072 |
|
|
|
|
|
|
(5)
Liability Directly associated with classified as held for sale |
|
1.500 |
0.000 |
|
|
|
|
|
|
TOTAL |
|
264278.104 |
221987.066 |
|
|
|
|
|
|
II.
ASSETS |
|
|
|
|
(1) Non-current assets |
|
|
|
|
(a)
Fixed Assets |
|
|
|
|
(i)
Tangible assets |
|
50722.298 |
46927.353 |
|
(ii)
Intangible Assets |
|
4108.171 |
4431.400 |
|
(iii)
Capital work-in-progress |
|
1959.219 |
662.598 |
|
(iv) Intangible assets under development |
|
482.658 |
211.060 |
|
(b) Non-current
Investments |
|
8452.111 |
7669.664 |
|
(c) Deferred tax assets
(net) |
|
1134.795 |
757.358 |
|
(d) Long-term Loan
and Advances |
|
67800.679 |
59662.951 |
|
(e)
Other Non-current assets |
|
9316.126 |
5436.587 |
|
Goodwill (on consolidation) |
|
11077.398 |
7539.052 |
|
Total
Non-Current Assets |
|
155053.455 |
133298.023 |
|
|
|
|
|
|
(2) Current assets |
|
|
|
|
(a)
Current investments |
|
10881.057 |
2641.131 |
|
(b)
Inventories |
|
27711.187 |
19223.328 |
|
(c)
Trade receivables |
|
10339.205 |
14613.813 |
|
(d)
Cash and cash equivalents |
|
10636.116 |
17165.168 |
|
(e)
Short-term loans and advances |
|
41111.752 |
29393.821 |
|
(f)
Other current assets |
|
7311.925 |
5651.782 |
|
Total
Current Assets |
|
107991.242 |
88689.043 |
|
|
|
|
|
|
(3)
Assets classified as held for sale |
|
1233.407 |
0.000 |
|
|
|
|
|
|
TOTAL |
|
264278.104 |
221987.066 |
PROFIT & LOSS ACCOUNT
|
|
PARTICULARS |
|
31.03.2017 |
31.03.2016 |
|
|
|
SALES |
|
|
|
|
|
|
|
Revenue from Operations |
|
240683.478 |
223195.788 |
|
|
|
Other Income |
|
1306.922 |
1636.207 |
|
|
|
TOTAL |
|
241990.400 |
224831.995 |
|
|
|
|
|
|
|
|
Less |
EXPENSES |
|
|
|
|
|
|
|
Cost of Materials Consumed |
|
139794.687 |
128219.374 |
|
|
|
Purchases of Stock-in-Trade |
|
14278.674 |
16160.334 |
|
|
|
Changes in inventories of finished goods, work-in-progress
and Stock-in-Trade |
|
(6897.442) |
-4641.779 |
|
|
|
Employees benefits expense |
|
19008.807 |
17106.668 |
|
|
|
Other expenses |
|
28370.856 |
25965.145 |
|
|
|
Cost of services
availed |
|
0.000 |
0.000 |
|
|
|
Exceptional items |
|
(246.923) |
4113.734 |
|
|
|
Excise Duty |
|
13188.556 |
10596.766 |
|
|
|
Exchange gain/ (Loss) on swap contracts |
|
(153.974) |
-50.480 |
|
|
|
Share of profit/ (loss) of associates and joint venture |
|
98.650 |
784.912 |
|
|
|
TOTAL |
|
207441.891 |
198254.674 |
|
|
|
|
|
|
|
|
|
PROFIT/
(LOSS) BEFORE INTEREST, TAX, DEPRECIATION AND AMORTISATION |
|
34548.509 |
26577.321 |
|
|
|
|
|
|
|
|
|
Less |
FINANCIAL
EXPENSES |
|
10487.996 |
9250.499 |
|
|
|
|
|
|
|
|
|
|
PROFIT/
(LOSS) BEFORE TAX, DEPRECIATION AND AMORTISATION |
|
24060.513 |
17326.822 |
|
|
|
|
|
|
|
|
|
Less/ Add |
DEPRECIATION/
AMORTISATION |
|
5727.888 |
5239.378 |
|
|
|
|
|
|
|
|
|
|
PROFIT/ (LOSS)
BEFORE TAX |
|
18332.625 |
12087.444 |
|
|
|
|
|
|
|
|
|
Less |
TAX |
|
1961.191 |
4965.714 |
|
|
|
|
|
|
|
|
|
|
PROFIT/ (LOSS) AFTER
TAX BEFORE MINORITY INTEREST FROM CONTINUING OPERATIONS |
|
16371.434 |
7121.730 |
|
|
|
|
|
|
|
|
|
Less |
Profit/ (Loss) from Discounting Operations |
|
(42.331) |
0.000 |
|
|
|
|
|
|
|
|
|
|
PROFIT / (LOSS) FOR
THE YEAR |
|
16329.103 |
7121.730 |
|
|
|
|
|
|
|
|
|
|
Earnings/ (Loss)
Per Share (INR) |
|
|
|
|
|
|
Basic
|
|
5.52 |
2.40 |
|
|
|
Diluted
|
|
5.51 |
2.40 |
|
LEGAL CASES
|
HIGH COURT OF MADRAS |
|
|
Case status: |
Pending |
|
Status of: |
Tax cases 35 of 2015 |
|
Litigants: |
THE STATE OF TAMILNADU V/S TVL ASHOK LEYLAND LIMITED |
|
Pet’s Adv: |
SPL. Govt. Pleader |
|
Res’s Adv: |
IInd Batta with petition |
|
Last Hearing Date: |
Monday, April 17 2017 |
|
Category: |
-- |
LOCAL AGENCY FURTHER INFORMATION
|
Sr. No. |
Check list by
info agents |
Available in
Report (Yes/No) |
|
1 |
Year of establishment |
Yes |
|
2 |
Constitution of the entity -Incorporation
details |
Yes |
|
3 |
Locality of the entity |
Yes |
|
4 |
Premises details |
No |
|
5 |
Buyer visit details |
-- |
|
6 |
Contact numbers |
Yes |
|
7 |
Name of the person contacted |
Yes |
|
8 |
Designation of contact person |
Yes |
|
9 |
Promoter’s background |
Yes |
|
10 |
Date of Birth of Proprietor / Partners / Directors |
No |
|
11 |
Pan Card No. of Proprietor / Partners |
No |
|
12 |
Voter Id Card No. of Proprietor / Partners |
No |
|
13 |
Type of business |
Yes |
|
14 |
Line of Business |
Yes |
|
15 |
Export/import details (if applicable) |
No |
|
16 |
No. of employees |
Yes |
|
17 |
Details of sister concerns |
Yes |
|
18 |
Major suppliers |
No |
|
19 |
Major customers |
No |
|
20 |
Banking Details |
Yes |
|
21 |
Banking facility details |
Yes |
|
22 |
Conduct of the banking account |
-- |
|
23 |
Financials, if provided |
Yes |
|
24 |
Capital in the business |
Yes |
|
25 |
Last accounts filed at ROC, if applicable |
Yes |
|
26 |
Turnover of firm for last three years |
Yes |
|
27 |
Reasons for variation <> 20% |
-- |
|
28 |
Estimation for coming financial year |
No |
|
29 |
Profitability for last three years |
Yes |
|
30 |
Major shareholders, if available |
Yes |
|
31 |
External Agency Rating, if available |
Yes |
|
32 |
Litigations that the firm/promoter
involved in |
Yes |
|
33 |
Market information |
-- |
|
34 |
Payments terms |
No |
|
35 |
Negative Reporting by Auditors in the
Annual Report |
No |
INDEX OF CHARGES
|
SNO |
SRN |
CHARGE ID |
CHARGE HOLDER NAME |
DATE OF CREATION |
DATE OF MODIFICATION |
DATE OF SATISFACTION |
AMOUNT |
ADDRESS |
|
1 |
G07778376 |
10449756 |
SBICAP TRUSTEE
COMPANY LIMITED |
19/09/2013 |
13/07/2016 |
- |
1500000000.0 |
202, MAKER TOWER,
'E', CUFFE PARADE,COLABA,MUMBAIMA400005IN |
|
2 |
C76122829 |
10412488 |
SBICAP TRUSTEE
COMPANY LIMITED |
13/03/2013 |
12/01/2016 |
- |
1500000000.0 |
202, MAKER TOWER,
'E', CUFFE PARADE,COLABA,MUMBAIMH400005IN |
|
3 |
C58794413 |
10377386 |
SBICAP TRUSTEE
COMPANY LIMITED |
25/09/2012 |
10/07/2015 |
- |
1000000000.0 |
202, MAKER TOWER, 'E',
CUFFE PARADE,COLABA,MUMBAIMH400005IN |
|
4 |
C00594507 |
10329292 |
SBICAP TRUSTEE
COMPANY LIMITED |
11/01/2012 |
21/03/2014 |
- |
1500000000.0 |
202, MAKER TOWER,
'E', CUFFE PARADE,COLABA,MUMBAIMH400005IN |
|
5 |
Y10409842 |
90286915 |
STATE BANK OF
INDIA |
18/08/2003 |
22/08/2003 |
- |
250000000.0 |
84 RAJAJI SALAI
MAMADRASTNIN |
|
6 |
Y10409836 |
90286909 |
STATE BANK OF
INDIA |
25/11/2002 |
25/11/2002 |
- |
250000000.0 |
84 RAJAJI SALAI
MAMADRASTNIN |
|
7 |
Y10411958 |
90289031 |
HDFC BANK LTD. |
07/08/2002 |
- |
- |
350000000.0 |
759 ANNA
SALAICHENNAITNIN |
|
8 |
Y10414122 |
90291195 |
HDFC BANK LTD. |
07/08/2002 |
09/01/2004 |
- |
350000000.0 |
759 ANNA
SALAICHENNAITNIN |
|
9 |
Y10410661 |
90287734 |
STATE BANK OF
INDIA |
19/07/2002 |
07/08/2002 |
- |
1000000000.0 |
22 RAJAJI
SALAICHENNAITNIN |
|
10 |
Z00834656 |
80053062 |
STATE BANK OF
INDIA |
17/04/2002 |
- |
- |
50000000.0 |
22 RAJAJI
SALAICHENNAITN600001IN |
UNSECURED LOANS
|
PARTICULARS |
31.03.2017 (INR In Million) |
31.03.2016 (INR In Million) |
|
LONG-TERM BORROWINGS |
|
|
|
External commercial borrowings from banks |
6322.473 |
10588.391 |
|
Interest free sales tax loans |
1089.404 |
1130.750 |
|
|
|
|
|
SHORT TERM BORROWINGS |
|
|
|
Short term loans from banks |
1850.000 |
0.000 |
|
|
|
|
|
Total |
9261.877 |
11719.141 |
COMPANY’S PERFORMANCE
The Commercial Vehicles segment registered a growth of 4.16 percent in the financial year 2016-17 as compared to the same period last year. Medium & Heavy Commercial Vehicles (M&HCVs) grew by 0.04 percent and Light Commercial Vehicles grew by 7.41 percent during the financial year 2016-17 over the same period last year. In effect, the combined effect of economy, industry, segmental behavior, regulations and taxes pulled down medium and heavy commercial vehicle to end the current financial year at the same level as that of previous year.
The Company witnessed an overall 3.3 percent growth in sales (including LCV) during the financial year 2016-17, with total sales of 1,45,066 units as against 1,40,457 units during the previous financial year. Sales of M&HCV increased to 1,13,296 units with a growth of 3.21 percent as compared to 109,762 units during the previous financial year. The market share in M&HCV grew from 31.3 percent to 32.5 percent. Continued slowdown in Middle East owing to depressed oil market, uncertain economic situation in Russian/Ukrainian markets and stagnant market in Srilanka had a restraining effect on Company’s Export volumes. Sales of Light Commercial Vehicle (LCV) have grown 3.5 percent to 31,770 units in 2016-17 as against 30,695 units during the previous financial year.
The Power Solution Business witnessed a growth of 15 percent over the previous year, despite a steep reduction in Harvester requirements and demand remaining moderate for Powergen/Industrial segments. Revenue from Spare Parts saw a tremendous growth of approximately 28 percent as compared to the previous financial year, due to various initiatives undertaken to grow our retail sales.
Highlights of performance are discussed in detail in the Management Discussion and Analysis Report attached as Annexure E to this Report.
AMALGAMATION
During the year, the Board of Directors of the Company at their meeting held on September 14, 2016, approved the draft scheme of amalgamation of Hinduja Foundries Limited (HFL) with the Company and their respective shareholders and creditors, under Sections 391 to 394 of the Companies Act, 1956 subject to regulatory approvals. The Appointed Date for the scheme of amalgamation was October 1, 2016. The intended amalgamation has been approved by the shareholders at the Court Convened Meeting held on January 23, 2017 and through Postal Ballot on January 25, 2017. The Hon’ble National Company Law Tribunal, Chennai Bench (NCLT) which heard the Company’s petition on April 18, 2017 sanctioned the scheme of amalgamation of HFL with the Company and their respective shareholders and creditors. The NCLT Order was filed with the Registrar of Companies, Chennai and the scheme became effective on April 28, 2017.
The Board of Directors of the Company has formed a Committee of Directors comprising of Mr. Dheeraj G Hinduja, Chairman, Mr. Vinod K Dasari, Chief Executive Officer and Managing Director, Mr. D J Balaji Rao and Mr. Sanjay K Asher, Directors as members of the Committee and authorised the Committee to do all such acts, deeds, matters and things as may be necessary for the purpose of giving effect to the Order of NCLT on the scheme of amalgamation of HFL with the Company including but not limited to issue and allotment of the equity shares of the Company to the eligible shareholders of the Transferor Company as on the Record date.
Further to the receipt of noted letter from the designated stock exchange, the Board of Directors of the Company has fixed Wednesday, June 7, 2017 as the ‘Record Date’ for determining the shareholders of Hinduja Foundries Limited (Transferor Company), entitled to receive the equity shares of Ashok Leyland Limited (Transferee Company), under the Scheme of amalgamation sanctioned by NCLT. Consequent to the above, the issued, subscribed and paid-up equity share capital will stand increased from 2,845,876,634 equity shares of `1/- each to 2,926,534,926 equity shares of `1/- each.
Accounting for business combination
The Scheme of amalgamation for the merger of Hinduja Foundries Limited (“the amalgamating company”) with the Company was approved by the Board of Directors in its meeting held on September 14, 2016 with an appointed date of October 01, 2016. The said scheme has been approved by various statutory and regulatory bodies and final order of National Company Law Tribunal (“NCLT”) has been received on April 24, 2017. This common control business combination has been accounted as per the scheme and in accordance with Ind AS 103 “Business Combination” notified under the Companies Act, 2013. Further, in terms of the Scheme, 8,06,58,292 equity shares of INR 1 each of the Company are pending to be issued and allotted as fully paid up to the shareholders of the amalgamating company. This has been included under “Other Equity” and considered in computation of earnings per share (basic and diluted).
Pursuant to the aforesaid Scheme of amalgamation, the authorised equity share capital of the Company stands increased by the authorised equity share capital of the amalgamating company aggregating INR 25,00.000 million (250,00,00,000 equity shares of face value of INR 1 each). The company is further authorised to issue 7,50,00,000 non-convertible redeemable preference shares of INR 100 each aggregating to INR 7500.000 lakhs
Accounting treatment
Accounting treatment The business combination has been accounted by using the Pooling of Interest method in accordance with the said approved Scheme of Amalgamation and Ind AS 103. Accordingly, the Company has recorded all the assets, liabilities and reserves of the amalgamating company at their respective book values as appearing in the their books of account as on October 1, 2016, the details of which are as follows:
The business combination has been accounted by using the Pooling of Interest method in accordance with the said approved Scheme of Amalgamation and Ind AS 103. Accordingly, the Company has recorded all the assets, liabilities and reserves of the amalgamating company at their respective book values as appearing in the their books of account as on October 1, 2016, the details of which are as follows:
|
Particulars |
INR in Million |
|
ASSETS |
|
|
Property, plant and equipment and capital work-in progress |
4522.384 |
|
Non-current investments |
45.533 |
|
Cash and cash equivalents |
11.838 |
|
Trade receivables |
1101.841 |
|
Inventories |
662.868 |
|
Other assets |
1888.816 |
|
|
|
|
LIABILITIES |
|
|
Borrowings |
5140.119 |
|
Trade payables |
1285.052 |
|
Other liabilities and provisions |
542.715 |
|
|
|
|
RESERVES |
|
|
Capital redemption reserve |
33.333 |
|
Securities premium reserve |
5094.891 |
|
General Reserve |
88.925 |
|
Cash flow hedge reserve |
(6.647) |
|
Retained earnings |
(9232.321) |
AWARDS
• Bhandara Plant bagged “Excellent Energy Efficient Unit” and “Innovative Project “Award in the 17th National Award for Excellence in Energy Management 2016 organised by Confederation of Indian Industry.
• Ennore and Hosur 1 Plant bagged Platinum and Gold award at Raipur in NCQC national level competition for best Energy conservation project
and CPPS plant won Merit Award.
• Alwar Plant won Rajasthan state Energy Efficiency award.
MANAGEMENT
DISCUSSION AND ANALYSIS REPORT
A. MARKET
TRENDS
Economy -
India
In the financial year 2016-17 the Indian economy grew at an estimated 7.1%, as per government estimates reported by the Ministry of Statistics & Programme Implementation, slowing from a growth rate of 7.9% reported for FY 2015-16. Slower growth was seen across the year, with the quarter level growth numbers for Q1, Q2 and Q3 being 6.9%, 6.7% and 6.6% for FY 2016-17 as compared to 7.8%, 8.4% and 7.0% for FY 2015-16.
The demonetisation announced in Q3 resulted in a temporary blip in the economic growth, but saw a relatively quick recovery in the following quarter. The manufacturing sector grew at a healthy 7.7% in FY 2016-17, though subdued from the 10.6% levels seen in FY 2015-16. Construction is expected to show a significant uptick in FY 2016-17 at 6.4% as compared to 2.3% in FY 2015-16.
The
farm sector’s growth significantly accelerated to 4.4% this financial year from
0.8% last year. The growth pick-up was seen from Q2 onwards, buoyed by a normal
monsoon and encouraging sowing data. The mining and quarrying sector, which saw
a degrowth in Q1 & Q2 before recovering to 7.5% growth in Q3 FY 2016- 17,
is expected to end at a full year growth of 1.3% for FY 2016-17 as compared to
12.3% for FY 2015-16.
For FY 2017-18, growth is estimated to pick up to 7.4% levels. There is an expectation of stable to slightly positive inflationary pressures due to pick-up in economy as well as impact of seventh pay commission. It is widely expected that GST implementation in FY 2017-18 would auger well for economic growth. Economists estimate potential long term GDP growth impact at 2-4 percentage points attributable to GST.
Agriculture will face a higher base-effect and while initial weather forecasts indicated a low probability of El Nino during the Indian monsoon season, more recent forecasts have seen the risks rise. However, increased government focus (both central and state) on the rural sector and initiatives like improved support prices, agriinsurance schemes, infrastructure investments (including irrigation projects), and higher outlay for rural employment guarantee schemes all indicate a possibility of improved rural incomes, thereby driving a consumption-led growth.
There is a gradual revival being seen in the construction sector. Road laying is picking up pace and so is other construction activity. Coal mining has aggressive mid and long term prospects, given the electricity generation targets set by the central government. While investments are still subdued due to excess capacity across sectors, it is expected that a prolonged period of controlled inflation, a stable government policy and steadily improving percapita income would improve consumption and lead to a more sustained growth in the range of 7.0-8.5%.
ECONOMY -
WORLD
The International Monetary Fund projects the World growth to rise from 3.1% in 2016 to 3.5% in 2017 and further to 3.6% in 2018 as the long awaited cyclical recovery in manufacturing and trade is currently underway with support from buoyant financial markets worldwide. It expects growth to be broad based across the globe with developed economies expected to grow at 2.0% in 2017 (1.7% in 2016) and emerging & developing economies at 4.5% in 2017 (4.1% in 2016).
Among developed economies, United States of America is expected to grow at 2.3% in 2017 (1.6% in 2016), Euro zone is expected to retain 1.7% growth (same as 2016) and Japan at 1.2% in 2017 (1.0% in 2016). Amongst developing and emerging economies, China is expected to grow at 6.6% in 2017 and 6.2% in 2018 (6.7% in 2016), while Middle East (including North Africa and others) and sub-saharan Africa are expected to see a slower
growth at 2.6% in 2017 (3.9% in 2016).
While the growth is expected to be broad-based, factors differ. For the US it is assumed expansionary fiscal policy and real demand picking up, for Europe it is largely improving domestic demand and cyclical recovery post downturn, for Japan it is
stronger exports and for oil exporters of Middle East the factors are mainly growth in non-oil sectors which are not able to fully compensate for fall in growth due to oil exports. Brazil and Russia both are expected to come out of recession.
Amidst this picture, it would be prudent to watch out for headwinds like increasingly inward looking policies across various economies, rate hikes in US and other economies and geopolitical risks. Nonetheless at the current juncture, the economic environment is largely pro-growth.
ECONOMIC PERFORMANCE
Once again it looks Indian economy is going to overtake China and India may end this year with 7.5% plus GDP growth. With normal monsoon expectation, this year we are in for almost all economic indicators showing positive trends. Your Company is also expecting IIP (Index of Industrial Production) giving much improved figures as this index is getting revised by removal of certain items from the index which are no more relevant. With the stable government at Centre and winning major states elections, confidence of Indian business community is showing renewed confidence. Latest survey of The Economic Times is also exhibiting the same sentiments of the market. The stock markets are scaling new peaks. Rupee is becoming stronger day by day against US dollar. Though global markets are still reeling under stagnancy and are not giving growth to the exports, however rise in domestic consumption is the main growth factor.
The retail inflation eased to 2.99% in April 2017 against 5.47% year ago. Government’s focus on improving infrastructure is also being giving big impetus to the growth. Total roads getting added per day has improved from 11km/day (2013-14) to 22km/day (2016- 17) and is set to go up substantially.
UNAUDITED STANDALONE FINANCIAL RESULTS FOR THE QUARTER ENDED
31.12.2017
(INR IN MILLION)
|
Particulars
|
Quarter ended |
Quarter ended |
Half year ended |
|
|
31.12.2017 |
30.09.2017 |
31.12.2017 |
|
|
(Unaudited) |
(Unaudited) |
(Unaudited) |
|
Revenue from operations |
71131.620 |
60488.918 |
178744.404 |
|
Other income |
379.657 |
556.604 |
1320.350 |
|
Total
Income |
71511.277 |
6126.522 |
178064.764 |
|
|
|
|
|
|
Expenditure |
|
|
|
|
Cost of Material consumed |
54064.829 |
34024.412 |
113108.626 |
|
Purchase of stock-in-trade |
5484.256 |
4462.170 |
14296.769 |
|
Change in inventories of finished goods, stock-in-trade
and work-in-process |
(8731179) |
4852.804 |
(3964.185) |
|
Excise duty on sale |
0.000 |
0.000 |
2766.040 |
|
Employee benefit expenses |
4917.685 |
4915.597 |
14275.592 |
|
Finance Costs |
335.257 |
410.243 |
1111.812 |
|
Depreciation and amortization expense |
1350.371 |
1411.354 |
4083.045 |
|
Other expenses |
7511.752 |
6295.966 |
19196.590 |
|
Total Expenses |
64932.971 |
56172.546 |
164876.289 |
|
|
|
|
|
|
Profit before exchange (Loss)/ gain on swap contracts, exceptional items and tax |
6578.306 |
4852.976 |
13188.465 |
|
Exchange (loss)/gain on swap contracts |
(1.942) |
(26.428) |
(55.100) |
|
Profit before exceptional items and tax |
6576.364 |
4826.548 |
13133.366 |
|
Exceptional items |
0.000 |
0.000 |
(55.100) |
|
Profit before tax |
6576.364 |
4826.548 |
13007.673 |
|
Tax expenses |
|
|
|
|
Current tax |
2383.724 |
1795.998 |
4841.868 |
|
Deferred tax |
(304.458) |
(312.047) |
(786.244) |
|
Profit after tax |
4497.098 |
3342.597 |
8952.049 |
|
|
|
|
|
|
Other
Comprehensive Income |
|
|
|
|
A) i. Items that will not be reclassified to Profit or Loss |
(11.250) |
(11.250) |
(33.750) |
|
ii.
Income tax relating to Items that will not be reclassified to Profit or loss |
3.893 |
3.894 |
11.680 |
|
B) i. Items that will be reclassified to Profit or Loss |
206.023 |
(254.486) |
(91.265) |
|
ii.
Income tax relating to Items that will be reclassified to Profit or loss |
(71.300) |
87.757 |
31.585 |
|
Comprehensive Income for the Period |
127.386 |
(174.085) |
(81.750) |
|
|
|
|
|
|
Total Comprehensive Income for the Period |
4624.464 |
3168.512 |
8870.299 |
|
|
|
|
|
|
Paid up equity share capital (Equity share
of face value of INR 1/- each) |
2927.108 |
2926.538 |
2927.108 |
|
|
|
|
|
|
Earnings Per Equity Share (for discontinued and continuing operation) |
|
|
|
|
Basic |
1.54 |
1.14 |
3.06 |
|
Diluted |
1.53 |
1.14 |
3.05 |
CONTINGENT
LIABILITIES:
|
Particulars |
31.03.2017 (INR In Million) |
31.03.2016 (INR In Million) |
|
Claims
against the company not acknowledged as debts (net) |
|
|
|
Sales Tax / VAT |
31222.40 |
2120.159 |
|
Excise duty |
2655.24 |
150.930 |
|
Service Tax |
3700.75 |
305.354 |
|
Customs Duty |
42.73 |
4.095 |
|
Others |
2875.88 |
264.758 |
|
These have been disputed by the Company on account of issues of applicability and classification |
|
|
|
Corporate Guarantees given to others for loans taken by a subsidiary and a joint venture company* |
12563.79 |
1690.585 |
|
· Future cash outflows in respect of the above are determinable only on receipt of judgement / decisions pending with various forums / authorities · * Net of provision of INR 19,236.88 lakhs (as at March 31, 2016: INR Nil; April 1, 2015: INR Nil) against the same. |
||
FIXED ASSETS:
· Land
· Buildings
· Building given on lease
· Plant and equipment
· Plant and equipment given on lease
· Furniture and fittings
· Furniture and fittings given on lease
· Vehicles and aircraft
· Vehicles given on lease
· Office Equipment
· Office Equipment given on lease
· Computer software
·
Technical knowhow
PRESS RELEASES
ASHOK LEYLAND EXPECTS
GST IMPLEMENTATION WILL LEAD TO IMPROVED SALES
19.05.2017
HYDERABAD
Ashok Leyland Ltd, which has consolidated its market share from 22 per cent to 33 per cent over the past six years, expects to sustain the growth momentum across different commercial vehicle business segments.
Showcasing a wide range of commercial vehicles here at Hitex, the Hinduja Group company said the demand for vehicles in some of the CV segments continues to be buoyant and provides momentum for growth.
Anuj Kathuria, President, Global Trucks, Ashok Leyland, said, “The hub and spoke model of transport of goods is likely to gain with the implementation of the GST regime. This will boost the sales of vehicles, driven by requirements in the logistics sector.”
“While last year saw de-growth of about 2 per cent in the medium and heavy commercial vehicles segment to close at about 3,50,000 lakh units, we witnessed growth of about 7 per cent gaining market share. We hope to continue this growth during the year. However, there is a likelihood of the first-half seeing relatively lower growth,” he said.
Referring to the construction and mining sectors, he said these had seen growth of about 25 per cent last year and if indications were anything to go by, they were likely to further sustain growth.
As against a pan-India market share of about 33 per cent, Andhra Pradesh and Telangana account for a market share of 45 per cent for the truck sector, and about 87 per cent in buses, he said.
CUSTOMISATION
Referring to the potential in new applications such as cold storages and cold chains and demand from warehouses in the GST regime, he said, “The company is planning to offer a customised range of its trucks for different applications, making it convenient for buyers. They do not have to buy the chassis from one place and then seek to have the body made somewhere else.”
“Last year we sold more than 1,10,000 units, which includes more than 10,000 units in other markets. To meet the demand in other markets, we are also setting up assembly lines in Kenya and the Ivory Coast. The unit set up in Ras al Khaimah has been doing well,” he said.
Asked about the proposed bus body building unit in Telangana, he said it was in the planning stage.
ASHOK LEYLAND IN EV
PACT WITH SUN MOBILITY
Sun’s Maini to bring
smart-battery tech
CHENNAI, JULY 18,
2017
In a significant step towards embracing the evolving future, commercial vehicle maker Ashok Leyland Ltd. (ALL) has roped in Sun Mobility, a globally recognisable name in the area of electric mobility and clean energy, to provide world standard mobility solutions.
Sun Mobility is promoted by Chetan Maini, founder of Reva, the country’s first electric car maker.
The alliance could not have been formed at any better time. It comes in the wake of an ambitious announcement made by the Centre to shift all the cars sold in India to electric vehicles by 2030.
It is an exclusive partnership between the two for all kinds of electric vehicles.
“We are proud of this partnership and hope to bring several new innovative products to the market at the earliest,’’ said Vinod K. Dasari, CEO and managing director, Ashok Leyland, while addressing the media on Tuesday.
Mr. Maini expressed optimism that the “partnership will help the nation move masses via an efficient, pollution-free and cost-competitive solution for electric mobility.’’
Fielding a range of questions, both insisted that the common goal of the alliance was to bring about operational efficiency in running a vehicle. “The focus will be on how to make the operating environment much better, and keep the operating cost less than that of diesel,’’ said Mr. Dasari.
HINDUJA FOUNDRIES TO
MERGE WITH ASHOK LEYLAND
15.09.2016
CHENNAI:
The Board of automobile component firm Hinduja Foundries Limited has given its nod for amalgamating the company with heavy commercial vehicle maker Ashok subject to regulatory and shareholders’ approval of both the companies.
"At the meeting held today,
the Board of Directors of the company unanimously approved the proposal of
amalgamating Hinduja Foundries Ltd, a Hinduja Group company with Ashok Leyland
subject to various regulatory and shareholders approval of both the
companies," a company statement said.
The Board also approved the exchange ratio on the amalgamation in which one
hundred equity shares of INR 10 each of Hinduja Foundries Ltd will get 40
shares at INR 1 each fully paid of Ashok Leyland Limited
"One Thousand 2008 series GDRs of Hinduja Foundries Ltd will get 133 equity shares of Rs 1 each fully paid of Ashok Leyland," it said.
"One 2016 series GDRs of Hinduja Foundries Ltd will get 4,800 equity
shares of INR 1 each fully paid of Ashok Leyland Ltd," it said.
The proposed date of amalgamation is October one, 2016.
"They welcome Hinduja Foundries into the fold of Ashok Leyland Ltd. The amalgamation will result in operational efficiencies and help realise significant cost synergies," Hinduja Group company and heavy commercial vehicle maker, Ashok Leyland Ltd., Chief Executive Officer and Managing Director, Vinod K Dasari said.
"They are confident that the roll out of the best practices of Ashok
Leyland will benefit Hinduja Foundries Limited While it is a critical supplier
to Ashok Leyland Ltd, it will continue its focus to grow its relationships with
other customers," he said.
"In fact the new arrangement will help in providing a wider range of
solutions to them. There is so much more Hinduja Foundries can do under the new
arrangement," Dasari said in the statement.
THE MOTIVE BEHIND
HINDUJA FOUNDRIES LTD’S ASHOK LEYLAND MERGER
19.09.2016
Hinduja
Foundries Limited survival is vital for Ashok Leyland, which had invested INR
3200.000 million in the firm
Investors of Ashok Leyland Ltd have baulked at the company’s plan to merge with affiliate Hinduja Foundries Ltd.
Gopal Mahadevan, chief financial officer at Hinduja Group flagship Ashok Leyland, defended the move, saying the intent was to bail out one of its key suppliers, which has been mired in operational inefficiency and other challenges. Also, this should be viewed as a “one-off” and Ashok Leyland “has no plans to bankroll” its subsidiaries or make any further acquisitions.
The company, Mahadevan said, will remain steadfast to its core business even as it expects the contribution from its truck business to come down to 40-45% in the next three to five years from 60-65% now because of the cyclical nature of the truck market. But Mahadevan has not been able to calm frayed investor nerves. Ashok Leyland has declined 4.26% to INR 807.500 million since the announcement of the merger. The decline has been far steeper at Hinduja Foundries.
The merger, said analysts, is earnings dilutive for Ashok Leyland and run counter to the strategy the company has been pursuing over the past three years of exiting non-core businesses and loss-making subsidiaries as it sharpens focus on its core business, which includes trucks and buses, defence, after-market and power solutions.
In a research note on 16 September, brokerage CLSA said this merger will raise investor concerns. “Even assuming that the intention is to achieve a turnaround of HF (Hinduja Foundries), we wonder if this could have been achieved without an actual merger into AL (Ashok Leyland).” It said even as the brokerage has been impressed by AL’s turnaround in the past three years and a repeat of the same in HF under AL’s ownership cannot be ruled out, “but still requires a leap of faith”. This event, together with the recent weakness in truck demand, could keep AL’s valuation multiples under pressure. CLSA has a ‘sell’ rating on the stock.
The merger will lead to dilution of 11% in the earnings per share. Of this, while 3% would be on account of equity, remaining 8% would be the impact of losses at Hinduja Foundries, said an analyst at a domestic brokerage, declining to be identified. Hinduja Foundries has accumulated losses of INR 10000.000 million.
“Ashok Leyland will have to fund future losses and capex of Hinduja Foundries, which will be a drain on its cash-flows,” the analyst said.
Hinduja Foundries makes castings, cylinder blocks and heads and other critical parts, and counts Ashok Leyland among its key customers, accounting for more than a third of its revenues. The component firm makes one of the finest products but needs to be a lot more efficient operationally, said Mahadevan.
The merger, he explained, is a logical step as Ashok Leyland had to recoup the investment of INR 3200.000 million it has done and ensure the supplier doesn’t go bust.
“If I want to turn it around, it has to become a part of AL as HFL is not a subsidiary but an associate of AL. It has got a reasonably different style of operation,” Mahadevan said.
The merger will help in bringing down procurement costs and bank loan and become a more stable supplier. “There are huge upsides to it,” Mahadevan said.
CMT REPORT (Corruption, Money Laundering & Terrorism]
The Public Notice information has been collected from various sources
including but not limited to: The Courts, India Prisons Service,
Interpol, etc.
1] INFORMATION ON
DESIGNATED PARTY
No records exist designating subject or any of its beneficial owners,
controlling shareholders or senior officers as terrorist or terrorist
organization or whom notice had been received that all financial transactions
involving their assets have been blocked or convicted, found guilty or against
whom a judgement or order had been entered in a proceedings for violating
money-laundering, anti-corruption or bribery or international economic or
anti-terrorism sanction laws or whose assets were seized, blocked, frozen or
ordered forfeited for violation of money laundering or international
anti-terrorism laws.
2] Court Declaration:
No records exist to suggest that subject is
or was the subject of any formal or informal allegations, prosecutions or other
official proceeding for making any prohibited payments or other improper
payments to government officials for engaging in prohibited transactions or
with designated parties.
3] Asset Declaration:
No records exist to suggest that the property or assets of the subject
are derived from criminal conduct or a prohibited transaction.
4] Record on Financial
Crime:
Charges or conviction
registered against subject: None
5] Records on Violation of
Anti-Corruption Laws:
Charges or
investigation registered against subject: None
6] Records on Int’l
Anti-Money Laundering Laws/Standards:
Charges or
investigation registered against subject: None
7] Criminal Records
No
available information exist that suggest that subject or any of its principals
have been formally charged or convicted by a competent governmental authority
for any financial crime or under any formal investigation by a competent
government authority for any violation of anti-corruption laws or international
anti-money laundering laws or standard.
8] Affiliation with
Government:
No record
exists to suggest that any director or indirect owners, controlling
shareholders, director, officer or employee of the company is a government
official or a family member or close business associate of a Government
official.
9] Compensation Package:
Our market
survey revealed that the amount of compensation sought by the subject is fair
and reasonable and comparable to compensation paid to others for similar
services.
10] Press Report:
No press reports / filings exists on
the subject.
CORPORATE GOVERNANCE
MIRA INFORM as part of its Due Diligence do provide comments on
Corporate Governance to identify management and governance. These factors often
have been predictive and in some cases have created vulnerabilities to credit deterioration.
Our Governance Assessment focuses principally on the interactions
between a company’s management, its Board of Directors, Shareholders and other
financial stakeholders
CONTRAVENTION
Subject is not known to have contravened any existing local laws,
regulations or policies that prohibit, restrict or otherwise affect the terms
and conditions that could be included in the agreement with the subject.
FOREIGN EXCHANGE RATES
|
Currency |
Unit
|
INR |
|
US Dollar |
1 |
INR 64.03 |
|
UK Pound |
1 |
INR 90.40 |
|
Euro |
1 |
INR 79.73 |
INFORMATION DETAILS
|
Information
Gathered by: |
SHK |
|
|
|
|
Analysis Done
by: |
PRY |
|
|
|
|
Report Prepared
by: |
ARC |
SCORE FACTORS
|
DEMERIT POINTS |
|
|
|
--BANK CHARGES |
YES/NO |
YES |
|
--LITIGATION |
YES/NO |
YES |
|
--OTHER ADVERSE INFORMATION |
YES/NO |
NO |
|
MERIT POINTS |
|
|
|
--SOLE DISTRIBUTORSHIP |
YES/NO |
NO |
|
--EXPORT ACTIVITIES |
YES/NO |
NO |
|
--AFFILIATION |
YES/NO |
YES |
|
--LISTED |
YES/NO |
YES |
|
--OTHER MERIT FACTORS |
YES/NO |
YES |
RATING EXPLANATIONS
|
Credit Rating |
Explanation |
Rating Comments |
|
A+ |
Low Risk |
Business dealings permissible with low
risk of default |
|
A |
Acceptable Risk |
Business dealings permissible with
moderate risk of default |
|
B |
Medium Risk |
Business dealings permissible on a regular
monitoring basis |
|
C |
Medium High Risk |
Business dealings permissible preferably
on secured basis |
|
D |
High Risk |
Business dealing not recommended or on
secured terms only |
|
NB |
New Business |
No recommendation can be done due to
business in infancy stage |
NB is stated where there is insufficient information to facilitate rating. However, it is not be considered as unfavorable.
This score serves as a reference to assess
SC’s credit risk and to set the amount of credit to be extended. It is
calculated from a composite of weighted scores obtained from each of the major
sections of this report. The assessed factors are as follows:
·
Financial
condition covering various ratios
·
Company
background and operations size
·
Promoters
/ Management background
·
Payment
record
·
Litigation
against the subject
·
Industry
scenario / competitor analysis
·
Supplier
/ Customer / Banker review (wherever available)
This report is issued at
your request without any risk and responsibility on the part of MIRA INFORM
PRIVATE LIMITED (MIPL) or its officials.