|
|
|


MIRA INFORM REPORT
|
Report No. : |
489810 |
|
Report Date : |
08.02.2018 |
IDENTIFICATION DETAILS
|
Name : |
BRICK O’CLOCK SL |
|
|
|
|
Registered Office : |
C/ Emisora, 20. - Pozuelo De Alarcon - 28224 - Madrid |
|
|
|
|
Country : |
Spain |
|
|
|
|
Financials (as on) : |
2016 |
|
|
|
|
Date of Incorporation : |
04.02.2008 |
|
|
|
|
Legal Form : |
Private company |
|
|
|
|
Line of Business : |
Other construction installation |
|
|
|
|
No. of Employees : |
100 [2016] |
RATING & COMMENTS
(Mira Inform has adopted New Rating mechanism w.e.f. 23rd
January 2017)
|
MIRA’s Rating : |
C |
|
Credit Rating |
Explanation |
Rating Comments |
|
C |
Medium High Risk |
Business dealings permissible preferably
on secured basis |
|
Maximum Credit Limit : |
Euro 305.000 |
|
|
|
|
Status : |
Moderate |
|
|
|
|
Payment Behaviour : |
Slow |
|
|
|
|
Litigation : |
Clear |
NOTES :
Any query related to this report can be made
on e-mail : infodept@mirainform.com
while quoting report number, name and date.
ECGC Country Risk Classification List
|
Country Name |
Previous Rating (30.06.2017) |
Current Rating (30.09.2017) |
|
Spain |
A1 |
A1 |
|
Risk Category |
ECGC
Classification |
|
Insignificant |
A1 |
|
Low Risk |
A2 |
|
Moderately Low Risk |
B1 |
|
Moderate Risk |
B2 |
|
Moderately High Risk |
C1 |
|
High Risk |
C2 |
|
Very High Risk |
D |
SPAIN - ECONOMIC OVERVIEW
After experiencing a prolonged recession in the wake of the global financial crisis that began in 2008, in 2017 Spain marked the fourth full year of positive economic growth in ten years, largely due to increased private consumption. At the onset of the financial crisis, Spain's GDP contracted by 3.7% in 2009, ending a 16-year growth trend, and continued contracting through most of 2013. In that year, the government successfully shored up struggling banks - exposed to the collapse of Spain's depressed real estate and construction sectors - and in January 2014 completed an EU-funded restructuring and recapitalization program for its financial sector.
Until 2014, credit contraction in the private sector, fiscal austerity, and high unemployment weighed on domestic consumption and investment. The unemployment rate rose from a low of about 8% in 2007 to more than 26% in 2013, but labor reforms prompted a modest reduction to 17% in 2017. High unemployment has strained Spain's public finances, as spending on social benefits increased while tax revenues fell. Spain’s budget deficit peaked at 11.4% of GDP in 2010, but Spain gradually reduced the deficit to about 3.3% of GDP in 2017. Public debt has increased substantially – from 60.1% of GDP in 2010 to nearly 96.7% in 2017.
Exports were resilient throughout the economic downturn and helped to bring Spain's current account into surplus in 2013 for the first time since 1986, where it remained through 2016. Rising labor productivity and an internal devaluation resulting from moderating labor costs and lower inflation have helped to improve foreign investor interest in the economy and positive FDI flows have been restored.
Political gridlock after the national elections in December
2015 and June 2016 and ensuing government formation process constrained the
caretaker government’s ability to implement needed labor, pension, health care,
tax, and education reforms— in 2016. The European Commission criticized Spain’s
2016 budget for easing austerity measures and for its alleged overly optimistic
growth and deficit projections. Spain’s borrowing costs are dramatically lower
since their peak in mid-2012, and with the recent uptick in economic activity,
inflation has reappeared, at 2% per year.
|
Source
: CIA |
EXECUTIVE
SUMMARY
|
|
|
|
|
|
Name: |
BRICK
O'CLOCK SL |
|
NIF
/ Fiscal code: |
B85343721 |
|
Status: |
ACTIVE |
|
Incorporation
Date: |
04/02/2008 |
|
Register Data |
Register
Section 8 Sheet 454935 |
|
Last Publication in BORME: |
04/07/2017
[Revocations] |
|
Last
Published Account Deposit: |
2016 |
|
Share
Capital: |
60.000 |
|
|
|
|
Localization: |
C/
EMISORA, 20. - POZUELO DE ALARCON - 28224 - MADRID |
|
Telephone - Fax - Email - Website: |
Telephone. 916 658 902 Email. info@brickoclock.es
Website. www.brickoclock.es |
|
Number
of Branches |
1 |
|
|
|
|
Activity: |
|
|
NACE: |
4329
- Other construction installation |
|
Registered
Trademarks: |
|
|
Audited
/ Opinion: |
Si
/ |
|
Tenders
and Awards: |
1
for a total cost of 118.353,92 |
|
Subsidies: |
0
for a total cost of 0 |
|
Quality
Certificate: |
No |
|
|
|
|
Payment
Behaviour: |
Slow
|
|
Prospects: |
Consolidation |
|
Industry
situation: |
Maturity |
|
|
|
|
Defaults, Legal Claims and
Insolvency Proceedings : |
|
|
|
|
|
|
|
Number |
Amount
(€) |
Most
Recent Entry |
|
Insolvency
Proceedings, Bankruptcy and Suspension of Payments |
|
Unpublished |
--- |
--- |
|
Defaults
on debt with Financial Institutions and Large Companies |
|
None |
--- |
--- |
|
Judicial
Claims (Notices, Executive Proceedings, Attachments, Auctions, Bad Debt) |
|
6 |
0 |
--- |
|
Proceedings
heard by the Civil Court |
|
4 |
0 |
--- |
|
Proceedings
heard by the Labour Court |
|
1 |
0 |
--- |
|
|
|
Partners: |
|
|
|
GRUPO
AVINTIA SL |
100
% |
|
|
Shares: |
3 |
|
|
Other
Links: |
23 |
|
|
No.
of Active Corporate Bodies: |
SINGLE
ADMINISTRATOR 1 |
|
|
Ratios |
2016 |
2015 |
Change |
|
|
Nº
of employees: |
100 |
|
|
|
|
|
|
|
Guarantees: |
|
|
Properties
Registered: |
Company
NO, Administrator NO |
|
Financing
/ Guarantee Sources : |
Sources
YES, Guarantees YES |
|
|
|
|
|
|
|
INVESTIGATION
SUMMARY |
|
|
The
subject was incorporated in 2008 and is engaged in the support and completion
of some specific services demanded by building companies and retailers. It
operates at the national level. There are some incidences against the subject
listed in the consulted sources. Having the above-mentioned into
consideration, we recommend doing a follow up. |
|
|
Interviewed
Person: |
|
|
Enquiry Details |
|
|
|
Identification
|
|
|
Social Denomination: |
BRICK O'CLOCK SL |
|
NIF / Fiscal code: |
B85343721 |
|
Corporate Status: |
ACTIVE |
|
Start of activity: |
2008 |
|
Registered Office: |
C/ EMISORA, 20. |
|
Locality: |
POZUELO DE ALARCON |
|
Province: |
MADRID |
|
Postal Code: |
28224 |
|
Telephone: |
916 658 902 |
|
Fax: |
916 014 602 |
|
Website: |
www.brickoclock.es |
|
Email: |
info@brickoclock.es |
|
Interviewed Person: |
The information in this
report has been gathered through indirect sources due to the refusal of the
company's responsible people to collaborate. |
|
|
|
|
Branch
Offices
|
|
|
|
|
|
Address |
Postal Code |
City |
Province |
|
CALLE BUENOS AIRES 3 |
35002 |
PALMAS DE GRAN CANARIA (LAS) |
LAS PALMAS |
|
Activity
|
|
|
NACE: |
4329 |
|
Corporate Purpose: |
The subject is engaged in
the building maintenance services, as well as schools and hospitals, both in the
state and private sector. |
|
Additional Information: |
Support and completion of
some specific services demanded by building companies and retailers. |
|
Additional Address: |
The Registered Office, office
and premises are located at the heading address. |
|
Franchise: |
No |
|
Import / export: |
DOES NOT IMPORT / DOES NOT
EXPORT |
|
Future Perspective: |
Consolidation |
|
Industry situation: |
Maturity |
|
|
|
|
Number
of Employees
|
|
|
|
|
|
|
Year |
No. of employees |
Established |
Incidentals |
|
|
|
2016 |
100 |
|
|
|
The data of employees is
from the latest available financial statements. Failing that, are estimates
data calculated by statistical methods
|
Chronological
Summary
|
|||
|
|
|
|
|
|
|
Year |
Act |
|
|
|
2008 |
Appointments/ Re-elections (2) Company Formation (1) Declaration of
Sole Propietorship (1) |
|
|
|
2009 |
Accounts deposit (year 2008) Appointments/ Re-elections (1) |
|
|
|
2010 |
Accounts deposit (year 2009) |
|
|
|
2011 |
Appointments/ Re-elections (4) Cessations/ Resignations/ Reversals (1)
Change of Social Purpose (1) |
|
|
|
2012 |
Accounts deposit (year 2010, 2011) Appointments/ Re-elections (2) |
|
|
|
2013 |
Accounts deposit (year 2012) Appointments/ Re-elections (7)
Cessations/ Resignations/ Reversals (1) |
|
|
|
2014 |
Accounts deposit (year 2013) Appointments/ Re-elections (1) |
|
|
|
2015 |
Accounts deposit (year 2014) Appointments/ Re-elections (5)
Cessations/ Resignations/ Reversals (2) |
|
|
|
2016 |
Accounts deposit (year 2015) Appointments/ Re-elections (9)
Cessations/ Resignations/ Reversals (3) Change of Social address (1) |
|
|
|
2017 |
Accounts deposit (year 2016) Cessations/ Resignations/ Reversals (1) |
|
|
Main
Historic Changes
|
|||
|
|
|
|
|
|
Concept |
Publication |
Act |
Date |
|
Corporate Purpose Changes: |
A.- LA CONTRATACION, EXPLOTACION, GESTION ADMINISTRACION, PROMOCION,
CONSTRUCCION, EJECUCION, CONSERVACION Y ENAJENACION DE TODA CLASE DE OBRA
PUBLICA O PRIVADA |
Company Formation |
28/02/2008 |
|
|
|
|
|
|
Breakdown
of Owners' Equity
|
|
|
Registered Capital: |
60.000 |
|
Paid up capital: |
60.000 |
|
|
|
|
Updated Evolution of the Subscribed and Paid-in Capital |
|||||
|
|
|
|
|
|
|
|
|
|||||
|
|
|
|
|
|
|
|
Publishing Date |
Registration Type |
Capital Subscribed |
Paid up capital |
Underwritten result |
Disbursed Result |
|
18/02/2008 |
Company Formation |
60.000 |
60.000 |
60.000 |
60.000 |
|
|
|
|
|
|
|
|
Active
Social Bodies
|
|
|
|
|
|
Post published |
Social Body's Name |
Appointment Date |
Other Positions in this Company |
|
SINGLE PARTNER |
AVINTIA PROYECTOS Y CONSTRUCCIONES SL |
18/02/2008 |
1 |
|
SINGLE ADMINISTRATOR |
GRUPO AVINTIA SL |
08/03/2011 |
1 |
|
COMBINED PROXY |
MENDOZA MARTINEZ ANTONIO |
06/07/2016 |
4 |
|
|
PEREZ RAMOS JOSE |
06/07/2016 |
11 |
|
|
ORTIZ BLANCO JOSE |
06/07/2016 |
6 |
|
|
YANEL MONTESINOS AGUSTIN |
06/07/2016 |
7 |
|
|
DIAZ PINDADO ISABEL |
06/07/2016 |
2 |
|
JOINT ATTORNEY |
AMIGO GOMEZ LUIS JOSE |
14/12/2016 |
2 |
|
|
DE SOTO CALDERON JUAN LORENZO |
20/05/2013 |
1 |
|
JOINT ATTORNEY/COMBINED PROXY |
DIAZ GRANDE-CABALLERO PABLO-EUGENIO |
06/07/2016 |
1 |
|
|
MORAL LUQUE SALVADOR |
02/06/2016 |
1 |
|
|
BOMBIN SANTOS JESUS MANUEL |
09/02/2016 |
1 |
|
|
NISA GONZALEZ FRANCISCO |
05/08/2013 |
1 |
|
|
HERNANDEZ SANZ FERNANDO |
05/08/2013 |
1 |
|
PROXY |
VALLEJO RUIZ ANTONIO MARIA |
28/11/2016 |
1 |
|
|
ROJAS DIAZ JUAN CARLOS |
28/01/2015 |
6 |
|
|
ALVAREZ ARRIBAS SANTIAGO |
28/01/2015 |
1 |
|
|
SAZ BALLESTEROS ANGEL |
28/01/2015 |
1 |
|
|
ALVAREZ RODRIGUEZ SERGIO |
27/01/2015 |
1 |
|
REPRESENTATIVE |
MARTIN JIMENEZ ANTONIO |
08/03/2011 |
2 |
|
ACCOUNTS' AUDITOR / HOLDER |
PRICEWATERHOUSECOOPERS AUDITORES SL |
09/04/2015 |
2 |
|
|
|
|
|
|
Historical
Social Bodies
|
|
|
|
|
|
Social Body's Name |
Post published |
End Date |
Other Positions in this Company |
|
AMIGO GOMEZ LUIS JOSE |
JOINT ATTORNEY/COMBINED PROXY |
14/12/2016 |
2 |
|
DIAZ PINDADO ISABEL |
JOINT ATTORNEY |
06/07/2016 |
2 |
|
FARO LUQUE JOSE MANUEL |
JOINT ATTORNEY/COMBINED PROXY |
26/06/2017 |
1 |
|
GARCIA ACEVEDO ALONSO JESUS |
PROXY |
02/06/2016 |
6 |
|
|
COMBINED PROXY |
08/03/2011 |
|
|
|
JOINT ATTORNEY/COMBINED PROXY |
09/03/2012 |
|
|
|
JOINT ATTORNEY/COMBINED PROXY |
20/05/2013 |
|
|
|
JOINT ATTORNEY/COMBINED PROXY |
30/07/2014 |
|
|
|
JOINT ATTORNEY/COMBINED PROXY |
02/06/2016 |
|
|
MARTIN JIMENEZ ANTONIO |
SINGLE ADMINISTRATOR |
08/03/2011 |
2 |
|
MENDOZA MARTINEZ ANTONIO |
COMBINED PROXY |
09/02/2016 |
4 |
|
|
COMBINED PROXY |
02/06/2016 |
|
|
|
COMBINED PROXY |
06/07/2016 |
|
|
ORTIZ BLANCO JOSE |
PROXY |
20/05/2013 |
6 |
|
|
PROXY |
31/05/2016 |
|
|
|
PROXY |
02/06/2016 |
|
|
|
COMBINED PROXY |
06/07/2016 |
|
|
|
JOINT ATTORNEY/COMBINED PROXY |
30/07/2014 |
|
|
PEREA LOPEZ JOSE MANUEL |
JOINT ATTORNEY/COMBINED PROXY |
27/01/2015 |
1 |
|
PEREZ RAMOS JOSE |
PROXY |
30/07/2014 |
11 |
|
|
PROXY |
31/05/2016 |
|
|
|
PROXY |
02/06/2016 |
|
|
|
COMBINED PROXY |
08/03/2011 |
|
|
|
COMBINED PROXY |
20/05/2013 |
|
|
|
COMBINED PROXY |
20/05/2013 |
|
|
|
COMBINED PROXY |
06/07/2016 |
|
|
|
JOINT ATTORNEY/COMBINED PROXY |
09/03/2012 |
|
|
|
JOINT ATTORNEY/COMBINED PROXY |
20/05/2013 |
|
|
|
JOINT ATTORNEY/COMBINED PROXY |
05/08/2013 |
|
|
PRICEWATERHOUSECOOPERS AUDITORES SL |
ACCOUNTS' AUDITOR / HOLDER |
09/04/2015 |
2 |
|
ROJAS DIAZ JUAN CARLOS |
PROXY |
28/01/2015 |
6 |
|
|
PROXY |
28/01/2015 |
|
|
|
COMBINED PROXY |
20/05/2013 |
|
|
|
COMBINED PROXY |
05/08/2013 |
|
|
|
JOINT ATTORNEY/COMBINED PROXY |
28/01/2015 |
|
|
SEPTIEN DEL CASTILLO LUIS |
PROXY |
27/01/2015 |
1 |
|
TORRES ISACH RAMON FRANCISCO |
PROXY |
08/03/2016 |
1 |
|
YANEL MONTESINOS AGUSTIN |
PROXY |
08/03/2011 |
7 |
|
|
PROXY |
20/05/2013 |
|
|
|
JOINT ATTORNEY |
31/05/2016 |
|
|
|
JOINT ATTORNEY |
06/07/2016 |
|
|
|
COMBINED PROXY |
20/05/2013 |
|
|
|
JOINT ATTORNEY/COMBINED PROXY |
14/04/2016 |
|
|
|
|
|
|
|
Executive
board
|
||
|
|
|
|
|
Post |
NIF |
Name |
|
FINANCIAL DIRECTOR |
|
FERNANDO PEREZ |
|
MANAGING DIRECTOR |
|
AGUSTIN YANEL MONTESINOS |
|
|
|
|
|
Defaults, Legal Claims and Insolvency Proceedings |
|
|
|
|
Section enabling assessment of the degree of compliance of the company queried with its payment obligations. It provides information on the existence and nature of all stages of Insolvency and Legal Proceedings published with reference to the Company in the country's various Official Bulletins and national newspapers, as well Defaults Registered in the main national credit bureaus (ASNEF Industrial and RAI ).
Chronological
summary
|
|
|
Number
of Publications |
Amount
(€) |
Start
date |
End
date |
|
Insolvency
Proceedings, Bankruptcy and Suspension of Payments |
|
Unpublished |
--- |
--- |
--- |
|
Request/Declaration |
|
0 |
--- |
date |
|
|
Proceedings |
|
--- |
--- |
|
--- |
|
Resolution |
|
--- |
--- |
|
--- |
|
Defaults
on debt with Financial Institutions and Large Companies |
Bank
and Commercial Delinquency |
None |
0 |
|
|
|
Status:
Friendly |
|
--- |
|
|
|
|
Status:
Pre-Litigation |
|
--- |
|
|
|
|
Status:
Litigation |
|
--- |
|
|
|
|
Status:
Non-performing |
|
--- |
|
|
|
|
Status:
insolvency proceedings, bankruptcy and suspension of payments |
|
--- |
|
|
|
|
Other
status |
|
--- |
|
|
|
|
Legal
and Administrative Proceedings |
|
6 |
--- |
02/11/2016 |
15/11/2017 |
|
Notices
of defaults and enforcement |
|
6 |
--- |
|
--- |
|
Seizures |
|
--- |
--- |
|
--- |
|
Auctions |
|
--- |
--- |
|
--- |
|
Declarations
of insolvency and bad debt |
|
--- |
--- |
|
--- |
|
Proceedings
heard by the Civil Court |
|
4 |
--- |
08/11/2013 |
13/11/2017 |
|
Proceedings
heard by the Labour Court |
|
1 |
--- |
03/06/2016 |
03/06/2016 |
Basis for scoring
|
Positive Factors |
Adverse Factors |
|
|
Presents significant legal proceedings. Debts resulting from non-payment
to Public Administrations or from lawsuits filed by individuals before the
Courts of the different jurisdictions have been published in the Official
Gazettes. However, these legal proceedings are at the stages that precede the
execution stage and that do not affect the assets or content rights or
economic value of the entity. BRICK O'CLOCK SL has a tight level of Financial Autonomy. The Internal
Funds of the entity represent the 5.98% of the total amount of funding
sources. The current debt represents a 94.02 % of the financial structure. In
principle, a decrease in this ratio would indicate an improvement in the
short-term financial situation. The company denotes a special dependence short-term financing which, a
priori, could cause problems of short-term solvency. Long-term solvency. The real assets of the company are found in
levels, which in principle, does not provide a strong guarantee through real
goods against third parties when returning its long-term obligations. |
Probability
of default
|
|
|
|
|
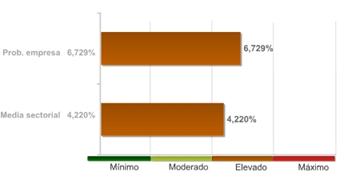
> Estimated Probability
of Default for the next 12 months: 6.729 %
|
Sector
in which comparison is carried out: 432 Electrical,
plumbing and other construction installation activities |
|
|
Relative
Position:
|
The
company's comparative analysis with the rest of the companies that comprise the
sector, shows the company holds a better position with regard to the
probability of non-compliance.
The
probability of the company's non-compliance with its payment obligations within
deadlines estimated by our qualifications models is 6,729%.
In
the event they fail to comply with the payment, the seriousness of the loss
will depend on factors such as the promptness of the commencement of the
charging management, the existence of executive documents which match the credit
or the existence of guarantees and free debt assets under the name of the
debtor. Therefore, the probability of non-compliance should not be solely
interpreted as the total loss of the owed amount.
Recommended
commercial credit
|
|
|
|
|
Favourable until 305.000 € (Guideline value
of outstanding commercial balance that recommends be awarded to or maintained
with the company queried)
|
Result of query submitted to the
R.A.I. (Spanish Bad Debt Register) on |
|
|
LEGAL
CLAIMS
|
|
Summary
of Judicial Claims |
|
|
|
|
|
|
|
|
||
|
|
|
Not
published |
|
|
|
|
Not
published |
|
|
|
|
||
|
|
|
Not
published |
|
|
|
|
Not
published |
|
|
|
|
Not
published |
|
|
|
|
6
Legal Claims whose amounts have not been published |
|
|
|
|
||
|
|
|
4
Legal Claims for a total cost of 13.738,00 E |
|
|
|
|
Not
published |
|
|
|
|
||
|
|
|
1
Incidence the amount of which has not been published |
|
|
Incidences
Detailed |
|
Incidences
with the Local Administration |
|
|
|
Last
Published Stage: |
EXECUTION
NOTIFICATION |
|
Record
Number: |
20176509061LU06L000221 |
|
Requested
by: |
ADMINISTRACION
LOCAL |
|
Published
domicile: |
(DESCONOCIDA) |
|
Source: |
B.O.E.
Nº279, 2017 SUPLEMENTO 1 PAGINA 7461 |
|
|
|
Last
Published Stage: |
EXECUTION
NOTIFICATION |
|
Requested
by: |
ADMINISTRACION
LOCAL |
|
Published
domicile: |
(DESCONOCIDA) |
|
Source: |
B.O.E.
Nº257, 2017 SUPLEMENTO 1 PAGINA 7757 |
|
|
|
Last
Published Stage: |
EXECUTION
NOTIFICATION |
|
Requested
by: |
ADMINISTRACION
LOCAL |
|
Published
domicile: |
(DESCONOCIDA) |
|
Source: |
B.O.E.
Nº107, 2017 SUPLEMENTO 1 PAGINA 13987 |
|
|
|
Last
Published Stage: |
EXECUTION
NOTIFICATION |
|
Record
Number: |
ET201662379039313 |
|
Requested
by: |
ADMINISTRACION
LOCAL |
|
Published
domicile: |
(DESCONOCIDA) |
|
Source: |
B.O.E.
Nº51, 2017 SUPLEMENTO 1 PAGINA 5023 |
|
|
|
Last
Published Stage: |
EXECUTION
NOTIFICATION |
|
Requested
by: |
ADMINISTRACION
LOCAL |
|
Published
domicile: |
(DESCONOCIDA) |
|
Source: |
B.O.E.
Nº307, 2016 SUPLEMENTO 1 PAGINA 4134 |
|
|
|
Last
Published Stage: |
SEIZURE |
|
Record
Number: |
16301070913 |
|
Requested
by: |
ADMINISTRACION
LOCAL |
|
Published
domicile: |
(DESCONOCIDA) |
|
Source: |
B.O.E.
Nº273, 2016 SUPLEMENTO 1 PAGINA 14149 |
|
Procedures
by the Civil Procedural Law 1/2000 |
|
|
|
Last
Published Stage: |
SENTENCE |
|
Record
Number: |
133/2017 |
|
Requested
by: |
CASILDO
VELARDO LOPEZ |
|
Published
domicile: |
MADRID |
|
Source: |
BOLETIN
OFICIAL DE LA COMUNIDAD DE MADRID Nº288, 2017 PAGINA 225 |
|
|
|
Last
Published Stage: |
SENTENCE |
|
Record
Number: |
406/2016 |
|
Amount
of the incidence: |
1.098,24
E |
|
Requested
by: |
CASILDO
VELARDO LOPEZ |
|
Published
domicile: |
MADRID |
|
Source: |
BOLETIN
OFICIAL DE LA COMUNIDAD DE MADRID Nº169, 2017 PAGINA 234 |
|
|
|
Last
Published Stage: |
SENTENCE |
|
Record
Number: |
529/2013 |
|
Amount
of the incidence: |
12.639,78
E |
|
Requested
by: |
TOMAS
HERRERA SANTOS, DOMINGO AMADOR SESMERO, ANGE |
|
Published
domicile: |
TOLEDO |
|
Source: |
B.O.P.
TOLEDO Nº9, 2014 PAGINA 2 |
|
|
|
Last
Published Stage: |
COURT
SUMMONS |
|
Record
Number: |
1027/2012 |
|
Requested
by: |
VARIOS
DEMANDANTES |
|
Published
domicile: |
MALAGA |
|
Source: |
B.O.P.
MALAGA Nº75, 2014 SUPLEMENTO 1 PAGINA 59 |
|
Guarantees |
|
|
|
References
|
|
|
|
|
|
|
Clients |
|
|
|
Name |
NIF |
Telephone |
|
|
|
DIANOVA |
|
|
|
|
|
GESTILAR |
|
|
|
|
|
SUPROGESA |
|
|
|
|
|
ARJUSA |
|
|
|
|
|
URBACESA |
|
|
|
|
Link
List
|
|
BELONGS TO THE
ADMINISTRATION BOARD OF: |
1 Entities |
|
HAS IN ITS ADMINISTRATION
BOARD TO: |
1 Entities |
|
IS RELATED WITH: |
21 Entities |
|
PARTICIPATES IN: |
3 Entities |
|
SHAREHOLDERS: |
1 Entities |
> Shareholders
|
Relationship |
Entity |
Province |
Shareholding stake |
|
SHAREHOLDERS |
GRUPO AVINTIA SL |
MADRID |
100 |
|
|
PLANET NEIBUR SL |
MADRID |
100 |
|
PARTICIPATES IN |
UNION TEMPORAL DE EMPRESAS
CEMENTERIO |
|
95 |
|
|
BRICK COLOMBIA SAS |
|
50 |
> Other relationships
|
Relationship |
Entity |
Province |
Shareholding stake |
|
IS RELATED WITH |
| | |
|
|
|
|
AVINTIA DESARROLLOS
HOTELEROS SL |
MADRID |
|
|
|
AVINTIA EMPRESAS SL |
MADRID |
|
|
|
UNION TEMPORAL DE EMPRESAS
COLEGIO NOBELIS |
|
|
|
|
UNION TEMPORAL DE EMPRESAS
CORDOBA |
|
|
|
|
UNION TEMPORAL DE EMPRESAS
FRANCOS |
|
|
|
|
UNION TEMPORAL DE EMPRESAS
MIR1 |
|
|
|
|
UNION TEMPORAL DE EMPRESAS
AVINTIA RUESMA RIVAS |
|
|
|
|
CONSERTUM CONSULTORIA Y
DESARROLLO INMOBILIARIO INTEGRAL SL |
MADRID |
|
|
|
AVINTIA INTERNATIONAL SL |
MADRID |
|
|
|
PRADO VALDEBEBAS |
|
|
|
|
AELCA DESARROLLOS
INMOBILIARIOS SL |
MADRID |
|
|
|
UNION TEMPORAL DE EMPRESAS
CANET BERENGUER |
|
|
|
|
UNION TEMPORAL DE EMPRESAS
LEGATEC |
|
|
|
|
UNION TEMPORAL DE EMPRESAS
PRADO VALDEBEBAS |
|
|
|
|
UNION TEMPORAL DE EMPRESAS
RESIDENCIA MIRASIERRA |
|
|
|
|
AVINTIA RACING SL |
MADRID |
|
|
|
ADH ISLANTILLA SL |
MADRID |
|
|
|
AVINFORMA SERVICIOS
INFORMATICOS SL |
MADRID |
|
|
|
AVINTIA PROYECTOS Y
CONSTRUCCIONES SL |
MADRID |
|
|
|
AELCA DESARROLLOS
INMOBILIARIOS SL |
MADRID |
|
|
IS RELATED WITH |
AVINTIA INFRAESTRUCTURAS
SA |
MADRID |
|
|
HAS IN ITS ADMINISTRATION
BOARD TO |
GRUPO AVINTIA SL |
MADRID |
|
|
BELONGS TO THE
ADMINISTRATION BOARD OF |
PLANET NEIBUR SL |
MADRID |
|
|
|
|
|
|
|
Turnover
|
|
|
Total Sales 2016 |
29.073.845 |
The sales data is from the
latest available financial statements. Failing that, are estimates data
calculated by statistical methods.
|
Estimated
Balance
|
|
2017 ESTIMATED FIGURES: -NON-CURRENT
ASSETS 318.000 Euro/s -CURRENT ASSETS 18.940.000 Euro/s -NET EQUITY
13.893.000 Euro/s -NON-CURRENT LIABILITIES 0 Euro/s -CURRENT LIABILITIES
18.107.000 Euro/s -TOTAL ASSETS AND LIABILITIES 19.258.000 Euro/s -SALES
32.000.000 Euro/s |
|
Financial
Accounts and Balance Sheets
|
|
|
|
|
|
Ejercicio |
Tipo
de Cuentas Anuales |
Fecha
Presentacion |
|
2016 |
Normales |
October
2017 |
|
2015 |
Normales |
June
2016 |
|
2014 |
Normales |
September
2015 |
|
2013 |
Normales |
September
2014 |
|
2012 |
Normales |
December
2013 |
|
2011 |
Normales |
September
2012 |
|
2010 |
Normales |
January
2012 |
|
2009 |
Normales |
October
2010 |
|
2008 |
Normales |
October
2009 |
The data in the report regarding
the last Company Accounts submitted by the company is taken from the TRADE
REGISTER serving the region in which the company's address is located
31/12/2016
>
Normal format Balance in accordance with the New Accounting Plan 2007
Information corresponding to the
fiscal year 2016 2015 2014 2013 2012 is taken from
information submitted to the TRADE REGISTER. Data corresponding to fiscal years
before 2016 2015 2014 2013 2012 has been compiled
based on the equivalence criteria stipulated in Act JUS/206/2009. Where the
provisions of the Act did not establish relevant equivalence criteria. To view
details on the methodology.
|
|
ORIGINAL |
ORIGINAL |
ORIGINAL |
ORIGINAL |
ORIGINAL |
|
|
Assets |
2016 |
2015 |
2014 |
2013 |
2012 |
|
|
A)
NON-CURRENT ASSETS: 11000 |
289.239,00 |
216.977,00 |
397.815,00 |
140.565,00 |
96.037,00 |
|
|
I. Intangible fixed assets : 11100 |
83.614,00 |
54.732,00 |
85.400,00 |
57.838,00 |
0,00 |
|
|
1. Development: 11110 |
0,00 |
0,00 |
0,00 |
0,00 |
0,00 |
|
|
2. Concessions: 11120 |
0,00 |
0,00 |
0,00 |
0,00 |
0,00 |
|
|
3. Patents, licencing, trade marks and
similar: 11130 |
0,00 |
0,00 |
0,00 |
0,00 |
0,00 |
|
|
4. Goodwill: 11140 |
0,00 |
0,00 |
0,00 |
0,00 |
0,00 |
|
|
5. IT applications: 11150 |
83.614,00 |
54.732,00 |
85.400,00 |
57.838,00 |
0,00 |
|
|
6. Investigation: 11160 |
0,00 |
0,00 |
0,00 |
0,00 |
0,00 |
|
|
7. Intellectual property: 11180 |
0,00 |
0,00 |
0,00 |
0,00 |
0,00 |
|
|
8. Greenhouse gas emission allowance:
11190 |
0,00 |
0,00 |
0,00 |
0,00 |
0,00 |
|
|
9. Other intangible fixed assets. :
11170 |
0,00 |
0,00 |
0,00 |
0,00 |
0,00 |
|
|
II. Tangible fixed assets : 11200 |
189.320,00 |
139.224,00 |
96.949,00 |
82.422,00 |
95.732,00 |
|
|
1. Land and buildings: 11210 |
0,00 |
0,00 |
0,00 |
0,00 |
0,00 |
|
|
2. Technical installations and other
tangible fixed assets: 11220 |
189.320,00 |
139.224,00 |
96.949,00 |
82.422,00 |
95.732,00 |
|
|
3. Tangible asset in progress and
advances: 11230 |
0,00 |
0,00 |
0,00 |
0,00 |
0,00 |
|
|
III. Real estate investment: 11300 |
0,00 |
0,00 |
0,00 |
0,00 |
0,00 |
|
|
1. Land: 11310 |
0,00 |
0,00 |
0,00 |
0,00 |
0,00 |
|
|
2. Buildings: 11320 |
0,00 |
0,00 |
0,00 |
0,00 |
0,00 |
|
|
IV. Long-term investments in Group companies and associates :
11400 |
16.000,00 |
0,00 |
0,00 |
0,00 |
0,00 |
|
|
1. Equity instruments: 11410 |
16.000,00 |
0,00 |
0,00 |
0,00 |
0,00 |
|
|
2. Credits to businesses: 11420 |
0,00 |
0,00 |
0,00 |
0,00 |
0,00 |
|
|
3. Debt securities: 11430 |
0,00 |
0,00 |
0,00 |
0,00 |
0,00 |
|
|
4. Derivatives : 11440 |
0,00 |
0,00 |
0,00 |
0,00 |
0,00 |
|
|
5. Other financial assets : 11450 |
0,00 |
0,00 |
0,00 |
0,00 |
0,00 |
|
|
6. Other investments: 11460 |
0,00 |
0,00 |
0,00 |
0,00 |
0,00 |
|
|
V. Long-term financial investments: 11500 |
305,00 |
305,00 |
305,00 |
305,00 |
305,00 |
|
|
1. Equity instruments: 11510 |
0,00 |
0,00 |
0,00 |
0,00 |
0,00 |
|
|
2. Credits to third parties : 11520 |
0,00 |
0,00 |
0,00 |
0,00 |
0,00 |
|
|
3. Debt securities: 11530 |
0,00 |
0,00 |
0,00 |
0,00 |
0,00 |
|
|
4. Derivatives : 11540 |
0,00 |
0,00 |
0,00 |
0,00 |
0,00 |
|
|
5. Other financial assets : 11550 |
305,00 |
305,00 |
305,00 |
305,00 |
305,00 |
|
|
6. Other investments: 11560 |
0,00 |
0,00 |
0,00 |
0,00 |
0,00 |
|
|
VII. Non-current trade debts : 11700 |
0,00 |
0,00 |
0,00 |
0,00 |
0,00 |
|
|
VI. Assets for deferred tax : 11600 |
0,00 |
22.716,00 |
215.161,00 |
0,00 |
0,00 |
|
|
B)
CURRENT ASSETS: 12000 |
17.208.030,00 |
12.805.475,00 |
6.765.419,00 |
5.792.532,00 |
4.091.111,00 |
|
|
I. Non-current assets held for sale : 12100 |
0,00 |
0,00 |
0,00 |
0,00 |
0,00 |
|
|
II. Stocks: 12200 |
286.994,00 |
335.231,00 |
64.390,00 |
40.379,00 |
23.073,00 |
|
|
1. Commercial: 12210 |
0,00 |
0,00 |
0,00 |
14.000,00 |
12.951,00 |
|
|
2. Primary material and other supplies:
12220 |
286.994,00 |
335.231,00 |
19.829,00 |
324,00 |
0,00 |
|
|
a) Long-term primary
material and other supplies: 12221 |
0,00 |
0,00 |
0,00 |
0,00 |
0,00 |
|
|
b) Short-term primary
material and other supplies: 12222 |
286.994,00 |
0,00 |
0,00 |
0,00 |
0,00 |
|
|
3. Work in progress: 12230 |
0,00 |
0,00 |
0,00 |
0,00 |
0,00 |
|
|
a) Of long-term
production cycle : 12231 |
0,00 |
0,00 |
0,00 |
0,00 |
0,00 |
|
|
b) Of short-term
production cycle : 12232 |
0,00 |
0,00 |
0,00 |
0,00 |
0,00 |
|
|
4. Finished goods: 12240 |
0,00 |
0,00 |
0,00 |
0,00 |
0,00 |
|
|
a) Of long-term
production cycle : 12241 |
0,00 |
0,00 |
0,00 |
0,00 |
0,00 |
|
|
b) Of short-term
production cycle : 12242 |
0,00 |
0,00 |
0,00 |
0,00 |
0,00 |
|
|
5. By-products, residues and recycled
materials: 12250 |
0,00 |
0,00 |
17.647,00 |
1.619,00 |
0,00 |
|
|
6. Advances to suppliers: 12260 |
0,00 |
0,00 |
26.914,00 |
24.436,00 |
10.122,00 |
|
|
III. Trade debtors and others receivable accounts: 12300 |
15.837.822,00 |
11.081.757,00 |
5.403.664,00 |
4.653.136,00 |
3.407.899,00 |
|
|
1. Trade debtors / accounts receivable:
12310 |
7.392.930,00 |
7.935.224,00 |
3.194.930,00 |
3.485.994,00 |
3.363.455,00 |
|
|
a) Long-term
receivables from sales and services supplied : 12311 |
0,00 |
0,00 |
0,00 |
0,00 |
0,00 |
|
|
b) Customers for
sales and provisions of services : 12312 |
7.392.930,00 |
7.935.224,00 |
3.194.930,00 |
3.485.994,00 |
3.363.455,00 |
|
|
2. Customers, Group companies and associates
: 12320 |
8.443.068,00 |
3.094.706,00 |
2.200.995,00 |
1.117.280,00 |
0,00 |
|
|
3. Other accounts receivable: 12330 |
0,00 |
0,00 |
0,00 |
0,00 |
0,00 |
|
|
4. Personnel: 12340 |
1.824,00 |
1.319,00 |
7.721,00 |
5.761,00 |
555,00 |
|
|
5. Assets for deferred tax: 12350 |
0,00 |
0,00 |
0,00 |
0,00 |
0,00 |
|
|
6. Other debtors, including tax and social
security: 12360 |
0,00 |
50.508,00 |
18,00 |
44.100,00 |
43.890,00 |
|
|
7. Called up share capital: 12370 |
0,00 |
0,00 |
0,00 |
0,00 |
0,00 |
|
|
IV. Short-term investments in Group companies and associates:
12400 |
0,00 |
0,00 |
0,00 |
0,00 |
0,00 |
|
|
1. Equity instruments: 12410 |
0,00 |
0,00 |
0,00 |
0,00 |
0,00 |
|
|
2. Credits to businesses: 12420 |
0,00 |
0,00 |
0,00 |
0,00 |
0,00 |
|
|
3. Debt securities: 12430 |
0,00 |
0,00 |
0,00 |
0,00 |
0,00 |
|
|
4. Derivatives : 12440 |
0,00 |
0,00 |
0,00 |
0,00 |
0,00 |
|
|
5. Other financial assets : 12450 |
0,00 |
0,00 |
0,00 |
0,00 |
0,00 |
|
|
6. Other investments: 12460 |
0,00 |
0,00 |
0,00 |
0,00 |
0,00 |
|
|
V. Short-term financial investments : 12500 |
16.636,00 |
7.261,00 |
6.091,00 |
12.057,00 |
8.374,00 |
|
|
1. Equity instruments: 12510 |
0,00 |
0,00 |
0,00 |
0,00 |
7.874,00 |
|
|
2. Credits to businesses: 12520 |
0,00 |
0,00 |
0,00 |
0,00 |
0,00 |
|
|
3. Debt securities: 12530 |
0,00 |
500,00 |
500,00 |
500,00 |
500,00 |
|
|
4. Derivatives : 12540 |
0,00 |
0,00 |
0,00 |
0,00 |
0,00 |
|
|
5. Other financial assets : 12550 |
16.636,00 |
6.761,00 |
5.591,00 |
11.557,00 |
0,00 |
|
|
6. Other investments: 12560 |
0,00 |
0,00 |
0,00 |
0,00 |
0,00 |
|
|
VI. Short-term accruals: 12600 |
0,00 |
0,00 |
0,00 |
0,00 |
0,00 |
|
|
VII. Cash and other equivalent liquid assets : 12700 |
1.066.578,00 |
1.381.226,00 |
1.291.274,00 |
1.086.961,00 |
651.765,00 |
|
|
1. Treasury: 12710 |
1.066.578,00 |
1.381.226,00 |
1.291.274,00 |
1.086.961,00 |
651.765,00 |
|
|
2. Other equivalent liquid assets:
12720 |
0,00 |
0,00 |
0,00 |
0,00 |
0,00 |
|
|
TOTAL
ASSETS (A + B) : 10000 |
17.497.269,00 |
13.022.452,00 |
7.163.234,00 |
5.933.097,00 |
4.187.148,00 |
|
|
|
ORIGINAL |
ORIGINAL |
ORIGINAL |
ORIGINAL |
ORIGINAL |
|
|
Liabilities
and Net Worth |
2016 |
2015 |
2014 |
2013 |
2012 |
|
|
A)
NET WORTH: 20000 |
1.046.472,00 |
592.907,00 |
104.914,00 |
661.834,00 |
654.228,00 |
|
|
A-1) Shareholders' equity: 21000 |
1.046.472,00 |
592.907,00 |
104.914,00 |
661.834,00 |
654.228,00 |
|
|
I. Capital: 21100 |
60.000,00 |
60.000,00 |
60.000,00 |
60.000,00 |
60.000,00 |
|
|
1. Registered capital : 21110 |
60.000,00 |
60.000,00 |
60.000,00 |
60.000,00 |
60.000,00 |
|
|
2. (Uncalled capital): 21120 |
0,00 |
0,00 |
0,00 |
0,00 |
0,00 |
|
|
II. Share premium: 21200 |
0,00 |
0,00 |
0,00 |
0,00 |
0,00 |
|
|
III. Reserves: 21300 |
601.834,00 |
601.834,00 |
601.834,00 |
594.228,00 |
591.096,00 |
|
|
1. Legal and statutory: 21310 |
12.000,00 |
12.000,00 |
12.000,00 |
12.000,00 |
12.000,00 |
|
|
2. Other reserves: 21320 |
589.834,00 |
589.834,00 |
589.834,00 |
582.228,00 |
579.096,00 |
|
|
3. Revaluation reserves: 21330 |
0,00 |
0,00 |
0,00 |
0,00 |
0,00 |
|
|
2. Capitalisation Reserves: 21350 |
0,00 |
0,00 |
0,00 |
0,00 |
0,00 |
|
|
IV. (Common stock equity): 21400 |
0,00 |
0,00 |
0,00 |
0,00 |
0,00 |
|
|
V. Results from previous periods: 21500 |
-68.878,00 |
-556.920,00 |
0,00 |
0,00 |
0,00 |
|
|
1. Brought forward: 21510 |
0,00 |
0,00 |
0,00 |
0,00 |
0,00 |
|
|
2. (Negative results from previous
periods): 21520 |
-68.878,00 |
-556.920,00 |
0,00 |
0,00 |
0,00 |
|
|
VI. Other shareholders' contributions: 21600 |
0,00 |
0,00 |
0,00 |
0,00 |
0,00 |
|
|
VII. Result of the period: 21700 |
564.216,00 |
487.993,00 |
-556.920,00 |
7.606,00 |
3.132,00 |
|
|
VIII. (Interim dividend): 21800 |
-110.700,00 |
0,00 |
0,00 |
0,00 |
0,00 |
|
|
IX. Other net worth instruments: 21900 |
0,00 |
0,00 |
0,00 |
0,00 |
0,00 |
|
|
A-2) Adjustments due to changes in value: 22000 |
0,00 |
0,00 |
0,00 |
0,00 |
0,00 |
|
|
I. Financial assets held for sale: 22100 |
0,00 |
0,00 |
0,00 |
0,00 |
0,00 |
|
|
II. Hedge operations: 22200 |
0,00 |
0,00 |
0,00 |
0,00 |
0,00 |
|
|
III. Linked non-current assets and liabilities held for sale :
22300 |
0,00 |
0,00 |
0,00 |
0,00 |
0,00 |
|
|
IV. Exchange rate difference: 22400 |
0,00 |
0,00 |
0,00 |
0,00 |
0,00 |
|
|
V. Other: 22500 |
0,00 |
0,00 |
0,00 |
0,00 |
0,00 |
|
|
A-3) Received subsidies, donations and legacies: 23000 |
0,00 |
0,00 |
0,00 |
0,00 |
0,00 |
|
|
B)
NON-CURRENT LIABILITIES: 31000 |
0,00 |
0,00 |
1.974,00 |
1.974,00 |
10.222,00 |
|
|
I. Long-term provisions: 31100 |
0,00 |
0,00 |
0,00 |
0,00 |
0,00 |
|
|
1. Long-term employee benefits liability:
31110 |
0,00 |
0,00 |
0,00 |
0,00 |
0,00 |
|
|
2. Environmental actions: 31120 |
0,00 |
0,00 |
0,00 |
0,00 |
0,00 |
|
|
3. Restructuring provisions: 31130 |
0,00 |
0,00 |
0,00 |
0,00 |
0,00 |
|
|
4. Other provisions: 31140 |
0,00 |
0,00 |
0,00 |
0,00 |
0,00 |
|
|
II Long-term creditors: 31200 |
0,00 |
0,00 |
1.974,00 |
1.974,00 |
10.222,00 |
|
|
1. Liabilities and other securities:
31210 |
0,00 |
0,00 |
0,00 |
0,00 |
0,00 |
|
|
2. Amounts owed to credit institutions:
31220 |
0,00 |
0,00 |
0,00 |
0,00 |
0,00 |
|
|
3. Creditors from financial leasing:
31230 |
0,00 |
0,00 |
1.974,00 |
1.974,00 |
10.222,00 |
|
|
4. Derivatives : 31240 |
0,00 |
0,00 |
0,00 |
0,00 |
0,00 |
|
|
5. Other financial liabilities :
31250 |
0,00 |
0,00 |
0,00 |
0,00 |
0,00 |
|
|
III. Long-term debts with Group companies and associates:
31300 |
0,00 |
0,00 |
0,00 |
0,00 |
0,00 |
|
|
IV. Liabilities for deferred tax: 31400 |
0,00 |
0,00 |
0,00 |
0,00 |
0,00 |
|
|
V. Long-term accruals: 31500 |
0,00 |
0,00 |
0,00 |
0,00 |
0,00 |
|
|
VI. Non-current trade creditors : 31600 |
0,00 |
0,00 |
0,00 |
0,00 |
0,00 |
|
|
VII. Special long-term debts : 31700 |
0,00 |
0,00 |
0,00 |
0,00 |
0,00 |
|
|
C)
CURRENT LIABILITIES : 32000 |
16.450.797,00 |
12.429.545,00 |
7.056.346,00 |
5.269.290,00 |
3.522.698,00 |
|
|
I. Liabilities linked to non-current assets held for sale:
32100 |
0,00 |
0,00 |
0,00 |
0,00 |
0,00 |
|
|
II. Short-term provisions: 32200 |
0,00 |
1.109,00 |
1.109,00 |
4.204,00 |
6.706,00 |
|
|
1. Provisions from greenhouse gas emission
allowance: 32210 |
0,00 |
0,00 |
0,00 |
0,00 |
0,00 |
|
|
2. Other provisions: 32220 |
0,00 |
1.109,00 |
1.109,00 |
4.204,00 |
0,00 |
|
|
III. Short-term creditors : 32300 |
119.640,00 |
0,00 |
657,00 |
7.921,00 |
7.261,00 |
|
|
1. Liabilities and other securities:
32310 |
0,00 |
0,00 |
0,00 |
0,00 |
0,00 |
|
|
2. Amounts owed to credit institutions:
32320 |
119.640,00 |
0,00 |
0,00 |
0,00 |
0,00 |
|
|
3. Creditors from financial leasing:
32330 |
0,00 |
0,00 |
657,00 |
7.921,00 |
7.261,00 |
|
|
4. Derivatives : 32340 |
0,00 |
0,00 |
0,00 |
0,00 |
0,00 |
|
|
5. Other financial liabilities :
32350 |
0,00 |
0,00 |
0,00 |
0,00 |
0,00 |
|
|
IV. Short-term debts with Group companies and associates:
32400 |
2.609.506,00 |
1.017.563,00 |
19.065,00 |
17.702,00 |
20.425,00 |
|
|
V. Trade creditors and other accounts payable: 32500 |
13.721.651,00 |
11.410.873,00 |
7.035.515,00 |
5.239.463,00 |
3.488.306,00 |
|
|
1. Suppliers: 32510 |
5.672.650,00 |
3.515.318,00 |
3.516.970,00 |
2.271.754,00 |
721.532,00 |
|
|
a) Long-term debts :
32511 |
0,00 |
0,00 |
0,00 |
0,00 |
0,00 |
|
|
b) Short-term debts :
32512 |
5.672.650,00 |
3.515.318,00 |
3.516.970,00 |
2.271.754,00 |
721.532,00 |
|
|
2. Suppliers, Group companies and
associates: 32520 |
1.161.296,00 |
456.148,00 |
0,00 |
353.755,00 |
201.932,00 |
|
|
3. Other creditors: 32530 |
5.688.779,00 |
5.815.756,00 |
2.998.687,00 |
2.378.178,00 |
2.331.415,00 |
|
|
4. Personnel (remuneration due):
32540 |
1.918,00 |
9.134,00 |
0,00 |
0,00 |
1.578,00 |
|
|
5. Liabilities for current tax:
32550 |
0,00 |
0,00 |
0,00 |
7.053,00 |
1.280,00 |
|
|
6. Other accounts payable to Public
Administrations.: 32560 |
527.832,00 |
467.825,00 |
130.647,00 |
67.885,00 |
69.731,00 |
|
|
7. Advances from clients: 32570 |
669.176,00 |
1.146.692,00 |
389.211,00 |
160.838,00 |
160.838,00 |
|
|
VI. Short-term accruals: 32600 |
0,00 |
0,00 |
0,00 |
0,00 |
0,00 |
|
|
VII. Special short-term debts : 32700 |
0,00 |
0,00 |
0,00 |
0,00 |
0,00 |
|
|
TOTAL
NET WORTH AND LIABILITIES (A + B + C) : 30000 |
17.497.269,00 |
13.022.452,00 |
7.163.234,00 |
5.933.097,00 |
4.187.148,00 |
|
|
|
ORIGINAL |
ORIGINAL |
ORIGINAL |
ORIGINAL |
ORIGINAL |
|
|
Profit
and Loss |
2016 |
2015 |
2014 |
2013 |
2012 |
|
|
1.
Net turnover: 40100 |
29.073.845,00 |
18.586.484,00 |
13.628.609,00 |
10.173.695,00 |
8.532.676,00 |
|
|
a) Sales: 40110 |
11.178.897,00 |
9.498.438,00 |
8.195.556,00 |
5.794.669,00 |
5.268.410,00 |
|
|
b) Rendering of services: 40120 |
17.894.948,00 |
9.088.046,00 |
5.433.053,00 |
4.379.025,00 |
3.264.266,00 |
|
|
c) Income of financial nature of holding companies: 40130 |
0,00 |
0,00 |
0,00 |
0,00 |
0,00 |
|
|
2.
Changes in stocks of finished goods and work in progress: 40200 |
0,00 |
-17.647,00 |
16.029,00 |
1.619,00 |
-1.895,00 |
|
|
3.
Works carried out by the company for its assets: 40300 |
0,00 |
0,00 |
0,00 |
0,00 |
0,00 |
|
|
4.
Supplies : 40400 |
-20.517.738,00 |
-12.930.045,00 |
-10.847.327,00 |
-7.474.796,00 |
-5.922.223,00 |
|
|
a) Stock consumption: 40410 |
0,00 |
0,00 |
0,00 |
0,00 |
0,00 |
|
|
b) Consumption of raw materials and miscellaneous consumable
ones: 40420 |
-2.350.175,00 |
-1.694.585,00 |
-1.380.725,00 |
-884.053,00 |
-624.406,00 |
|
|
c) Works carried out by other companies: 40430 |
-18.167.563,00 |
-11.235.460,00 |
-9.466.602,00 |
-6.590.744,00 |
-5.297.817,00 |
|
|
d) Impairment of stock, primary material and other supplies:
40440 |
0,00 |
0,00 |
0,00 |
0,00 |
0,00 |
|
|
5.
Other operating income: 40500 |
9.178,00 |
11.116,00 |
53.043,00 |
36.275,00 |
0,00 |
|
|
a) Auxiliary income and other from current management:
40510 |
9.178,00 |
11.116,00 |
53.043,00 |
36.275,00 |
0,00 |
|
|
b) Operation subsidies included in the Period's
result: 40520 |
0,00 |
0,00 |
0,00 |
0,00 |
0,00 |
|
|
6.
Personnel costs: 40600 |
-4.585.047,00 |
-2.977.091,00 |
-2.217.841,00 |
-1.968.283,00 |
-1.634.477,00 |
|
|
a) Wages, salaries et al.: 40610 |
-3.203.478,00 |
-2.058.356,00 |
-1.569.851,00 |
-1.422.259,00 |
-1.186.571,00 |
|
|
b) Social security costs: 40620 |
-1.381.569,00 |
-918.735,00 |
-647.990,00 |
-546.024,00 |
-447.906,00 |
|
|
c) Provisions : 40630 |
0,00 |
0,00 |
0,00 |
0,00 |
0,00 |
|
|
7.
Other operating costs: 40700 |
-3.097.322,00 |
-1.920.012,00 |
-1.337.464,00 |
-717.591,00 |
-941.256,00 |
|
|
a) External services: 40710 |
-2.757.799,00 |
-1.677.565,00 |
-1.344.710,00 |
-754.666,00 |
-651.117,00 |
|
|
b) Taxes: 40720 |
-48.281,00 |
-38.539,00 |
-34.052,00 |
-52.184,00 |
-1.314,00 |
|
|
c) Losses, impairments and variation in provisions from trade
operations : 40730 |
-198.778,00 |
-154.767,00 |
53.402,00 |
113.442,00 |
-2.846,00 |
|
|
d) Other current management expenditure : 40740 |
-92.464,00 |
-49.141,00 |
-12.104,00 |
-24.184,00 |
-285.979,00 |
|
|
e) Expenses due to greenhouse gas emissions: 40750 |
0,00 |
0,00 |
0,00 |
0,00 |
0,00 |
|
|
8.
Amortisation of fixed assets: 40800 |
-100.389,00 |
-76.405,00 |
-71.272,00 |
-40.553,00 |
-32.075,00 |
|
|
9.
Allocation of subsidies of non-financial fixed assets and other: 40900 |
0,00 |
0,00 |
0,00 |
0,00 |
0,00 |
|
|
10.
Excess provisions : 41000 |
0,00 |
0,00 |
0,00 |
0,00 |
0,00 |
|
|
11.
Impairment and result of transfers of fixed assets: 41100 |
0,00 |
0,00 |
0,00 |
0,00 |
0,00 |
|
|
a) Impairment and losses : 41110 |
0,00 |
0,00 |
0,00 |
0,00 |
0,00 |
|
|
b) Results for transfers and other : 41120 |
0,00 |
0,00 |
0,00 |
0,00 |
0,00 |
|
|
c) Impairment and profit due to disposals of assets of holding
companies: 41130 |
0,00 |
0,00 |
0,00 |
0,00 |
0,00 |
|
|
12.
Negative difference in combined businesses: 41200 |
0,00 |
0,00 |
0,00 |
0,00 |
0,00 |
|
|
13.
Other results : 41300 |
0,00 |
0,00 |
0,00 |
0,00 |
0,00 |
|
|
A.1)
OPERATING INCOME (1 + 2 + 3 + 4 + 5 + 6 + 7 + 8 + 9 + 10 + 11 + 12 + 13) :
49100 |
782.527,00 |
676.400,00 |
-776.223,00 |
10.364,00 |
748,00 |
|
|
14.
Financial income : 41400 |
7.108,00 |
4.052,00 |
8.000,00 |
4.760,00 |
4.863,00 |
|
|
a) Of shares in equity instruments : 41410 |
0,00 |
0,00 |
0,00 |
0,00 |
0,00 |
|
|
a 1) In Group companies and associates:
41411 |
0,00 |
0,00 |
0,00 |
0,00 |
0,00 |
|
|
a 2) In third parties: 41412 |
0,00 |
0,00 |
0,00 |
0,00 |
0,00 |
|
|
b) From negotiable securities and other financial instruments :
41420 |
7.108,00 |
4.052,00 |
8.000,00 |
4.760,00 |
4.863,00 |
|
|
b 1) From Group companies and associates :
41421 |
0,00 |
0,00 |
0,00 |
0,00 |
0,00 |
|
|
b 2) From third parties : 41422 |
7.108,00 |
4.052,00 |
8.000,00 |
4.760,00 |
4.863,00 |
|
|
c) Allocation of financial subsidies, donations and legacies :
41430 |
0,00 |
0,00 |
0,00 |
0,00 |
0,00 |
|
|
15.
Financial expenditure: 41500 |
-7.808,00 |
-14,00 |
-208,00 |
-443,00 |
-809,00 |
|
|
a) Amounts owed to Group companies and associates : 41510 |
0,00 |
0,00 |
0,00 |
0,00 |
0,00 |
|
|
b) For debts with third parties : 41520 |
-7.808,00 |
-14,00 |
-208,00 |
-443,00 |
-809,00 |
|
|
c) Stock renewal : 41530 |
0,00 |
0,00 |
0,00 |
0,00 |
0,00 |
|
|
16.
Changes in fair value of financial instruments : 41600 |
0,00 |
0,00 |
0,00 |
0,00 |
0,00 |
|
|
a) Trading book and other : 41610 |
0,00 |
0,00 |
0,00 |
0,00 |
0,00 |
|
|
b) Allocation of financial assets held for sale to the result
for the period: 41620 |
0,00 |
0,00 |
0,00 |
0,00 |
0,00 |
|
|
17.
Exchange rate differences : 41700 |
0,00 |
0,00 |
0,00 |
0,00 |
0,00 |
|
|
18.
Impairment and result for transfers of financial instruments: 41800 |
0,00 |
0,00 |
0,00 |
0,00 |
0,00 |
|
|
a) Impairment and losses : 41810 |
0,00 |
0,00 |
0,00 |
0,00 |
0,00 |
|
|
b) Results for transfers and other : 41820 |
0,00 |
0,00 |
0,00 |
0,00 |
0,00 |
|
|
19.
Other financial income and expenditure: 42100 |
0,00 |
0,00 |
0,00 |
0,00 |
0,00 |
|
|
a) Incorporation of financial expenditure to assets:
42110 |
0,00 |
0,00 |
0,00 |
0,00 |
0,00 |
|
|
b) Financial income from arrangement with creditors:
42120 |
0,00 |
0,00 |
0,00 |
0,00 |
0,00 |
|
|
c) Other income and expenditure: 42130 |
0,00 |
0,00 |
0,00 |
0,00 |
0,00 |
|
|
A.2)
FINANCIAL REVENUE (14+15+16+17+18+19) : 49200 |
-700,00 |
4.038,00 |
7.792,00 |
4.317,00 |
4.054,00 |
|
|
A.3)
NET RESULT BEFORE TAXES (A.1+A.2) : 49300 |
781.827,00 |
680.438,00 |
-768.431,00 |
14.681,00 |
4.802,00 |
|
|
20.
Income taxes: 41900 |
-217.611,00 |
-192.445,00 |
211.511,00 |
-7.075,00 |
-1.670,00 |
|
|
A.4)
PROFIT AFTER TAXES (A.3+20) : 49400 |
564.216,00 |
487.993,00 |
-556.920,00 |
7.606,00 |
3.132,00 |
|
|
21.
Result of the year coming from interrupted operations : 42000 |
0,00 |
0,00 |
0,00 |
0,00 |
0,00 |
|
|
A.5)
RESULT OF THE PERIOD (A.4+21) : 49500 |
564.216,00 |
487.993,00 |
-556.920,00 |
7.606,00 |
3.132,00 |
|
|
CASHFLOW
STATEMENT
|
|
|
|
|
Model: Normal
>
Source of information: Data contained in this section is taken from the information
declared in the Annual Accounts submitted to the Trade Register.
|
Net
Rights Granted |
2016 |
2015 |
2014 |
2013 |
2012 |
|
|
1.
Fiscal year result before taxes.: 61100 |
781.827,00 |
680.438,00 |
-768.431,00 |
7.607,00 |
4.802,00 |
|
|
2.
Results adjustments.: 61200 |
299.868,00 |
227.135,00 |
116.883,00 |
-77.210,00 |
0,00 |
|
|
a) Fixed Assets Amortization (+).: 61201 |
100.390,00 |
76.405,00 |
71.272,00 |
40.553,00 |
0,00 |
|
|
b) Obsolescence Allowances (+/-). : 61202 |
198.778,00 |
154.767,00 |
50.308,00 |
-113.443,00 |
0,00 |
|
|
c) Variation in Provision (+/-). : 61203 |
0,00 |
0,00 |
3.095,00 |
0,00 |
0,00 |
|
|
g) Financial income (-).: 61207 |
-7.108,00 |
-4.051,00 |
-8.000,00 |
-4.760,00 |
0,00 |
|
|
h) Financial Expenses (+). : 61208 |
7.808,00 |
14,00 |
208,00 |
440,00 |
0,00 |
|
|
3.
Changes in current capital equity.: 61300 |
-2.704.536,00 |
-1.676.940,00 |
978.303,00 |
597.173,00 |
-2.437.049,00 |
|
|
a) Stock (+/-).: 61301 |
48.237,00 |
-270.840,00 |
-24.011,00 |
-17.306,00 |
13.383,00 |
|
|
d) Debtors and other accounts receivable (+/-). : 61302 |
-5.482.867,00 |
-5.780.289,00 |
-800.920,00 |
-1.131.574,00 |
-889.522,00 |
|
|
c) Other current assets (+/-). : 61303 |
0,00 |
-1.170,00 |
5.965,00 |
-3.683,00 |
0,00 |
|
|
d) Creditors and other accounts payable (+/-). : 61304 |
2.731.203,00 |
4.375.359,00 |
1.803.105,00 |
1.752.460,00 |
-1.566.507,00 |
|
|
e) Other current liabilities (+/-).: 61305 |
-1.109,00 |
0,00 |
-5.836,00 |
-2.724,00 |
5.597,00 |
|
|
4.
Cash Flows from Other Operating Activities: 61400 |
-87.947,00 |
-46.471,00 |
-2.911,00 |
3.018,00 |
0,00 |
|
|
a) Interest payments (-). : 61401 |
-7.808,00 |
-14,00 |
-208,00 |
-440,00 |
0,00 |
|
|
c) Interest collection (+). : 61403 |
7.108,00 |
4.051,00 |
8.000,00 |
4.760,00 |
0,00 |
|
|
d) Income tax payment collection (payments) (+/-).: 61404 |
-87.247,00 |
-50.508,00 |
-10.703,00 |
-1.302,00 |
0,00 |
|
|
5.
Cash Flows from Operating Activities (1 + 2 + 3 + 4) : 61500 |
-1.710.788,00 |
-815.838,00 |
323.844,00 |
530.588,00 |
-2.432.247,00 |
|
|
6.
Payments for investment (-).: 62100 |
-204.743,00 |
-90.076,00 |
-125.552,00 |
-85.495,00 |
-42.420,00 |
|
|
a) Companies of the group and affiliates. : 62101 |
-16.000,00 |
0,00 |
0,00 |
0,00 |
-11.636,00 |
|
|
b) Intangible fixed assets. : 62102 |
-86.119,00 |
-15.587,00 |
-68.714,00 |
-53.424,00 |
6.355,00 |
|
|
c) Fixed assets. : 62103 |
-93.249,00 |
-74.489,00 |
-56.838,00 |
-32.071,00 |
-33.697,00 |
|
|
e) Other financial assets. : 62105 |
-9.375,00 |
0,00 |
0,00 |
0,00 |
-3.442,00 |
|
|
7.
Divestment payment collection (+). : 62200 |
0,00 |
0,00 |
12.193,00 |
414,00 |
0,00 |
|
|
b) Intangible fixed assets. : 62202 |
0,00 |
0,00 |
3.262,00 |
414,00 |
0,00 |
|
|
c) Fixed assets. : 62203 |
0,00 |
0,00 |
8.931,00 |
0,00 |
0,00 |
|
|
8.
Cash Flow from Investing Activities (6+7) less Amortization: 62300 |
-204.743,00 |
-90.076,00 |
-113.359,00 |
-85.081,00 |
-42.420,00 |
|
|
9.
Payment collection and payments for equity instruments. : 63100 |
0,00 |
0,00 |
0,00 |
0,00 |
233.088,00 |
|
|
a) Issuance of equity instruments (+). : 63101 |
0,00 |
0,00 |
0,00 |
0,00 |
233.088,00 |
|
|
10.
Payment collection and payments for financial liabilities instruments.:
63200 |
1.711.583,00 |
995.867,00 |
-6.172,00 |
-10.311,00 |
13.095,00 |
|
|
a) Issuance : 63201 |
1.711.583,00 |
1.017.563,00 |
361.835,00 |
152.394,00 |
20.425,00 |
|
|
2. Debts incurred with credit institutions (+). : 63203 |
119.640,00 |
0,00 |
0,00 |
0,00 |
0,00 |
|
|
3. Debts incurred with companies of the group and affiliates
(+).: 63204 |
1.591.943,00 |
1.017.563,00 |
361.835,00 |
152.394,00 |
20.425,00 |
|
|
b) Repayment and amortization of : 63207 |
0,00 |
-21.696,00 |
-368.007,00 |
-162.705,00 |
-7.330,00 |
|
|
2. Debts incurred with credit institutions (-).: 63209 |
0,00 |
0,00 |
-8.007,00 |
-7.588,00 |
0,00 |
|
|
3. Debts incurred with companies of the group and affiliates
(-). : 63210 |
0,00 |
-19.065,00 |
-360.000,00 |
-155.117,00 |
0,00 |
|
|
5. Other debts (-). : 63212 |
0,00 |
-2.631,00 |
0,00 |
0,00 |
-7.330,00 |
|
|
11.
Payments from dividends and remunerations from other assets instruments. :
63300 |
-110.700,00 |
0,00 |
0,00 |
0,00 |
0,00 |
|
|
a) Dividends (-).: 63301 |
-110.700,00 |
0,00 |
0,00 |
0,00 |
0,00 |
|
|
12.
Cash Flows from Financing Activities (9+10+11): 63400 |
1.600.883,00 |
995.867,00 |
-6.172,00 |
-10.311,00 |
246.183,00 |
|
|
D)
EFFECT OF EXCHANGE RATE CHANGES: 64000 |
0,00 |
0,00 |
0,00 |
0,00 |
0,00 |
|
|
E)
NET INCREASE/DECREASE OF CASH OR EQUIVALENT ASSETS (+/-5+/-8+/12+/-D) :
65000 |
-314.648,00 |
89.953,00 |
204.313,00 |
435.196,00 |
-2.228.484,00 |
|
|
Cash or equivalent assets as of beginning of the fiscal year.:
65100 |
1.381.226,00 |
1.291.274,00 |
1.086.961,00 |
651.765,00 |
3.113.727,00 |
|
|
Cash or equivalent assets as of end of the fiscal year.:
65200 |
1.066.578,00 |
1.381.227,00 |
1.291.274,00 |
1.086.961,00 |
651.765,00 |
|
|
FINANCIAL
DIAGNOSIS
|
>
Economic-Financial Comparative Analysis
Data used in the following ratios and indicators is taken from the
Annual Accounts submitted by the company to the TRADE REGISTER.
>
Comparison within the Sector
|
Cash
Flow |
2016 |
2015 |
Variación 2016 - 2015 |
|
|||
|
|
Empresa |
Sector |
Empresa |
Sector |
Empresa |
Sector |
|
|
Cash
Flow over Sales: |
-0,01 % |
0,01 % |
0,00 % |
0,06 % |
|
-84,02 % |
|
|
Net
Financial Debt: |
-1,09 |
2,06 |
-1,84 |
2,84 |
40,83 |
-27,57 |
|
|
Cash
Flow Yield: |
-0,02 % |
0,01 % |
0,01 % |
0,03 % |
-360,36 % |
-83,55 % |
|
|
EBITDA
over Sales: |
3,04 % |
12,18 % |
4,05 % |
10,44 % |
-25,02 % |
16,69 % |
|
|
Profitability |
2016 |
2015 |
Variación 2016 - 2015 |
|
|||
|
|
Empresa |
Sector |
Empresa |
Sector |
Empresa |
Sector |
|
|
Operating
economic profitability: |
4,48 % |
9,04 % |
5,20 % |
6,94 % |
-13,78 % |
30,36 % |
|
|
Total
economic profitability: |
4,51 % |
5,18 % |
5,23 % |
3,20 % |
-13,63 % |
62,00 % |
|
|
Financial
profitability: |
53,92 % |
7,81 % |
82,31 % |
4,16 % |
-34,49 % |
87,79 % |
|
|
Margin:
|
2,69 % |
7,93 % |
3,64 % |
6,34 % |
-26,02 % |
25,12 % |
|
|
Mark-up:
|
2,69 % |
7,37 % |
3,66 % |
3,79 % |
-26,53 % |
94,54 % |
|
|
Solvency |
2016 |
2015 |
Variación 2016 - 2015 |
|
|||
|
|
Empresa |
Sector |
Empresa |
Sector |
Empresa |
Sector |
|
|
Liquidity:
|
0,06 |
0,16 |
0,11 |
0,14 |
-41,66 |
14,02 |
|
|
Acid
Test: |
1,03 |
0,89 |
1,00 |
0,87 |
2,51 |
3,03 |
|
|
Working
Capital / Investment: |
0,04 |
0,03 |
0,03 |
0,03 |
49,91 |
3,76 |
|
|
Solvency:
|
1,05 |
1,20 |
1,03 |
1,19 |
1,34 |
1,33 |
|
|
Indebtedness |
2016 |
2015 |
Variación 2016 - 2015 |
|
|||
|
|
Empresa |
Sector |
Empresa |
Sector |
Empresa |
Sector |
|
|
Indebtedness
level: |
15,72 |
1,20 |
20,96 |
1,31 |
-25,01 |
-7,78 |
|
|
Borrowing
Composition: |
0,00 |
1,02 |
0,00 |
1,04 |
|
-1,80 |
|
|
Repayment
Ability: |
18,63 |
8,87 |
16,51 |
11,04 |
12,86 |
-19,73 |
|
|
Warranty:
|
1,06 |
1,85 |
1,05 |
1,78 |
1,51 |
3,69 |
|
|
Generated
resources / Total creditors: |
0,04 |
0,10 |
0,05 |
0,08 |
-11,04 |
26,81 |
|
|
Efficiency |
2016 |
2015 |
Variación 2016 - 2015 |
|
|||
|
|
Empresa |
Sector |
Empresa |
Sector |
Empresa |
Sector |
|
|
Productivity:
|
1,19 |
1,92 |
1,25 |
1,80 |
-4,81 |
6,93 |
|
|
Turnover
of Collection Rights : |
1,84 |
5,13 |
1,68 |
5,23 |
9,42 |
-1,83 |
|
|
Turnover
of Payment Entitlements: |
1,72 |
3,54 |
1,30 |
3,69 |
32,40 |
-4,22 |
|
|
Stock
rotation: |
98,61 |
8,15 |
53,46 |
7,79 |
84,46 |
4,53 |
|
|
Assets
turnover: |
1,67 |
1,14 |
1,43 |
1,09 |
16,54 |
4,20 |
|
|
Borrowing
Cost: |
0,05 |
2,35 |
0,00 |
2,45 |
|
-4,07 |
|
>
Trend of indicators under the General Accounting Plan of 2007 (2016, 2015,
2014, 2013, 2012)
|
Cash
Flow |
2016 |
2015 |
2014 |
2013 |
2012 |
|
|
Cash
Flow over Sales: |
-0,01 % |
0,00 % |
0,01 % |
0,04 % |
-0,29 % |
|
|
Net
Financial Debt: |
-1,09 |
-1,84 |
1,84 |
-21,39 |
-19,58 |
|
|
Cash
Flow Yield: |
-0,02 % |
0,01 % |
0,03 % |
0,07 % |
-0,59 % |
|
|
EBITDA
over Sales: |
3,04 % |
4,05 % |
-5,17 % |
0,50 % |
0,38 % |
|
|
Profitability |
2016 |
2015 |
2014 |
2013 |
2012 |
|
|
Operating
economic profitability: |
4,48 % |
5,20 % |
-10,85 % |
0,18 % |
0,02 % |
|
|
Total
economic profitability: |
4,51 % |
5,23 % |
-10,72 % |
0,25 % |
0,13 % |
|
|
Financial
profitability: |
53,92 % |
82,31 % |
-530,83 % |
1,15 % |
0,48 % |
|
|
Margin:
|
2,69 % |
3,64 % |
-5,67 % |
0,10 % |
0,01 % |
|
|
Mark-up:
|
2,69 % |
3,66 % |
-5,62 % |
0,14 % |
0,06 % |
|
|
Solvency |
2016 |
2015 |
2014 |
2013 |
2012 |
|
|
Liquidity:
|
0,06 |
0,11 |
0,18 |
0,21 |
0,19 |
|
|
Acid
Test: |
1,03 |
1,00 |
0,95 |
1,09 |
1,16 |
|
|
Working
Capital / Investment: |
0,04 |
0,03 |
-0,04 |
0,09 |
0,14 |
|
|
Solvency:
|
1,05 |
1,03 |
0,99 |
1,10 |
1,16 |
|
|
Indebtedness |
2016 |
2015 |
2014 |
2013 |
2012 |
|
|
Indebtedness
level: |
15,72 |
20,96 |
67,27 |
7,96 |
5,39 |
|
|
Borrowing
Composition: |
0,00 |
0,00 |
0,00 |
0,00 |
0,00 |
|
|
Repayment
Ability: |
18,63 |
16,51 |
-10,01 |
103,44 |
107,43 |
|
|
Warranty:
|
1,06 |
1,05 |
1,02 |
1,13 |
1,19 |
|
|
Generated
resources / Total creditors: |
0,04 |
0,05 |
-0,07 |
0,01 |
0,01 |
|
|
Efficiency |
2016 |
2015 |
2014 |
2013 |
2012 |
|
|
Productivity:
|
1,19 |
1,25 |
0,68 |
1,03 |
1,02 |
|
|
Turnover
of Collection Rights : |
1,84 |
1,68 |
2,53 |
2,19 |
2,50 |
|
|
Turnover
of Payment Entitlements: |
1,72 |
1,30 |
1,73 |
1,56 |
1,97 |
|
|
Stock
rotation: |
98,61 |
53,46 |
224,54 |
252,60 |
369,78 |
|
|
Assets
turnover: |
1,67 |
1,43 |
1,91 |
1,72 |
2,04 |
|
|
Borrowing
Cost: |
0,05 |
0,00 |
0,00 |
0,01 |
0,02 |
|
COMPARATIVE
SECTORIAL BALANCE
|
Sector-based Comparison under the
rules of the New General Accounting Plan.
|
Net
Rights Granted |
Variación - |
|
|
|
Empresa |
Sector |
|
Net
Rights Granted |
Variación - |
|
|
|
Empresa |
Sector |
|
Net
Rights Granted |
Variación - |
|
|
|
Empresa |
Sector |
|
News
|
|
Public
Tenders and Works Won
|
|
|
|
Organisation
that calls the tender: |
|
CONSEJERIA DE EDUCACION DE LA COMUNIDAD AUTONOMA
DE MADRID |
|
Objective
of Tender: |
|
Obras de sustitución de albardillas en el
instituto "Antonio de Nebrija", en Móstoles, segunda fase |
|
Date
Awarded: |
|
11/11/2009 |
|
Cost: |
|
118.353,92 EURO. |
|
|
|
Research
Summary
|
|
The subject was incorporated in 2008 and is engaged in the support and
completion of some specific services demanded by building companies and
retailers. It operates at the national level. There are some incidences
against the subject listed in the consulted sources. Having the
above-mentioned into consideration, we recommend doing a follow up. |
|
Sources
|
|
Registry of Commerce's Official Gazette. Own and external data bases
Company References |
FOREIGN EXCHANGE RATES
|
Currency |
Unit
|
Indian Rupees |
|
US Dollar |
1 |
INR 64.14 |
|
|
1 |
INR 89.50 |
|
Euro |
1 |
INR 79.43 |
|
Euro |
1 |
INR 78.63 |
Note :
Above are approximate rates obtained from sources believed to be correct
INFORMATION DETAILS
|
Analysis Done by
: |
PRI |
|
|
|
|
Report Prepared
by : |
SYL |
RATING EXPLANATIONS
|
Credit Rating |
Explanation |
Rating Comments |
|
A++ |
Minimum Risk |
Business dealings permissible with minimum
risk of default |
|
A+ |
Low Risk |
Business dealings permissible with low
risk of default |
|
A |
Acceptable Risk |
Business dealings permissible with
moderate risk of default |
|
B |
Medium Risk |
Business dealings permissible on a regular
monitoring basis |
|
C |
Medium High Risk |
Business dealings permissible preferably
on secured basis |
|
D |
High Risk |
Business dealing not recommended or on
secured terms only |
|
NB |
New Business |
No recommendation can be done due to
business in infancy stage |
|
NT |
No Trace |
No recommendation can be done as the
business is not traceable |
NB is stated where there is insufficient information to facilitate rating. However, it is not to be considered as unfavourable.
This score serves as a reference to assess
SC’s credit risk and to set the amount of credit to be extended. It is
calculated from a composite of weighted scores obtained from each of the major
sections of this report. The assessed factors are as follows:
·
Financial
condition covering various ratios
·
Company
background and operations size
·
Promoters
/ Management background
·
Payment
record
·
Litigation
against the subject
·
Industry
scenario / competitor analysis
·
Supplier
/ Customer / Banker review (wherever available)
This report is issued at
your request without any risk and responsibility on the part of MIRA INFORM
PRIVATE LIMITED (MIPL) or its officials.