|
|
|


MIRA INFORM REPORT
|
Report No. : |
489155 |
|
Report Date : |
08.02.2018 |
IDENTIFICATION DETAILS
|
Name : |
SOCIEDAD TEXTIL LONIA SA. |
|
|
|
|
Registered Office : |
Pque. Empresarial Pereiro De Aguiar, S/N - Ourense - 32792
- Orense |
|
|
|
|
Country : |
Spain |
|
|
|
|
Financials (as on) : |
2017 |
|
|
|
|
Date of Incorporation : |
24.06.1997 |
|
|
|
|
Legal Form : |
Public accompany |
|
|
|
|
Line of Business : |
Wholesale of clothing and footwear |
|
|
|
|
No. of Employees : |
Not available |
RATING & COMMENTS
(Mira Inform has adopted New Rating mechanism w.e.f. 23rd
January 2017)
|
MIRA’s Rating : |
A+ |
|
Credit Rating |
Explanation |
Rating Comments |
|
A+ |
Low Risk |
Business dealings permissible with low
risk of default |
|
Status : |
Good |
|
|
|
|
Payment Behaviour : |
Slow |
|
|
|
|
Litigation : |
Clear |
NOTES :
Any query related to this report can be made
on e-mail : infodept@mirainform.com
while quoting report number, name and date.
ECGC Country Risk Classification List
|
Country Name |
Previous Rating (30.06.2017) |
Current Rating (30.09.2017) |
|
Spain |
A1 |
A1 |
|
Risk Category |
ECGC
Classification |
|
Insignificant |
A1 |
|
Low Risk |
A2 |
|
Moderately Low Risk |
B1 |
|
Moderate Risk |
B2 |
|
Moderately High Risk |
C1 |
|
High Risk |
C2 |
|
Very High Risk |
D |
SPAIN - ECONOMIC OVERVIEW
After experiencing a prolonged recession in the wake of the global financial crisis that began in 2008, in 2017 Spain marked the fourth full year of positive economic growth in ten years, largely due to increased private consumption. At the onset of the financial crisis, Spain's GDP contracted by 3.7% in 2009, ending a 16-year growth trend, and continued contracting through most of 2013. In that year, the government successfully shored up struggling banks - exposed to the collapse of Spain's depressed real estate and construction sectors - and in January 2014 completed an EU-funded restructuring and recapitalization program for its financial sector.
Until 2014, credit contraction in the private sector, fiscal austerity, and high unemployment weighed on domestic consumption and investment. The unemployment rate rose from a low of about 8% in 2007 to more than 26% in 2013, but labor reforms prompted a modest reduction to 17% in 2017. High unemployment has strained Spain's public finances, as spending on social benefits increased while tax revenues fell. Spain’s budget deficit peaked at 11.4% of GDP in 2010, but Spain gradually reduced the deficit to about 3.3% of GDP in 2017. Public debt has increased substantially – from 60.1% of GDP in 2010 to nearly 96.7% in 2017.
Exports were resilient throughout the economic downturn and helped to bring Spain's current account into surplus in 2013 for the first time since 1986, where it remained through 2016. Rising labor productivity and an internal devaluation resulting from moderating labor costs and lower inflation have helped to improve foreign investor interest in the economy and positive FDI flows have been restored.
Political gridlock after the national elections in December 2015 and June 2016 and ensuing government formation process constrained the caretaker government’s ability to implement needed labor, pension, health care, tax, and education reforms— in 2016. The European Commission criticized Spain’s 2016 budget for easing austerity measures and for its alleged overly optimistic growth and deficit projections. Spain’s borrowing costs are dramatically lower since their peak in mid-2012, and with the recent uptick in economic activity, inflation has reappeared, at 2% per year.
|
Source
: CIA |
EXECUTIVE
SUMMARY
|
|
|
|
|
|
Name: |
SOCIEDAD TEXTIL LONIA SA. |
|
NIF / Fiscal code: |
A32226003 |
|
Status: |
ACTIVE |
|
Incorporation Date: |
24/06/1997 |
|
Register Data |
Register Section 8 Sheet 5680 |
|
Last Publication in
BORME: |
10/07/2017 [Miscellaneous Concepts] |
|
Last Published Account Deposit: |
2017 |
|
Share Capital: |
18.030.000 |
|
|
|
|
Localization: |
PQUE. EMPRESARIAL PEREIRO DE AGUIAR, S/N - OURENSE - 32792 -
ORENSE |
|
Telephone - Fax - Email - Website: |
Telephone. 988259646 Email. atencionclientepg@stlonia.com
Website. www.stlonia.com/es |
|
Number of Branches |
69 |
|
|
|
|
Activity: |
|
|
NACE: |
4642 - Wholesale of clothing and footwear |
|
Registered Trademarks: |
|
|
Audited / Opinion: |
Si / |
|
Tenders and Awards: |
|
|
Subsidies: |
45 for a total cost of 40380792 |
|
Quality Certificate: |
No |
|
|
|
|
|
|
|
Defaults, Legal
Claims and Insolvency Proceedings : |
|
|
|
|
|
|
|
Number |
Amount (€) |
Most Recent Entry |
|
Insolvency Proceedings, Bankruptcy and Suspension of Payments |
|
Unpublished |
--- |
--- |
|
Defaults on debt with Financial Institutions and Large Companies |
|
None |
--- |
--- |
|
Judicial Claims (Notices, Executive Proceedings, Attachments, Auctions,
Bad Debt) |
|
2 |
0 |
--- |
|
Proceedings heard by the Civil Court |
|
Unpublished |
0 |
--- |
|
Proceedings heard by the Labour Court |
|
Unpublished |
0 |
--- |
|
|
|
Partners: |
|
|
|
OTROS ACCIONISTAS DE SOCIEDAD TEXTIL LONIA, S.A. |
75 % |
|
|
PUIG SL |
25 % |
|
|
Shares: |
16 |
|
|
Other Links: |
5 |
|
|
No. of Active Corporate Bodies: |
|
|
|
Ratios |
2017 |
2016 |
Change |
|
|
|
|
|
Guarantees: |
|
|
Properties Registered: |
Company NO, Administrator NO |
|
Financing / Guarantee Sources : |
Sources YES, Guarantees YES |
|
|
|
|
INVESTIGATION SUMMARY |
|
|
|
|
|
Enquiry
Details
|
|
Identification
|
|
|
Social Denomination: |
SOCIEDAD TEXTIL
LONIA SA. |
|
NIF / Fiscal code: |
A32226003 |
|
Corporate Status: |
ACTIVE |
|
Start of activity: |
1997 |
|
Registered Office: |
PQUE.
EMPRESARIAL PEREIRO DE AGUIAR, S/N |
|
Locality: |
OURENSE |
|
Province: |
ORENSE |
|
Postal Code: |
32792 |
|
Telephone: |
988259646 |
|
Fax: |
988519494 |
|
Website: |
www.stlonia.com/es |
|
Email: |
atencionclientepg@stlonia.com |
|
Branch
Offices
|
|
|
|
|
|
Address |
Postal Code |
City |
Province |
|
CALLE MARQUES DE MOLINS 6 |
02001 |
ALBACETE |
ALBACETE |
|
CALLE TESIFONTE GALLEGO 1 |
02002 |
ALBACETE |
ALBACETE |
|
PLAZA CALVO SOTELO 13 |
03001 |
ALICANTE/ALACANT |
ALICANTE |
|
PASSEIG BORN 2 |
07012 |
PALMA DE MALLORCA |
BALEARES |
|
CALLE JAUME SANTACILIA 8 |
07012 |
PALMA DE MALLORCA |
BALEARES |
|
CALLE GRACIA 87 BJ |
08008 |
BARCELONA |
BARCELONA |
|
CALLE PROVENÇA 292 |
08008 |
BARCELONA |
BARCELONA |
|
CALLE VITORIA 19 |
09004 |
BURGOS |
BURGOS |
|
PLAZA SAN ANTONIO 10 |
11001 |
CADIZ |
CADIZ |
|
CALLE ENMEDIO 20 |
12001 |
CASTELLON DE LA PLANA/CASTELLO DE LA PLANA |
CASTELLON |
|
CALLE JOSE CRUZ CONDE 30 |
14001 |
CORDOBA |
CORDOBA |
|
AVENIDA ALFEREZ PROVISIONAL 3 |
15006 |
CORUÑA (A) |
LA CORUÑA |
|
CALLE FONSECA 7 |
15004 |
CORUÑA (A) |
LA CORUÑA |
|
PLAZA LUGO 10 BJ |
15004 |
CORUÑA (A) |
LA CORUÑA |
|
RUA XENERAL PARDIÑAS (DO) 1 |
15701 |
SANTIAGO DE COMPOSTELA |
LA CORUÑA |
|
PASEO AREA CENTRAL (DE) 30 |
15707 |
SANTIAGO DE COMPOSTELA |
LA CORUÑA |
|
CALLE ARGENTERIA 9 |
17004 |
GIRONA |
GIRONA |
|
CALLE ALHONDIGA 9 BJ |
18001 |
GRANADA |
GRANADA |
|
CALLE SALAMANCA 1 |
18001 |
GRANADA |
GRANADA |
|
AVENIDA EDUARDO GUITIAN |
19002 |
GUADALAJARA |
GUADALAJARA |
|
CALLE BERGARA 8 |
20005 |
DONOSTIA-SAN SEBASTIAN |
GUIPUZCOA |
|
PLAZA AYUNTAMIENTO |
23700 |
LINARES |
JAEN |
|
CALLE DOCTORES CASTROVIEJO 15 3 |
26003 |
LOGROÑO |
LA RIOJA |
|
AVENIDA EUROPA (DE) 10 18 |
28108 |
ALCOBENDAS |
MADRID |
|
CALLE NACIONAL V |
28939 |
ARROYOMOLINOS |
MADRID |
|
CALLE ARTURO SORIA 126 |
28043 |
MADRID |
MADRID |
|
CALLE BARBARA DE BRAGANZA 2 |
28004 |
MADRID |
MADRID |
|
CALLE CLAUDIO COELLO 95 |
28006 |
MADRID |
MADRID |
|
CALLE SERRANO 28 |
28001 |
MADRID |
MADRID |
|
CALLE SEXTA 50 |
28016 |
MADRID |
MADRID |
|
AVENIDA SUR DEL AEROPUERTO DE BARAJAS 2 1 |
28042 |
MADRID |
MADRID |
|
CALLE AEROPUERTO ADOLFO SUAREZ BARAJAS MADRID T 4 |
28042 |
MADRID |
MADRID |
|
CALLE MODA SHOPPING CTRO CIAL 4 |
28020 |
MADRID |
MADRID |
|
CALLE ADOLFO BIOY CC LA GAVIA 2 |
28051 |
MADRID |
MADRID |
|
CALLE EUROPA CC ZIELO POZUELO 263 45 |
28224 |
POZUELO DE ALARCON |
MADRID |
|
CALLE JUAN RAMON JIMENEZ 3 41 |
28232 |
ROZAS DE MADRID (LAS) |
MADRID |
|
CALLE MESON DE VELEZ 1 |
29005 |
MALAGA |
MALAGA |
|
CALLE CENTRO COMERCIAL LA CAADA 213 |
29660 |
MARBELLA |
MALAGA |
|
CALLE MUELLE DE RIBERA 5 5 |
29660 |
MARBELLA |
MALAGA |
|
CALLE PLATERIA (MURCIA) 14 |
30004 |
MURCIA |
MURCIA |
|
CALLE NORIA OUTLET SHOPPING 4 |
30830 |
MURCIA |
MURCIA |
|
CALLE COMERCIAL LA ORA SALI A 7 29 |
30830 |
MURCIA |
MURCIA |
|
AVENIDA BAJA NAVARRA / NAFARROA BEHEREKO ETORBIDEA 9 |
31002 |
PAMPLONA/IRUÑA |
NAVARRA |
|
CALLE GARCIA CASTAÑON / GARCIA CASTAÑON KALEA 8 |
31002 |
PAMPLONA/IRUÑA |
NAVARRA |
|
RUA PASEO (DO) 34 BJ |
32003 |
OURENSE |
ORENSE |
|
RUA PARQUE DE SAN LAZARO 7 |
32003 |
OURENSE |
ORENSE |
|
PARQUE EMPRESARIAL PEREIRO DE AGUIAR |
32710 |
PEREIRO DE AGUIAR (O) |
ORENSE |
|
CALLE CORRIDA 45 BJ |
33206 |
GIJON |
ASTURIAS |
|
CALLE ARTURO ALVAREZ-BUYLLA 2 29 |
33005 |
OVIEDO |
ASTURIAS |
|
AVENIDA GRAN VIA 6 |
36203 |
VIGO |
PONTEVEDRA |
|
CALLE ARCO 7 |
37002 |
SALAMANCA |
SALAMANCA |
|
CALLE BIENTOCADAS 7 BJ |
37002 |
SALAMANCA |
SALAMANCA |
|
AVENIDA TRES DE MAYO 7 |
38003 |
SANTA CRUZ DE TENERIFE |
SANTA CRUZ DE TENERIFE |
|
CALLE CALVO SOTELO 11 |
39002 |
SANTANDER |
CANTABRIA |
|
CALLE PEREDA (LA) 6 B |
39004 |
SANTANDER |
CANTABRIA |
|
. FINCA LOS ESPARTALES 29 |
41309 |
RINCONADA (LA) |
SEVILLA |
|
CALLE NUEVA 8 A |
41001 |
SEVILLA |
SEVILLA |
|
CALLE TOLEDO CORTE INGLES 1 |
45600 |
TALAVERA DE LA REINA |
TOLEDO |
|
CALLE COLON 17 |
46004 |
VALENCIA |
VALENCIA |
|
CALLE JORGE JUAN 10 |
46004 |
VALENCIA |
VALENCIA |
|
CALLE MENORCA 19 C C AQUA 14 |
46023 |
VALENCIA |
VALENCIA |
|
CALLE PAZ 5 |
46003 |
VALENCIA |
VALENCIA |
|
CALLE MARIA DE MOLINA 5 |
47001 |
VALLADOLID |
VALLADOLID |
|
CALLE VP CENTRO COMERCIAL MEGAPARK 7 31 |
48902 |
BARAKALDO |
VIZCAYA |
|
GRAN VIA LOPEZ DE HARO D DIEGO 46 U PB 1I |
48011 |
BILBAO |
VIZCAYA |
|
CALLE RODRIGUEZ ARIAS 27 PB 1D |
48011 |
BILBAO |
VIZCAYA |
|
PARQUE VP COMERCIAL ARTEA 33 PE RU RI |
48940 |
LEIOA |
VIZCAYA |
|
PASEO LA CONSTITUCION 21 LC |
50001 |
ZARAGOZA |
ZARAGOZA |
|
CALLE JERONIMA ZAPORTA 7 LC |
50001 |
ZARAGOZA |
ZARAGOZA |
Activity
|
|
|
NACE: |
4642 |
|
Corporate Purpose: |
EL DISEÑO, FABRICACION, COMPRA Y VENTA Y COMERCIALIZACION EN TERRITORIO NACIONAL Y EN EL EXTRANJERO DE TODO TIPO DE PRODUCTOS TEXTILES Y COMPLEMENTOS DE VESTIR, PRENDAS, PERFUMES, COLONIAS Y ARTICULOS DE USO PERSONAL, ETC. CN |
|
Additional Information: |
Plant, warehouse and offices located on |
|
Import / export: |
EXPORTS |
|
Chronological
Summary
|
|||
|
|
|
|
|
|
|
Year |
Act |
|
|
|
1997 |
Appointments/ Re-elections (1) Change of Social
Denomination (1) Company Formation (1) Statutory Modifications (1) |
|
|
|
1998 |
Accounts deposit (year 1997) Appointments/ Re-elections
(5) Cessations/ Resignations/ Reversals (1) Change of Social address (1)
Increase of Capital (3) Other Concepts/ Events (1) Statutory Modifications
(1) |
|
|
|
1999 |
Increase of Capital (1) |
|
|
|
2000 |
Accounts deposit (year 1998, 1999) Appointments/
Re-elections (1) Increase of Capital (2) |
|
|
|
2001 |
Accounts deposit (year 2000) Increase of Capital (1) |
|
|
|
2002 |
Accounts deposit (year 2001) Appointments/ Re-elections
(1) |
|
|
|
2003 |
Accounts deposit (year 2002 consolidated, 2002)
Appointments/ Re-elections (1) Board Meeting (1) Cessations/ Resignations/ Reversals
(1) Increase of Capital (1) Other Concepts/ Events (1) |
|
|
|
2004 |
Accounts deposit (year 2003) Appointments/ Re-elections
(1) Capital Reduction (1) |
|
|
|
2005 |
Accounts deposit (year 2004 consolidated, 2004) Appointments/
Re-elections (2) Capital Reduction (1) Cessations/ Resignations/ Reversals
(1) |
|
|
|
2006 |
Accounts deposit (year 2005 consolidated, 2005)
Appointments/ Re-elections (2) Cessations/ Resignations/ Reversals (2) |
|
|
|
2007 |
Accounts deposit (year 2006 consolidated, 2006)
Appointments/ Re-elections (2) |
|
|
|
2008 |
Accounts deposit (year 2007 consolidated, 2007)
Appointments/ Re-elections (5) |
|
|
|
2009 |
Appointments/ Re-elections (1) |
|
|
|
2010 |
Accounts deposit (year 2008 consolidated, 2009
consolidated, 2008, 2009) Appointments/ Re-elections (2) Cessations/
Resignations/ Reversals (1) |
|
|
|
2012 |
Accounts deposit (year 2010) |
|
|
|
2013 |
Accounts deposit (year 2010 consolidated, 2011
consolidated, 2011, 2012) Appointments/ Re-elections (3) Cessations/
Resignations/ Reversals (1) |
|
|
|
2014 |
Accounts deposit (year 2013) Appointments/ Re-elections
(1) Board Meeting (1) |
|
|
|
2015 |
Accounts deposit (year 2014) Appointments/ Re-elections
(3) Cessations/ Resignations/ Reversals (1) |
|
|
|
2016 |
Accounts deposit (year 2015 consolidated, 2015) |
|
|
|
2017 |
Accounts deposit (year 2016 consolidated, 2016, 2017) Appointments/
Re-elections (2) Cessations/ Resignations/ Reversals (1) Other Concepts/
Events (1) |
|
|
|
2018 |
Accounts deposit (year 2017 consolidated) |
|
|
Breakdown
of Owners' Equity
|
|
|
Registered Capital: |
18.030.000 |
|
Paid up capital: |
18.030.000 |
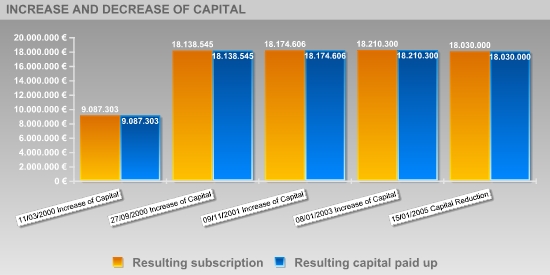
Updated
Evolution of the Subscribed and Paid-in Capital
|
|||||
|
|
|
|
|
|
|
|
|
|||||
|
|
|
|
|
|
|
|
Publishing Date |
Registration Type |
Capital Subscribed |
Paid up capital |
Underwritten result |
Disbursed Result |
|
06/08/1997 |
Company Formation |
450.759 |
450.759 |
450.759 |
450.759 |
|
30/01/1998 |
Increase of Capital |
225.380 |
225.380 |
676.139 |
676.139 |
|
19/02/1998 |
Increase of Capital |
6.085.248 |
6.085.248 |
6.761.386 |
6.761.386 |
|
19/08/1998 |
Increase of Capital |
2.253.795 |
2.253.795 |
9.015.182 |
9.015.182 |
|
10/06/1999 |
Increase of Capital |
36.061 |
36.061 |
9.051.242 |
9.051.242 |
|
11/03/2000 |
Increase of Capital |
36.061 |
36.061 |
9.087.303 |
9.087.303 |
|
27/09/2000 |
Increase of Capital |
9.051.242 |
9.051.242 |
18.138.545 |
18.138.545 |
|
09/11/2001 |
Increase of Capital |
36.061 |
36.061 |
18.174.606 |
18.174.606 |
|
08/01/2003 |
Increase of Capital |
36.060 |
36.060 |
18.210.300 |
18.210.300 |
|
15/01/2005 |
Capital Reduction |
-180.300 |
-180.300 |
18.030.000 |
18.030.000 |
|
Active
Social Bodies
|
|
|
|
|
|
Post published |
Social Body's Name |
Appointment Date |
Other Positions in this Company |
|
PRESIDENT |
VER IV PROYECTOS SL |
30/06/2017 |
3 |
|
MEMBER OF THE BOARD |
TAPRU SOCIEDAD LIMITADA |
30/06/2017 |
2 |
|
|
ALTAGRACIA PROYECTOS SL |
30/06/2017 |
3 |
|
|
VER IV PROYECTOS SL |
30/06/2017 |
3 |
|
|
DOMINGUEZ RODRIGUEZ MARIA |
19/01/2015 |
6 |
|
|
PUIG GUASH MARC |
19/01/2015 |
1 |
|
|
PUIG ROCHA MANUEL |
19/01/2015 |
1 |
|
|
RAMOS MENDEZ MANUEL |
19/01/2015 |
11 |
|
|
DOMINGUEZ FERNANDEZ FRANCISCO JAVIER |
19/01/2015 |
12 |
|
JOINT CHIEF EXECUTIVE OFFICER |
TAPRU SOCIEDAD LIMITADA |
30/06/2017 |
2 |
|
|
VER IV PROYECTOS SL |
30/06/2017 |
3 |
|
|
ALTAGRACIA PROYECTOS SL |
30/06/2017 |
3 |
|
|
DOMINGUEZ FERNANDEZ FRANCISCO JAVIER |
19/01/2015 |
12 |
|
PROXY |
CASTRO PEREZ OSCAR |
27/08/2008 |
2 |
|
|
FERNANDEZ DOVAL SUSANA |
22/02/2008 |
2 |
|
|
CARBALLO MOURE SERAFINA |
28/10/1998 |
1 |
|
SECRETARY |
ALTAGRACIA PROYECTOS SL |
30/06/2017 |
3 |
|
ACCOUNTS' AUDITOR / HOLDER |
DELOITTE SL |
01/03/2017 |
22 |
|
CONSOLIDATED ACCOUNTS' AUDITOR |
DELOITTE SL |
01/03/2017 |
22 |
|
Historical
Social Bodies
|
|
|
|
|
|
Social Body's Name |
Post published |
End Date |
Other Positions in this Company |
|
ARTHUR ANDERSEN Y CIA S COM |
ACCOUNTS' AUDITOR / HOLDER |
22/02/2002 |
2 |
|
|
ACCOUNTS' AUDITOR / HOLDER |
27/09/2003 |
|
|
BABECKI CAMPUZANO JULIO |
MEMBER OF THE BOARD |
21/08/2013 |
2 |
|
|
MEMBER OF THE BOARD |
19/01/2015 |
|
|
BORGEOT VINCENT |
MEMBER OF THE BOARD |
21/08/2008 |
2 |
|
|
MEMBER OF THE BOARD |
09/07/2010 |
|
|
CASTRO PEREZ OSCAR |
PROXY |
27/08/2008 |
2 |
|
DELOITTE & TOUCHE ESPAÑA SL |
ACCOUNTS' AUDITOR / HOLDER |
02/12/2004 |
6 |
|
|
ACCOUNTS' AUDITOR / HOLDER |
02/11/2005 |
|
|
|
ACCOUNTS' AUDITOR / HOLDER |
23/10/2006 |
|
|
|
CONSOLIDATED ACCOUNTS' AUDITOR |
02/12/2004 |
|
|
|
CONSOLIDATED ACCOUNTS' AUDITOR |
02/11/2005 |
|
|
|
CONSOLIDATED ACCOUNTS' AUDITOR |
23/10/2006 |
|
|
DELOITTE S L |
ACCOUNTS' AUDITOR / HOLDER |
14/12/2007 |
4 |
|
|
ACCOUNTS' AUDITOR / HOLDER |
21/08/2008 |
|
|
|
CONSOLIDATED ACCOUNTS' AUDITOR |
14/12/2007 |
|
|
|
CONSOLIDATED ACCOUNTS' AUDITOR |
21/08/2008 |
|
|
DELOITTE SL |
ACCOUNTS' AUDITOR / HOLDER |
14/12/2007 |
22 |
|
|
ACCOUNTS' AUDITOR / HOLDER |
21/08/2008 |
|
|
|
ACCOUNTS' AUDITOR / HOLDER |
19/10/2009 |
|
|
|
ACCOUNTS' AUDITOR / HOLDER |
02/12/2010 |
|
|
|
ACCOUNTS' AUDITOR / HOLDER |
25/01/2013 |
|
|
|
ACCOUNTS' AUDITOR / HOLDER |
15/03/2013 |
|
|
|
ACCOUNTS' AUDITOR / HOLDER |
29/12/2014 |
|
|
|
ACCOUNTS' AUDITOR / HOLDER |
19/01/2015 |
|
|
|
ACCOUNTS' AUDITOR / HOLDER |
28/12/2015 |
|
|
|
ACCOUNTS' AUDITOR / HOLDER |
01/03/2017 |
|
|
|
CONSOLIDATED ACCOUNTS' AUDITOR |
14/12/2007 |
|
|
|
CONSOLIDATED ACCOUNTS' AUDITOR |
21/08/2008 |
|
|
|
CONSOLIDATED ACCOUNTS' AUDITOR |
19/10/2009 |
|
|
|
CONSOLIDATED ACCOUNTS' AUDITOR |
02/12/2010 |
|
|
|
CONSOLIDATED ACCOUNTS' AUDITOR |
25/01/2013 |
|
|
|
CONSOLIDATED ACCOUNTS' AUDITOR |
15/03/2013 |
|
|
|
CONSOLIDATED ACCOUNTS' AUDITOR |
29/12/2014 |
|
|
|
CONSOLIDATED ACCOUNTS' AUDITOR |
19/01/2015 |
|
|
|
CONSOLIDATED ACCOUNTS' AUDITOR |
28/12/2015 |
|
|
|
CONSOLIDATED ACCOUNTS' AUDITOR |
01/03/2017 |
|
|
DOMINGUEZ FERNANDEZ FRANCISCO JAVIER |
MEMBER OF THE BOARD |
21/08/2013 |
12 |
|
|
MEMBER OF THE BOARD |
19/01/2015 |
|
|
|
JOINT CHIEF EXECUTIVE OFFICER |
19/08/1998 |
|
|
|
JOINT CHIEF EXECUTIVE OFFICER |
27/09/2003 |
|
|
|
JOINT CHIEF EXECUTIVE OFFICER |
21/08/2008 |
|
|
|
JOINT CHIEF EXECUTIVE OFFICER |
21/08/2013 |
|
|
|
JOINT CHIEF EXECUTIVE OFFICER |
19/01/2015 |
|
|
|
MEMBER OF THE BOARD |
19/08/1998 |
|
|
|
MEMBER OF THE BOARD |
27/09/2003 |
|
|
|
MEMBER OF THE BOARD |
21/08/2008 |
|
|
DOMINGUEZ FERNANDEZ JESUS |
MEMBER OF THE BOARD |
19/08/1998 |
6 |
|
|
MEMBER OF THE BOARD |
27/09/2003 |
|
|
|
MEMBER OF THE BOARD |
16/03/2006 |
|
|
|
JOINT CHIEF EXECUTIVE OFFICER |
19/08/1998 |
|
|
|
JOINT CHIEF EXECUTIVE OFFICER |
27/09/2003 |
|
|
|
JOINT CHIEF EXECUTIVE OFFICER |
16/03/2006 |
|
|
DOMINGUEZ FERNANDEZ JOSEFINA |
MEMBER OF THE BOARD |
27/09/2003 |
17 |
|
|
MEMBER OF THE BOARD |
21/08/2008 |
|
|
|
MEMBER OF THE BOARD |
21/08/2013 |
|
|
|
MEMBER OF THE BOARD |
19/01/2015 |
|
|
|
MEMBER OF THE BOARD |
30/06/2017 |
|
|
|
JOINT CHIEF EXECUTIVE OFFICER |
19/08/1998 |
|
|
|
JOINT CHIEF EXECUTIVE OFFICER |
27/09/2003 |
|
|
|
JOINT CHIEF EXECUTIVE OFFICER |
21/08/2008 |
|
|
|
JOINT CHIEF EXECUTIVE OFFICER |
21/08/2013 |
|
|
|
JOINT CHIEF EXECUTIVE OFFICER |
19/01/2015 |
|
|
|
JOINT CHIEF EXECUTIVE OFFICER |
30/06/2017 |
|
|
|
PRESIDENT |
27/09/2003 |
|
|
|
PRESIDENT |
21/08/2008 |
|
|
|
PRESIDENT |
21/08/2013 |
|
|
|
PRESIDENT |
19/01/2015 |
|
|
|
PRESIDENT |
30/06/2017 |
|
|
|
MEMBER OF THE BOARD |
19/08/1998 |
|
|
DOMINGUEZ RODRIGUEZ MARIA |
MEMBER OF THE BOARD |
21/08/2008 |
6 |
|
|
MEMBER OF THE BOARD |
21/08/2013 |
|
|
|
MEMBER OF THE BOARD |
19/01/2015 |
|
|
|
JOINT CHIEF EXECUTIVE OFFICER |
21/08/2013 |
|
|
|
JOINT CHIEF EXECUTIVE OFFICER |
19/01/2015 |
|
|
FERNANDEZ DOVAL SUSANA |
PROXY |
22/02/2008 |
2 |
|
GIROUD BERNARD |
MEMBER OF THE BOARD |
21/07/2005 |
1 |
|
GREEF FREDDY DE |
MEMBER OF THE BOARD |
27/09/2003 |
1 |
|
HOUEL PATRICK |
MEMBER OF THE BOARD |
21/08/2008 |
3 |
|
|
MEMBER OF THE BOARD |
21/08/2013 |
|
|
|
MEMBER OF THE BOARD |
19/01/2015 |
|
|
RAMOS MENDEZ MANUEL |
MEMBER OF THE BOARD |
19/08/1998 |
11 |
|
|
MEMBER OF THE BOARD |
27/09/2003 |
|
|
|
MEMBER OF THE BOARD |
21/08/2008 |
|
|
|
MEMBER OF THE BOARD |
21/08/2013 |
|
|
|
MEMBER OF THE BOARD |
19/01/2015 |
|
|
|
JOINT CHIEF EXECUTIVE OFFICER |
19/08/1998 |
|
|
|
JOINT CHIEF EXECUTIVE OFFICER |
27/09/2003 |
|
|
|
JOINT CHIEF EXECUTIVE OFFICER |
21/08/2008 |
|
|
|
JOINT CHIEF EXECUTIVE OFFICER |
21/08/2013 |
|
|
|
JOINT CHIEF EXECUTIVE OFFICER |
19/01/2015 |
|
|
RODRIGUEZ PRIETO MARIA DEL CARMEN |
MEMBER OF THE BOARD |
19/08/1998 |
18 |
|
|
MEMBER OF THE BOARD |
27/09/2003 |
|
|
|
MEMBER OF THE BOARD |
21/08/2008 |
|
|
|
MEMBER OF THE BOARD |
21/08/2013 |
|
|
|
MEMBER OF THE BOARD |
19/01/2015 |
|
|
|
MEMBER OF THE BOARD |
30/06/2017 |
|
|
|
JOINT CHIEF EXECUTIVE OFFICER |
19/08/1998 |
|
|
|
JOINT CHIEF EXECUTIVE OFFICER |
27/09/2003 |
|
|
|
JOINT CHIEF EXECUTIVE OFFICER |
21/08/2008 |
|
|
|
JOINT CHIEF EXECUTIVE OFFICER |
21/08/2013 |
|
|
|
JOINT CHIEF EXECUTIVE OFFICER |
19/01/2015 |
|
|
|
JOINT CHIEF EXECUTIVE OFFICER |
30/06/2017 |
|
|
|
SECRETARY |
19/08/1998 |
|
|
|
SECRETARY |
27/09/2003 |
|
|
|
SECRETARY |
21/08/2008 |
|
|
|
SECRETARY |
21/08/2013 |
|
|
|
SECRETARY |
19/01/2015 |
|
|
|
SECRETARY |
30/06/2017 |
|
|
RODRIGUEZ VAZQUEZ HERMESINDA |
MEMBER OF THE BOARD |
19/08/1998 |
13 |
|
|
MEMBER OF THE BOARD |
27/09/2003 |
|
|
|
MEMBER OF THE BOARD |
21/08/2008 |
|
|
|
MEMBER OF THE BOARD |
21/08/2013 |
|
|
|
MEMBER OF THE BOARD |
19/01/2015 |
|
|
|
MEMBER OF THE BOARD |
30/06/2017 |
|
|
|
JOINT CHIEF EXECUTIVE OFFICER |
19/08/1998 |
|
|
|
JOINT CHIEF EXECUTIVE OFFICER |
27/09/2003 |
|
|
|
JOINT CHIEF EXECUTIVE OFFICER |
21/08/2008 |
|
|
|
JOINT CHIEF EXECUTIVE OFFICER |
21/08/2013 |
|
|
|
JOINT CHIEF EXECUTIVE OFFICER |
19/01/2015 |
|
|
|
JOINT CHIEF EXECUTIVE OFFICER |
30/06/2017 |
|
|
|
PRESIDENT |
19/08/1998 |
|
|
WESTLEY INTERNATIONAL SA |
MEMBER OF THE BOARD |
27/09/2003 |
1 |
|
Executive
board
|
||
|
|
|
|
|
Post |
NIF |
Name |
|
FINANCIAL DIRECTOR |
|
ALFONSO EIRIN |
Defaults,
Legal Claims and Insolvency Proceedings
|
|
|
|
|
Section enabling assessment of the degree of compliance of
the company queried with its payment obligations. It provides information on the
existence and nature of all stages of Insolvency and Legal Proceedings
published with reference to the Company in the country's various Official
Bulletins and national newspapers, as well Defaults Registered in the main
national credit bureaus (ASNEF Industrial and RAI ).
> Summary
Chronological summary
|
|
|
Number of Publications |
Amount (€) |
Start date |
End date |
|
Insolvency Proceedings, Bankruptcy and Suspension of Payments |
|
Unpublished |
--- |
--- |
--- |
|
Request/Declaration |
|
0 |
--- |
date |
|
|
Proceedings |
|
--- |
--- |
|
--- |
|
Resolution |
|
--- |
--- |
|
--- |
|
Defaults on debt with Financial Institutions and Large Companies |
Bank and Commercial Delinquency |
None |
0 |
|
|
|
Status: Friendly |
|
--- |
|
|
|
|
Status: Pre-Litigation |
|
--- |
|
|
|
|
Status: Litigation |
|
--- |
|
|
|
|
Status: Non-performing |
|
--- |
|
|
|
|
Status: insolvency proceedings, bankruptcy and suspension of
payments |
|
--- |
|
|
|
|
Other status |
|
--- |
|
|
|
|
Legal and Administrative Proceedings |
|
2 |
--- |
02/01/2014 |
09/01/2015 |
|
Notices of defaults and enforcement |
|
2 |
--- |
|
--- |
|
Seizures |
|
--- |
--- |
|
--- |
|
Auctions |
|
--- |
--- |
|
--- |
|
Declarations of insolvency and bad debt |
|
--- |
--- |
|
--- |
|
Proceedings heard by the Civil Court |
|
Unpublished |
--- |
|
|
|
Proceedings heard by the Labour Court |
|
Unpublished |
--- |
|
|
> Details
Basis for
scoring
|
Positive Factors |
Adverse Factors |
|
No irregular payment performance has been detected based on information obtained from credit bureaus. At domestic level, it is one of the companies with high turnover volume. SOCIEDAD TEXTIL LONIA SA. 's borrowing cost is appropriate according to its volume of external financing sources. Significant operating income. The Company has the necessary return on the investments for its main activity in comparison with its assets. This return is higher than that of the financial year 2016 which means that the company's financial situation has improved. It presents a significant efficient productivity. EBITDA shows adequate company costs management as income exceed operating expenses. |
|
Probability
of default
|
> Estimated Probability of Default for the next 12 months: 0.155 %
|
Sector in which comparison is carried out: 464 Wholesale of household goods |
|
|
Relative Position:
|
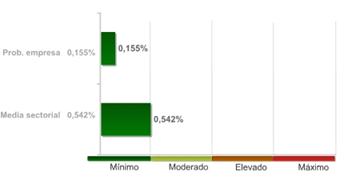
The company's comparative analysis with the rest of the companies that comprise the sector, shows the company holds a better position with regard to the probability of non-compliance.
The 99.00% of the companies of the sector SOCIEDAD TEXTIL LONIA SA. belongs to show a higher probability of non-compliance.
The probability of the company's non-compliance with its payment obligations within deadlines estimated by our qualifications models is 0,155%.
In the event they fail to comply with the payment, the seriousness of the loss will depend on factors such as the promptness of the commencement of the charging management, the existence of executive documents which match the credit or the existence of guarantees and free debt assets under the name of the debtor. Therefore, the probability of non-compliance should not be solely interpreted as the total loss of the owed amount.
|
Result of query
submitted to the R.A.I. (Spanish Bad Debt Register) on |
LEGAL
CLAIMS
|
|
|
|
|
|
Summary of Judicial Claims |
|
|
|
|
|
|
|
|
||
|
|
|
Not published |
|
|
|
|
Not published |
|
|
|
|
||
|
|
|
Not published |
|
|
|
|
Not published |
|
|
|
|
Not published |
|
|
|
|
2 Legal Claims whose amounts have not been published |
|
|
|
|
||
|
|
|
Not published |
|
|
|
|
Not published |
|
|
|
|
||
|
|
|
Not published |
|
|
Incidences Detailed |
|
Incidences with the Local Administration |
|
|
|
Last Published Stage: |
EXECUTION NOTIFICATION |
|
Record Number: |
1400749974 |
|
Requested by: |
ADMINISTRACION LOCAL |
|
Published domicile: |
(DESCONOCIDA) |
|
Source: |
B.O.P. SALAMANCA Nº12, 2015 PAGINA 36 |
|
|
|
Last Published Stage: |
EXECUTION NOTIFICATION |
|
Record Number: |
1300598217 |
|
Requested by: |
ADMINISTRACION LOCAL |
|
Published domicile: |
(DESCONOCIDA) |
|
Source: |
B.O.P. SALAMANCA Nº12, 2014 PAGINA 40 |
|
Guarantees
|
|
References |
|
Link
List
|
|
|
|
|
|
HAS IN ITS
ADMINISTRATION BOARD TO: |
3 Entities |
|
IS RELATED
WITH: |
2 Entities |
|
PARTICIPATES
IN: |
16 Entities |
|
SHAREHOLDERS: |
2 Entities |
>
Shareholders
|
Relationship |
Entity |
Province |
Shareholding
stake |
|
SHAREHOLDERS |
OTROS
ACCIONISTAS DE SOCIEDAD TEXTIL LONIA, S.A. |
|
75 |
|
|
PUIG SL |
BARCELONA |
25 |
|
PARTICIPATES
IN |
SOCIEDAD TEXTIL
LONIA, SOCIEDAD ANONIMA, (INGLATERRA) |
|
100 |
|
|
MONTEALEGRE
CLUB DE GOLF SOCIEDAD ANONIMA |
ORENSE |
3 |
|
|
SOCIEDAD
TEXTIL LONIA CHILE LTDA |
|
100 |
|
|
SOCIEDAD
TEXTIL LONIA, SOCIEDAD ANONIMA, DE CV (MEXICO) |
|
100 |
|
|
ST LONIATEXTIL
LDA (PORTUGAL) |
|
100 |
|
|
SOCIEDAD
TEXTIL LONIA SINGAPORE LTDA (SINGAPUR) |
|
100 |
|
|
TEXTIL LONIA
TRADING (SHANGHAI), SOCIEDAD ANONIMA, (CHINA) |
|
100 |
|
|
SOCIEDAD
TEXTIL LONIA SAS (FRANCIA) |
|
100 |
|
|
TEXTIL LONIA MALAYSIA
SDN BHD (MALASIA) |
|
100 |
|
|
SOCIEDAD
TEXTIL LONIA CORP (ESTADOS UNIDOS) |
|
100 |
|
|
SOCIEDAD
TEXTIL LONIA JAPAN KK (JAPON) |
|
100 |
|
|
SOCIEDAD
TEXTIL LONIA KOREA, SOCIEDAD ANONIMA, (COREA DEL SUR) |
|
100 |
|
|
SOCIEDAD TEXTIL
LONIA CHILE, SOCIEDAD ANONIMA, (CHILE) |
|
100 |
|
|
SOCIEDAD
TEXTIL LONIA SINGAPORE, SOCIEDAD ANONIMA, (SINGAPUR) |
|
100 |
|
|
ST LONIA
TEXTIL UNIPPESOAL LDA (PORTUGAL) |
|
100 |
|
|
TEXTIL LONIA
TRADING, SOCIEDAD ANONIMA, (CHINA) |
|
100 |
> Other
relationships
|
Relationship |
Entity |
Province |
Shareholding
stake |
|
IS RELATED
WITH |
| | |
|
|
|
|
ANTONIO PUIG
SA |
BARCELONA |
|
|
|
BIMBA &
LOLA S.L |
PONTEVEDRA |
|
|
HAS IN ITS
ADMINISTRATION BOARD TO |
ALTAGRACIA
PROYECTOS SL |
ORENSE |
|
|
|
TAPRU SOCIEDAD
LIMITADA |
ORENSE |
|
|
|
VER IV
PROYECTOS SL |
ORENSE |
|
|
Turnover
|
|
|
Total Sales |
257.088.071 |
The sales data
is from the latest available financial statements in. Failing that, are estimates
data calculated by statistical methods.
|
Financial
Accounts and Balance Sheets
|
|
|
|
|
Financial Years
Presented
|
Ejercicio |
Tipo de Cuentas Anuales |
Fecha Presentacion |
|
2017 |
Consolidadas |
January 2018 |
|
2017 |
Normales |
October 2017 |
|
2016 |
Consolidadas |
January 2017 |
|
2016 |
Normales |
January 2017 |
|
2015 |
Consolidadas |
September 2016 |
|
2015 |
Normales |
January 2016 |
|
2014 |
Consolidadas |
No publicado en BORME |
|
2014 |
Normales |
January 2015 |
|
2013 |
Normales |
April 2014 |
|
2012 |
Consolidadas |
No publicado en BORME |
|
2012 |
Normales |
February 2013 |
|
2011 |
Consolidadas |
January 2013 |
|
2011 |
Normales |
February 2013 |
|
2010 |
Consolidadas |
January 2013 |
|
2010 |
Normales |
February 2012 |
|
2009 |
Consolidadas |
October 2010 |
|
2009 |
Normales |
October 2010 |
|
2008 |
Consolidadas |
July 2010 |
|
2008 |
Normales |
June 2010 |
|
2007 |
Consolidadas |
October 2008 |
|
2007 |
Normales |
October 2008 |
|
2006 |
Consolidadas |
September 2007 |
|
2006 |
Normales |
September 2007 |
|
2005 |
Consolidadas |
September 2006 |
|
2005 |
Normales |
September 2006 |
|
2004 |
Consolidadas |
September 2005 |
|
2004 |
Normales |
September 2005 |
|
2003 |
Normales |
October 2004 |
|
2003 |
Normales |
October 2004 |
|
2002 |
Consolidadas |
October 2003 |
|
2002 |
Normales |
October 2003 |
|
2001 |
Normales |
September 2002 |
|
2000 |
Normales |
October 2001 |
|
1999 |
Normales |
September 2000 |
|
1998 |
Normales |
January 2000 |
|
1997 |
Normales |
August 1998 |
The data in the report
regarding the last Company Accounts submitted by the company is taken from the TRADE
REGISTER serving the region in which the company's address is located
28/02/2017
> Normal format Balance in accordance with the New
Accounting Plan 2007
Information
corresponding to the fiscal year
2017 2016 2015 2014 2013 is taken from information
submitted to the TRADE REGISTER. Data corresponding to fiscal years before
2017 2016 2015 2014 2013 has been compiled based on
the equivalence criteria stipulated in Act JUS/206/2009. Where the provisions
of the Act did not establish relevant equivalence criteria. To view details on
the methodology.
|
|
ORIGINAL |
ORIGINAL |
ORIGINAL |
ORIGINAL |
ORIGINAL |
|
|
Assets |
2017 |
2016 |
2015 |
2014 |
2013 |
|
|
A) NON-CURRENT ASSETS: 11000 |
62.401.373,00 |
58.713.321,00 |
63.564.516,00 |
70.852.345,00 |
63.470.300,00 |
|
|
I. Intangible fixed assets : 11100 |
7.241.147,00 |
3.626.468,00 |
2.333.196,00 |
2.239.393,00 |
2.018.039,00 |
|
|
1. Development:
11110 |
0,00 |
0,00 |
0,00 |
0,00 |
0,00 |
|
|
2. Concessions:
11120 |
0,00 |
0,00 |
0,00 |
0,00 |
0,00 |
|
|
3. Patents, licencing,
trade marks and similar: 11130 |
408.607,00 |
496.421,00 |
486.680,00 |
422.596,00 |
0,00 |
|
|
4. Goodwill:
11140 |
0,00 |
0,00 |
0,00 |
0,00 |
0,00 |
|
|
5. IT applications:
11150 |
6.688.821,00 |
2.895.745,00 |
1.521.383,00 |
1.401.082,00 |
1.287.021,00 |
|
|
6. Investigation:
11160 |
0,00 |
0,00 |
0,00 |
0,00 |
0,00 |
|
|
7. Intellectual
property: 11180 |
0,00 |
0,00 |
0,00 |
0,00 |
0,00 |
|
|
8. Greenhouse gas
emission allowance: 11190 |
0,00 |
0,00 |
0,00 |
0,00 |
0,00 |
|
|
9. Other intangible fixed
assets. : 11170 |
143.719,00 |
234.302,00 |
325.132,00 |
415.715,00 |
731.018,00 |
|
|
II. Tangible fixed assets : 11200 |
25.086.721,00 |
28.167.128,00 |
33.447.211,00 |
39.375.717,00 |
41.333.243,00 |
|
|
1. Land and buildings:
11210 |
8.192.351,00 |
8.452.455,00 |
8.712.867,00 |
8.972.569,00 |
9.232.917,00 |
|
|
2. Technical
installations and other tangible fixed assets: 11220 |
13.321.810,00 |
19.714.673,00 |
24.734.344,00 |
29.394.485,00 |
32.100.326,00 |
|
|
3. Tangible asset in
progress and advances: 11230 |
3.572.560,00 |
0,00 |
0,00 |
1.008.663,00 |
0,00 |
|
|
III. Real estate investment: 11300 |
0,00 |
0,00 |
0,00 |
0,00 |
0,00 |
|
|
1. Land: 11310 |
0,00 |
0,00 |
0,00 |
0,00 |
0,00 |
|
|
2. Buildings:
11320 |
0,00 |
0,00 |
0,00 |
0,00 |
0,00 |
|
|
IV. Long-term investments in Group
companies and associates : 11400 |
26.495.312,00 |
22.896.697,00 |
23.530.349,00 |
20.985.523,00 |
15.965.770,00 |
|
|
1. Equity instruments:
11410 |
9.833.931,00 |
12.576.141,00 |
13.512.444,00 |
12.485.523,00 |
9.965.770,00 |
|
|
2. Credits to
businesses: 11420 |
16.661.381,00 |
10.320.556,00 |
10.017.905,00 |
8.500.000,00 |
6.000.000,00 |
|
|
3. Debt securities:
11430 |
0,00 |
0,00 |
0,00 |
0,00 |
0,00 |
|
|
4. Derivatives :
11440 |
0,00 |
0,00 |
0,00 |
0,00 |
0,00 |
|
|
5. Other financial
assets : 11450 |
0,00 |
0,00 |
0,00 |
0,00 |
0,00 |
|
|
6. Other investments:
11460 |
0,00 |
0,00 |
0,00 |
0,00 |
0,00 |
|
|
V. Long-term financial investments:
11500 |
1.717.708,00 |
1.931.849,00 |
1.916.889,00 |
1.917.442,00 |
1.879.959,00 |
|
|
1. Equity instruments:
11510 |
60.102,00 |
60.102,00 |
60.102,00 |
60.102,00 |
60.102,00 |
|
|
2. Credits to third
parties : 11520 |
42.232,00 |
0,00 |
16.000,00 |
0,00 |
0,00 |
|
|
3. Debt securities:
11530 |
0,00 |
0,00 |
0,00 |
0,00 |
0,00 |
|
|
4. Derivatives :
11540 |
0,00 |
0,00 |
0,00 |
0,00 |
0,00 |
|
|
5. Other financial
assets : 11550 |
1.615.374,00 |
1.871.747,00 |
1.840.786,00 |
1.857.340,00 |
1.819.857,00 |
|
|
6. Other investments:
11560 |
0,00 |
0,00 |
0,00 |
0,00 |
0,00 |
|
|
VII. Non-current trade debts : 11700 |
0,00 |
0,00 |
0,00 |
0,00 |
0,00 |
|
|
VI. Assets for deferred tax : 11600 |
1.860.485,00 |
2.091.179,00 |
2.336.871,00 |
6.334.269,00 |
2.273.289,00 |
|
|
B) CURRENT ASSETS: 12000 |
216.417.112,00 |
209.105.235,00 |
189.053.510,00 |
170.728.209,00 |
173.757.968,00 |
|
|
I. Non-current assets held for sale :
12100 |
0,00 |
0,00 |
0,00 |
0,00 |
0,00 |
|
|
II. Stocks: 12200 |
72.401.149,00 |
71.314.853,00 |
69.714.993,00 |
66.405.562,00 |
82.268.561,00 |
|
|
1. Commercial:
12210 |
72.401.149,00 |
22.994.244,00 |
25.801.888,00 |
26.160.092,00 |
32.038.935,00 |
|
|
2. Primary material
and other supplies: 12220 |
0,00 |
11.470.288,00 |
13.162.122,00 |
8.516.891,00 |
9.474.813,00 |
|
|
a)
Long-term primary material and other supplies: 12221 |
0,00 |
0,00 |
0,00 |
0,00 |
0,00 |
|
|
b) Short-term primary material and other supplies: 12222 |
0,00 |
0,00 |
0,00 |
0,00 |
0,00 |
|
|
3. Work in progress:
12230 |
0,00 |
546.351,00 |
729.802,00 |
2.337.561,00 |
4.395.952,00 |
|
|
a) Of long-term production cycle : 12231 |
0,00 |
0,00 |
0,00 |
0,00 |
0,00 |
|
|
b)
Of short-term production cycle : 12232 |
0,00 |
546.351,00 |
729.802,00 |
2.337.561,00 |
4.395.952,00 |
|
|
4. Finished goods:
12240 |
0,00 |
35.378.850,00 |
29.305.512,00 |
29.391.019,00 |
36.358.862,00 |
|
|
a) Of long-term production cycle : 12241 |
0,00 |
0,00 |
0,00 |
0,00 |
0,00 |
|
|
b) Of short-term production cycle : 12242 |
0,00 |
35.378.850,00 |
29.305.512,00 |
29.391.019,00 |
36.358.862,00 |
|
|
5. By-products,
residues and recycled materials: 12250 |
0,00 |
0,00 |
0,00 |
0,00 |
0,00 |
|
|
6. Advances to
suppliers: 12260 |
0,00 |
925.120,00 |
715.670,00 |
0,00 |
0,00 |
|
|
III. Trade debtors and others receivable accounts:
12300 |
92.316.041,00 |
95.294.630,00 |
100.574.493,00 |
87.121.596,00 |
75.090.409,00 |
|
|
1. Trade debtors /
accounts receivable: 12310 |
32.480.697,00 |
19.058.206,00 |
35.022.463,00 |
34.327.613,00 |
37.982.977,00 |
|
|
a) Long-term receivables from sales and services supplied : 12311 |
0,00 |
0,00 |
0,00 |
0,00 |
0,00 |
|
|
b) Customers for sales and provisions of services : 12312 |
32.480.697,00 |
19.058.206,00 |
35.022.463,00 |
34.327.613,00 |
37.982.977,00 |
|
|
2. Customers, Group
companies and associates : 12320 |
59.090.390,00 |
76.003.677,00 |
65.298.181,00 |
52.671.791,00 |
37.015.519,00 |
|
|
3. Other accounts receivable:
12330 |
0,00 |
0,00 |
0,00 |
0,00 |
0,00 |
|
|
4. Personnel:
12340 |
19.163,00 |
22.623,00 |
356,00 |
101.989,00 |
91.913,00 |
|
|
5. Assets for deferred
tax: 12350 |
0,00 |
0,00 |
0,00 |
0,00 |
0,00 |
|
|
6. Other debtors,
including tax and social security: 12360 |
725.791,00 |
210.124,00 |
253.494,00 |
20.203,00 |
0,00 |
|
|
7. Called up share
capital: 12370 |
0,00 |
0,00 |
0,00 |
0,00 |
0,00 |
|
|
IV. Short-term investments in Group
companies and associates: 12400 |
2.684.605,00 |
3.308.666,00 |
554.725,00 |
1.915.028,00 |
1.969.541,00 |
|
|
1. Equity instruments:
12410 |
0,00 |
0,00 |
0,00 |
0,00 |
0,00 |
|
|
2. Credits to
businesses: 12420 |
2.684.605,00 |
3.308.666,00 |
554.725,00 |
1.915.028,00 |
1.969.541,00 |
|
|
3. Debt securities:
12430 |
0,00 |
0,00 |
0,00 |
0,00 |
0,00 |
|
|
4. Derivatives :
12440 |
0,00 |
0,00 |
0,00 |
0,00 |
0,00 |
|
|
5. Other financial
assets : 12450 |
0,00 |
0,00 |
0,00 |
0,00 |
0,00 |
|
|
6. Other investments:
12460 |
0,00 |
0,00 |
0,00 |
0,00 |
0,00 |
|
|
V. Short-term financial investments :
12500 |
88.439,00 |
8.057.089,00 |
6.159.858,00 |
6.163.439,00 |
8.448.106,00 |
|
|
1. Equity instruments:
12510 |
0,00 |
0,00 |
0,00 |
0,00 |
0,00 |
|
|
2. Credits to
businesses: 12520 |
49.647,00 |
16.000,00 |
48.000,00 |
0,00 |
216.750,00 |
|
|
3. Debt securities:
12530 |
0,00 |
0,00 |
0,00 |
0,00 |
0,00 |
|
|
4. Derivatives :
12540 |
0,00 |
0,00 |
0,00 |
0,00 |
0,00 |
|
|
5. Other financial
assets : 12550 |
38.792,00 |
8.041.089,00 |
6.111.858,00 |
6.163.439,00 |
8.231.356,00 |
|
|
6. Other investments:
12560 |
0,00 |
0,00 |
0,00 |
0,00 |
0,00 |
|
|
VI. Short-term accruals: 12600 |
419.288,00 |
683.031,00 |
188.994,00 |
441.008,00 |
1.228.956,00 |
|
|
VII. Cash and other equivalent liquid
assets : 12700 |
48.507.590,00 |
30.446.966,00 |
11.860.446,00 |
8.681.576,00 |
4.752.395,00 |
|
|
1. Treasury:
12710 |
48.507.590,00 |
30.446.966,00 |
11.860.446,00 |
8.681.576,00 |
4.752.395,00 |
|
|
2. Other equivalent
liquid assets: 12720 |
0,00 |
0,00 |
0,00 |
0,00 |
0,00 |
|
|
TOTAL ASSETS (A + B) : 10000 |
278.818.485,00 |
267.818.556,00 |
252.618.026,00 |
241.580.554,00 |
237.228.268,00 |
|
|
|
ORIGINAL |
ORIGINAL |
ORIGINAL |
ORIGINAL |
ORIGINAL |
|
|
Liabilities and Net Worth |
2017 |
2016 |
2015 |
2014 |
2013 |
|
|
A) NET WORTH: 20000 |
217.869.932,00 |
208.233.467,00 |
184.540.061,00 |
174.727.246,00 |
164.479.030,00 |
|
|
A-1) Shareholders' equity: 21000 |
217.290.575,00 |
207.560.591,00 |
183.757.847,00 |
173.845.565,00 |
163.448.816,00 |
|
|
I. Capital: 21100 |
18.030.000,00 |
18.030.000,00 |
18.030.000,00 |
18.030.000,00 |
18.030.000,00 |
|
|
1. Registered capital
: 21110 |
18.030.000,00 |
18.030.000,00 |
18.030.000,00 |
18.030.000,00 |
18.030.000,00 |
|
|
2. (Uncalled capital):
21120 |
0,00 |
0,00 |
0,00 |
0,00 |
0,00 |
|
|
II. Share premium: 21200 |
300.506,00 |
300.506,00 |
300.506,00 |
300.506,00 |
300.506,00 |
|
|
III. Reserves: 21300 |
169.230.085,00 |
162.336.320,00 |
134.090.985,00 |
125.118.312,00 |
108.580.096,00 |
|
|
1. Legal and
statutory: 21310 |
3.606.000,00 |
3.606.000,00 |
3.606.000,00 |
3.606.000,00 |
3.606.000,00 |
|
|
2. Other reserves:
21320 |
165.624.085,00 |
158.730.320,00 |
130.484.985,00 |
121.512.312,00 |
104.974.096,00 |
|
|
3. Revaluation
reserves: 21330 |
0,00 |
0,00 |
0,00 |
0,00 |
0,00 |
|
|
2. Capitalisation
Reserves: 21350 |
0,00 |
0,00 |
0,00 |
0,00 |
0,00 |
|
|
IV. (Common stock equity): 21400 |
0,00 |
0,00 |
0,00 |
0,00 |
0,00 |
|
|
V. Results from previous periods:
21500 |
0,00 |
0,00 |
0,00 |
0,00 |
0,00 |
|
|
1. Brought forward:
21510 |
0,00 |
0,00 |
0,00 |
0,00 |
0,00 |
|
|
2. (Negative results
from previous periods): 21520 |
0,00 |
0,00 |
0,00 |
0,00 |
0,00 |
|
|
VI. Other shareholders' contributions:
21600 |
0,00 |
0,00 |
0,00 |
0,00 |
0,00 |
|
|
VII. Result of the period: 21700 |
29.729.984,00 |
26.893.765,00 |
31.336.356,00 |
30.396.747,00 |
36.538.215,00 |
|
|
VIII. (Interim dividend): 21800 |
0,00 |
0,00 |
0,00 |
0,00 |
0,00 |
|
|
IX. Other net worth instruments:
21900 |
0,00 |
0,00 |
0,00 |
0,00 |
0,00 |
|
|
A-2) Adjustments due to changes in value: 22000 |
0,00 |
0,00 |
0,00 |
0,00 |
0,00 |
|
|
I. Financial assets held for sale:
22100 |
0,00 |
0,00 |
0,00 |
0,00 |
0,00 |
|
|
II. Hedge operations: 22200 |
0,00 |
0,00 |
0,00 |
0,00 |
0,00 |
|
|
III. Linked non-current assets and
liabilities held for sale : 22300 |
0,00 |
0,00 |
0,00 |
0,00 |
0,00 |
|
|
IV. Exchange rate difference: 22400 |
0,00 |
0,00 |
0,00 |
0,00 |
0,00 |
|
|
V. Other: 22500 |
0,00 |
0,00 |
0,00 |
0,00 |
0,00 |
|
|
A-3) Received subsidies, donations and
legacies: 23000 |
579.357,00 |
672.876,00 |
782.214,00 |
881.682,00 |
1.030.213,00 |
|
|
B) NON-CURRENT LIABILITIES: 31000 |
16.666.263,00 |
16.348.502,00 |
13.306.242,00 |
14.869.194,00 |
11.598.825,00 |
|
|
I. Long-term provisions: 31100 |
16.452.633,00 |
12.374.829,00 |
8.336.350,00 |
6.704.242,00 |
0,00 |
|
|
1. Long-term employee
benefits liability: 31110 |
0,00 |
0,00 |
0,00 |
0,00 |
0,00 |
|
|
2. Environmental
actions: 31120 |
0,00 |
0,00 |
0,00 |
0,00 |
0,00 |
|
|
3. Restructuring
provisions: 31130 |
0,00 |
0,00 |
0,00 |
0,00 |
0,00 |
|
|
4. Other provisions:
31140 |
16.452.633,00 |
12.374.829,00 |
8.336.350,00 |
6.704.242,00 |
0,00 |
|
|
II Long-term creditors: 31200 |
20.509,00 |
3.734.327,00 |
4.658.334,00 |
7.706.921,00 |
11.030.230,00 |
|
|
1. Liabilities and
other securities: 31210 |
0,00 |
0,00 |
0,00 |
0,00 |
0,00 |
|
|
2. Amounts owed to
credit institutions: 31220 |
0,00 |
1.704.167,00 |
4.658.334,00 |
7.612.501,00 |
10.566.668,00 |
|
|
3. Creditors from
financial leasing: 31230 |
20.509,00 |
0,00 |
0,00 |
0,00 |
7.160,00 |
|
|
4. Derivatives :
31240 |
0,00 |
2.030.160,00 |
0,00 |
0,00 |
0,00 |
|
|
5. Other financial
liabilities : 31250 |
0,00 |
0,00 |
0,00 |
94.420,00 |
456.401,00 |
|
|
III. Long-term debts with Group companies
and associates: 31300 |
0,00 |
0,00 |
0,00 |
0,00 |
0,00 |
|
|
IV. Liabilities for deferred tax:
31400 |
193.121,00 |
224.294,00 |
266.397,00 |
377.864,00 |
441.520,00 |
|
|
V. Long-term accruals: 31500 |
0,00 |
15.052,00 |
45.161,00 |
80.168,00 |
127.075,00 |
|
|
VI. Non-current trade creditors :
31600 |
0,00 |
0,00 |
0,00 |
0,00 |
0,00 |
|
|
VII. Special long-term debts : 31700 |
0,00 |
0,00 |
0,00 |
0,00 |
0,00 |
|
|
C) CURRENT LIABILITIES : 32000 |
44.282.290,00 |
43.236.587,00 |
54.771.723,00 |
51.984.114,00 |
61.150.414,00 |
|
|
I. Liabilities linked to non-current assets
held for sale: 32100 |
0,00 |
0,00 |
0,00 |
0,00 |
0,00 |
|
|
II. Short-term provisions: 32200 |
0,00 |
0,00 |
0,00 |
0,00 |
0,00 |
|
|
1. Provisions from
greenhouse gas emission allowance: 32210 |
0,00 |
0,00 |
0,00 |
0,00 |
0,00 |
|
|
2. Other provisions:
32220 |
0,00 |
0,00 |
0,00 |
0,00 |
0,00 |
|
|
III. Short-term creditors : 32300 |
5.858.402,00 |
5.691.403,00 |
12.436.450,00 |
10.908.882,00 |
14.632.363,00 |
|
|
1. Liabilities and
other securities: 32310 |
0,00 |
0,00 |
0,00 |
0,00 |
0,00 |
|
|
2. Amounts owed to
credit institutions: 32320 |
1.705.065,00 |
2.961.905,00 |
2.999.716,00 |
5.978.416,00 |
11.185.497,00 |
|
|
3. Creditors from
financial leasing: 32330 |
9.466,00 |
0,00 |
0,00 |
7.160,00 |
9.547,00 |
|
|
4. Derivatives :
32340 |
2.030.160,00 |
1.496.678,00 |
0,00 |
0,00 |
0,00 |
|
|
5. Other financial
liabilities : 32350 |
2.113.711,00 |
1.232.820,00 |
9.436.734,00 |
4.923.306,00 |
3.437.320,00 |
|
|
IV. Short-term debts with Group companies
and associates: 32400 |
0,00 |
0,00 |
0,00 |
0,00 |
0,00 |
|
|
V. Trade creditors and other accounts
payable: 32500 |
38.423.888,00 |
37.545.184,00 |
42.335.273,00 |
41.075.231,00 |
46.518.051,00 |
|
|
1. Suppliers:
32510 |
26.367.861,00 |
27.086.422,00 |
29.460.924,00 |
24.630.162,00 |
27.961.089,00 |
|
|
a) Long-term debts : 32511 |
0,00 |
0,00 |
0,00 |
0,00 |
0,00 |
|
|
b) Short-term debts : 32512 |
26.367.861,00 |
27.086.422,00 |
29.460.924,00 |
24.630.162,00 |
27.961.089,00 |
|
|
2. Suppliers, Group
companies and associates: 32520 |
0,00 |
0,00 |
0,00 |
0,00 |
0,00 |
|
|
3. Other creditors:
32530 |
4.249.447,00 |
4.245.258,00 |
3.690.910,00 |
2.838.553,00 |
4.733.322,00 |
|
|
4. Personnel
(remuneration due): 32540 |
2.808.256,00 |
2.688.752,00 |
2.531.768,00 |
2.332.488,00 |
2.257.680,00 |
|
|
5. Liabilities for
current tax: 32550 |
3.261.278,00 |
1.777.903,00 |
4.858.739,00 |
9.166.990,00 |
9.261.369,00 |
|
|
6. Other accounts
payable to Public Administrations.: 32560 |
1.737.046,00 |
1.746.849,00 |
1.792.932,00 |
2.107.038,00 |
2.304.590,00 |
|
|
7. Advances from
clients: 32570 |
0,00 |
0,00 |
0,00 |
0,00 |
0,00 |
|
|
VI. Short-term accruals: 32600 |
0,00 |
0,00 |
0,00 |
0,00 |
0,00 |
|
|
VII. Special short-term debts : 32700 |
0,00 |
0,00 |
0,00 |
0,00 |
0,00 |
|
|
TOTAL NET WORTH AND LIABILITIES (A + B + C) : 30000 |
278.818.485,00 |
267.818.556,00 |
252.618.026,00 |
241.580.554,00 |
237.228.268,00 |
|
|
|
ORIGINAL |
ORIGINAL |
ORIGINAL |
ORIGINAL |
ORIGINAL |
|
|
Profit and Loss |
2017 |
2016 |
2015 |
2014 |
2013 |
|
|
1. Net turnover: 40100 |
257.088.071,00 |
260.164.644,00 |
253.514.766,00 |
251.858.623,00 |
253.930.404,00 |
|
|
a) Sales: 40110 |
257.088.071,00 |
260.114.644,00 |
253.514.766,00 |
251.858.623,00 |
253.930.404,00 |
|
|
b) Rendering of services: 40120 |
0,00 |
50.000,00 |
0,00 |
0,00 |
0,00 |
|
|
c) Income of financial nature of holding companies:
40130 |
0,00 |
0,00 |
0,00 |
0,00 |
0,00 |
|
|
2. Changes in stocks of finished goods and work in progress:
40200 |
3.392.883,00 |
5.889.887,00 |
-1.693.266,00 |
-9.026.234,00 |
12.186.172,00 |
|
|
3. Works carried out by the company for its assets: 40300 |
0,00 |
0,00 |
0,00 |
0,00 |
0,00 |
|
|
4. Supplies : 40400 |
-101.995.354,00 |
-111.151.754,00 |
-98.997.208,00 |
-89.846.509,00 |
-110.053.345,00 |
|
|
a) Stock consumption: 40410 |
-54.690.237,00 |
-59.914.492,00 |
-56.665.797,00 |
-53.215.663,00 |
-66.874.972,00 |
|
|
b) Consumption of raw materials and
miscellaneous consumable ones: 40420 |
-36.426.529,00 |
-39.910.468,00 |
-35.168.785,00 |
-28.682.898,00 |
-34.123.519,00 |
|
|
c) Works carried out by other companies:
40430 |
-10.878.588,00 |
-11.326.794,00 |
-7.162.626,00 |
-7.947.948,00 |
-9.054.855,00 |
|
|
d) Impairment of stock, primary material and
other supplies: 40440 |
0,00 |
0,00 |
0,00 |
0,00 |
0,00 |
|
|
5. Other operating income: 40500 |
985.423,00 |
1.796.158,00 |
1.147.002,00 |
1.337.110,00 |
1.994.382,00 |
|
|
a) Auxiliary income and other from current management:
40510 |
894.913,00 |
1.689.393,00 |
988.316,00 |
1.278.324,00 |
1.914.212,00 |
|
|
b) Operation subsidies included in the
Period's result: 40520 |
90.510,00 |
106.765,00 |
158.685,00 |
58.786,00 |
80.170,00 |
|
|
6. Personnel costs: 40600 |
-54.809.789,00 |
-53.917.637,00 |
-52.411.330,00 |
-50.846.491,00 |
-50.128.841,00 |
|
|
a) Wages, salaries et al.: 40610 |
-44.125.700,00 |
-43.401.375,00 |
-41.912.135,00 |
-40.764.780,00 |
-40.098.433,00 |
|
|
b) Social security costs: 40620 |
-10.684.089,00 |
-10.516.262,00 |
-10.499.195,00 |
-10.081.711,00 |
-10.030.407,00 |
|
|
c) Provisions : 40630 |
0,00 |
0,00 |
0,00 |
0,00 |
0,00 |
|
|
7. Other operating costs: 40700 |
-53.425.239,00 |
-54.218.646,00 |
-49.940.331,00 |
-46.878.890,00 |
-44.350.881,00 |
|
|
a) External services: 40710 |
-52.998.116,00 |
-53.085.332,00 |
-49.594.172,00 |
-46.622.451,00 |
-43.783.711,00 |
|
|
b) Taxes: 40720 |
-294.125,00 |
-289.394,00 |
-316.661,00 |
-234.321,00 |
-280.356,00 |
|
|
c) Losses, impairments and variation in
provisions from trade operations : 40730 |
-132.998,00 |
-843.920,00 |
-29.499,00 |
-22.119,00 |
-32.128,00 |
|
|
d) Other current management expenditure :
40740 |
0,00 |
0,00 |
0,00 |
0,00 |
-254.686,00 |
|
|
e) Expenses due to greenhouse gas
emissions: 40750 |
0,00 |
0,00 |
0,00 |
0,00 |
0,00 |
|
|
8. Amortisation of fixed assets: 40800 |
-8.279.719,00 |
-9.307.968,00 |
-9.529.533,00 |
-9.543.252,00 |
-11.378.390,00 |
|
|
9. Allocation of subsidies of non-financial fixed assets and
other: 40900 |
129.486,00 |
151.442,00 |
210.934,00 |
212.188,00 |
214.697,00 |
|
|
10. Excess provisions : 41000 |
0,00 |
0,00 |
0,00 |
0,00 |
0,00 |
|
|
11. Impairment and result of transfers of fixed assets:
41100 |
-351.686,00 |
-190.831,00 |
-89.275,00 |
505.652,00 |
-101.714,00 |
|
|
a) Impairment and losses : 41110 |
-169.108,00 |
-160.083,00 |
0,00 |
0,00 |
0,00 |
|
|
b) Results for transfers and other :
41120 |
-182.578,00 |
-30.748,00 |
-89.275,00 |
505.652,00 |
-101.714,00 |
|
|
c) Impairment and profit due to disposals
of assets of holding companies: 41130 |
0,00 |
0,00 |
0,00 |
0,00 |
0,00 |
|
|
12. Negative difference in combined businesses: 41200 |
0,00 |
0,00 |
0,00 |
0,00 |
0,00 |
|
|
13. Other results : 41300 |
-8.593,00 |
0,00 |
0,00 |
0,00 |
0,00 |
|
|
A.1) OPERATING INCOME (1 + 2 + 3 + 4 + 5 + 6 + 7 + 8 + 9 + 10 +
11 + 12 + 13) : 49100 |
42.725.483,00 |
39.215.295,00 |
42.211.758,00 |
47.772.198,00 |
52.312.485,00 |
|
|
14. Financial income : 41400 |
2.736.336,00 |
2.559.431,00 |
2.513.471,00 |
1.860.471,00 |
1.578.541,00 |
|
|
a) Of shares in equity instruments :
41410 |
2.736.336,00 |
2.559.431,00 |
2.513.471,00 |
1.860.471,00 |
1.578.541,00 |
|
|
a 1) In Group
companies and associates: 41411 |
2.683.489,00 |
2.471.995,00 |
2.341.593,00 |
1.643.365,00 |
1.090.458,00 |
|
|
a 2) In third parties:
41412 |
52.847,00 |
87.436,00 |
171.878,00 |
217.107,00 |
488.083,00 |
|
|
b) From negotiable securities and other
financial instruments : 41420 |
0,00 |
0,00 |
0,00 |
0,00 |
0,00 |
|
|
b 1) From Group
companies and associates : 41421 |
0,00 |
0,00 |
0,00 |
0,00 |
0,00 |
|
|
b 2) From third
parties : 41422 |
0,00 |
0,00 |
0,00 |
0,00 |
0,00 |
|
|
c) Allocation of financial subsidies,
donations and legacies : 41430 |
0,00 |
0,00 |
0,00 |
0,00 |
0,00 |
|
|
15. Financial expenditure: 41500 |
-27.343,00 |
-64.492,00 |
-448.247,00 |
-496.064,00 |
-651.298,00 |
|
|
a) Amounts owed to Group companies and
associates : 41510 |
0,00 |
0,00 |
0,00 |
0,00 |
0,00 |
|
|
b) For debts with third parties :
41520 |
-27.343,00 |
-64.492,00 |
-448.247,00 |
-496.064,00 |
-651.298,00 |
|
|
c) Stock renewal : 41530 |
0,00 |
0,00 |
0,00 |
0,00 |
0,00 |
|
|
16. Changes in fair value of financial instruments : 41600 |
0,00 |
-42.727,00 |
0,00 |
0,00 |
0,00 |
|
|
a) Trading book and other : 41610 |
0,00 |
-42.727,00 |
0,00 |
0,00 |
0,00 |
|
|
b) Allocation of financial assets held for
sale to the result for the period: 41620 |
0,00 |
0,00 |
0,00 |
0,00 |
0,00 |
|
|
17. Exchange rate differences : 41700 |
175.024,00 |
91.363,00 |
2.541.164,00 |
-405.779,00 |
35.765,00 |
|
|
18. Impairment and result for transfers of financial
instruments: 41800 |
-6.820.014,00 |
-5.094.618,00 |
-1.605.187,00 |
-5.867.992,00 |
-2.236.330,00 |
|
|
a) Impairment and losses : 41810 |
-6.820.014,00 |
-5.094.618,00 |
-1.605.187,00 |
-5.867.992,00 |
0,00 |
|
|
b) Results for transfers and other :
41820 |
0,00 |
0,00 |
0,00 |
0,00 |
-2.236.330,00 |
|
|
19. Other financial income and expenditure: 42100 |
0,00 |
0,00 |
0,00 |
0,00 |
0,00 |
|
|
a) Incorporation of financial expenditure
to assets: 42110 |
0,00 |
0,00 |
0,00 |
0,00 |
0,00 |
|
|
b) Financial income from arrangement with
creditors: 42120 |
0,00 |
0,00 |
0,00 |
0,00 |
0,00 |
|
|
c) Other income and expenditure:
42130 |
0,00 |
0,00 |
0,00 |
0,00 |
0,00 |
|
|
A.2) FINANCIAL REVENUE (14+15+16+17+18+19) : 49200 |
-3.935.997,00 |
-2.551.043,00 |
3.001.201,00 |
-4.909.364,00 |
-1.273.322,00 |
|
|
A.3) NET RESULT BEFORE TAXES (A.1+A.2) : 49300 |
38.789.486,00 |
36.664.252,00 |
45.212.960,00 |
42.862.833,00 |
51.039.162,00 |
|
|
20. Income taxes: 41900 |
-9.059.502,00 |
-9.770.487,00 |
-13.876.604,00 |
-12.466.087,00 |
-14.500.948,00 |
|
|
A.4) PROFIT AFTER TAXES (A.3+20) : 49400 |
29.729.984,00 |
26.893.765,00 |
31.336.356,00 |
30.396.747,00 |
36.538.215,00 |
|
|
21. Result of the year coming from interrupted operations :
42000 |
0,00 |
0,00 |
0,00 |
0,00 |
0,00 |
|
|
A.5) RESULT OF THE PERIOD (A.4+21) : 49500 |
29.729.984,00 |
26.893.765,00 |
31.336.356,00 |
30.396.747,00 |
36.538.215,00 |
|
> Normal Balance Sheet under the rules of the 1990 General
Accounting Plan (repealed since 1st January of 2008)
Information
corresponding to the fiscal year
2017 2016 2015 2014 2013 has been compiled based on
the equivalence criteria stipulated in Act JUS/206/2009. Where the provisions
of the Act did not establish relevant equivalence criteriaTo view details on
the methodology 2017 2016 2015 2014 2013 is taken
from information submitted to the TRADE REGISTER.
|
|
EQUIVALENCIA |
EQUIVALENCIA |
EQUIVALENCIA |
EQUIVALENCIA |
EQUIVALENCIA |
|
|
ASSETS |
2017 |
2016 |
2015 |
2014 |
2013 |
|
|
A) SHAREHOLDERS (PARTNERS) BY UNCALLED SUSCRIBED CAPITAL: |
0,00 |
0,00 |
0,00 |
0,00 |
0,00 |
|
|
B) FIXED ASSETS: |
60.540.888,00 |
56.622.142,00 |
61.227.645,00 |
64.518.076,00 |
61.197.011,00 |
|
|
I. Formation expenses: |
0,00 |
0,00 |
0,00 |
0,00 |
0,00 |
|
|
II. Intangible fixed assets: |
7.241.147,00 |
3.626.468,00 |
2.333.196,00 |
2.239.393,00 |
2.018.039,00 |
|
|
1. Research and
development costs: |
0,00 |
0,00 |
0,00 |
0,00 |
0,00 |
|
|
2. Concessions,
patents, licences, trademarks et al.: |
408.607,00 |
496.421,00 |
486.680,00 |
422.596,00 |
0,00 |
|
|
3. Goodwill: |
0,00 |
0,00 |
0,00 |
0,00 |
0,00 |
|
|
4. Key money paid for
premises: |
143.719,00 |
234.302,00 |
325.132,00 |
415.715,00 |
731.018,00 |
|
|
5. Software: |
6.688.821,00 |
2.895.745,00 |
1.521.383,00 |
1.401.082,00 |
1.287.021,00 |
|
|
6. Assets under
capital leases: |
0,00 |
0,00 |
0,00 |
0,00 |
0,00 |
|
|
7. Payments on
account: |
0,00 |
0,00 |
0,00 |
0,00 |
0,00 |
|
|
8. Provisions: |
0,00 |
0,00 |
0,00 |
0,00 |
0,00 |
|
|
9. Accumulated
depreciation: |
0,00 |
0,00 |
0,00 |
0,00 |
0,00 |
|
|
III. Tangible fixed assets: |
25.086.721,00 |
28.167.128,00 |
33.447.211,00 |
39.375.717,00 |
41.333.243,00 |
|
|
1. Land and
construction: |
8.192.351,00 |
8.452.455,00 |
8.712.867,00 |
8.972.569,00 |
9.232.917,00 |
|
|
2. Technical
installations and machinery: |
11.351.972,00 |
16.799.551,00 |
21.076.985,00 |
25.048.051,00 |
27.353.791,00 |
|
|
3. Other
installations, tools and furniture: |
990.474,00 |
1.465.782,00 |
1.838.993,00 |
2.185.474,00 |
2.386.653,00 |
|
|
4. Payments on account
and tangible fixed assets under construction: |
3.572.560,00 |
0,00 |
0,00 |
1.008.663,00 |
0,00 |
|
|
5. Other tangible
assets: |
979.364,00 |
1.449.340,00 |
1.818.366,00 |
2.160.960,00 |
2.359.882,00 |
|
|
6. Provisions: |
0,00 |
0,00 |
0,00 |
0,00 |
0,00 |
|
|
7. Accumulated
depreciation: |
0,00 |
0,00 |
0,00 |
0,00 |
0,00 |
|
|
IV. Financial investments: |
28.213.020,00 |
24.828.546,00 |
25.447.238,00 |
22.902.966,00 |
17.845.729,00 |
|
|
1. Equity investments
in group companies: |
9.833.931,00 |
12.576.141,00 |
13.512.444,00 |
12.485.523,00 |
9.965.770,00 |
|
|
2. Receivables from
group companies: |
16.661.381,00 |
10.320.556,00 |
10.017.905,00 |
8.500.000,00 |
6.000.000,00 |
|
|
3. Equity investment
in associated companies: |
0,00 |
0,00 |
0,00 |
0,00 |
0,00 |
|
|
4. Credits to
associated companies: |
0,00 |
0,00 |
0,00 |
0,00 |
0,00 |
|
|
5. Long-term
securities portfolio: |
60.102,00 |
60.102,00 |
60.102,00 |
60.102,00 |
60.102,00 |
|
|
6. Other receivables:
|
42.232,00 |
0,00 |
16.000,00 |
0,00 |
0,00 |
|
|
7. Long term guarantees
and deposits: |
1.615.374,00 |
1.871.747,00 |
1.840.786,00 |
1.857.340,00 |
1.819.857,00 |
|
|
8. Provisions: |
0,00 |
0,00 |
0,00 |
0,00 |
0,00 |
|
|
9. Long-term
receivables from public bodies: |
0,00 |
0,00 |
0,00 |
0,00 |
0,00 |
|
|
V. Own shares: |
0,00 |
0,00 |
0,00 |
0,00 |
0,00 |
|
|
VI. Long-term trade receivables: |
0,00 |
0,00 |
0,00 |
0,00 |
0,00 |
|
|
C) Deferred expenses: |
0,00 |
0,00 |
0,00 |
0,00 |
0,00 |
|
|
D) CURRENT ASSETS: |
218.277.597,00 |
211.196.414,00 |
191.390.381,00 |
177.062.478,00 |
176.031.257,00 |
|
|
I. Called-up share capital (not paid):
|
0,00 |
0,00 |
0,00 |
0,00 |
0,00 |
|
|
II. Stocks: |
72.401.149,00 |
71.314.853,00 |
69.714.993,00 |
66.405.562,00 |
82.268.561,00 |
|
|
1. Goods for resale:
|
72.401.149,00 |
22.994.244,00 |
25.801.888,00 |
26.160.092,00 |
32.038.935,00 |
|
|
2. Raw materials and other
consumables: |
0,00 |
11.470.288,00 |
13.162.122,00 |
8.516.891,00 |
9.474.813,00 |
|
|
3. Goods in process
and semifinished ones: |
0,00 |
546.351,00 |
729.802,00 |
2.337.561,00 |
4.395.952,00 |
|
|
4. Finished products:
|
0,00 |
35.378.850,00 |
29.305.512,00 |
29.391.019,00 |
36.358.862,00 |
|
|
5. Byproducts, scrap
and recovered materials: |
0,00 |
0,00 |
0,00 |
0,00 |
0,00 |
|
|
6. Payments on
account: |
0,00 |
925.120,00 |
715.670,00 |
0,00 |
0,00 |
|
|
7. Provisions: |
0,00 |
0,00 |
0,00 |
0,00 |
0,00 |
|
|
III. Debtors: |
94.176.526,00 |
97.385.809,00 |
102.911.364,00 |
93.455.865,00 |
77.363.698,00 |
|
|
1. Trade debtors /
accounts receivable: |
32.480.697,00 |
19.058.206,00 |
35.022.463,00 |
34.327.613,00 |
37.982.977,00 |
|
|
2. Accounts
receivable, Group companies: |
59.090.390,00 |
76.003.677,00 |
65.298.181,00 |
52.671.791,00 |
37.015.519,00 |
|
|
3. Accounts
receivable, associated companies: |
0,00 |
0,00 |
0,00 |
0,00 |
0,00 |
|
|
4. Other debtors:
|
0,00 |
0,00 |
0,00 |
0,00 |
0,00 |
|
|
5. Staff: |
19.163,00 |
22.623,00 |
356,00 |
101.989,00 |
91.913,00 |
|
|
6. Public bodies:
|
2.586.276,00 |
2.301.303,00 |
2.590.365,00 |
6.354.472,00 |
2.273.289,00 |
|
|
7. Provisions: |
0,00 |
0,00 |
0,00 |
0,00 |
0,00 |
|
|
IV. Short-term investments: |
2.773.044,00 |
11.365.755,00 |
6.714.583,00 |
8.078.467,00 |
10.417.646,00 |
|
|
1. Equity investments
in group companies: |
0,00 |
0,00 |
0,00 |
0,00 |
0,00 |
|
|
2. Receivables from group
companies: |
2.684.605,00 |
3.308.666,00 |
554.725,00 |
1.915.028,00 |
1.969.541,00 |
|
|
3. Equity investment
in associated companies: |
0,00 |
0,00 |
0,00 |
0,00 |
0,00 |
|
|
4. Credits to associated
companies: |
0,00 |
0,00 |
0,00 |
0,00 |
0,00 |
|
|
5. Short term
securities portfolio: |
0,00 |
0,00 |
0,00 |
0,00 |
0,00 |
|
|
6. Other receivables:
|
49.647,00 |
16.000,00 |
48.000,00 |
0,00 |
216.750,00 |
|
|
7. Shor term
guarantees and deposits: |
38.792,00 |
8.041.089,00 |
6.111.858,00 |
6.163.439,00 |
8.231.356,00 |
|
|
8. Provisions: |
0,00 |
0,00 |
0,00 |
0,00 |
0,00 |
|
|
V. Short-term treasury shares: |
0,00 |
0,00 |
0,00 |
0,00 |
0,00 |
|
|
VI. Cash at bank and in hand: |
48.507.590,00 |
30.446.966,00 |
11.860.446,00 |
8.681.576,00 |
4.752.395,00 |
|
|
VII. Prepayments and accrued income: |
419.288,00 |
683.031,00 |
188.994,00 |
441.008,00 |
1.228.956,00 |
|
|
GENERAL TOTAL (A + B + C + D): |
278.818.485,00 |
267.818.556,00 |
252.618.026,00 |
241.580.554,00 |
237.228.268,00 |
|
MERCANTILE REGISTRY.
|
|
EQUIVALENCIA |
EQUIVALENCIA |
EQUIVALENCIA |
EQUIVALENCIA |
EQUIVALENCIA |
|
|
LIABILITIES |
2017 |
2016 |
2015 |
2014 |
2013 |
|
|
A) EQUITY: |
219.494.542,00 |
211.289.292,00 |
183.992.511,00 |
174.110.069,00 |
163.757.880,00 |
|
|
I. Subscribed capital: |
18.030.000,00 |
18.030.000,00 |
18.030.000,00 |
18.030.000,00 |
18.030.000,00 |
|
|
II. Share premium: |
300.506,00 |
300.506,00 |
300.506,00 |
300.506,00 |
300.506,00 |
|
|
III. Revaluation reserves: |
0,00 |
0,00 |
0,00 |
0,00 |
0,00 |
|
|
IV. Reserves: |
171.434.052,00 |
166.065.021,00 |
134.325.649,00 |
125.382.816,00 |
108.889.160,00 |
|
|
1. Legal reserve:
|
3.606.000,00 |
3.606.000,00 |
3.606.000,00 |
3.606.000,00 |
3.606.000,00 |
|
|
2. Reserves for own
shares: |
0,00 |
0,00 |
0,00 |
0,00 |
0,00 |
|
|
3. Reserves for shares
of the controlling company: |
0,00 |
0,00 |
0,00 |
0,00 |
0,00 |
|
|
4. Statutory reserves:
|
0,00 |
0,00 |
0,00 |
0,00 |
0,00 |
|
|
5. Miscellaneous
reserves: |
167.828.052,00 |
162.459.021,00 |
130.719.649,00 |
121.776.816,00 |
105.283.160,00 |
|
|
6. Differences due to capital
adjustment to euros: |
0,00 |
0,00 |
0,00 |
0,00 |
0,00 |
|
|
V. Profit or loss brought forward: |
0,00 |
0,00 |
0,00 |
0,00 |
0,00 |
|
|
1. Retained earnings:
|
0,00 |
0,00 |
0,00 |
0,00 |
0,00 |
|
|
2. Prior year losses:
|
0,00 |
0,00 |
0,00 |
0,00 |
0,00 |
|
|
3. Partners'
contributions so as to compensate losses: |
0,00 |
0,00 |
0,00 |
0,00 |
0,00 |
|
|
VI. Profit or loss for the financial year:
|
29.729.984,00 |
26.893.765,00 |
31.336.356,00 |
30.396.747,00 |
36.538.215,00 |
|
|
VII. Interim dividend paid: |
0,00 |
0,00 |
0,00 |
0,00 |
0,00 |
|
|
VIII. Own shares for capital reduction:
|
0,00 |
0,00 |
0,00 |
0,00 |
0,00 |
|
|
B) Deferred income: |
405.550,00 |
471.013,00 |
547.550,00 |
617.177,00 |
721.149,00 |
|
|
1. Capital grants:
|
405.550,00 |
471.013,00 |
547.550,00 |
617.177,00 |
721.149,00 |
|
|
2. Unrealised exchange
gains: |
0,00 |
0,00 |
0,00 |
0,00 |
0,00 |
|
|
3. Other deferred
income: |
0,00 |
0,00 |
0,00 |
0,00 |
0,00 |
|
|
4. Public revenues to
distribute in several financial years: |
0,00 |
0,00 |
0,00 |
0,00 |
0,00 |
|
|
C) PROVISIONS FOR LIABILITIES AND CHARGES: |
16.452.633,00 |
12.374.829,00 |
8.336.350,00 |
6.704.242,00 |
0,00 |
|
|
1. Provisions for
pension fund and other similar obligations: |
0,00 |
0,00 |
0,00 |
0,00 |
0,00 |
|
|
2. Provisions for
taxes: |
0,00 |
0,00 |
0,00 |
0,00 |
0,00 |
|
|
3. Other provisions:
|
16.452.633,00 |
12.374.829,00 |
8.336.350,00 |
6.704.242,00 |
0,00 |
|
|
4. Reversion fund:
|
0,00 |
0,00 |
0,00 |
0,00 |
0,00 |
|
|
D) LONG TERM LIABILITIES: |
213.630,00 |
1.928.461,00 |
4.924.731,00 |
8.084.784,00 |
11.471.750,00 |
|
|
I. Issued debentures and other marketable
securities: |
0,00 |
0,00 |
0,00 |
0,00 |
0,00 |
|
|
1. Non-convertible
debentures: |
0,00 |
0,00 |
0,00 |
0,00 |
0,00 |
|
|
2. Convertible
debentures: |
0,00 |
0,00 |
0,00 |
0,00 |
0,00 |
|
|
3. Other debt
securities: |
0,00 |
0,00 |
0,00 |
0,00 |
0,00 |
|
|
II. Amounts owed to credit institutions:
|
20.509,00 |
1.704.167,00 |
4.658.334,00 |
7.612.501,00 |
10.573.828,00 |
|
|
1. Loans and other
liabilities: |
0,00 |
1.704.167,00 |
4.658.334,00 |
7.612.501,00 |
10.566.668,00 |
|
|
2. Long-term
liabilities from capital leases: |
20.509,00 |
0,00 |
0,00 |
0,00 |
7.160,00 |
|
|
III. Debts with companies of the group and
affiliated ones: |
0,00 |
0,00 |
0,00 |
0,00 |
0,00 |
|
|
1. Amounts owed to
group companies: |
0,00 |
0,00 |
0,00 |
0,00 |
0,00 |
|
|
2. Amounts owed to
associated companies: |
0,00 |
0,00 |
0,00 |
0,00 |
0,00 |
|
|
IV. Other creditors: |
193.121,00 |
224.294,00 |
266.397,00 |
472.283,00 |
897.921,00 |
|
|
1. Long-term bills of
exchange payable: |
0,00 |
0,00 |
0,00 |
0,00 |
0,00 |
|
|
2. Other creditors:
|
0,00 |
0,00 |
0,00 |
94.420,00 |
456.401,00 |
|
|
3. Long term guarantees
and deposits received: |
0,00 |
0,00 |
0,00 |
0,00 |
0,00 |
|
|
4. Long term payables
to public bodies: |
193.121,00 |
224.294,00 |
266.397,00 |
377.864,00 |
441.520,00 |
|
|
V. Unpaid portion of equity investment:
|
0,00 |
0,00 |
0,00 |
0,00 |
0,00 |
|
|
1. Group companies:
|
0,00 |
0,00 |
0,00 |
0,00 |
0,00 |
|
|
2. Associated
companies: |
0,00 |
0,00 |
0,00 |
0,00 |
0,00 |
|
|
3. Third parties:
|
0,00 |
0,00 |
0,00 |
0,00 |
0,00 |
|
|
VI. Long term trade creditors: |
0,00 |
0,00 |
0,00 |
0,00 |
0,00 |
|
|
E) SHORT TERM CREDITORS: |
42.252.130,00 |
41.754.961,00 |
54.816.884,00 |
52.064.282,00 |
61.277.489,00 |
|
|
I. Issued debentures and other marketable
securities: |
0,00 |
0,00 |
0,00 |
0,00 |
0,00 |
|
|
1. Non-convertible
debentures: |
0,00 |
0,00 |
0,00 |
0,00 |
0,00 |
|
|
2. Convertible debentures:
|
0,00 |
0,00 |
0,00 |
0,00 |
0,00 |
|
|
3. Other debt
securities: |
0,00 |
0,00 |
0,00 |
0,00 |
0,00 |
|
|
4. Accrued interest on
debentures and other debt securities: |
0,00 |
0,00 |
0,00 |
0,00 |
0,00 |
|
|
II. Amounts owed to credit institutions:
|
1.714.531,00 |
2.961.905,00 |
2.999.716,00 |
5.985.576,00 |
11.195.044,00 |
|
|
1. Loans and other
liabilities: |
1.705.065,00 |
2.961.905,00 |
2.999.716,00 |
5.978.416,00 |
11.185.497,00 |
|
|
2. Accrued interest on
liabilities with credit institutions: |
0,00 |
0,00 |
0,00 |
0,00 |
0,00 |
|
|
3. Short-term
liabilities from capital leases: |
9.466,00 |
0,00 |
0,00 |
7.160,00 |
9.547,00 |
|
|
III. Short-term amounts owed to group and
associated companies: |
0,00 |
0,00 |
0,00 |
0,00 |
0,00 |
|
|
1. Amounts owed to
group companies: |
0,00 |
0,00 |
0,00 |
0,00 |
0,00 |
|
|
2. Amounts owed to
associated companies: |
0,00 |
0,00 |
0,00 |
0,00 |
0,00 |
|
|
IV. Trade creditors: |
30.617.308,00 |
31.331.680,00 |
33.151.834,00 |
27.468.715,00 |
32.694.411,00 |
|
|
1. Advanced payments from
customers: |
0,00 |
0,00 |
0,00 |
0,00 |
0,00 |
|
|
2. Amounts owed for
purchases of goods or services: |
30.617.308,00 |
31.331.680,00 |
33.151.834,00 |
27.468.715,00 |
32.694.411,00 |
|
|
3. Debts represented by
notes payable: |
0,00 |
0,00 |
0,00 |
0,00 |
0,00 |
|
|
V. Other creditors: |
9.920.291,00 |
7.446.324,00 |
18.620.173,00 |
18.529.822,00 |
17.260.959,00 |
|
|
1. Public bodies:
|
4.998.324,00 |
3.524.752,00 |
6.651.671,00 |
11.274.028,00 |
11.565.959,00 |
|
|
2. Bills of exchange
payable: |
0,00 |
0,00 |
0,00 |
0,00 |
0,00 |
|
|
3. Miscellaneous
debts: |
2.113.711,00 |
1.232.820,00 |
9.436.734,00 |
4.923.306,00 |
3.437.320,00 |
|
|
4. Wages and salaries
payable: |
2.808.256,00 |
2.688.752,00 |
2.531.768,00 |
2.332.488,00 |
2.257.680,00 |
|
|
5. Guarantees and
deposits received at short term: |
0,00 |
0,00 |
0,00 |
0,00 |
0,00 |
|
|
VI. Provisions: |
0,00 |
0,00 |
0,00 |
0,00 |
0,00 |
|
|
VII. Prepayments and accrued income: |
0,00 |
15.052,00 |
45.161,00 |
80.168,00 |
127.075,00 |
|
|
F) SHORT-TERM PROVISIONS FOR LIABILITIES AND CHARGES: |
0,00 |
0,00 |
0,00 |
0,00 |
0,00 |
|
|
GENERAL TOTAL (A + B + C + D + E + F): |
278.818.485,00 |
267.818.556,00 |
252.618.026,00 |
241.580.554,00 |
237.228.268,00 |
|
MERCANTILE REGISTRY.
|
|
EQUIVALENCIA |
EQUIVALENCIA |
EQUIVALENCIA |
EQUIVALENCIA |
EQUIVALENCIA |
|
|
DEBIT |
2017 |
2016 |
2015 |
2014 |
2013 |
|
|
A) CHARGES (A.1 to A.15): |
234.777.239,00 |
243.759.160,00 |
228.590.982,00 |
225.377.298,00 |
233.401.747,00 |
|
|
A.1. Stock reduction of
both manufactured goods and the ones in process: |
0,00 |
0,00 |
1.693.266,00 |
9.026.234,00 |
0,00 |
|
|
A.2. Supplies: |
101.995.354,00 |
111.151.754,00 |
98.997.208,00 |
89.846.509,00 |
110.053.345,00 |
|
|
a) Stock consumption: |
54.690.237,00 |
59.914.492,00 |
56.665.797,00 |
53.215.663,00 |
66.874.972,00 |
|
|
b) Consumption of raw materials and miscellaneous consumable ones: |
36.426.529,00 |
39.910.468,00 |
35.168.785,00 |
28.682.898,00 |
34.123.519,00 |
|
|
c) Miscellaneous external expenditure: |
10.878.588,00 |
11.326.794,00 |
7.162.626,00 |
7.947.948,00 |
9.054.855,00 |
|
|
A.3. Staff costs:
|
54.809.789,00 |
53.917.637,00 |
52.411.330,00 |
50.846.491,00 |
50.128.841,00 |
|
|
a) Wages, salaries et al.: |
44.125.700,00 |
43.401.375,00 |
41.912.135,00 |
40.764.780,00 |
40.098.433,00 |
|
|
b) Social security costs: |
10.684.089,00 |
10.516.262,00 |
10.499.195,00 |
10.081.711,00 |
10.030.407,00 |
|
|
A.4. Depreciation
expense: |
8.279.719,00 |
9.307.968,00 |
9.529.533,00 |
9.543.252,00 |
11.378.390,00 |
|
|
A.5. Variation of trade
provisions and losses of unrecovered receivables: |
132.998,00 |
843.920,00 |
29.499,00 |
22.119,00 |
32.128,00 |
|
|
a) Stock provision variation: |
0,00 |
0,00 |
0,00 |
0,00 |
0,00 |
|
|
b)
Variation in provision and bad debt losses: |
0,00 |
0,00 |
0,00 |
0,00 |
0,00 |
|
|
c) Variation of other trade provisions: |
132.998,00 |
843.920,00 |
29.499,00 |
22.119,00 |
32.128,00 |
|
|
A.6. Other operating
charges: |
53.292.241,00 |
53.374.726,00 |
49.910.832,00 |
46.856.772,00 |
44.318.753,00 |
|
|
a) External services: |
52.998.116,00 |
53.085.332,00 |
49.594.172,00 |
46.622.451,00 |
43.783.711,00 |
|
|
b) Taxes: |
294.125,00 |
289.394,00 |
316.661,00 |
234.321,00 |
280.356,00 |
|
|
c) Other operating expenses: |
0,00 |
0,00 |
0,00 |
0,00 |
254.686,00 |
|
|
d)
Allocation to revision fund: |
0,00 |
0,00 |
0,00 |
0,00 |
0,00 |
|
|
A.I. OPERATING BENEFITS
(B.1+B.2+B.3+B.4-A.1-A.2-A.3-A.4-A.5-A.6): |
42.956.276,00 |
39.254.684,00 |
42.090.100,00 |
47.054.358,00 |
52.199.501,00 |
|
|
A.7. Financial and
similar charges: |
6.586.255,00 |
5.159.110,00 |
2.053.434,00 |
6.364.056,00 |
2.887.628,00 |
|
|
a) Due to liabilities with companies of the group: |
0,00 |
0,00 |
0,00 |
0,00 |
0,00 |
|
|
b) Due to liabilities with associated companies: |
0,00 |
0,00 |
0,00 |
0,00 |
0,00 |
|
|
c) Due to other debts.: |
27.343,00 |
64.492,00 |
448.247,00 |
496.064,00 |
651.298,00 |
|
|
d)
Losses from financial investments: |
6.558.912,00 |
5.094.618,00 |
1.605.187,00 |
5.867.992,00 |
2.236.330,00 |
|
|
A.8. Changes in
financial investment provisions: |
55.008,00 |
42.727,00 |
0,00 |
0,00 |
0,00 |
|
|
A.9. Exchange losses:
|
0,00 |
0,00 |
0,00 |
405.779,00 |
0,00 |
|
|
A.II. NET FINANCIAL INCOME
(B.5+B.6+B.7+B.8-A.7-A.8-A.9): |
0,00 |
0,00 |
3.001.201,00 |
0,00 |
0,00 |
|
|
A.III. PROFIT FROM ORDINARY ACTIVITIES (A.I+A.II-B.I-B.II):
|
39.226.373,00 |
36.703.641,00 |
45.091.301,00 |
42.144.993,00 |
50.926.179,00 |
|
|
A.10. Changes in
provisions for intangible, tangible and securities portfolio: |
375.202,00 |
160.083,00 |
0,00 |
0,00 |
0,00 |
|
|
A.11. Losses from
tangible and intangible fixed assets and securities portfolio: |
182.578,00 |
30.748,00 |
89.275,00 |
0,00 |
101.714,00 |
|
|
A.12. Losses from
transactions with own shares and debentures: |
0,00 |
0,00 |
0,00 |
0,00 |
0,00 |
|
|
A.13. Extraordinary
expenses: |
8.593,00 |
0,00 |
0,00 |
0,00 |
0,00 |
|
|
A.14. Expenses and
losses of former financial years: |
0,00 |
0,00 |
0,00 |
0,00 |
0,00 |
|
|
A.IV. EXTRAORDINARY PROFIT
(B.9+B.10+B.11+B.12+B.13-A.10-A.11-A.12-A.13-A.14): |
0,00 |
0,00 |
121.659,00 |
717.840,00 |
112.983,00 |
|
|
A.V. PROFIT BEFORE TAXES
(A.III+A.IV-B.III-B.IV): |
38.789.486,00 |
36.664.252,00 |
45.212.960,00 |
42.862.833,00 |
51.039.162,00 |
|
|
A.15. Corporation tax:
|
9.059.502,00 |
9.770.487,00 |
13.876.604,00 |
12.466.087,00 |
14.500.948,00 |
|
|
A.16. Miscellaneous
taxes: |
0,00 |
0,00 |
0,00 |
0,00 |
0,00 |
|
|
A.VI. FINANCIAL YEAR RESULTS (PROFIT)
(A.V-A.15-A.16): |
29.729.984,00 |
26.893.765,00 |
31.336.356,00 |
30.396.747,00 |
36.538.215,00 |
|
MERCANTILE REGISTRY.
|
|
EQUIVALENCIA |
EQUIVALENCIA |
EQUIVALENCIA |
EQUIVALENCIA |
EQUIVALENCIA |
|
|
CREDIT |
2017 |
2016 |
2015 |
2014 |
2013 |
|
|
B) INCOME ( B.1 to B.13): |
264.507.223,00 |
270.652.925,00 |
259.927.337,00 |
255.774.045,00 |
269.939.961,00 |
|
|
B.1. Net total sales:
|
257.088.071,00 |
260.164.644,00 |
253.514.766,00 |
251.858.623,00 |
253.930.404,00 |
|
|
a) Sales: |
257.088.071,00 |
260.114.644,00 |
253.514.766,00 |
251.858.623,00 |
253.930.404,00 |
|
|
b)
Rendering of services: |
0,00 |
50.000,00 |
0,00 |
0,00 |
0,00 |
|
|
Returns and Rappel on sales: |
0,00 |
0,00 |
0,00 |
0,00 |
0,00 |
|
|
B.2. Stock increase of
manufactured goods and products in process: |
3.392.883,00 |
5.889.887,00 |
0,00 |
0,00 |
12.186.172,00 |
|
|
B.3. Works performed
by the company for fixed assets: |
0,00 |
0,00 |
0,00 |
0,00 |
0,00 |
|
|
B.4. Miscellaneous
operating income: |
985.423,00 |
1.796.158,00 |
1.147.002,00 |
1.337.110,00 |
1.994.382,00 |
|
|
a) Auxiliary income and other from current management: |
894.913,00 |
1.689.393,00 |
988.316,00 |
1.278.324,00 |
1.914.212,00 |
|
|
b) Grants: |
90.510,00 |
106.765,00 |
158.685,00 |
58.786,00 |
80.170,00 |
|
|
c) Liabilities and charges provisions surplus: |
0,00 |
0,00 |
0,00 |
0,00 |
0,00 |
|
|
B.I. PÉRDIDAS DE EXPLOTACIÓN (A.1+A.2+A.3+A.4+A.5-A.6-B.1-B.2-B.3-B.4):
|
0,00 |
0,00 |
0,00 |
0,00 |
0,00 |
|
|
B.5. Income from
equity investment: |
2.736.336,00 |
2.559.431,00 |
2.513.471,00 |
1.860.471,00 |
1.578.541,00 |
|
|
a)
In companies of the group: |
2.683.489,00 |
2.471.995,00 |
2.341.593,00 |
1.643.365,00 |
1.090.458,00 |
|
|
b) In associated companies: |
0,00 |
0,00 |
0,00 |
0,00 |
0,00 |
|
|
c) Third parties: |
52.847,00 |
87.436,00 |
171.878,00 |
217.107,00 |
488.083,00 |
|
|
B.6. Income from other
marketable securities and long-term receivables: |
0,00 |
0,00 |
0,00 |
0,00 |
0,00 |
|
|
a) From companies of the group: |
0,00 |
0,00 |
0,00 |
0,00 |
0,00 |
|
|
b) From associated companies: |
0,00 |
0,00 |
0,00 |
0,00 |
0,00 |
|
|
c) From companies out of the group: |
0,00 |
0,00 |
0,00 |
0,00 |
0,00 |
|
|
B.7. Miscellaneous
interests or similar income: |
0,00 |
0,00 |
0,00 |
0,00 |
0,00 |
|
|
a) From companies of the group: |
0,00 |
0,00 |
0,00 |
0,00 |
0,00 |
|
|
b) From associated companies: |
0,00 |
0,00 |
0,00 |
0,00 |
0,00 |
|
|
c) Miscellaneous interests: |
0,00 |
0,00 |
0,00 |
0,00 |
0,00 |
|
|
d) Profit on financial investment: |
0,00 |
0,00 |
0,00 |
0,00 |
0,00 |
|
|
B.8. Exchange positive
differences: |
175.024,00 |
91.363,00 |
2.541.164,00 |
0,00 |
35.765,00 |
|
|
B.II. NEGATIVE FINANCIAL RESULTS
(A.7+A.8+A.9-B.5-B.6-B.7-B.8): |
3.729.903,00 |
2.551.043,00 |
0,00 |
4.909.364,00 |
1.273.322,00 |
|
|
B.III. LOSSES ON ORDINARY ACTIVITIES ( B.I
+ B.II - A.I - A.II ): |
0,00 |
0,00 |
0,00 |
0,00 |
0,00 |
|
|
B.9.Profit on disposal
of both tangible and intangible fixed assets and securities portfolio: |
0,00 |
0,00 |
0,00 |
505.652,00 |
0,00 |
|
|
B.10. Profit on
transactions with own shares and debentures: |
0,00 |
0,00 |
0,00 |
0,00 |
0,00 |
|
|
B.11. Capital grants
transferred to profit and loss: |
129.486,00 |
151.442,00 |
210.934,00 |
212.188,00 |
214.697,00 |
|
|
B.12. Extraordinary
income: |
0,00 |
0,00 |
0,00 |
0,00 |
0,00 |
|
|
B.13. Income and
profit of former financial years: |
0,00 |
0,00 |
0,00 |
0,00 |
0,00 |
|
|
B.IV. NEGATIVE EXTRAORDINARY RESULTS
(A.10+A.11+A.12+A.13+A.14-B.9-B.10-B.11-B.12-B.13): |
436.887,00 |
39.389,00 |
0,00 |
0,00 |
0,00 |
|
|
B.V. LOSSES BEFORE TAXES
(B.III+B.IV-A.III-A.IV): |
0,00 |
0,00 |
0,00 |
0,00 |
0,00 |
|
|
B.VI. RESULT OF THE PERIOD (LOSSES)
(B.V+A.15+A.16): |
0,00 |
0,00 |
0,00 |
0,00 |
0,00 |
|
MERCANTILE REGISTRY.
|
CASHFLOW
STATEMENT
|
|
|
|
|
Model: Normal
> Source of information: Data contained in this section is taken
from the information declared in the Annual Accounts submitted to the Trade
Register.
|
Net Rights Granted |
2017 |
2016 |
2015 |
2014 |
2013 |
|
|
1. Fiscal year result before taxes.: 61100 |
38.789.486,00 |
36.664.252,00 |
45.212.960,00 |
42.862.834,00 |
51.039.164,00 |
|
|
2. Results adjustments.: 61200 |
12.570.914,00 |
11.898.401,00 |
5.870.827,00 |
13.756.894,00 |
12.046.938,00 |
|
|
a) Fixed Assets Amortization (+).:
61201 |
8.279.719,00 |
9.307.968,00 |
9.529.533,00 |
9.543.250,00 |
11.378.390,00 |
|
|
b) Obsolescence Allowances (+/-). :
61202 |
7.122.120,00 |
5.254.701,00 |
1.605.187,00 |
5.867.992,00 |
2.236.330,00 |
|
|
c) Variation in Provision (+/-). :
61203 |
0,00 |
0,00 |
0,00 |
22.119,00 |
32.128,00 |
|
|
d) Allocation of grants (-).: 61204 |
-129.486,00 |
-151.442,00 |
-210.934,00 |
-212.188,00 |
-214.696,00 |
|
|
e) Results on disposal of fixed assets
(+/-). : 61205 |
182.578,00 |
30.748,00 |
89.275,00 |
-505.651,00 |
101.714,00 |
|
|
g) Financial income (-).: 61207 |
-2.736.336,00 |
-2.559.431,00 |
-2.513.471,00 |
-1.860.472,00 |
-1.578.541,00 |
|
|
h) Financial Expenses (+). : 61208 |
27.343,00 |
64.493,00 |
448.247,00 |
496.064,00 |
651.298,00 |
|
|
i) Exchange differences (+/-). :
61209 |
-175.024,00 |
-91.363,00 |
-2.918.325,00 |
405.780,00 |
-35.765,00 |
|
|
j) Reasonable Value Variation in Financial Instruments
(+/-).: 61210 |
0,00 |
42.727,00 |
0,00 |
0,00 |
0,00 |
|
|
k) Other income and expense (-/+). :
61211 |
0,00 |
0,00 |
-158.685,00 |
0,00 |
-523.920,00 |
|
|
3. Changes in current capital equity.: 61300 |
1.578.339,00 |
1.425.943,00 |
-5.053.828,00 |
359.741,00 |
-31.095.010,00 |
|
|
a) Stock (+/-).: 61301 |
-1.086.296,00 |
-1.599.859,00 |
-547.660,00 |
15.862.999,00 |
-13.753.301,00 |
|
|
d) Debtors and other accounts receivable
(+/-). : 61302 |
3.284.358,00 |
5.249.755,00 |
-13.478.894,00 |
-12.033.001,00 |
-15.953.530,00 |
|
|
c) Other current assets (+/-). :
61303 |
0,00 |
0,00 |
252.014,00 |
787.948,00 |
-887.600,00 |
|
|
d) Creditors and other accounts payable (+/-).
: 61304 |
-619.723,00 |
-2.223.953,00 |
8.755.719,00 |
-4.173.815,00 |
-374.283,00 |
|
|
f) Other non-current assets and liabilities
(+/-).: 61306 |
0,00 |
0,00 |
-35.007,00 |
-84.390,00 |
-126.296,00 |
|
|
4. Cash Flows from Other Operating Activities: 61400 |
-7.329.591,00 |
-10.411.043,00 |
-14.629.542,00 |
-14.127.817,00 |
-14.415.573,00 |
|
|
a) Interest payments (-). : 61401 |
-26.451,00 |
-397.848,00 |
-447.063,00 |
-486.230,00 |
-627.325,00 |
|
|
b) Dividend payment collection (+). :
61402 |
0,00 |
2.471.995,00 |
2.341.593,00 |
0,00 |
0,00 |
|
|
c) Interest collection (+). : 61403 |
42.293,00 |
87.436,00 |
171.878,00 |
2.000.062,00 |
1.399.534,00 |
|
|
d) Income tax payment collection (payments)
(+/-).: 61404 |
-7.345.433,00 |
-12.572.626,00 |
-16.853.038,00 |
-15.641.649,00 |
-15.187.782,00 |
|
|
e) Other payments (payment collection)
(-/+) : 61405 |
0,00 |
0,00 |
157.088,00 |
0,00 |
0,00 |
|
|
5. Cash Flows from Operating Activities (1 + 2 + 3 + 4) :
61500 |
45.609.148,00 |
39.577.553,00 |
31.400.417,00 |
42.851.652,00 |
17.575.519,00 |
|
|
6. Payments for investment (-).: 62100 |
-15.444.134,00 |
-19.987.916,00 |
-18.196.032,00 |
-21.469.195,00 |
-38.799.520,00 |
|
|
a) Companies of the group and affiliates. :
62101 |
-3.033.275,00 |
-3.485.096,00 |
-2.755.329,00 |
-5.128.990,00 |
-4.965.406,00 |
|
|
b) Intangible fixed assets. : 62102 |
-4.287.164,00 |
-1.257.610,00 |
-936.470,00 |
-967.464,00 |
-845.713,00 |
|
|
c) Fixed assets. : 62103 |
-3.967.647,00 |
-3.169.494,00 |
-10.236.546,00 |
-6.907.676,00 |
-10.123.452,00 |
|
|
d) Real estate investment. : 62104 |
-4.156.048,00 |
0,00 |
0,00 |
0,00 |
0,00 |
|
|
e) Other financial assets. : 62105 |
0,00 |
-12.075.716,00 |
-4.267.687,00 |
-8.465.065,00 |
-22.864.949,00 |
|
|
7. Divestment payment collection (+). : 62200 |
12.349.393,00 |
10.472.193,00 |
7.577.960,00 |
11.183.756,00 |
24.976.918,00 |
|
|
a) Companies of the group and affiliates. :
62201 |
0,00 |
308.668,00 |
3.305.839,00 |
0,00 |
0,00 |
|
|
b) Intangible fixed assets. : 62202 |
12.349.393,00 |
0,00 |
0,00 |
0,00 |
0,00 |
|
|
c) Fixed assets. : 62203 |
0,00 |
0,00 |
300,00 |
573.714,00 |
249.903,00 |
|
|
e) Other financial assets. : 62205 |
0,00 |
10.163.525,00 |
4.271.821,00 |
10.610.042,00 |
24.727.015,00 |
|
|
8. Cash Flow from Investing Activities (6+7) less Amortization:
62300 |
-3.094.741,00 |
-9.515.723,00 |
-10.618.072,00 |
-10.285.439,00 |
-13.822.602,00 |
|
|
9. Payment collection and payments for equity instruments. :
63100 |
4.794,00 |
0,00 |
0,00 |
0,00 |
0,00 |
|
|
e) Grants, donations and bequests received
(+). : 63105 |
4.794,00 |
0,00 |
0,00 |
0,00 |
0,00 |
|
|
10. Payment collection and payments for financial liabilities
instruments.: 63200 |
-4.458.577,00 |
-3.050.309,00 |
-6.028.471,00 |
-8.637.036,00 |
2.364.829,00 |
|
|
a) Issuance : 63201 |
0,00 |
0,00 |
0,00 |
-8.637.036,00 |
2.364.829,00 |
|
|
1. Debentures and other negotiable
securities (+). : 63202 |
0,00 |
0,00 |
0,00 |
-8.637.036,00 |
2.364.829,00 |
|
|
b) Repayment and amortization of :
63207 |
-4.458.577,00 |
-3.050.309,00 |
-6.028.471,00 |
0,00 |
0,00 |
|
|
2. Debts incurred with credit institutions
(-).: 63209 |
-4.458.577,00 |
0,00 |
-6.028.471,00 |
0,00 |
0,00 |
|
|
5. Other debts (-). : 63212 |
0,00 |
-3.050.309,00 |
0,00 |
0,00 |
0,00 |
|
|
11. Payments from dividends and remunerations from other assets
instruments. : 63300 |
-20.000.000,00 |
-8.425.000,00 |
-11.575.000,00 |
-20.000.000,00 |
-8.575.000,00 |
|
|
a) Dividends (-).: 63301 |
-20.000.000,00 |
-8.425.000,00 |
-11.575.000,00 |
-20.000.000,00 |
-8.575.000,00 |
|
|
12. Cash Flows from Financing Activities (9+10+11): 63400 |
-24.453.783,00 |
-11.475.309,00 |
-17.603.471,00 |
-28.637.036,00 |
-6.210.171,00 |
|
|
D) EFFECT OF EXCHANGE RATE CHANGES: 64000 |
0,00 |
0,00 |
0,00 |
0,00 |
0,00 |
|
|
E) NET INCREASE/DECREASE OF CASH OR EQUIVALENT ASSETS (+/-5+/-8+/12+/-D)
: 65000 |
18.060.624,00 |
18.586.521,00 |
3.178.874,00 |
3.929.177,00 |
-2.457.254,00 |
|
|
Cash or equivalent assets as of beginning
of the fiscal year.: 65100 |
30.446.966,00 |
11.860.445,00 |
8.681.571,00 |
4.752.394,00 |
7.209.648,00 |
|
|
Cash or equivalent assets as of end of the
fiscal year.: 65200 |
48.507.590,00 |
30.446.966,00 |
11.860.445,00 |
8.681.571,00 |
4.752.394,00 |
|
FINANCIAL
DIAGNOSIS
|
> Economic-Financial Comparative Analysis
Data used in the following ratios and indicators is
taken from the Annual Accounts submitted by the company to the TRADE REGISTER.
> Comparison within the Sector
|
Cash Flow |
2017 |
2016 |
Variación 2017 - 2016 |
|
|||
|
|
Empresa |
Sector |
Empresa |
Sector |
Empresa |
Sector |
|
|
Cash Flow over Sales: |
0,07 % |
0,02 % |
0,07 % |
0,01 % |
-1,67 % |
125,40 % |
|
|
Net Financial Debt: |
-0,83 |
0,61 |
-0,60 |
2,06 |
-39,24 |
-70,33 |
|
|
Cash Flow Yield: |
0,06 % |
0,02 % |
0,07 % |
0,01 % |
-6,66 % |
300,21 % |
|
|
EBITDA over Sales: |
19,93 % |
10,80 % |
18,67 % |
12,16 % |
6,77 % |
-11,16 % |
|
|
Profitability |
2017 |
2016 |
Variación 2017 - 2016 |
|
|||
|
|
Empresa |
Sector |
Empresa |
Sector |
Empresa |
Sector |
|
|
Operating economic profitability: |
17,24 % |
11,22 % |
16,93 % |
9,04 % |
1,85 % |
24,05 % |
|
|
Total economic profitability: |
13,92 % |
7,09 % |
13,71 % |
5,20 % |
1,52 % |
36,53 % |
|
|
Financial profitability: |
13,68 % |
10,63 % |
12,96 % |
7,85 % |
5,60 % |
35,41 % |
|
|
Margin: |
16,56 % |
6,62 % |
14,97 % |
7,92 % |
10,61 % |
-16,43 % |
|
|
Mark-up: |
15,03 % |
6,70 % |
14,00 % |
7,40 % |
7,41 % |
-9,47 % |
|
|
Solvency |
2017 |
2016 |
Variación 2017 - 2016 |
|
|||
|
|
Empresa |
Sector |
Empresa |
Sector |
Empresa |
Sector |
|
|
Liquidity: |
1,10 |
0,14 |
0,70 |
0,16 |
55,61 |
-11,40 |
|
|
Acid Test: |
3,24 |
0,76 |
3,17 |
0,89 |
2,30 |
-14,96 |
|
|
Working Capital / Investment: |
0,62 |
0,03 |
0,62 |
0,03 |
-0,32 |
3,57 |
|
|
Solvency: |
4,93 |
1,17 |
4,88 |
1,20 |
0,95 |
-2,62 |
|
|
Indebtedness |
2017 |
2016 |
Variación 2017 - 2016 |
|
|||
|
|
Empresa |
Sector |
Empresa |
Sector |
Empresa |
Sector |
|
|
Indebtedness level: |
0,19 |
1,27 |
0,21 |
1,21 |
-11,27 |
5,06 |
|
|
Borrowing Composition: |
0,00 |
0,88 |
0,09 |
1,02 |
-94,73 |
-14,29 |
|
|
Repayment Ability: |
0,87 |
5,77 |
0,97 |
8,88 |
-10,67 |
-34,99 |
|
|
Warranty: |
6,27 |
1,80 |
5,67 |
1,85 |
10,46 |
-2,49 |
|
|
Generated resources / Total creditors: |
1,01 |
0,14 |
0,87 |
0,10 |
15,18 |
47,40 |
|
|
Efficiency |
2017 |
2016 |
Variación 2017 - 2016 |
|
|||
|
|
Empresa |
Sector |
Empresa |
Sector |
Empresa |
Sector |
|
|
Productivity: |
1,93 |
2,00 |
1,90 |
1,92 |
1,79 |
3,76 |
|
|
Turnover of Collection Rights : |
2,80 |
8,75 |
2,75 |
5,15 |
1,69 |
69,92 |
|
|
Turnover of Payment Entitlements: |
4,13 |
4,19 |
4,56 |
3,54 |
-9,39 |
18,42 |
|
|
Stock rotation: |
2,97 |
9,52 |
3,12 |
8,16 |
-4,86 |
16,69 |
|
|
Assets turnover: |
1,04 |
1,70 |
1,13 |
1,14 |
-7,93 |
48,44 |
|
|
Borrowing Cost: |
0,06 |
1,69 |
0,14 |
2,35 |
-55,02 |
-28,18 |
|
> Trend of indicators under the General Accounting Plan of 2007
(2017, 2016, 2015, 2014, 2013)
|
Cash Flow |
2017 |
2016 |
2015 |
2014 |
2013 |
|
|
Cash Flow over Sales: |
0,07 % |
0,07 % |
0,01 % |
0,02 % |
-0,01 % |
|
|
Net Financial Debt: |
-0,83 |
-0,60 |
-0,02 |
0,07 |
0,20 |
|
|
Cash Flow Yield: |
0,06 % |
0,07 % |
0,01 % |
0,02 % |
-0,01 % |
|
|
EBITDA over Sales: |
19,93 % |
18,67 % |
20,36 % |
22,47 % |
25,04 % |
|
|
Profitability |
2017 |
2016 |
2015 |
2014 |
2013 |
|
|
Operating economic profitability: |
17,24 % |
16,93 % |
19,15 % |
22,68 % |
25,03 % |
|
|
Total economic profitability: |
13,92 % |
13,71 % |
18,08 % |
17,95 % |
21,79 % |
|
|
Financial profitability: |
13,68 % |
12,96 % |
17,05 % |
17,48 % |
22,35 % |
|
|
Margin: |
16,56 % |
14,97 % |
16,58 % |
18,87 % |
20,44 % |
|
|
Mark-up: |
15,03 % |
14,00 % |
17,75 % |
16,93 % |
19,94 % |
|
|
Solvency |
2017 |
2016 |
2015 |
2014 |
2013 |
|
|
Liquidity: |
1,10 |
0,70 |
0,22 |
0,17 |
0,08 |
|
|
Acid Test: |
3,24 |
3,17 |
2,17 |
2,00 |
1,47 |
|
|
Working Capital / Investment: |
0,62 |
0,62 |
0,53 |
0,49 |
0,47 |
|
|
Solvency: |
4,93 |
4,88 |
3,49 |
3,40 |
2,87 |
|
|
Indebtedness |
2017 |
2016 |
2015 |
2014 |
2013 |
|
|
Indebtedness level: |
0,19 |
0,21 |
0,31 |
0,33 |
0,44 |
|
|
Borrowing Composition: |
0,00 |
0,09 |
0,09 |
0,16 |
0,19 |
|
|
Repayment Ability: |
0,87 |
0,97 |
1,16 |
1,06 |
1,14 |
|
|
Warranty: |
6,27 |
5,67 |
4,23 |
4,02 |
3,26 |
|
|
Generated resources / Total creditors: |
1,01 |
0,87 |
0,71 |
0,76 |
0,69 |
|
|
Efficiency |
2017 |
2016 |
2015 |
2014 |
2013 |
|
|
Productivity: |
1,93 |
1,90 |
1,98 |
2,11 |
2,27 |
|
|
Turnover of Collection Rights : |
2,80 |
2,75 |
2,53 |
2,91 |
3,41 |
|
|
Turnover of Payment Entitlements: |
4,13 |
4,56 |
3,48 |
3,11 |
3,58 |
|
|
Stock rotation: |
2,97 |
3,12 |
3,05 |
3,10 |
2,48 |
|
|
Assets turnover: |
1,04 |
1,13 |
1,16 |
1,20 |
1,22 |
|
|
Borrowing Cost: |
0,06 |
0,14 |
0,75 |
0,82 |
0,90 |
|
COMPARATIVE
SECTORIAL BALANCE
|
|
|
|
|
Sector-based Comparison
under the rules of the New General Accounting Plan.
|
Net Rights Granted |
Variación - |
|
|
|
Empresa |
Sector |
|
Net Rights Granted |
Variación - |
|
|
|
Empresa |
Sector |
|
Net Rights Granted |
Variación - |
|
|
|
Empresa |
Sector |
News
|
|
LA VANGUARDIA |
22/01/2018 |
|
Economía/Empresas.- CH Carolina Herrera se alía con IBM para
lanzar su tienda & |
|
|
Companies related |
|
|
|
|
|
LA REGIÓN DE OURENSE |
25/12/2017 |
|
STL atrae al sector de la moda a varios perfiles profesionales |
|
|
Companies related |
|
|
Public
Tenders and Works Won
|
No Public Tenders
assigned to the name of the company.
|
Detail
of Subsidies appearing in Balances Memories
|
|
|
|
|
|
Entity |
MINISTERIO DE ECONOMIA Y HACIENDA |
|
Subsidy Concept |
subvención de capital |
|
Status |
CONCEDIDA |
|
Amount Granted |
2.285.258,00 |
|
Entity |
INSTITUTO GALEGO DE PROMOCION
ECONOMICA (IGAPE, XUNTA DE GALICIA) |
|
Subsidy Concept |
subvención de capital |
|
Status |
CONCEDIDA |
|
Amount Granted |
1.301.253,00 |
|
Entity |
INSTITUTO GALEGO DE PROMOCION
ECONOMICA |
|
Subsidy Concept |
Subvención de capital |
|
Status |
CONCEDIDA |
|
Amount Granted |
1.251.622,00 |
|
Notes |
(IGAPE, Xunta de Galicia) |
|
Entity |
INSTITUTO ENERXETICO DE GALICIA |
|
Status |
CONCEDIDA |
|
Amount Granted |
4.794,00 |
|
Entity |
MINISTERIO DE ECONOMIA Y HACIENDA |
|
Status |
CONCEDIDA |
|
Amount Granted |
2.285.258,00 |
|
Notes |
El importe imputado a resultados es
de 8.175 euros, quedando un saldo pendiente al cierre de 247.501 euros. |
|
Entity |
INSTITUTO GALEGO DE PROMOCION
ECONOMICA (IGAPE, XUNTA DE GALICIA) |
|
Status |
CONCEDIDA |
|
Amount Granted |
1.301.253,00 |
|
Notes |
El importe imputado a resultados es
de 102.827 euros, quedando un saldo pendiente al cierre de 363.961 euros. |
|
Entity |
INSTITUTO GALEGO DE PROMOCION
ECONOMICA (IGAPE, XUNTA DE GALICIA) |
|
Status |
CONCEDIDA |
|
Amount Granted |
1.251.622,00 |
|
Notes |
El importe imputado a resultados es
de 8.435 euros, quedando un saldo pendiente al cierre de 154.871 euros. |
|
Entity |
CONSELLERIA DE INNOVACION, INDUSTRIA
E COMERCIO, XUNTA DE GALICIA |
|
Status |
CONCEDIDA |
|
Amount Granted |
795.684,00 |
|
Notes |
El importe imputado a resultados es
de 81.186 euros, quedando un saldo pendiente al cierre de 15.881 euros. |
|
Entity |
MINISTERIO DE ECONOMIA Y HACIENDA |
|
Status |
CONCEDIDA |
|
Amount Granted |
183.070,00 |
|
Notes |
El importe imputado a resultados es
de 6.118 euros, quedando la subvención totalmente amortizada. |
|
Entity |
CONSELLERIA DE INNOVACION, INDUSTRIA
E COMERCIO, XUNTA DE GALICIA |
|
Status |
CONCEDIDA |
|
Amount Granted |
115.542,00 |
|
Notes |
El importe imputado a resultados es
de 3.832 euros, quedando la subvención totalmente amortizada. |
|
Entity |
INSTITUTO GALEGO DE PROMOCION
ECONOMICA (IGAPE, XUNTA DE GALICIA) |
|
Status |
CONCEDIDA |
|
Amount Granted |
46.615,00 |
|
Notes |
El importe imputado a resultados es
de 361 euros, quedando la subvención totalmente amortizada. |
|
Entity |
MINISTERIO DE ECONOMIA Y HACIENDA |
|
Status |
CONCEDIDA |
|
Amount Granted |
778.606,00 |
|
Entity |
MINISTERIO DE ECONOMIA Y HACIENDA |
|
Subsidy Concept |
Subvención de capital |
|
Status |
CONCEDIDA |
|
Amount Granted |
2.285.258,00 |
|
Notes |
Se ha traspasado a resultados del
ejercicio 18.593 euros, quedando a fecha de cierre pendiente de imputar
296.289 euros. |
|
Entity |
INSTITUTO GALLEGO DE PROMOCION
ECONOMICA |
|
Subsidy Concept |
Subvención de capital |
|
Status |
CONCEDIDA |
|
Amount Granted |
1.301.253,00 |
|
Notes |
Se ha traspasado a resultados del ejercicio
121.587 euros, quedando a fecha de cierre pendiente de imputar 731.444 euros. |
|
Entity |
INSTITUTO GALLEGO DE PROMOCION
ECONOMICA |
|
Subsidy Concept |
Subvención de capital |
|
Status |
CONCEDIDA |
|
Amount Granted |
1.251.622,00 |
|
Notes |
Se ha traspasado a resultados del
ejercicio 11.721 euros, quedando a fecha de cierre pendiente de imputar
174.275 euros. |
|
Entity |
CONSELLERIA DE INNOVACION, INDUSTRIA
E COMERCIO |
|
Subsidy Concept |
Subvención de capital |
|
Status |
CONCEDIDA |
|
Amount Granted |
795.684,00 |
|
Notes |
Se ha traspasado a resultados del
ejercicio 81.186 euros, quedando a fecha de cierre pendiente de imputar
299.590 euros. |
|
Entity |
MINISTERIO DE ECONOMIA Y HACIENDA |
|
Subsidy Concept |
Subvención de capital |
|
Status |
CONCEDIDA |
|
Amount Granted |
778.606,00 |
|
Notes |
Se ha traspasado a resultados del
ejercicio 66.538 euros, quedando a fecha de cierre pendiente de imputar
445.924 euros. |
|
Entity |
MINISTERIO DE ECONOMIA Y HACIENDA |
|
Subsidy Concept |
Subvención de capital |
|
Status |
CONCEDIDA |
|
Amount Granted |
183.070,00 |
|
Notes |
Se ha traspasado a resultados del
ejercicio 21.969 euros, quedando a fecha de cierre pendiente de imputar 23.067
euros. |
|
Entity |
CONSELLERIA DE INNOVACION, INDUSTRIA
E COMERCIO |
|
Subsidy Concept |
Subvención de capital |
|
Status |
CONCEDIDA |
|
Amount Granted |
115.542,00 |
|
Notes |
Se ha traspasado a resultados del ejercicio
12.302 euros, quedando a fecha de cierre pendiente de imputar 15.632 euros. |
|
Entity |
INSTITUTO GALLEGO DE PROMOCION
ECONOMICA |
|
Subsidy Concept |
Subvención de capital |
|
Status |
CONCEDIDA |
|
Amount Granted |
75.383,00 |
|
Notes |
Se ha traspasado a resultados del
ejercicio 9.046 euros, quedando a fecha de cierre pendiente de imputar 2.280
euros. |
|
Entity |
INSTITUTO GALLEGO DE PROMOCION
ECONOMICA |
|
Subsidy Concept |
Subvención de capital |
|
Status |
CONCEDIDA |
|
Amount Granted |
46.615,00 |
|
Notes |
Se ha traspasado a resultados del
ejercicio 4.123 euros, quedando a fecha de cierre pendiente de imputar 10.042
euros. |
|
Entity |
IGAPE, XUNTA DE GALICIA |
|
Subsidy Concept |
Subvención de capital |
|
Status |
CONCEDIDA |
|
Amount Granted |
1.301.253,00 |
|
Notes |
El importe traspasado a resultados
durante el ejercicio es de 121.587 euros. |
|
Entity |
IGAPE, XUNTA DE GALICIA |
|
Subsidy Concept |
Subvención de capital |
|
Status |
CONCEDIDA |
|
Amount Granted |
1.251.622,00 |
|
Notes |
El importe traspasado a resultados
durante el ejercicio es de 20.145 euros. |
|
Entity |
CONSELLERIA DE INNOVACION, INDUSTRIA
E COMERCIO, XUNTA DE GALICIA |
|
Subsidy Concept |
Subvención de capital |
|
Status |
CONCEDIDA |
|
Amount Granted |
795.684,00 |
|
Notes |
El importe traspasado a resultados
durante el ejercicio es de 115.611 euros. |
|
Entity |
IGAPE, XUNTA DE GALICIA |
|
Subsidy Concept |
Subvención de capital |
|
Status |
CONCEDIDA |
|
Amount Granted |
526.219,00 |
|
Notes |
El importe traspasado a resultados
durante el ejercicio es de 63.292 euros. |
|
Entity |
CONSELLERIA DE INNOVACION, INDUSTRIA
E COMERCIO, XUNTA DE GALICIA |
|
Subsidy Concept |
Subvención de capital |
|
Status |
CONCEDIDA |
|
Amount Granted |
115.542,00 |
|
Notes |
El importe traspasado a resultados
durante el ejercicio es de 12.447 euros. |
|
Entity |
IGAPE, XUNTA DE GALICIA |
|
Subsidy Concept |
Subvención de capital |
|
Status |
CONCEDIDA |
|
Amount Granted |
75.383,00 |
|
Notes |
El importe traspasado a resultados
durante el ejercicio es de 9.046 euros. |
|
Entity |
IGAPE, XUNTA DE GALICIA |
|
Subsidy Concept |
Subvención de capital |
|
Status |
CONCEDIDA |
|
Amount Granted |
46.615,00 |
|
Notes |
El importe traspasado a resultados
durante el ejercicio es de 7.037 euros. |
|
Entity |
MINISTERIO DE ECONOMIA |
|
Subsidy Concept |
Subvención de capital. |
|
Status |
CONCEDIDA |
|
Amount Granted |
7.786.061,00 |
|
Notes |
Subvención concedida el 16/05/2006.
El importe está pendiente de imputación. |
|
Entity |
MINISTERIO DE ECONOMIA Y HACIENDA |
|
Subsidy Concept |
Subvención de capital. |
|
Status |
CONCEDIDA |
|
Amount Granted |
2.285.258,00 |
|
Notes |
Subvención concedida el 19/11/1998.
El importe imputado a resultados es de 159.608 euros quedando pendiente de
imputar 637.111 euros. |
|
Entity |
INSTITUTO GALEGO DE PROMOCION
ECONOMICA |
|
Subsidy Concept |
Subvención de capital. |
|
Status |
CONCEDIDA |
|
Amount Granted |
1.301.253,00 |
|
Notes |
Subvención concedida el 06/04/2006.
El importe está pendiente de imputación. |
|
Entity |
INSTITUTO GALEGO DE PROMOCION
ECONOMICA |
|
Subsidy Concept |
Subvención de capital. |
|
Status |
CONCEDIDA |
|
Amount Granted |
1.251.622,00 |
|
Notes |
Subvención concedida el 27/07/1998.
El importe imputado a resultados es de 84.645 euros quedando pendiente de
imputar 365.476 euros. |
|
Entity |
MINISTERIO DE ECONOMIA Y HACIENDA |
|
Subsidy Concept |
Subvención de capital. |
|
Status |
CONCEDIDA |
|
Amount Granted |
183.070,00 |
|
Notes |
Subvención concedida el 07/04/2003.
El importe imputado a resultados es de 21.969 euros quedando pendiente de
imputar 98.859 euros. |
|
Entity |
CONSELLERIA DE INNOVACION E INDUSTRIA |
|
Subsidy Concept |
Subvención de capital. |
|
Status |
CONCEDIDA |
|
Amount Granted |
129.886,00 |
|
Notes |
Subvención concedida el 17/11/2006. El
importe imputado a resultados es de 34.750 euros quedando pendiente de
imputar 95.136 euros. |
|
Entity |
CONSELLERIA DE INDUSTRIA E COMERCIO |
|
Subsidy Concept |
Subvención de capital. |
|
Status |
CONCEDIDA |
|
Amount Granted |
115.542,00 |
|
Notes |
Subvención concedida el 16/05/2003.
El importe imputado a resultados es de 15.273 euros quedando pendiente de
imputar 61.425 euros. |
|
Entity |
INSTITUTO GALEGO DE PROMOCION
ECONOMICA |
|
Subsidy Concept |
Subvención de capital |
|
Status |
CONCEDIDA |
|
Amount Granted |
75.383,00 |
|
Notes |
Subvención concedida el 12/12/2001.
El importe imputado a resultados es de 9.046 euros quedando pendiente de
imputar 30.394 euros. |
|
Entity |
INSTITUTO GALEGO DE PROMOCION
ECONOMICA |
|
Subsidy Concept |
Subvención de capital. |
|
Status |
CONCEDIDA |
|
Amount Granted |
46.615,00 |
|
Notes |
Subvención concedida el 17/03/2005.
El importe imputado a resultados es de 7.037 euros quedando pendiente de
imputar 32.541 euros. |
|
Entity |
CONSELLERIA DE INDUSTRIA E COMERCIO |
|
Subsidy Concept |
Subvención de capital |
|
Status |
CONCEDIDA |
|
Amount Granted |
115.542,00 |
|
Notes |
Subvención concedida el 16/05/2003. El
importe imputado a resultados es de 15.273 euros quedando pendiente de
imputar 76.698 euros. |
|
Entity |
INSTITUTO GALEGO DE PROMOCION
ECONOMICA |
|
Subsidy Concept |
Subvención de capital |
|
Status |
CONCEDIDA |
|
Amount Granted |
46.615,00 |
|
Notes |
Subvención concedida el 17/03/2005.
El importe imputado a resultados es de 7.037 euros quedando pendiente de
imputar 39.578 euros. |
|
Entity |
MINISTERIO DE ECONOMIA Y HACIENDA |
|
Subsidy Concept |
INVERSIONES EN INMOVILIZACIONES MATERIALES. |
|
Status |
CONCEDIDA |
|
Amount Granted |
2.285.258,00 |
|
Notes |
CONCEDIDA EL 19/11/1998. |
|
Entity |
INSTITUTO GALLEGO DE PROMOCION
ECONOMICA |
|
Subsidy Concept |
INVERSION EN INMOVILIZACIONES
MATERIALES |
|
Status |
CONCEDIDA |
|
Amount Granted |
1.251.622,00 |
|
Notes |
CONCEDIDA EL 27/7/1998. |
|
Entity |
CONSERJERIA DE INDUSTRIA Y COMERCIO |
|
Subsidy Concept |
INNOVACION TECNOLOGICA. |
|
Status |
CONCEDIDA |
|
Amount Granted |
587.141,00 |
|
Notes |
CONCEDIDA EL 23/6/1998. |
|
Entity |
MINISTERIO DE ECONOMIA Y HACIENDA |
|
Subsidy Concept |
INVERSION EN INMOVILIZACION
MATERIALES. |
|
Status |
CONCEDIDA |
|
Amount Granted |
183.071,00 |
|
Notes |
CONCEDIDA EL 07/4/2003. |
|
Entity |
CONSERJERIA DE INDUSTRIA Y COMERCIO |
|
Subsidy Concept |
INVERSION EN INMOVILIZACION
MATERIALES. |
|
Status |
CONCEDIDA |
|
Amount Granted |
115.542,00 |
|
Notes |
CONCEDIDA 16/05/2003. |
|
Entity |
INSTITUTO GALLEGO DE PROMOCION
ECONOMICA |
|
Subsidy Concept |
INVERSION EN INMOVILIZACION
MATERIALES. |
|
Status |
CONCEDIDA |
|
Amount Granted |
75.383,00 |
|
Notes |
CONCEDIDA EL 12/12/2001 |
|
Sources
|
|
Registry of Commerce's Official Gazette. Own and external data
bases Company References |
FOREIGN EXCHANGE RATES
|
Currency |
Unit
|
Indian Rupees |
|
US Dollar |
1 |
INR 64.14 |
|
|
1 |
INR 89.50 |
|
Euro |
1 |
INR 79.43 |
|
Euro |
1 |
INR 78.79 |
Note :
Above are approximate rates obtained from sources believed to be correct
INFORMATION DETAILS
|
Analysis Done by
: |
PRI |
|
|
|
|
Report Prepared
by : |
KET |
RATING EXPLANATIONS
|
Credit Rating |
Explanation |
Rating Comments |
|
A++ |
Minimum Risk |
Business dealings permissible with minimum
risk of default |
|
A+ |
Low Risk |
Business dealings permissible with low
risk of default |
|
A |
Acceptable Risk |
Business dealings permissible with
moderate risk of default |
|
B |
Medium Risk |
Business dealings permissible on a regular
monitoring basis |
|
C |
Medium High Risk |
Business dealings permissible preferably
on secured basis |
|
D |
High Risk |
Business dealing not recommended or on
secured terms only |
|
NB |
New Business |
No recommendation can be done due to
business in infancy stage |
|
NT |
No Trace |
No recommendation can be done as the
business is not traceable |
NB is stated where there is insufficient information to facilitate rating. However, it is not to be considered as unfavourable.
This score serves as a reference to assess
SC’s credit risk and to set the amount of credit to be extended. It is
calculated from a composite of weighted scores obtained from each of the major
sections of this report. The assessed factors are as follows:
·
Financial
condition covering various ratios
·
Company
background and operations size
·
Promoters
/ Management background
·
Payment
record
·
Litigation
against the subject
·
Industry
scenario / competitor analysis
·
Supplier
/ Customer / Banker review (wherever available)
This report is issued at
your request without any risk and responsibility on the part of MIRA INFORM
PRIVATE LIMITED (MIPL) or its officials.