|
|
|


MIRA INFORM REPORT
|
Report No. : |
488236 |
|
Report Date : |
10.02.2018 |
IDENTIFICATION DETAILS
|
Name : |
BTSA BIOTECNOLOGIAS APLICADAS SL |
|
|
|
|
Registered Office : |
C/ Arroba, 4. - Alcala De Henares - 28805 - Madrid |
|
|
|
|
Country : |
Spain |
|
|
|
|
Financials (as on) : |
2013 |
|
|
|
|
Date of Incorporation : |
03.02.1994 |
|
|
|
|
Legal Form : |
Private Company |
|
|
|
|
Line of Business : |
Subject is engaged in Manufacture of other chemical products. |
|
|
|
|
No. of Employees : |
30 |
RATING & COMMENTS
(Mira Inform has adopted New Rating mechanism w.e.f. 23rd
January 2017)
|
MIRA’s Rating : |
C |
|
Credit Rating |
Explanation |
Rating Comments |
|
C |
Medium High Risk |
Business dealings permissible preferably
on secured basis |
|
Maximum Credit Limit : |
28.000 |
|
|
|
|
Status : |
Moderate / Satisfactory / New Business / Small Company / Good /
Excellent / Not Registered in China / Offshore Company / No operating office in
Hong Kong |
|
|
|
|
Payment Behaviour : |
Unknown / Slow but Correct / No Complaints / Regular / Slow |
|
|
|
|
Litigation : |
Clear / Exist |
NOTES :
Any query related to this report can be made
on e-mail : infodept@mirainform.com
while quoting report number, name and date.
ECGC Country Risk Classification List
|
Country Name |
Previous Rating (30.06.2017) |
Current Rating (30.09.2017) |
|
Spain |
A1 |
A1 |
|
Risk Category |
ECGC
Classification |
|
Insignificant |
A1 |
|
Low Risk |
A2 |
|
Moderately Low Risk |
B1 |
|
Moderate Risk |
B2 |
|
Moderately High Risk |
C1 |
|
High Risk |
C2 |
|
Very High Risk |
D |
SPAIN - ECONOMIC OVERVIEW
After experiencing a prolonged recession in the wake of the global financial crisis that began in 2008, in 2017 Spain marked the fourth full year of positive economic growth in ten years, largely due to increased private consumption. At the onset of the financial crisis, Spain's GDP contracted by 3.7% in 2009, ending a 16-year growth trend, and continued contracting through most of 2013. In that year, the government successfully shored up struggling banks - exposed to the collapse of Spain's depressed real estate and construction sectors - and in January 2014 completed an EU-funded restructuring and recapitalization program for its financial sector.
Until 2014, credit contraction in the private sector, fiscal austerity, and high unemployment weighed on domestic consumption and investment. The unemployment rate rose from a low of about 8% in 2007 to more than 26% in 2013, but labor reforms prompted a modest reduction to 17% in 2017. High unemployment has strained Spain's public finances, as spending on social benefits increased while tax revenues fell. Spain’s budget deficit peaked at 11.4% of GDP in 2010, but Spain gradually reduced the deficit to about 3.3% of GDP in 2017. Public debt has increased substantially – from 60.1% of GDP in 2010 to nearly 96.7% in 2017.
Exports were resilient throughout the economic downturn and helped to bring Spain's current account into surplus in 2013 for the first time since 1986, where it remained through 2016. Rising labor productivity and an internal devaluation resulting from moderating labor costs and lower inflation have helped to improve foreign investor interest in the economy and positive FDI flows have been restored.
Political gridlock after the national elections in December 2015 and June 2016 and ensuing government formation process constrained the caretaker government’s ability to implement needed labor, pension, health care, tax, and education reforms— in 2016. The European Commission criticized Spain’s 2016 budget for easing austerity measures and for its alleged overly optimistic growth and deficit projections. Spain’s borrowing costs are dramatically lower since their peak in mid-2012, and with the recent uptick in economic activity, inflation has reappeared, at 2% per year.
|
Source
: CIA |
EXECUTIVE
SUMMARY
|
|
|
|
|
|
Name: |
BTSA BIOTECNOLOGIAS APLICADAS SL |
|
NIF / Fiscal code: |
B80816531 |
|
Trade Name |
BTSA |
|
Status: |
ACTIVE |
|
Incorporation Date: |
03/02/1994 |
|
Register Data |
Register Section 8 Sheet 124553 |
|
Last Publication in BORME: |
25/10/2016 [Revocations] |
|
Last Published Account Deposit: |
2013 |
|
Share Capital: |
260.568,80 |
|
|
|
|
Localization: |
C/ ARROBA, 4. - ALCALA DE HENARES - 28805 - MADRID |
|
Telephone - Fax - Email - Website: |
Telephone. 918 305 860 Email. info@btsa-es.com Website.
www.btsa-es.com |
|
Number of Branches |
3 |
|
|
|
|
Activity: |
|
|
NACE: |
2059 - Manufacture of other chemical products n.e.c. |
|
Registered Trademarks: |
|
|
Audited / Opinion: |
Si / |
|
Tenders and Awards: |
|
|
Subsidies: |
5 for a total cost of 531706.69 |
|
Quality Certificate: |
No |
|
|
|
|
Maximum recommended commercial credit: |
28.000 |
|
Payment Behaviour: |
Without Experience |
|
Prospects: |
Face recession |
|
Industry situation: |
Maturity |
|
|
|
|
Defaults, Legal Claims and Insolvency Proceedings : |
|
|
|
|
|
|
|
Number |
Amount (€) |
Most Recent Entry |
|
Insolvency Proceedings, Bankruptcy and Suspension of
Payments |
|
Unpublished |
--- |
--- |
|
Defaults on debt with Financial Institutions and Large
Companies |
|
None |
--- |
--- |
|
Judicial Claims (Notices, Executive Proceedings,
Attachments, Auctions, Bad Debt) |
|
None |
0 |
--- |
|
Proceedings heard by the Civil Court |
|
Unpublished |
0 |
--- |
|
Proceedings heard by the Labour Court |
|
Unpublished |
0 |
--- |
|
|
|
Partners: |
|
|
|
BIOTECHNOLOGY ENTERPRISES GROUP SL |
100 % |
|
|
Shares: |
0 |
|
|
Other Links: |
1 |
|
|
No. of Active Corporate Bodies: |
SINGLE ADMINISTRATOR 1 |
|
|
Ratios |
2013 |
2012 |
Change |
|
|
|
|
|
Guarantees: |
|
|
Properties Registered: |
Company NO, Administrator NO |
|
Financing / Guarantee Sources : |
Sources YES, Guarantees NO |
|
|
|
|
|
|
|
INVESTIGATION SUMMARY |
|
|
The subject, BTSA BIOTECNOLOGIAS APLICADAS SL NIF
B-80.816.531, was incorporated by an indefinite time in Madrid in 1994, and
is engaged in the manufacture and amrketing of organic chemicals. Its overall
structure and commercial development seem to be unfavourable, according to
the consulted sources. The last Accounts filed at the Trade Registry are
those for the 2013 fiscal year. We recommend being cautious and doing a
follow up. |
|
|
Interviewed Person: |
|
Enquiry
Details
|
|
|
Business address regime: |
Rent |
Identification
|
|
|
Social Denomination: |
BTSA BIOTECNOLOGIAS APLICADAS SL |
|
Trade Name: |
BTSA |
|
NIF / Fiscal code: |
B80816531 |
|
Corporate Status: |
ACTIVE |
|
Start of activity: |
1994 |
|
Registered Office: |
C/ ARROBA, 4. |
|
Locality: |
ALCALA DE HENARES |
|
Province: |
MADRID |
|
Postal Code: |
28805 |
|
Telephone: |
918 305 860 |
|
Fax: |
918 305 936 |
|
Website: |
www.btsa-es.com |
|
Email: |
info@btsa-es.com |
|
Interviewed Person: |
Employees |
Branch
Offices
|
|
|
|
|
|
Address |
Postal Code |
City |
Province |
|
CALLE ARROBA 20 P 5 7 B |
28805 |
ALCALA DE HENARES |
MADRID |
|
CALLE SIERRA DE GRAZALEMA (DE) 4 BJ 1 |
28946 |
FUENLABRADA |
MADRID |
|
CALLE PADRE JESUS ORDOÑEZ 18 1 DC |
28002 |
MADRID |
MADRID |
\Activity
|
|
|
NACE: |
2059 |
|
Corporate Purpose: |
The subject is engaged in the manufacture, elaboration,
transformation and marketing of chemicals, active ingredients and additives. |
|
Additional Information: |
The subject is known to be engaged in the elaborationa
nd sale of chemicals, natural antioxidants aimed at the food, cosmetic and
dietary industries. |
|
Additional Address: |
The Registered Office is located at calle Arroba 4,
Parque Tecnológico Tecnoalcala, de Alcalá de Henares, 28805, en Madrid. |
|
Franchise: |
No |
|
Import / export: |
EXPORTS |
|
Future Perspective: |
Face recession |
|
Industry situation: |
Maturity |
\Number of Employees
|
|
|
|
|
|
|
Year |
No. of employees |
Established |
Incidentals |
|
|
|
2018 |
30 |
|
|
|
The
data of employees is from the latest available financial statements in. Failing
that, are estimates data calculated by statistical methods
|
|
|||
|
|
Year |
Act |
|
|
|
1994 |
Appointments/ Re-elections (3) Company Formation (1)
Increase of Capital (1) |
|
|
|
1995 |
Appointments/ Re-elections (1) Cessations/
Resignations/ Reversals (1) Increase of Capital (1) Statutory Modifications
(1) |
|
|
|
1996 |
Accounts deposit (year 1994) Cessations/ Resignations/ Reversals
(2) |
|
|
|
1997 |
Accounts deposit (year 1995) Change of Social address
(1) Disapproved accounts (1) |
|
|
|
1998 |
Accounts deposit (year 1996) |
|
|
|
1999 |
Accounts deposit (year 1997) |
|
|
|
2000 |
Accounts deposit (year 1998, 1999) |
|
|
|
2001 |
Adaptation to Law (1) Appointments/ Re-elections (1)
Cessations/ Resignations/ Reversals (1) Increase of Capital (2) Other
Concepts/ Events (1) |
|
|
|
2002 |
Accounts deposit (year 2000, 2001) Appointments/
Re-elections (1) Change of Social address (1) Statutory Modifications (1) |
|
|
|
2003 |
Accounts deposit (year 2002) |
|
|
|
2004 |
Accounts deposit (year 2003) Cessations/ Resignations/ Reversals
(1) |
|
|
|
2005 |
Appointments/ Re-elections (2) Correction (1) Increase
of Capital (1) |
|
|
|
2006 |
Appointments/ Re-elections (3) Cessations/
Resignations/ Reversals (1) Correction (1) Increase of Capital (1) Other Concepts/
Events (1) |
|
|
|
2007 |
Accounts deposit (year 2004, 2005, 2006) Cessations/
Resignations/ Reversals (2) Change of Social address (1) Declaration of Sole
Propietorship (1) |
|
|
|
2009 |
Accounts deposit (year 2007) |
|
|
|
2010 |
Accounts deposit (year 2008, 2009) |
|
|
|
2011 |
Appointments/ Re-elections (1) Cessations/
Resignations/ Reversals (1) Change of Social address (1) |
|
|
|
2012 |
Accounts deposit (year 2010, 2011) Appointments/ Re-elections
(1) Cessations/ Resignations/ Reversals (1) |
|
|
|
2013 |
Appointments/ Re-elections (1) |
|
|
|
2014 |
Accounts deposit (year 2012) Appointments/ Re-elections
(3) Cessations/ Resignations/ Reversals (2) Loss of the sole propietorship
condition (1) Other Concepts/ Events (1) Take-over Merger (3) |
|
|
|
2015 |
Accounts deposit (year 2013) |
|
|
|
2016 |
Cessations/ Resignations/ Reversals (1) |
|
Breakdown
of Owners' Equity
|
|
|
Registered Capital: |
260.568,80 |
|
Paid up capital: |
260.568,80 |
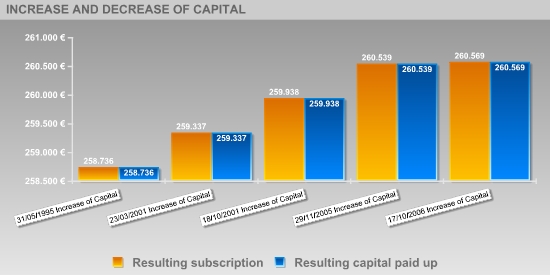
Updated
Evolution of the Subscribed and Paid-in Capital
|
|||||
|
|
|
|
|
|
|
|
|
|||||
|
|
|
|
|
|
|
|
Publishing Date |
Registration Type |
Capital Subscribed |
Paid up capital |
Underwritten result |
Disbursed Result |
|
24/03/1994 |
Company Formation |
96.162 |
96.162 |
96.162 |
96.162 |
|
21/06/1994 |
Increase of Capital |
51.387 |
51.387 |
147.548 |
147.548 |
|
31/05/1995 |
Increase of Capital |
111.187 |
111.187 |
258.736 |
258.736 |
|
23/03/2001 |
Increase of Capital |
601 |
601 |
259.337 |
259.337 |
|
18/10/2001 |
Increase of Capital |
601 |
601 |
259.938 |
259.938 |
|
29/11/2005 |
Increase of Capital |
601 |
601 |
260.539 |
260.539 |
|
17/10/2006 |
Increase of Capital |
30 |
30 |
260.569 |
260.569 |
Active
Social Bodies
|
|
|
|
|
|
Post published |
Social Body's Name |
Appointment Date |
Other Positions in this Company |
|
SINGLE ADMINISTRATOR |
UGIDOS ALVAREZ ANA VICTORIA |
07/11/2014 |
7 |
|
PROXY |
CUERVO-ARANGO MARTINEZ CARLOS |
22/10/2014 |
2 |
|
|
UGIDOS ALVAREZ ANA VICTORIA |
14/04/1994 |
7 |
|
ACCOUNTS' AUDITOR / HOLDER |
KPMG AUDITORES SL |
20/11/2014 |
1 |
Historical
Social Bodies
|
|
|
|
|
|
Social Body's Name |
Post published |
End Date |
Other Positions in this Company |
|
ALVARGONZALEZ JUNQUERA ASUNCION |
JOINT MANAGER |
13/12/1995 |
1 |
|
BRITEX FABRICS SL |
SINGLE PARTNER |
10/10/2014 |
1 |
|
CAMARA MARTINEZ JUAN |
MEMBER OF THE BOARD |
07/11/1996 |
2 |
|
|
PROXY |
04/11/1996 |
|
|
CUERVO-ARANGO MARTINEZ CARLOS |
MEMBER OF THE BOARD |
07/11/2014 |
2 |
|
FAY AND CO AUDITORES Y CONSULTORES SL |
ACCOUNTS' AUDITOR / HOLDER |
14/06/2012 |
1 |
|
FERNANDEZ DE LA PUEBLA ZORRILLA ANGEL |
VICE CHAIRMAN |
07/11/2014 |
1 |
|
FERNANDEZ PUEBLA ZORRILLA ANGEL |
MEMBER OF THE BOARD |
10/01/2001 |
8 |
|
|
MEMBER OF THE BOARD |
01/02/2011 |
|
|
|
MEMBER OF THE BOARD |
07/11/2014 |
|
|
|
PROXY |
22/10/2014 |
|
|
|
CHIEF EXECUTIVE OFFICER |
07/11/2014 |
|
|
|
SOLE CHIEF EXECUTIVE OFFICER |
10/01/2001 |
|
|
|
PRESIDENT |
10/01/2001 |
|
|
|
PRESIDENT |
01/02/2011 |
|
|
FOURNIER ALVARGONZALEZ CARLOS |
MEMBER OF THE BOARD |
30/10/2007 |
1 |
|
LANDECHO GONZALEZ-SOTO MARIA ISABEL |
ACCOUNTS' AUDITOR / HOLDER |
21/07/2006 |
2 |
|
|
ACCOUNTS' AUDITOR / HOLDER |
08/10/2007 |
|
|
MARTIN DE CACERES Y GODOY SILVIA |
MEMBER OF THE BOARD |
10/01/2001 |
1 |
|
MATA VAZQUEZ FRANCISCO JAVIER |
MEMBER OF THE BOARD |
24/02/2006 |
3 |
|
|
MEMBER OF THE BOARD |
07/11/2014 |
|
|
|
SECRETARY |
07/11/2014 |
|
|
MAZARIO TABERNERO MARIA VICTORIA |
PROXY |
17/10/2016 |
1 |
|
OJEDA LANDA MIGUEL IGNACIO |
MEMBER OF THE BOARD |
10/01/2001 |
4 |
|
|
MEMBER OF THE BOARD |
30/10/2007 |
|
|
|
SECRETARY |
10/01/2001 |
|
|
|
SECRETARY |
24/02/2006 |
|
|
OTAMENDI PINEDA MERCEDES |
JOINT MANAGER |
13/12/1995 |
1 |
|
ROCAMORA PELLICER ANTONIO |
MEMBER OF THE BOARD |
10/01/2001 |
1 |
|
ROCAMORA TRIAS ANTONIO |
MEMBER OF THE BOARD |
30/10/2007 |
1 |
|
SAUCA FERNANDEZ JULIAN |
MEMBER OF THE BOARD |
14/06/2012 |
1 |
|
SIERRA ORTA OSCAR |
MEMBER OF THE BOARD |
08/07/2004 |
1 |
|
UGIDOS ALVAREZ ANA VICTORIA |
MEMBER OF THE BOARD |
10/01/2001 |
7 |
|
|
MEMBER OF THE BOARD |
07/11/2014 |
|
|
|
CHIEF EXECUTIVE OFFICER |
07/11/2014 |
|
|
|
SOLE CHIEF EXECUTIVE OFFICER |
21/02/2002 |
|
|
|
PRESIDENT |
07/11/2014 |
|
|
UHY FAY AND CO AUDITORES Y CONSULTORES SL |
ACCOUNTS' AUDITOR / HOLDER |
20/11/2014 |
1 |
Executive
board
|
|
Post |
NIF |
Name |
|
ADMINISTRATOR |
|
ANA VICTORIA UGIDOS ALVAREZ |
|
FINANCIAL DIRECTOR |
|
VICTORIA MAZARIO |
|
MANAGING DIRECTOR |
|
ANA VICTORIA UGIDOS ALVAREZ |
Defaults,
Legal Claims and Insolvency Proceedings
|
|
|
|
|
Section
enabling assessment of the degree of compliance of the company queried with its
payment obligations. It provides information on the existence and nature of all
stages of Insolvency and Legal Proceedings published with reference to the
Company in the country's various Official Bulletins and national newspapers, as
well Defaults Registered in the main national credit bureaus (ASNEF Industrial
and RAI ).
>
Summary
Chronological
summary
|
|
|
Number of Publications |
Amount (€) |
Start date |
End date |
|
Insolvency Proceedings, Bankruptcy and Suspension of
Payments |
|
Unpublished |
--- |
--- |
--- |
|
Request/Declaration |
|
0 |
--- |
date |
|
|
Proceedings |
|
--- |
--- |
|
--- |
|
Resolution |
|
--- |
--- |
|
--- |
|
Defaults on debt with Financial Institutions and Large
Companies |
Bank and Commercial Delinquency |
None |
0 |
|
|
|
Status: Friendly |
|
--- |
|
|
|
|
Status: Pre-Litigation |
|
--- |
|
|
|
|
Status: Litigation |
|
--- |
|
|
|
|
Status: Non-performing |
|
--- |
|
|
|
|
Status: insolvency proceedings, bankruptcy and
suspension of payments |
|
--- |
|
|
|
|
Other status |
|
--- |
|
|
|
|
Legal and Administrative Proceedings |
|
Unpublished |
--- |
|
|
|
Notices of defaults and enforcement |
|
--- |
--- |
|
--- |
|
Seizures |
|
--- |
--- |
|
--- |
|
Auctions |
|
--- |
--- |
|
--- |
|
Declarations of insolvency and bad debt |
|
--- |
--- |
|
--- |
|
Proceedings heard by the Civil Court |
|
Unpublished |
--- |
|
|
|
Proceedings heard by the Labour Court |
|
Unpublished |
--- |
|
|
>
Basis for scoring
|
Positive Factors |
Adverse Factors |
|
|
No Company's subsidiaries or branches are known. It has failed to comply with its obligation to submit
its annual accounts,and said information has expired. This behaviour
indicates lack of transparency towards the market. Possible difficulty accessing financing. Uncertainties
about economic recovery will hinder access to credit for new projects or for
obtaining the liquidity necessary for short-term needs. The path traveled by the entity has highlighted the
lack of stability in corporate bodies . |
Probability of default
|
|
|
|
|
>
Estimated Probability of Default for the next 12 months: 6.814 %
|
Sector in which comparison is carried out: 205 Manufacture of other chemical products |
|
|
Relative Position:
|
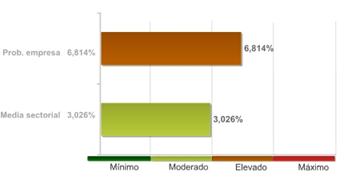
The
company's comparative analysis with the rest of the companies that comprise the
sector, shows the company holds a worse position with regard to the probability
of non-compliance.
The
22.00% of the companies of the sector BTSA BIOTECNOLOGIAS APLICADAS SL belongs
to shows a lower probability of non-compliance.
The
probability of the company's non-compliance with its payment obligations within
deadlines estimated by our qualifications models is 6,814%.
In
the event they fail to comply with the payment, the seriousness of the loss
will depend on factors such as the promptness of the commencement of the
charging management, the existence of executive documents which match the
credit or the existence of guarantees and free debt assets under the name of
the debtor. Therefore, the probability of non-compliance should not be solely
interpreted as the total loss of the owed amount.
Recommended commercial credit
|
|
|
|
|
Favourable
until 28.000 € (Guideline value of outstanding commercial balance
that recommends be awarded to or maintained with the company queried)
Result
of query submitted to the R.A.I. (Spanish Bad Debt Register) on
|
|
|
|
|
|
|
|
Summary of Judicial Claims |
|
|
|
|
|
|
|
|
||
|
|
|
Not published |
|
|
|
|
Not published |
|
|
|
|
||
|
|
|
Not published |
|
|
|
|
Not published |
|
|
|
|
Not published |
|
|
|
|
Not published |
|
|
|
|
||
|
|
|
Not published |
|
|
|
|
Not published |
|
|
|
|
||
|
|
|
Not published |
|
Guarantees
|
|
References |
|
|
|
|
|
|
Suppliers |
|
|
|
Name |
NIF |
Telephone |
|
|
|
BIOTECH ACCELERATOR SL |
B85470318 |
915767090 |
|
Link
List
|
|
ABSORBS TO: |
1 Entities |
|
SHAREHOLDERS: |
1 Entities |
>
Shareholders
|
Relationship |
Entity |
Province |
Shareholding stake |
|
SHAREHOLDERS |
BIOTECHNOLOGY ENTERPRISES GROUP SL |
MADRID |
100 |
>
Other relationships
|
Relationship |
Entity |
Province |
Shareholding stake |
|
ABSORBS TO |
BIOTECHNOLOGY ENTERPRISES GROUP SL |
MADRID |
|
Turnover
|
|
|
Total Sales 2013 |
9.759.116 |
The
sales data is from the latest available financial statements in. Failing that,
are estimates data calculated by statistical methods.
Estimated
Balance
|
|
No estimated figures can be provided, as the consulted
sources declined to confirm whether the subject carries out the
already-mentioned activities or not. The last Accounts filed at the Trade
Registry are those for the 2013 fiscal year. |
Financial
Accounts and Balance Sheets
|
|
|
|
|
Financial
Years Presented
|
Ejercicio |
Tipo de Cuentas Anuales |
Fecha Presentacion |
|
2013 |
Normales |
January 2015 |
|
2012 |
Normales |
May 2014 |
|
2011 |
Normales |
October 2012 |
|
2010 |
Normales |
January 2012 |
|
2009 |
Normales |
October 2010 |
|
2008 |
Normales |
January 2010 |
|
2007 |
Normales |
May 2009 |
|
2006 |
Normales |
December 2007 |
|
2005 |
Normales |
November 2007 |
|
2004 |
Normales |
October 2007 |
|
2003 |
Normales |
October 2004 |
|
2002 |
Normales |
December 2003 |
|
2001 |
Normales |
September 2002 |
|
2000 |
Normales |
February 2002 |
|
1999 |
Normales |
December 2000 |
|
1998 |
Normales |
March 2000 |
|
1997 |
Normales |
March 1999 |
|
1996 |
Normales |
January 1998 |
|
1995 |
Normales |
November 1997 |
|
1994 |
Normales |
May 1996 |
The
data in the report regarding the last Company Accounts submitted by the company
is taken from the TRADE REGISTER serving the region in which the company's
address is located 31/12/2013
>
Normal format Balance in accordance with the New Accounting Plan 2007
Information
corresponding to the fiscal year
2013 2012 2011 2010 2009 is taken from information
submitted to the TRADE REGISTER. Data corresponding to fiscal years before
2013 2012 2011 2010 2009 has been compiled based on
the equivalence criteria stipulated in Act JUS/206/2009. Where the provisions of
the Act did not establish relevant equivalence criteria,created such criteria
using its own methodology. To view details on the methodology.
|
|
ORIGINAL |
ORIGINAL |
ORIGINAL |
ORIGINAL |
ORIGINAL |
|
|
Assets |
2013 |
2012 |
2011 |
2010 |
2009 |
|
|
A) NON-CURRENT ASSETS: 11000 |
5.484.997,00 |
5.126.601,00 |
4.348.804,00 |
3.745.617,00 |
2.039.742,00 |
|
|
I. Intangible fixed assets :
11100 |
1.401.625,00 |
1.547.776,00 |
1.481.874,00 |
1.276.914,00 |
947.483,00 |
|
|
1.
Development: 11110 |
1.326.407,00 |
0,00 |
0,00 |
0,00 |
0,00 |
|
|
2.
Concessions: 11120 |
0,00 |
0,00 |
0,00 |
0,00 |
0,00 |
|
|
3. Patents,
licencing, trade marks and similar: 11130 |
0,00 |
388,00 |
388,00 |
388,00 |
0,00 |
|
|
4. Goodwill:
11140 |
71.875,00 |
653.000,00 |
653.000,00 |
185.000,00 |
0,00 |
|
|
5. IT
applications: 11150 |
3.343,00 |
19.547,00 |
19.547,00 |
13.047,00 |
0,00 |
|
|
6. Investigation:
11160 |
0,00 |
874.841,00 |
808.939,00 |
610.479,00 |
0,00 |
|
|
7.
Intellectual property: 11180 |
0,00 |
0,00 |
0,00 |
0,00 |
0,00 |
|
|
8. Greenhouse
gas emission allowance: 11190 |
0,00 |
0,00 |
0,00 |
0,00 |
0,00 |
|
|
9. Other
intangible fixed assets. : 11170 |
0,00 |
0,00 |
0,00 |
468.000,00 |
0,00 |
|
|
II. Tangible fixed assets :
11200 |
2.418.334,00 |
2.340.607,00 |
2.141.367,00 |
1.885.340,00 |
1.081.896,00 |
|
|
1. Land and
buildings: 11210 |
1.802.977,00 |
1.341.332,00 |
1.440.745,00 |
516.669,00 |
0,00 |
|
|
2. Technical
installations and other tangible fixed assets: 11220 |
613.632,00 |
997.550,00 |
698.897,00 |
490.651,00 |
0,00 |
|
|
3. Tangible
asset in progress and advances: 11230 |
1.725,00 |
1.725,00 |
1.725,00 |
878.020,00 |
0,00 |
|
|
III. Real estate investment:
11300 |
0,00 |
0,00 |
0,00 |
0,00 |
0,00 |
|
|
1. Land:
11310 |
0,00 |
0,00 |
0,00 |
0,00 |
0,00 |
|
|
2. Buildings:
11320 |
0,00 |
0,00 |
0,00 |
0,00 |
0,00 |
|
|
IV. Long-term investments in Group
companies and associates : 11400 |
1.521.432,00 |
1.212.857,00 |
715.200,00 |
573.000,00 |
0,00 |
|
|
1. Equity
instruments: 11410 |
0,00 |
0,00 |
0,00 |
0,00 |
0,00 |
|
|
2. Credits to
businesses: 11420 |
1.521.432,00 |
1.212.857,00 |
715.200,00 |
573.000,00 |
0,00 |
|
|
3. Debt
securities: 11430 |
0,00 |
0,00 |
0,00 |
0,00 |
0,00 |
|
|
4.
Derivatives : 11440 |
0,00 |
0,00 |
0,00 |
0,00 |
0,00 |
|
|
5. Other
financial assets : 11450 |
0,00 |
0,00 |
0,00 |
0,00 |
0,00 |
|
|
6. Other
investments: 11460 |
0,00 |
0,00 |
0,00 |
0,00 |
0,00 |
|
|
V. Long-term financial
investments: 11500 |
105.917,00 |
25.361,00 |
10.363,00 |
10.363,00 |
10.363,00 |
|
|
1. Equity instruments:
11510 |
2.131,00 |
14.998,00 |
0,00 |
0,00 |
0,00 |
|
|
2. Credits to
third parties : 11520 |
0,00 |
0,00 |
0,00 |
0,00 |
0,00 |
|
|
3. Debt
securities: 11530 |
0,00 |
0,00 |
0,00 |
0,00 |
0,00 |
|
|
4.
Derivatives : 11540 |
0,00 |
0,00 |
0,00 |
0,00 |
0,00 |
|
|
5. Other
financial assets : 11550 |
103.786,00 |
10.363,00 |
10.363,00 |
10.363,00 |
0,00 |
|
|
6. Other
investments: 11560 |
0,00 |
0,00 |
0,00 |
0,00 |
0,00 |
|
|
VII. Non-current trade debts :
11700 |
0,00 |
0,00 |
0,00 |
0,00 |
0,00 |
|
|
VI. Assets for deferred tax :
11600 |
37.689,00 |
0,00 |
0,00 |
0,00 |
0,00 |
|
|
B) CURRENT ASSETS: 12000 |
3.243.874,00 |
3.343.658,00 |
4.017.592,00 |
3.484.061,00 |
2.536.280,00 |
|
|
I. Non-current assets held for
sale : 12100 |
0,00 |
0,00 |
0,00 |
0,00 |
0,00 |
|
|
II. Stocks: 12200 |
1.702.634,00 |
1.400.501,00 |
1.435.631,00 |
697.718,00 |
398.034,00 |
|
|
1.
Commercial: 12210 |
0,00 |
0,00 |
0,00 |
0,00 |
0,00 |
|
|
2. Primary
material and other supplies: 12220 |
1.406.725,00 |
1.227.546,00 |
876.831,00 |
690.106,00 |
0,00 |
|
|
a) Long-term primary material and other supplies: 12221 |
0,00 |
0,00 |
0,00 |
0,00 |
0,00 |
|
|
b) Short-term primary material and other supplies: 12222 |
0,00 |
0,00 |
0,00 |
0,00 |
0,00 |
|
|
3. Work in
progress: 12230 |
0,00 |
0,00 |
0,00 |
0,00 |
0,00 |
|
|
a) Of long-term production cycle : 12231 |
0,00 |
0,00 |
0,00 |
0,00 |
0,00 |
|
|
b) Of short-term production cycle : 12232 |
0,00 |
0,00 |
0,00 |
0,00 |
0,00 |
|
|
4. Finished
goods: 12240 |
295.910,00 |
172.955,00 |
560.809,00 |
9.621,00 |
0,00 |
|
|
a) Of long-term production cycle : 12241 |
0,00 |
0,00 |
0,00 |
0,00 |
0,00 |
|
|
b) Of short-term production cycle : 12242 |
295.910,00 |
172.955,00 |
560.809,00 |
9.621,00 |
0,00 |
|
|
5.
By-products, residues and recycled materials: 12250 |
0,00 |
0,00 |
0,00 |
0,00 |
0,00 |
|
|
6. Advances
to suppliers: 12260 |
0,00 |
0,00 |
-2.008,00 |
-2.008,00 |
0,00 |
|
|
III. Trade debtors and others
receivable accounts: 12300 |
1.241.695,00 |
1.764.783,00 |
2.450.235,00 |
2.616.421,00 |
1.942.059,00 |
|
|
1. Trade
debtors / accounts receivable: 12310 |
1.189.932,00 |
1.314.321,00 |
1.488.504,00 |
1.563.304,00 |
898.974,00 |
|
|
a) Long-term receivables from sales and services supplied :
12311 |
0,00 |
0,00 |
0,00 |
0,00 |
0,00 |
|
|
b) Customers for sales and provisions of services : 12312 |
1.189.932,00 |
1.314.321,00 |
1.488.504,00 |
1.563.304,00 |
898.974,00 |
|
|
2. Customers,
Group companies and associates : 12320 |
0,00 |
0,00 |
0,00 |
0,00 |
0,00 |
|
|
3. Other
accounts receivable: 12330 |
326,00 |
401.813,00 |
456.378,00 |
482.288,00 |
1.043.085,00 |
|
|
4. Personnel:
12340 |
0,00 |
0,00 |
0,00 |
14,00 |
0,00 |
|
|
5. Assets for
deferred tax: 12350 |
0,00 |
0,00 |
0,00 |
0,00 |
0,00 |
|
|
6. Other
debtors, including tax and social security: 12360 |
51.437,00 |
48.649,00 |
505.353,00 |
570.816,00 |
0,00 |
|
|
7. Called up share
capital: 12370 |
0,00 |
0,00 |
0,00 |
0,00 |
0,00 |
|
|
IV. Short-term investments in
Group companies and associates: 12400 |
0,00 |
0,00 |
0,00 |
0,00 |
0,00 |
|
|
1. Equity
instruments: 12410 |
0,00 |
0,00 |
0,00 |
0,00 |
0,00 |
|
|
2. Credits to
businesses: 12420 |
0,00 |
0,00 |
0,00 |
0,00 |
0,00 |
|
|
3. Debt
securities: 12430 |
0,00 |
0,00 |
0,00 |
0,00 |
0,00 |
|
|
4.
Derivatives : 12440 |
0,00 |
0,00 |
0,00 |
0,00 |
0,00 |
|
|
5. Other
financial assets : 12450 |
0,00 |
0,00 |
0,00 |
0,00 |
0,00 |
|
|
6. Other
investments: 12460 |
0,00 |
0,00 |
0,00 |
0,00 |
0,00 |
|
|
V. Short-term financial investments
: 12500 |
114.098,00 |
97.203,00 |
84.008,00 |
70.008,00 |
20.008,00 |
|
|
1. Equity
instruments: 12510 |
0,00 |
0,00 |
0,00 |
0,00 |
0,00 |
|
|
2. Credits to
businesses: 12520 |
0,00 |
0,00 |
0,00 |
0,00 |
0,00 |
|
|
3. Debt
securities: 12530 |
104.098,00 |
87.203,00 |
84.008,00 |
70.008,00 |
0,00 |
|
|
4.
Derivatives : 12540 |
0,00 |
0,00 |
0,00 |
0,00 |
0,00 |
|
|
5. Other
financial assets : 12550 |
10.000,00 |
10.000,00 |
0,00 |
0,00 |
0,00 |
|
|
6. Other
investments: 12560 |
0,00 |
0,00 |
0,00 |
0,00 |
0,00 |
|
|
VI. Short-term accruals:
12600 |
0,00 |
0,00 |
0,00 |
0,00 |
0,00 |
|
|
VII. Cash and other equivalent
liquid assets : 12700 |
185.446,00 |
81.171,00 |
47.719,00 |
99.914,00 |
176.179,00 |
|
|
1. Treasury:
12710 |
185.446,00 |
81.171,00 |
47.040,00 |
99.235,00 |
0,00 |
|
|
2. Other equivalent
liquid assets: 12720 |
0,00 |
0,00 |
679,00 |
679,00 |
0,00 |
|
|
TOTAL ASSETS (A + B) : 10000 |
8.728.870,00 |
8.470.259,00 |
8.366.396,00 |
7.229.678,00 |
4.576.021,00 |
|
|
|
ORIGINAL |
ORIGINAL |
ORIGINAL |
ORIGINAL |
ORIGINAL |
|
|
Liabilities and Net Worth |
2013 |
2012 |
2011 |
2010 |
2009 |
|
|
A) NET WORTH: 20000 |
1.471.128,00 |
1.345.210,00 |
1.494.470,00 |
1.240.675,00 |
1.505.571,00 |
|
|
A-1) Shareholders' equity:
21000 |
1.148.227,00 |
1.085.943,00 |
1.083.045,00 |
920.912,00 |
825.646,00 |
|
|
I. Capital: 21100 |
260.569,00 |
260.569,00 |
260.569,00 |
260.569,00 |
260.569,00 |
|
|
1. Registered
capital : 21110 |
260.569,00 |
260.569,00 |
260.569,00 |
260.569,00 |
260.569,00 |
|
|
2. (Uncalled
capital): 21120 |
0,00 |
0,00 |
0,00 |
0,00 |
0,00 |
|
|
II. Share premium: 21200 |
210.355,00 |
210.355,00 |
210.355,00 |
210.355,00 |
210.355,00 |
|
|
III. Reserves: 21300 |
615.019,00 |
612.121,00 |
449.989,00 |
353.515,00 |
304.145,00 |
|
|
1. Legal and
statutory: 21310 |
52.114,00 |
52.114,00 |
45.321,00 |
35.673,00 |
0,00 |
|
|
2. Other
reserves: 21320 |
562.905,00 |
560.007,00 |
404.668,00 |
317.842,00 |
0,00 |
|
|
3.
Revaluation reserves: 21330 |
0,00 |
0,00 |
0,00 |
0,00 |
0,00 |
|
|
2.
Capitalisation Reserves: 21350 |
0,00 |
0,00 |
0,00 |
0,00 |
0,00 |
|
|
IV. (Common stock equity):
21400 |
0,00 |
0,00 |
0,00 |
0,00 |
0,00 |
|
|
V. Results from previous periods:
21500 |
0,00 |
0,00 |
0,00 |
0,00 |
0,00 |
|
|
1. Brought
forward: 21510 |
0,00 |
0,00 |
0,00 |
0,00 |
0,00 |
|
|
2. (Negative
results from previous periods): 21520 |
0,00 |
0,00 |
0,00 |
0,00 |
0,00 |
|
|
VI. Other shareholders'
contributions: 21600 |
0,00 |
0,00 |
0,00 |
0,00 |
0,00 |
|
|
VII. Result of the period: 21700 |
62.284,00 |
2.898,00 |
162.132,00 |
96.473,00 |
50.578,00 |
|
|
VIII. (Interim dividend):
21800 |
0,00 |
0,00 |
0,00 |
0,00 |
0,00 |
|
|
IX. Other net worth instruments:
21900 |
0,00 |
0,00 |
0,00 |
0,00 |
0,00 |
|
|
A-2) Adjustments due to changes in
value: 22000 |
0,00 |
0,00 |
0,00 |
0,00 |
0,00 |
|
|
I. Financial assets held for sale:
22100 |
0,00 |
0,00 |
0,00 |
0,00 |
0,00 |
|
|
II. Hedge operations: 22200 |
0,00 |
0,00 |
0,00 |
0,00 |
0,00 |
|
|
III. Linked non-current assets and
liabilities held for sale : 22300 |
0,00 |
0,00 |
0,00 |
0,00 |
0,00 |
|
|
IV. Exchange rate difference:
22400 |
0,00 |
0,00 |
0,00 |
0,00 |
0,00 |
|
|
V. Other: 22500 |
0,00 |
0,00 |
0,00 |
0,00 |
0,00 |
|
|
A-3) Received subsidies, donations
and legacies: 23000 |
322.900,00 |
259.268,00 |
411.425,00 |
319.763,00 |
679.925,00 |
|
|
B) NON-CURRENT LIABILITIES: 31000 |
2.779.234,00 |
2.289.416,00 |
2.440.711,00 |
2.258.005,00 |
1.050.351,00 |
|
|
I. Long-term provisions:
31100 |
0,00 |
0,00 |
0,00 |
0,00 |
0,00 |
|
|
1. Long-term
employee benefits liability: 31110 |
0,00 |
0,00 |
0,00 |
0,00 |
0,00 |
|
|
2.
Environmental actions: 31120 |
0,00 |
0,00 |
0,00 |
0,00 |
0,00 |
|
|
3.
Restructuring provisions: 31130 |
0,00 |
0,00 |
0,00 |
0,00 |
0,00 |
|
|
4. Other
provisions: 31140 |
0,00 |
0,00 |
0,00 |
0,00 |
0,00 |
|
|
II Long-term creditors:
31200 |
2.636.800,00 |
2.178.301,00 |
2.264.386,00 |
2.053.934,00 |
1.050.351,00 |
|
|
1.
Liabilities and other securities: 31210 |
0,00 |
0,00 |
0,00 |
0,00 |
0,00 |
|
|
2. Amounts
owed to credit institutions: 31220 |
905.954,00 |
590.947,00 |
2.073.826,00 |
1.844.435,00 |
822.671,00 |
|
|
3. Creditors
from financial leasing: 31230 |
73.194,00 |
97.534,00 |
113.959,00 |
132.898,00 |
151.079,00 |
|
|
4.
Derivatives : 31240 |
0,00 |
0,00 |
0,00 |
0,00 |
0,00 |
|
|
5. Other
financial liabilities : 31250 |
1.657.652,00 |
1.489.820,00 |
76.601,00 |
76.601,00 |
0,00 |
|
|
III. Long-term debts with Group
companies and associates: 31300 |
0,00 |
0,00 |
0,00 |
0,00 |
0,00 |
|
|
IV. Liabilities for deferred tax:
31400 |
142.434,00 |
111.115,00 |
176.325,00 |
204.070,00 |
0,00 |
|
|
V. Long-term accruals: 31500 |
0,00 |
0,00 |
0,00 |
0,00 |
0,00 |
|
|
VI. Non-current trade creditors :
31600 |
0,00 |
0,00 |
0,00 |
0,00 |
0,00 |
|
|
VII. Special long-term debts :
31700 |
0,00 |
0,00 |
0,00 |
0,00 |
0,00 |
|
|
C) CURRENT LIABILITIES : 32000 |
4.478.509,00 |
4.835.633,00 |
4.431.215,00 |
3.730.998,00 |
2.020.099,00 |
|
|
I. Liabilities linked to
non-current assets held for sale: 32100 |
0,00 |
0,00 |
0,00 |
0,00 |
0,00 |
|
|
II. Short-term provisions:
32200 |
0,00 |
0,00 |
0,00 |
31.049,00 |
31.049,00 |
|
|
1. Provisions
from greenhouse gas emission allowance: 32210 |
0,00 |
0,00 |
0,00 |
0,00 |
0,00 |
|
|
2. Other
provisions: 32220 |
0,00 |
0,00 |
0,00 |
0,00 |
0,00 |
|
|
III. Short-term creditors :
32300 |
2.525.012,00 |
3.125.650,00 |
3.269.327,00 |
1.937.536,00 |
853.343,00 |
|
|
1.
Liabilities and other securities: 32310 |
0,00 |
0,00 |
0,00 |
0,00 |
0,00 |
|
|
2. Amounts
owed to credit institutions: 32320 |
2.400.658,00 |
3.052.260,00 |
3.235.670,00 |
1.910.203,00 |
835.523,00 |
|
|
3. Creditors
from financial leasing: 32330 |
25.574,00 |
40.380,00 |
19.192,00 |
18.959,00 |
17.820,00 |
|
|
4.
Derivatives : 32340 |
0,00 |
0,00 |
0,00 |
0,00 |
0,00 |
|
|
5. Other
financial liabilities : 32350 |
98.780,00 |
33.010,00 |
14.465,00 |
8.374,00 |
0,00 |
|
|
IV. Short-term debts with Group
companies and associates: 32400 |
0,00 |
0,00 |
0,00 |
0,00 |
0,00 |
|
|
V. Trade creditors and other
accounts payable: 32500 |
1.953.497,00 |
1.709.983,00 |
1.161.888,00 |
1.762.413,00 |
1.135.707,00 |
|
|
1. Suppliers:
32510 |
1.546.572,00 |
1.179.633,00 |
482.968,00 |
1.148.556,00 |
510.640,00 |
|
|
a) Long-term debts : 32511 |
0,00 |
0,00 |
0,00 |
0,00 |
0,00 |
|
|
b) Short-term debts : 32512 |
1.546.572,00 |
1.179.633,00 |
482.968,00 |
1.148.556,00 |
510.640,00 |
|
|
2. Suppliers,
Group companies and associates: 32520 |
0,00 |
0,00 |
0,00 |
0,00 |
0,00 |
|
|
3. Other creditors:
32530 |
357.579,00 |
432.006,00 |
624.023,00 |
474.026,00 |
0,00 |
|
|
4. Personnel
(remuneration due): 32540 |
0,00 |
603,00 |
1.625,00 |
1.152,00 |
0,00 |
|
|
5.
Liabilities for current tax: 32550 |
0,00 |
0,00 |
0,00 |
0,00 |
0,00 |
|
|
6. Other
accounts payable to Public Administrations.: 32560 |
53.008,00 |
97.740,00 |
56.934,00 |
142.341,00 |
0,00 |
|
|
7. Advances
from clients: 32570 |
-3.662,00 |
0,00 |
-3.662,00 |
-3.662,00 |
0,00 |
|
|
VI. Short-term accruals:
32600 |
0,00 |
0,00 |
0,00 |
0,00 |
0,00 |
|
|
VII. Special short-term debts :
32700 |
0,00 |
0,00 |
0,00 |
0,00 |
0,00 |
|
|
TOTAL NET WORTH AND LIABILITIES (A + B + C) : 30000 |
8.728.870,00 |
8.470.259,00 |
8.366.396,00 |
7.229.678,00 |
4.576.021,00 |
|
|
|
ORIGINAL |
ORIGINAL |
ORIGINAL |
ORIGINAL |
ORIGINAL |
|
|
Profit and Loss |
2013 |
2012 |
2011 |
2010 |
2009 |
|
|
1. Net turnover: 40100 |
9.759.116,00 |
10.724.573,00 |
8.177.558,00 |
6.633.244,00 |
3.890.436,00 |
|
|
a) Sales: 40110 |
9.735.796,00 |
10.685.401,00 |
8.114.286,00 |
6.596.011,00 |
0,00 |
|
|
b) Rendering of services:
40120 |
23.320,00 |
39.172,00 |
63.272,00 |
37.233,00 |
0,00 |
|
|
c) Income of financial nature of
holding companies: 40130 |
0,00 |
0,00 |
0,00 |
0,00 |
0,00 |
|
|
2. Changes in stocks of finished goods and work in
progress: 40200 |
122.955,00 |
-387.853,00 |
551.188,00 |
-16.469,00 |
-145.424,00 |
|
|
3. Works carried out by the company for its assets:
40300 |
167.996,00 |
290.789,00 |
283.652,00 |
388.227,00 |
208.000,00 |
|
|
4. Supplies : 40400 |
-6.680.197,00 |
-7.970.624,00 |
-6.205.085,00 |
-5.044.176,00 |
-2.528.076,00 |
|
|
a) Stock consumption: 40410 |
0,00 |
0,00 |
-1.479.307,00 |
-2.536.458,00 |
0,00 |
|
|
b) Consumption of raw materials
and miscellaneous consumable ones: 40420 |
-6.673.264,00 |
-7.968.855,00 |
-4.700.967,00 |
-2.506.431,00 |
0,00 |
|
|
c) Works carried out by other
companies: 40430 |
-6.934,00 |
-1.770,00 |
-24.810,00 |
-1.288,00 |
0,00 |
|
|
d) Impairment of stock, primary
material and other supplies: 40440 |
0,00 |
0,00 |
0,00 |
0,00 |
0,00 |
|
|
5. Other operating income: 40500 |
2.794,00 |
415,00 |
9.272,00 |
9.004,00 |
15.938,00 |
|
|
a) Auxiliary income and other from
current management: 40510 |
2.794,00 |
415,00 |
272,00 |
4,00 |
0,00 |
|
|
b) Operation subsidies included in
the Period's result: 40520 |
0,00 |
0,00 |
9.000,00 |
9.000,00 |
0,00 |
|
|
6. Personnel costs: 40600 |
-1.276.794,00 |
-1.085.686,00 |
-927.016,00 |
-724.271,00 |
-744.107,00 |
|
|
a) Wages, salaries et al.:
40610 |
-1.016.212,00 |
-869.385,00 |
-744.415,00 |
-586.590,00 |
0,00 |
|
|
b) Social security costs:
40620 |
-260.582,00 |
-216.301,00 |
-182.601,00 |
-137.681,00 |
0,00 |
|
|
c) Provisions : 40630 |
0,00 |
0,00 |
0,00 |
0,00 |
0,00 |
|
|
7. Other operating costs: 40700 |
-1.702.767,00 |
-1.563.136,00 |
-1.450.316,00 |
-1.037.111,00 |
-653.026,00 |
|
|
a) External services: 40710 |
-1.688.245,00 |
-1.535.055,00 |
-1.381.437,00 |
-1.031.100,00 |
0,00 |
|
|
b) Taxes: 40720 |
-14.300,00 |
-20.101,00 |
-25.050,00 |
-6.009,00 |
0,00 |
|
|
c) Losses, impairments and
variation in provisions from trade operations : 40730 |
0,00 |
-7.703,00 |
-43.662,00 |
0,00 |
0,00 |
|
|
d) Other current management
expenditure : 40740 |
-222,00 |
-277,00 |
-167,00 |
-2,00 |
0,00 |
|
|
e) Expenses due to greenhouse gas
emissions: 40750 |
0,00 |
0,00 |
0,00 |
0,00 |
0,00 |
|
|
8. Amortisation of fixed assets: 40800 |
-514.454,00 |
-481.128,00 |
-323.679,00 |
-305.370,00 |
-211.099,00 |
|
|
9. Allocation of subsidies of non-financial fixed
assets and other: 40900 |
120.475,00 |
234.566,00 |
359.405,00 |
273.364,00 |
370.445,00 |
|
|
10. Excess provisions : 41000 |
0,00 |
0,00 |
31.049,00 |
0,00 |
0,00 |
|
|
11. Impairment and result of transfers of fixed assets:
41100 |
0,00 |
0,00 |
0,00 |
2.442,00 |
0,00 |
|
|
a) Impairment and losses : 41110 |
0,00 |
0,00 |
0,00 |
0,00 |
0,00 |
|
|
b) Results for transfers and other
: 41120 |
0,00 |
0,00 |
0,00 |
2.442,00 |
0,00 |
|
|
c) Impairment and profit due to
disposals of assets of holding companies: 41130 |
0,00 |
0,00 |
0,00 |
0,00 |
0,00 |
|
|
12. Negative difference in combined businesses:
41200 |
0,00 |
0,00 |
0,00 |
0,00 |
0,00 |
|
|
13. Other results : 41300 |
224.962,00 |
544.921,00 |
-110.464,00 |
0,00 |
-7.890,00 |
|
|
A.1) OPERATING INCOME (1 + 2 + 3 + 4 + 5 + 6 + 7 + 8 +
9 + 10 + 11 + 12 + 13) : 49100 |
224.086,00 |
306.835,00 |
395.564,00 |
178.883,00 |
195.196,00 |
|
|
14. Financial income : 41400 |
85.266,00 |
73.264,00 |
61.764,00 |
48.068,00 |
4.119,00 |
|
|
a) Of shares in equity instruments
: 41410 |
0,00 |
0,00 |
0,00 |
0,00 |
0,00 |
|
|
a 1) In Group
companies and associates: 41411 |
0,00 |
0,00 |
0,00 |
0,00 |
0,00 |
|
|
a 2) In third
parties: 41412 |
0,00 |
0,00 |
0,00 |
0,00 |
0,00 |
|
|
b) From negotiable securities and
other financial instruments : 41420 |
85.266,00 |
73.264,00 |
61.764,00 |
48.068,00 |
0,00 |
|
|
b 1) From
Group companies and associates : 41421 |
59.602,00 |
46.133,00 |
46.117,00 |
38.339,00 |
0,00 |
|
|
b 2) From
third parties : 41422 |
25.665,00 |
27.131,00 |
15.647,00 |
9.729,00 |
0,00 |
|
|
c) Allocation of financial
subsidies, donations and legacies : 41430 |
0,00 |
0,00 |
0,00 |
0,00 |
0,00 |
|
|
15. Financial expenditure: 41500 |
-241.379,00 |
-274.513,00 |
-315.833,00 |
-135.615,00 |
-123.212,00 |
|
|
a) Amounts owed to Group companies
and associates : 41510 |
0,00 |
0,00 |
-106.513,00 |
-89.668,00 |
0,00 |
|
|
b) For debts with third parties :
41520 |
-241.379,00 |
-274.513,00 |
-209.321,00 |
-41.973,00 |
0,00 |
|
|
c) Stock renewal : 41530 |
0,00 |
0,00 |
0,00 |
-3.974,00 |
0,00 |
|
|
16. Changes in fair value of financial instruments :
41600 |
-12.867,00 |
0,00 |
0,00 |
0,00 |
0,00 |
|
|
a) Trading book and other :
41610 |
-12.867,00 |
0,00 |
0,00 |
0,00 |
0,00 |
|
|
b) Allocation of financial assets held
for sale to the result for the period: 41620 |
0,00 |
0,00 |
0,00 |
0,00 |
0,00 |
|
|
17. Exchange rate differences : 41700 |
-26.462,00 |
-32.483,00 |
58.495,00 |
19.100,00 |
-15.818,00 |
|
|
18. Impairment and result for transfers of financial
instruments: 41800 |
0,00 |
-4.977,00 |
-926,00 |
0,00 |
0,00 |
|
|
a) Impairment and losses :
41810 |
0,00 |
0,00 |
0,00 |
0,00 |
0,00 |
|
|
b) Results for transfers and other
: 41820 |
0,00 |
-4.977,00 |
-926,00 |
0,00 |
0,00 |
|
|
19. Other financial income and expenditure: 42100 |
0,00 |
0,00 |
0,00 |
0,00 |
0,00 |
|
|
a) Incorporation of financial
expenditure to assets: 42110 |
0,00 |
0,00 |
0,00 |
0,00 |
0,00 |
|
|
b) Financial income from
arrangement with creditors: 42120 |
0,00 |
0,00 |
0,00 |
0,00 |
0,00 |
|
|
c) Other income and expenditure:
42130 |
0,00 |
0,00 |
0,00 |
0,00 |
0,00 |
|
|
A.2) FINANCIAL REVENUE (14+15+16+17+18+19) :
49200 |
-195.442,00 |
-238.709,00 |
-196.500,00 |
-68.448,00 |
-134.911,00 |
|
|
A.3) NET RESULT BEFORE TAXES (A.1+A.2) : 49300 |
28.644,00 |
68.127,00 |
199.064,00 |
110.436,00 |
60.285,00 |
|
|
20. Income taxes: 41900 |
33.641,00 |
-65.229,00 |
-36.932,00 |
-13.962,00 |
-9.707,00 |
|
|
A.4) PROFIT AFTER TAXES (A.3+20) : 49400 |
62.284,00 |
2.898,00 |
162.132,00 |
96.473,00 |
0,00 |
|
|
21. Result of the year coming from interrupted operations
: 42000 |
0,00 |
0,00 |
0,00 |
0,00 |
0,00 |
|
|
A.5) RESULT OF THE PERIOD (A.4+21) : 49500 |
62.284,00 |
2.898,00 |
162.132,00 |
96.473,00 |
50.578,00 |
|
>
Normal Balance Sheet under the rules of the 1990 General Accounting Plan (repealed
since 1st January of 2008)
Information
corresponding to the fiscal year
2013 2012 2011 2010 2009 has been compiled based on
the equivalence criteria stipulated in Act JUS/206/2009. Where the provisions
of the Act did not establish relevant equivalence criteria, created such
criteria using its own methodology. To view details on the methodology
2013 2012 2011 2010 2009 is taken from information
submitted to the TRADE REGISTER.
|
|
EQUIVALENCIA |
EQUIVALENCIA |
EQUIVALENCIA |
EQUIVALENCIA |
EQUIVALENCIA |
|
|
ASSETS |
2013 |
2012 |
2011 |
2010 |
2009 |
|
|
A) SHAREHOLDERS (PARTNERS) BY UNCALLED SUSCRIBED
CAPITAL: |
0,00 |
0,00 |
0,00 |
0,00 |
0,00 |
|
|
B) FIXED ASSETS: |
5.447.308,00 |
5.126.601,00 |
4.348.804,00 |
3.745.617,00 |
2.039.742,00 |
|
|
I. Formation expenses: |
0,00 |
0,00 |
0,00 |
0,00 |
0,00 |
|
|
II. Intangible fixed assets:
|
1.401.625,00 |
1.547.776,00 |
1.481.874,00 |
1.276.914,00 |
947.483,00 |
|
|
III. Tangible fixed assets: |
2.418.334,00 |
2.340.607,00 |
2.141.367,00 |
1.885.340,00 |
1.081.896,00 |
|
|
IV. Financial investments: |
1.627.349,00 |
1.238.218,00 |
725.563,00 |
583.363,00 |
10.363,00 |
|
|
V. Own shares: |
0,00 |
0,00 |
0,00 |
0,00 |
0,00 |
|
|
VI. Long-term trade receivables:
|
0,00 |
0,00 |
0,00 |
0,00 |
0,00 |
|
|
C) Deferred expenses: |
0,00 |
0,00 |
0,00 |
0,00 |
0,00 |
|
|
D) CURRENT ASSETS: |
3.281.563,00 |
3.343.658,00 |
4.017.592,00 |
3.484.061,00 |
2.536.280,00 |
|
|
I. Called-up share capital (not
paid): |
0,00 |
0,00 |
0,00 |
0,00 |
0,00 |
|
|
II. Stocks: |
1.702.634,00 |
1.400.501,00 |
1.435.631,00 |
697.718,00 |
398.034,00 |
|
|
III. Debtors: |
1.279.384,00 |
1.764.783,00 |
2.450.235,00 |
2.616.421,00 |
1.942.059,00 |
|
|
IV. Short-term investments: |
114.098,00 |
97.203,00 |
84.008,00 |
70.008,00 |
20.008,00 |
|
|
V. Short-term treasury shares:
|
0,00 |
0,00 |
0,00 |
0,00 |
0,00 |
|
|
VI. Cash at bank and in hand:
|
185.446,00 |
81.171,00 |
47.719,00 |
99.914,00 |
176.179,00 |
|
|
VII. Prepayments and accrued
income: |
0,00 |
0,00 |
0,00 |
0,00 |
0,00 |
|
|
GENERAL TOTAL (A + B + C + D): |
8.728.870,00 |
8.470.259,00 |
8.366.396,00 |
7.229.678,00 |
4.576.021,00 |
|
MERCANTILE
REGISTRY.
|
|
EQUIVALENCIA |
EQUIVALENCIA |
EQUIVALENCIA |
EQUIVALENCIA |
EQUIVALENCIA |
|
|
LIABILITIES |
2013 |
2012 |
2011 |
2010 |
2009 |
|
|
A) EQUITY: |
1.148.227,00 |
1.085.943,00 |
1.083.045,00 |
920.912,00 |
825.646,00 |
|
|
I. Subscribed capital: |
260.569,00 |
260.569,00 |
260.569,00 |
260.569,00 |
260.569,00 |
|
|
II. Share premium: |
210.355,00 |
210.355,00 |
210.355,00 |
210.355,00 |
210.355,00 |
|
|
III. Revaluation reserves: |
0,00 |
0,00 |
0,00 |
0,00 |
0,00 |
|
|
IV. Reserves: |
615.019,00 |
612.121,00 |
449.989,00 |
353.515,00 |
304.145,00 |
|
|
a)
Differences for capital adjustment to euros: |
0,00 |
0,00 |
0,00 |
0,00 |
0,00 |
|
|
b) Remaining
Reserves: |
615.019,00 |
612.121,00 |
449.989,00 |
353.515,00 |
304.145,00 |
|
|
V. Profit or loss brought forward:
|
0,00 |
0,00 |
0,00 |
0,00 |
0,00 |
|
|
VI. Profit or loss for the
financial year: |
62.284,00 |
2.898,00 |
162.132,00 |
96.473,00 |
50.578,00 |
|
|
VII. Interim dividend paid: |
0,00 |
0,00 |
0,00 |
0,00 |
0,00 |
|
|
VIII. Own shares for capital
reduction: |
0,00 |
0,00 |
0,00 |
0,00 |
0,00 |
|
|
B) Deferred income: |
322.900,00 |
259.268,00 |
411.425,00 |
319.763,00 |
679.925,00 |
|
|
C) PROVISIONS FOR LIABILITIES AND CHARGES: |
0,00 |
0,00 |
0,00 |
0,00 |
0,00 |
|
|
D) LONG TERM LIABILITIES: |
2.779.234,00 |
2.289.416,00 |
2.440.711,00 |
2.258.005,00 |
1.050.351,00 |
|
|
E) SHORT TERM CREDITORS: |
4.478.509,00 |
4.835.633,00 |
4.431.215,00 |
3.699.949,00 |
1.989.050,00 |
|
|
F) SHORT-TERM PROVISIONS FOR LIABILITIES AND CHARGES:
|
0,00 |
0,00 |
0,00 |
31.049,00 |
31.049,00 |
|
|
GENERAL TOTAL (A + B + C + D + E + F): |
8.728.870,00 |
8.470.259,00 |
8.366.396,00 |
7.229.678,00 |
4.576.021,00 |
|
MERCANTILE
REGISTRY.
|
|
EQUIVALENCIA |
EQUIVALENCIA |
EQUIVALENCIA |
EQUIVALENCIA |
EQUIVALENCIA |
|
|
DEBIT |
2013 |
2012 |
2011 |
2010 |
2009 |
|
|
A) CHARGES (A.1 to A.15): |
10.298.325,00 |
11.865.630,00 |
8.819.063,00 |
7.276.976,00 |
4.438.359,00 |
|
|
A.1.
Operating consumption: |
6.557.243,00 |
8.358.478,00 |
5.653.897,00 |
5.060.646,00 |
2.673.499,00 |
|
|
A.2. Staff
Costs: |
1.276.794,00 |
1.085.686,00 |
927.016,00 |
724.271,00 |
744.107,00 |
|
|
a) Wages, salaries et al.: |
1.016.212,00 |
869.385,00 |
744.415,00 |
592.831,00 |
609.067,00 |
|
|
b) Social security costs: |
260.582,00 |
216.301,00 |
182.601,00 |
131.440,00 |
135.040,00 |
|
|
A.3.
Depreciation expense: |
514.454,00 |
481.128,00 |
323.679,00 |
305.370,00 |
211.099,00 |
|
|
A.4. Variation
of trade provisions and losses of unrecovered receivables: |
0,00 |
0,00 |
0,00 |
0,00 |
0,00 |
|
|
A.5. Other
operating charges: |
1.702.767,00 |
1.563.136,00 |
1.450.316,00 |
1.037.111,00 |
653.026,00 |
|
|
A.I. OPERATING BENEFITS
(B.1-A.1-A.2-A.3-A.4-A.5): |
0,00 |
0,00 |
146.623,00 |
0,00 |
0,00 |
|
|
A.6.
Financial and similar charges: |
241.379,00 |
279.491,00 |
316.759,00 |
135.615,00 |
123.212,00 |
|
|
a) Due to liabilities with companies of the group: |
0,00 |
0,00 |
106.513,00 |
0,00 |
0,00 |
|
|
b) Due to liabilities with associated companies: |
0,00 |
0,00 |
0,00 |
0,00 |
0,00 |
|
|
c) Due to other debts: |
241.379,00 |
274.513,00 |
209.321,00 |
135.615,00 |
123.212,00 |
|
|
d) Losses from financial investments: |
0,00 |
4.977,00 |
926,00 |
0,00 |
0,00 |
|
|
A.7. Financial
investment provision change: |
12.867,00 |
0,00 |
0,00 |
0,00 |
0,00 |
|
|
A.8. Exchange
losses: |
26.462,00 |
32.483,00 |
0,00 |
0,00 |
15.818,00 |
|
|
A.II. POSITIVE FINANCIAL RESULTS
(B.2+B.3-A.6-A.7-A.8): |
0,00 |
0,00 |
0,00 |
0,00 |
0,00 |
|
|
A.III. PROFIT FROM ORDINARY
ACTIVITIES (A.I+A.II-B.I-B.II): |
0,00 |
0,00 |
0,00 |
0,00 |
0,00 |
|
|
A.9. Changes
in provisions for intangible, tangible and securities portfolio: |
0,00 |
0,00 |
0,00 |
0,00 |
0,00 |
|
|
A.10. Losses
from tangible and intangible fixed assets and portfolio: |
0,00 |
0,00 |
0,00 |
0,00 |
0,00 |
|
|
A.11. Losses
from transactions with own shares and debentures: |
0,00 |
0,00 |
0,00 |
0,00 |
0,00 |
|
|
A.12.
Extraordinary expenses: |
0,00 |
0,00 |
110.464,00 |
0,00 |
7.890,00 |
|
|
A.13. Prior
year expenses and losses: |
0,00 |
0,00 |
0,00 |
0,00 |
0,00 |
|
|
A.IV. EXTRAORDINARY PROFIT
(B.4+B.5+B.6+B.7+B.8-A.9-A.10-A.11-A.12-A.13): |
345.437,00 |
779.487,00 |
248.941,00 |
275.807,00 |
362.555,00 |
|
|
A.V. PROFIT BEFORE TAXES
(A.III+A.IV-B.III-B.IV): |
28.644,00 |
68.127,00 |
199.064,00 |
110.436,00 |
60.285,00 |
|
|
A.14.
Corporation Tax: |
-33.641,00 |
65.229,00 |
36.932,00 |
13.962,00 |
9.707,00 |
|
|
A.15.
Miscellaneous taxes: |
0,00 |
0,00 |
0,00 |
0,00 |
0,00 |
|
|
A.VI. FINANCIAL YEAR RESULT
(PROFIT) (A.V-A.14-A.15): |
62.284,00 |
2.898,00 |
162.132,00 |
96.473,00 |
50.578,00 |
|
MERCANTILE
REGISTRY.
|
|
EQUIVALENCIA |
EQUIVALENCIA |
EQUIVALENCIA |
EQUIVALENCIA |
EQUIVALENCIA |
|
|
CREDIT |
2013 |
2012 |
2011 |
2010 |
2009 |
|
|
B) INCOME ( B.1 to B.8): |
10.360.609,00 |
11.868.528,00 |
8.981.196,00 |
7.373.449,00 |
4.488.938,00 |
|
|
B.1.
Operating income: |
9.929.906,00 |
11.015.777,00 |
8.501.532,00 |
7.030.475,00 |
4.114.373,00 |
|
|
a) Net total sales: |
9.759.116,00 |
10.724.573,00 |
8.177.558,00 |
6.633.244,00 |
3.890.436,00 |
|
|
b) Miscellaneous operating income: |
170.790,00 |
291.204,00 |
323.974,00 |
397.231,00 |
223.938,00 |
|
|
B.I. PÉRDIDAS DE EXPLOTACIÓN
(A.1+A.2+A.3+A.4+A.5-B.1 ): |
121.351,00 |
472.651,00 |
0,00 |
96.923,00 |
167.358,00 |
|
|
B.2.
Financial income: |
85.266,00 |
73.264,00 |
61.764,00 |
48.068,00 |
4.119,00 |
|
|
a) Companies of the group: |
59.602,00 |
46.133,00 |
46.117,00 |
0,00 |
0,00 |
|
|
b) In associated companies: |
0,00 |
0,00 |
0,00 |
0,00 |
0,00 |
|
|
c) Miscellaneous: |
25.665,00 |
27.131,00 |
15.647,00 |
48.068,00 |
4.119,00 |
|
|
d) Profit on financial investment: |
0,00 |
0,00 |
0,00 |
0,00 |
0,00 |
|
|
B.3. Exchange
gains: |
0,00 |
0,00 |
58.495,00 |
19.100,00 |
0,00 |
|
|
B.II. NEGATIVE FINANCIAL RESULTS
(A.6+A.7+A.8-B.2-B.3): |
195.442,00 |
238.709,00 |
196.500,00 |
68.448,00 |
134.911,00 |
|
|
B.III. LOSSES ON ORDINARY
ACTIVITIES ( B.I + B.II - A.I - A.II ): |
316.793,00 |
711.360,00 |
49.877,00 |
165.371,00 |
302.269,00 |
|
|
B.4. Profit
on disposal of both tangible and intangible fixed assets and securities
portfolio: |
0,00 |
0,00 |
0,00 |
0,00 |
0,00 |
|
|
B.5. Profit on
transactions with own shares and debentures: |
0,00 |
0,00 |
0,00 |
0,00 |
0,00 |
|
|
B.6. Capital
grants transferred to profit and loss: |
120.475,00 |
234.566,00 |
359.405,00 |
273.364,00 |
370.445,00 |
|
|
B.7.
Extraordinary income: |
224.962,00 |
544.921,00 |
0,00 |
2.442,00 |
0,00 |
|
|
B.8. Income
and profit of former financial years: |
0,00 |
0,00 |
0,00 |
0,00 |
0,00 |
|
|
B.IV. NEGATIVE EXTRAORDINARY RESULTS
(A.9+A.10+A.11+A.12+A.13-B.4-B.5-B.6-B.7-B.8): |
0,00 |
0,00 |
0,00 |
0,00 |
0,00 |
|
|
B.V. LOSSES BEFORE TAXES
(B.III+B.IV-A.III-A.IV): |
0,00 |
0,00 |
0,00 |
0,00 |
0,00 |
|
|
B.VI. FINANCIAL YEAR RESULTS (LOSSES)
(B.V+A.14+A.15): |
0,00 |
0,00 |
0,00 |
0,00 |
0,00 |
|
MERCANTILE
REGISTRY.
CASHFLOW
STATEMENT
|
|
|
|
|
Model:
Normal
>
Source of information: Data contained in this section is taken from the information
declared in the Annual Accounts submitted to the Trade Register.
|
Net Rights Granted |
2013 |
2012 |
2011 |
2010 |
2009 |
|
|
1. Fiscal year result before taxes.: 61100 |
28.644,00 |
68.127,00 |
199.064,00 |
110.436,00 |
60.285,00 |
|
|
2. Results adjustments.: 61200 |
312.263,00 |
320.518,00 |
207.571,00 |
119.553,00 |
342.108,00 |
|
|
a) Fixed Assets Amortization (+).:
61201 |
514.454,00 |
481.128,00 |
323.679,00 |
305.370,00 |
211.099,00 |
|
|
b) Obsolescence Allowances (+/-).
: 61202 |
0,00 |
7.703,00 |
12.612,00 |
0,00 |
0,00 |
|
|
c) Variation in Provision (+/-). :
61203 |
0,00 |
0,00 |
-31.049,00 |
0,00 |
11.916,00 |
|
|
d) Allocation of grants (-).:
61204 |
-120.475,00 |
-234.566,00 |
-359.405,00 |
-273.364,00 |
0,00 |
|
|
e) Results on disposal of fixed
assets (+/-). : 61205 |
0,00 |
4.977,00 |
0,00 |
0,00 |
0,00 |
|
|
g) Financial income (-).:
61207 |
-85.266,00 |
-73.264,00 |
-61.764,00 |
-48.068,00 |
-4.119,00 |
|
|
h) Financial Expenses (+). :
61208 |
241.379,00 |
274.513,00 |
213.033,00 |
135.615,00 |
123.212,00 |
|
|
j) Reasonable Value Variation in
Financial Instruments (+/-).: 61210 |
-12.867,00 |
0,00 |
0,00 |
0,00 |
0,00 |
|
|
k) Other income and expense (-/+).
: 61211 |
-224.962,00 |
-139.974,00 |
110.464,00 |
0,00 |
0,00 |
|
|
3. Changes in current capital equity.: 61300 |
464.469,00 |
1.268.676,00 |
-1.172.250,00 |
-347.341,00 |
117.505,00 |
|
|
a) Stock (+/-).: 61301 |
-302.133,00 |
37.138,00 |
-739.921,00 |
-299.684,00 |
7.796,00 |
|
|
d) Debtors and other accounts
receivable (+/-). : 61302 |
523.088,00 |
685.452,00 |
166.187,00 |
-674.362,00 |
-309.819,00 |
|
|
c) Other current assets (+/-). :
61303 |
0,00 |
0,00 |
0,00 |
0,00 |
68.000,00 |
|
|
d) Creditors and other accounts
payable (+/-). : 61304 |
243.515,00 |
546.086,00 |
-598.516,00 |
626.706,00 |
351.527,00 |
|
|
4. Cash Flows from Other Operating Activities:
61400 |
-228.159,00 |
-206.088,00 |
-120.369,00 |
-53.706,00 |
-119.093,00 |
|
|
a) Interest payments (-). :
61401 |
-241.379,00 |
-274.513,00 |
-213.033,00 |
-135.615,00 |
-123.212,00 |
|
|
c) Interest collection (+). :
61403 |
85.266,00 |
73.264,00 |
61.764,00 |
48.068,00 |
4.119,00 |
|
|
d) Income tax payment collection
(payments) (+/-).: 61404 |
-55.081,00 |
-22.575,00 |
-2.162,00 |
-5.567,00 |
0,00 |
|
|
e) Other payments (payment
collection) (-/+) : 61405 |
-16.965,00 |
17.736,00 |
33.063,00 |
39.409,00 |
0,00 |
|
|
5. Cash Flows from Operating Activities (1 + 2 + 3 + 4)
: 61500 |
577.217,00 |
1.451.232,00 |
-885.985,00 |
-171.058,00 |
400.805,00 |
|
|
6. Payments for investment (-).: 62100 |
-543.481,00 |
-1.272.120,00 |
-940.867,00 |
-2.061.245,00 |
-340.152,00 |
|
|
a) Companies of the group and
affiliates. : 62101 |
0,00 |
-497.657,00 |
-142.200,00 |
-573.000,00 |
0,00 |
|
|
b) Intangible fixed assets. :
62102 |
-260.597,00 |
-447.617,00 |
-450.762,00 |
-594.261,00 |
-332.661,00 |
|
|
c) Fixed assets. : 62103 |
-185.432,00 |
-298.653,00 |
-333.904,00 |
-843.985,00 |
-7.491,00 |
|
|
e) Other financial assets. :
62105 |
-97.452,00 |
-28.193,00 |
-14.000,00 |
-50.000,00 |
0,00 |
|
|
7. Divestment payment collection (+). : 62200 |
1.300,00 |
0,00 |
0,00 |
0,00 |
0,00 |
|
|
a) Companies of the group and
affiliates. : 62201 |
1.300,00 |
0,00 |
0,00 |
0,00 |
0,00 |
|
|
8. Cash Flow from Investing Activities (6+7) less
Amortization: 62300 |
-542.181,00 |
-1.272.120,00 |
-940.867,00 |
-2.061.245,00 |
-551.252,00 |
|
|
9. Payment collection and payments for equity
instruments. : 63100 |
211.379,00 |
17.198,00 |
336.803,00 |
68.261,00 |
352.238,00 |
|
|
e) Grants, donations and bequests
received (+). : 63105 |
211.379,00 |
17.198,00 |
336.803,00 |
68.261,00 |
352.238,00 |
|
|
10. Payment collection and payments for financial
liabilities instruments.: 63200 |
-142.140,00 |
-229.762,00 |
1.542.243,00 |
2.087.777,00 |
-25.613,00 |
|
|
a) Issuance : 63201 |
-142.140,00 |
-229.762,00 |
1.542.243,00 |
2.087.777,00 |
119.370,00 |
|
|
2. Debts incurred with credit
institutions (+). : 63203 |
-142.140,00 |
-229.762,00 |
1.542.243,00 |
2.087.777,00 |
42.581,00 |
|
|
4. Special characteristic debts
(+). : 63205 |
0,00 |
0,00 |
0,00 |
0,00 |
1.179,00 |
|
|
5. Other debts (+). : 63206 |
0,00 |
0,00 |
0,00 |
0,00 |
75.610,00 |
|
|
b) Repayment and amortization of :
63207 |
0,00 |
0,00 |
0,00 |
0,00 |
-144.983,00 |
|
|
2. Debts incurred with credit
institutions (-).: 63209 |
0,00 |
0,00 |
0,00 |
0,00 |
-74.413,00 |
|
|
4. Special characteristic debts
(-). : 63211 |
0,00 |
0,00 |
0,00 |
0,00 |
-17.820,00 |
|
|
5. Other debts (-). : 63212 |
0,00 |
0,00 |
0,00 |
0,00 |
-52.750,00 |
|
|
11. Payments from dividends and remunerations from
other assets instruments. : 63300 |
0,00 |
0,00 |
0,00 |
0,00 |
0,00 |
|
|
12. Cash Flows from Financing Activities (9+10+11):
63400 |
69.239,00 |
-212.564,00 |
1.879.046,00 |
2.156.038,00 |
326.625,00 |
|
|
D) EFFECT OF EXCHANGE RATE CHANGES: 64000 |
0,00 |
0,00 |
0,00 |
0,00 |
0,00 |
|
|
E) NET INCREASE/DECREASE OF CASH OR EQUIVALENT ASSETS
(+/-5+/-8+/12+/-D) : 65000 |
104.275,00 |
-33.452,00 |
52.195,00 |
-76.265,00 |
176.179,00 |
|
|
Cash or equivalent assets as of
beginning of the fiscal year.: 65100 |
81.171,00 |
47.719,00 |
47.719,00 |
176.179,00 |
0,00 |
|
|
Cash or equivalent assets as of end
of the fiscal year.: 65200 |
185.446,00 |
81.171,00 |
99.914,00 |
99.914,00 |
176.179,00 |
|
FINANCIAL
DIAGNOSIS
|
>
Economic-Financial Comparative Analysis
Data
used in the following ratios and indicators is taken from the Annual Accounts submitted
by the company to the TRADE REGISTER.
>
Comparison within the Sector
|
Cash Flow |
2013 |
2012 |
Variación 2013 - 2012 |
|
|||
|
|
Empresa |
Sector |
Empresa |
Sector |
Empresa |
Sector |
|
|
Cash Flow over Sales: |
0,01 % |
0,01 % |
0,00 % |
0,01 % |
|
89,11 % |
|
|
Net Financial Debt: |
12,37 |
17,67 |
604,64 |
84,30 |
-97,95 |
-79,04 |
|
|
Cash Flow Yield: |
0,01 % |
0,01 % |
0,00 % |
0,00 % |
|
|
|
|
EBITDA over Sales: |
4,03 % |
1,96 % |
0,08 % |
0,45 % |
4.996,03 % |
333,24 % |
|
|
Profitability |
2013 |
2012 |
Variación 2013 - 2012 |
|
|||
|
|
Empresa |
Sector |
Empresa |
Sector |
Empresa |
Sector |
|
|
Operating economic profitability: |
-0,01 % |
-2,22 % |
-3,34 % |
-3,97 % |
99,62 % |
44,15 % |
|
|
Total economic profitability: |
3,09 % |
-0,80 % |
4,05 % |
-1,88 % |
-23,53 % |
57,46 % |
|
|
Financial profitability: |
5,42 % |
-7,57 % |
0,27 % |
-11,29 % |
1.932,62 % |
32,97 % |
|
|
Margin: |
-0,01 % |
-2,19 % |
-2,16 % |
-3,71 % |
99,59 % |
40,93 % |
|
|
Mark-up: |
-1,98 % |
-4,72 % |
-4,33 % |
-7,12 % |
54,32 % |
33,62 % |
|
|
Solvency |
2013 |
2012 |
Variación 2013 - 2012 |
|
|||
|
|
Empresa |
Sector |
Empresa |
Sector |
Empresa |
Sector |
|
|
Liquidity: |
0,04 |
0,13 |
0,02 |
0,12 |
146,68 |
14,83 |
|
|
Acid Test: |
0,34 |
0,86 |
0,40 |
0,84 |
-14,36 |
2,42 |
|
|
Working Capital / Investment: |
-0,14 |
0,05 |
-0,18 |
0,02 |
19,70 |
102,13 |
|
|
Solvency: |
0,73 |
1,17 |
0,69 |
1,16 |
5,97 |
0,89 |
|
|
Indebtedness |
2013 |
2012 |
Variación 2013 - 2012 |
|
|||
|
|
Empresa |
Sector |
Empresa |
Sector |
Empresa |
Sector |
|
|
Indebtedness level: |
4,93 |
1,40 |
5,30 |
1,63 |
-6,86 |
-13,90 |
|
|
Borrowing Composition: |
0,62 |
1,02 |
0,47 |
1,01 |
31,08 |
0,36 |
|
|
Repayment Ability: |
18,46 |
64,28 |
840,51 |
285,32 |
-97,80 |
-77,47 |
|
|
Warranty: |
1,20 |
1,72 |
1,19 |
1,62 |
1,17 |
6,19 |
|
|
Generated resources / Total creditors: |
0,08 |
0,00 |
0,07 |
0,00 |
15,78 |
|
|
|
Efficiency |
2013 |
2012 |
Variación 2013 - 2012 |
|
|||
|
|
Empresa |
Sector |
Empresa |
Sector |
Empresa |
Sector |
|
|
Productivity: |
1,31 |
1,09 |
1,01 |
1,02 |
29,78 |
6,47 |
|
|
Turnover of Collection Rights : |
8,00 |
4,99 |
6,24 |
4,76 |
28,12 |
4,84 |
|
|
Turnover of Payment Entitlements: |
4,35 |
3,51 |
5,35 |
3,38 |
-18,59 |
3,57 |
|
|
Stock rotation: |
5,90 |
7,98 |
8,20 |
7,04 |
-28,03 |
13,37 |
|
|
Assets turnover: |
1,42 |
1,01 |
1,54 |
1,07 |
-7,96 |
-5,44 |
|
|
Borrowing Cost: |
3,33 |
2,83 |
3,85 |
2,93 |
-13,68 |
-3,26 |
|
>
Trend of indicators under the General Accounting Plan of 2007 (2013, 2012,
2011, 2010, 2009)
|
Cash Flow |
2013 |
2012 |
2011 |
2010 |
2009 |
|
|
Cash Flow over Sales: |
0,01 % |
0,00 % |
-0,01 % |
-0,01 % |
0,05 % |
|
|
Net Financial Debt: |
12,37 |
604,64 |
12,30 |
18,33 |
39,04 |
|
|
Cash Flow Yield: |
0,01 % |
0,00 % |
-0,01 % |
-0,01 % |
0,04 % |
|
|
EBITDA over Sales: |
4,03 % |
0,08 % |
5,37 % |
3,14 % |
1,12 % |
|
|
Profitability |
2013 |
2012 |
2011 |
2010 |
2009 |
|
|
Operating economic profitability: |
-0,01 % |
-3,34 % |
6,70 % |
2,72 % |
4,47 % |
|
|
Total economic profitability: |
3,09 % |
4,05 % |
6,15 % |
3,40 % |
4,01 % |
|
|
Financial profitability: |
5,42 % |
0,27 % |
14,97 % |
10,48 % |
6,13 % |
|
|
Margin: |
-0,01 % |
-2,16 % |
5,97 % |
2,54 % |
4,94 % |
|
|
Mark-up: |
-1,98 % |
-4,33 % |
3,65 % |
1,57 % |
1,66 % |
|
|
Solvency |
2013 |
2012 |
2011 |
2010 |
2009 |
|
|
Liquidity: |
0,04 |
0,02 |
0,01 |
0,03 |
0,09 |
|
|
Acid Test: |
0,34 |
0,40 |
0,58 |
0,75 |
1,08 |
|
|
Working Capital / Investment: |
-0,14 |
-0,18 |
-0,05 |
-0,03 |
0,11 |
|
|
Solvency: |
0,73 |
0,69 |
0,91 |
0,94 |
1,28 |
|
|
Indebtedness |
2013 |
2012 |
2011 |
2010 |
2009 |
|
|
Indebtedness level: |
4,93 |
5,30 |
4,60 |
4,80 |
2,02 |
|
|
Borrowing Composition: |
0,62 |
0,47 |
0,55 |
0,61 |
0,53 |
|
|
Repayment Ability: |
18,46 |
840,51 |
15,64 |
28,58 |
69,49 |
|
|
Warranty: |
1,20 |
1,19 |
1,22 |
1,21 |
1,51 |
|
|
Generated resources / Total creditors: |
0,08 |
0,07 |
0,07 |
0,07 |
0,09 |
|
|
Efficiency |
2013 |
2012 |
2011 |
2010 |
2009 |
|
|
Productivity: |
1,31 |
1,01 |
1,47 |
1,29 |
1,06 |
|
|
Turnover of Collection Rights : |
8,00 |
6,24 |
3,46 |
2,69 |
2,12 |
|
|
Turnover of Payment Entitlements: |
4,35 |
5,35 |
7,06 |
3,44 |
2,67 |
|
|
Stock rotation: |
5,90 |
8,20 |
5,82 |
10,22 |
10,76 |
|
|
Assets turnover: |
1,42 |
1,54 |
1,12 |
1,07 |
0,91 |
|
|
Borrowing Cost: |
3,33 |
3,85 |
4,60 |
2,28 |
4,05 |
|
|
|
|
|
|
|
Sector-based
Comparison under the rules of the New General Accounting Plan.
|
Net Rights Granted |
Variación - |
|
|
|
Empresa |
Sector |
|
Net Rights Granted |
Variación - |
|
|
|
Empresa |
Sector |
|
Net Rights Granted |
Variación - |
|
|
|
Empresa |
Sector |
|
|
Public
Tenders and Works Won
|
No
Public Tenders assigned to the name of the company.
Detail
of Subsidies appearing in Balances Memories
|
|
Entity |
CENTRO PARA EL DESARROLLO TECNOLOGICO INDUSTRIAL |
|
Status |
CONCEDIDA |
|
Amount Granted |
85.907,52 |
|
Notes |
El importe reflejado es el traspasado a resultados. |
|
Entity |
COMUNIDAD DE MADRID |
|
Status |
CONCEDIDA |
|
Amount Granted |
54.567,64 |
|
Notes |
El importe reflejado es el traspasado a resultados. |
|
Entity |
CENTRO PARA EL DESARROLLO TECNOLOGICO INDUSTRIAL |
|
Status |
CONCEDIDA |
|
Amount Granted |
162.760,31 |
|
Notes |
El importe reflejado es el traspasado a resultados. |
|
Entity |
COMUNIDAD DE MADRID |
|
Status |
CONCEDIDA |
|
Amount Granted |
88.823,40 |
|
Notes |
El importe reflejado es el traspasado a resultados. |
|
Entity |
CENTRO PARA EL DESARROLLO TECNOLOGICO INDUSTRIAL |
|
Status |
CONCEDIDA |
|
Amount Granted |
139.647,82 |
|
Notes |
El importe reflejado es el traspasado a resultados. |
Research
Summary
|
|
The subject, BTSA BIOTECNOLOGIAS APLICADAS SL NIF B-80.816.531,
was incorporated by an indefinite time in Madrid in 1994, and is engaged in
the manufacture and amrketing of organic chemicals. Its overall structure and
commercial development seem to be unfavourable, according to the consulted
sources. The last Accounts filed at the Trade Registry are those for the 2013
fiscal year. We recommend being cautious and doing a follow up. |
Sources
|
|
Registry of Commerce''s Official Gazette. Own and
external data bases Company References Investigación |
FOREIGN EXCHANGE RATES
|
Currency |
Unit
|
Indian Rupees |
|
US Dollar |
1 |
INR 64.37 |
|
|
1 |
INR 89.71 |
|
Euro |
1 |
INR 78.89 |
|
EURO |
1 |
INR 78.64 |
Note :
Above are approximate rates obtained from sources believed to be correct
INFORMATION DETAILS
|
Analysis Done by
: |
VAR |
|
|
|
|
Report Prepared
by : |
DNS |
RATING EXPLANATIONS
|
Credit Rating |
Explanation |
Rating Comments |
|
A++ |
Minimum Risk |
Business dealings permissible with minimum
risk of default |
|
A+ |
Low Risk |
Business dealings permissible with low
risk of default |
|
A |
Acceptable Risk |
Business dealings permissible with
moderate risk of default |
|
B |
Medium Risk |
Business dealings permissible on a regular
monitoring basis |
|
C |
Medium High Risk |
Business dealings permissible preferably
on secured basis |
|
D |
High Risk |
Business dealing not recommended or on
secured terms only |
|
NB |
New Business |
No recommendation can be done due to
business in infancy stage |
|
NT |
No Trace |
No recommendation can be done as the
business is not traceable |
NB is stated where there is insufficient information to facilitate rating. However, it is not to be considered as unfavourable.
This score serves as a reference to assess
SC’s credit risk and to set the amount of credit to be extended. It is
calculated from a composite of weighted scores obtained from each of the major
sections of this report. The assessed factors are as follows:
·
Financial
condition covering various ratios
·
Company
background and operations size
·
Promoters
/ Management background
·
Payment
record
·
Litigation
against the subject
·
Industry
scenario / competitor analysis
·
Supplier
/ Customer / Banker review (wherever available)
This report is issued at
your request without any risk and responsibility on the part of MIRA INFORM
PRIVATE LIMITED (MIPL) or its officials.