|
|
|


MIRA INFORM REPORT
|
Report No. : |
490243 |
|
Report Date : |
12.02.2018 |
IDENTIFICATION DETAILS
|
Name : |
PINTER CAIPO SAU |
|
|
|
|
Registered Office : |
Ctra. Manresa, Km 4,6 - Santpedor - 08251 - Barcelona |
|
|
|
|
Country : |
Spain |
|
|
|
|
Financials (as on) : |
2016 |
|
|
|
|
Date of Incorporation : |
16.08.1974 |
|
|
|
|
Legal Form : |
Public Company |
|
|
|
|
Line of Business : |
Subject is engaged in the manufacture and sale of textile machinery. |
|
|
|
|
No. of Employees : |
25 |
RATING & COMMENTS
(Mira Inform has adopted New Rating mechanism w.e.f. 23rd
January 2017)
|
MIRA’s Rating : |
A+ |
|
Credit Rating |
Explanation |
Rating Comments |
|
A+ |
Low Risk |
Business dealings permissible with low risk
of default |
|
Status : |
Good |
|
|
|
|
Payment Behaviour : |
Slow |
|
|
|
|
Litigation : |
Clear |
NOTES :
Any query related to this report can be made
on e-mail : infodept@mirainform.com
while quoting report number, name and date.
ECGC Country Risk Classification List
|
Country Name |
Previous Rating (30.06.2017) |
Current Rating (30.09.2017) |
|
Spain |
A1 |
A1 |
|
Risk Category |
ECGC
Classification |
|
Insignificant |
A1 |
|
Low Risk |
A2 |
|
Moderately Low Risk |
B1 |
|
Moderate Risk |
B2 |
|
Moderately High Risk |
C1 |
|
High Risk |
C2 |
|
Very High Risk |
D |
SPAIN - ECONOMIC OVERVIEW
After experiencing a prolonged recession in the wake of the global financial crisis that began in 2008, in 2017 Spain marked the fourth full year of positive economic growth in ten years, largely due to increased private consumption. At the onset of the financial crisis, Spain's GDP contracted by 3.7% in 2009, ending a 16-year growth trend, and continued contracting through most of 2013. In that year, the government successfully shored up struggling banks - exposed to the collapse of Spain's depressed real estate and construction sectors - and in January 2014 completed an EU-funded restructuring and recapitalization program for its financial sector.
Until 2014, credit contraction in the private sector, fiscal austerity, and high unemployment weighed on domestic consumption and investment. The unemployment rate rose from a low of about 8% in 2007 to more than 26% in 2013, but labor reforms prompted a modest reduction to 17% in 2017. High unemployment has strained Spain's public finances, as spending on social benefits increased while tax revenues fell. Spain’s budget deficit peaked at 11.4% of GDP in 2010, but Spain gradually reduced the deficit to about 3.3% of GDP in 2017. Public debt has increased substantially – from 60.1% of GDP in 2010 to nearly 96.7% in 2017.
Exports were resilient throughout the economic downturn and helped to bring Spain's current account into surplus in 2013 for the first time since 1986, where it remained through 2016. Rising labor productivity and an internal devaluation resulting from moderating labor costs and lower inflation have helped to improve foreign investor interest in the economy and positive FDI flows have been restored.
Political gridlock after the national elections in December 2015 and June 2016 and ensuing government formation process constrained the caretaker government’s ability to implement needed labor, pension, health care, tax, and education reforms— in 2016. The European Commission criticized Spain’s 2016 budget for easing austerity measures and for its alleged overly optimistic growth and deficit projections. Spain’s borrowing costs are dramatically lower since their peak in mid-2012, and with the recent uptick in economic activity, inflation has reappeared, at 2% per year.
|
Source
: CIA |
EXECUTIVE
SUMMARY
|
|
|
|
|
|
Name: |
PINTER CAIPO SAU |
|
NIF / Fiscal code: |
A08354565 |
|
Trade Name |
PINTERSA |
|
Status: |
ACTIVE |
|
Incorporation Date: |
16/08/1974 |
|
Register Data |
Register Section 8 Sheet 45218 |
|
Last Publication in BORME: |
29/01/2016 [Appointments] |
|
Last Published Account Deposit: |
2016 |
|
Share Capital: |
150.099,75 |
|
|
|
|
Localization: |
CTRA. MANRESA, KM 4,6 - SANTPEDOR - 08251
- BARCELONA |
|
Telephone - Fax - Email - Website: |
Telephone. 938 272 727 Email.
pinter@pintersa.com Website. www.pintercaipo.com |
|
|
|
|
Activity: |
|
|
NACE: |
2894 - Manufacture of machinery for
textile, apparel and leather production |
|
Registered Trademarks: |
|
|
Audited / Opinion: |
Si / |
|
Tenders and Awards: |
|
|
Subsidies: |
9 for a total cost of 68980.97 |
|
Main products / services: |
Core yarnSlubs y efectos de colorMáquinas
y equipos de laboratorio |
|
Quality Certificate: |
No |
|
|
|
|
Payment Behaviour: |
Slow |
|
Prospects: |
Consolidation |
|
Industry situation: |
Maturity |
|
|
|
|
Defaults, Legal Claims and Insolvency
Proceedings : |
|
|
|
|
|
|
|
Number |
Amount (€) |
Most Recent Entry |
|
Insolvency Proceedings, Bankruptcy and
Suspension of Payments |
|
Unpublished |
--- |
--- |
|
Defaults on debt with Financial
Institutions and Large Companies |
|
None |
--- |
--- |
|
Judicial Claims (Notices, Executive
Proceedings, Attachments, Auctions, Bad Debt) |
|
None |
0 |
--- |
|
Proceedings heard by the Civil Court |
|
Unpublished |
0 |
--- |
|
Proceedings heard by the Labour Court |
|
Unpublished |
0 |
--- |
|
|
|
Partners: |
|
|
|
PINTER CAIPO TECHNOLOGIES SL |
100 % |
|
|
Shares: |
2 |
|
|
Other Links: |
3 |
|
|
No. of Active Corporate Bodies: |
SINGLE ADMINISTRATOR 1 |
|
|
Ratios |
2016 |
2015 |
Change |
|
|
|
|
|
Guarantees: |
|
|
Properties Registered: |
Company NO, Administrator NO |
|
Financing / Guarantee Sources : |
Sources YES, Guarantees YES |
|
|
|
|
|
|
|
INVESTIGATION SUMMARY |
|
|
The subject was incorporated in 1974 and
is engaged in the manufacture and sale of textile machinery. It operates at
the national and international level. There are no negative comments made
upon the subject, according to the consulted sources of reference. Having the
above-mentioned into account, credit operations can be envisioned under
normal terms. |
|
|
Interviewed Person: |
|
Enquiry
Details
|
|
|
|
|
Social Denomination: |
PINTER CAIPO SAU |
|
Trade Name: |
PINTERSA |
|
NIF / Fiscal code: |
A08354565 |
|
Corporate Status: |
ACTIVE |
|
Start of activity: |
1975 |
|
Registered Office: |
CTRA. MANRESA, KM 4,6 |
|
Locality: |
SANTPEDOR |
|
Province: |
BARCELONA |
|
Postal Code: |
08251 |
|
Telephone: |
938 272 727 |
|
Fax: |
938 272 055 |
|
Website: |
www.pintercaipo.com |
|
Email: |
pinter@pintersa.com |
|
Interviewed Person: |
Miss Ángeles |
Branch
Offices
-- |
|
|
|
|
Activity
|
|
|
NACE: |
2894 |
|
CNAE Obtaining Source: |
2894 |
|
Corporate Purpose: |
Manufacture and sale of textile machinery. |
|
Additional Information: |
Manufacture and sale of textile machinery. |
|
Additional Address: |
The Registered Office, offices, and
premises are located at the heading address. |
|
Franchise: |
No |
|
Import / export: |
EXPORTS |
|
Future Perspective: |
Consolidation |
|
Industry situation: |
Maturity |
Main
products / services
|
|
|
|
|
|
Product |
% Over Sales |
|
Core yarn |
|
|
Slubs y efectos de color |
|
|
Máquinas y equipos de laboratorio |
|
|
Sistemas de monitoreo |
|
Number
of Employees
|
|
|
|
|
|
|
Year |
No. of employees |
Established |
Incidentals |
|
|
|
2018 |
25 |
|
|
|
The
data of employees is from the latest available financial statements in. Failing
that, are estimates data calculated by statistical methods
Chronological
Summary
|
|||
|
|
|
|
|
|
|
Year |
Act |
|
|
|
1990 |
Accounts deposit (year 1989) |
|
|
|
1991 |
Accounts deposit (year 1990) |
|
|
|
1992 |
Accounts deposit (year 1991) Adaptation to Law (1) Appointments/
Re-elections (1) Cessations/ Resignations/ Reversals (1) Increase of Capital
(1) Statutory Modifications (1) |
|
|
|
1993 |
Accounts deposit (year 1992) |
|
|
|
1994 |
Accounts deposit (year 1993) |
|
|
|
1995 |
Accounts deposit (year 1994) |
|
|
|
1996 |
Accounts deposit (year 1995) |
|
|
|
1997 |
Accounts deposit (year 1996) Appointments/ Re-elections
(1) |
|
|
|
1998 |
Accounts deposit (year 1997) Appointments/ Re-elections
(1) Dividends Payment (1) |
|
|
|
1999 |
Accounts deposit (year 1998) Increase of Capital (1) |
|
|
|
2000 |
Accounts deposit (year 1999) |
|
|
|
2001 |
Accounts deposit (year 2000) |
|
|
|
2002 |
Accounts deposit (year 2001) Appointments/ Re-elections
(2) Statutory Modifications (1) |
|
|
|
2003 |
Accounts deposit (year 2002) |
|
|
|
2004 |
Accounts deposit (year 2003) Appointments/ Re-elections
(1) Cessations/ Resignations/ Reversals (1) Statutory Modifications (1) |
|
|
|
2005 |
Accounts deposit (year 2004) Appointments/ Re-elections
(2) Cessations/ Resignations/ Reversals (2) Statutory Modifications (1) |
|
|
|
2006 |
Appointments/ Re-elections (2) Cessations/
Resignations/ Reversals (2) Statutory Modifications (1) |
|
|
|
2007 |
Accounts deposit (year 2005, 2006) Appointments/
Re-elections (2) Capital Reduction (3) Cessations/ Resignations/ Reversals (1)
Declaration of Sole Propietorship (1) Other Concepts/ Events (1) |
|
|
|
2008 |
Accounts deposit (year 2007) Appointments/ Re-elections
(4) Cessations/ Resignations/ Reversals (1) |
|
|
|
2009 |
Accounts deposit (year 2008) Appointments/ Re-elections
(1) Cessations/ Resignations/ Reversals (1) Loss of the sole propietorship
condition (1) Other Concepts/ Events (1) |
|
|
|
2010 |
Accounts deposit (year 2009) |
|
|
|
2011 |
Accounts deposit (year 2010) |
|
|
|
2012 |
Accounts deposit (year 2011) Appointments/ Re-elections
(1) |
|
|
|
2013 |
Accounts deposit (year 2012) Change of Social
Denomination (1) Declaration of Sole Propietorship (1) Other Concepts/ Events
(1) Statutory Modifications (1) |
|
|
|
2014 |
Accounts deposit (year 2013) Appointments/ Re-elections
(1) |
|
|
|
2015 |
Accounts deposit (year 2014) Appointments/ Re-elections
(1) |
|
|
|
2016 |
Accounts deposit (year 2015) Appointments/ Re-elections
(1) Cessations/ Resignations/ Reversals (1) |
|
|
|
2017 |
Accounts deposit (year 2016) |
|
Breakdown
of Owners' Equity
|
|
|
Registered Capital: |
150.099,75 |
|
Paid up capital: |
150.099,75 |
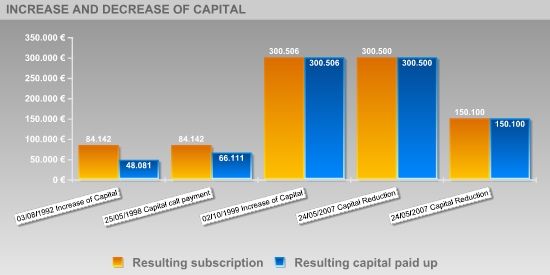
Updated
Evolution of the Subscribed and Paid-in Capital
|
|||||
|
|
|
|
|
|
|
|
|
|||||
|
|
|
|
|
|
|
|
Publishing Date |
Registration Type |
Capital Subscribed |
Paid up capital |
Underwritten result |
Disbursed Result |
|
03/08/1992 |
Increase of Capital |
24.040 |
6.010 |
84.142 |
48.081 |
|
25/05/1998 |
Capital call payment |
--- |
18.030 |
84.142 |
66.111 |
|
02/10/1999 |
Increase of Capital |
240.405 |
240.405 |
300.506 |
300.506 |
|
24/05/2007 |
Capital Reduction |
-6 |
-6 |
300.500 |
300.500 |
|
24/05/2007 |
Capital Reduction |
-150.400 |
-150.400 |
150.100 |
150.100 |
Active
Social Bodies
|
|
|
|
|
|
Post published |
Social Body's Name |
Appointment Date |
Other Positions in this Company |
|
SINGLE PARTNER |
PINTER CAIPO TECHNOLOGIES SL |
09/04/2013 |
2 |
|
SINGLE ADMINISTRATOR |
PINTER CAIPO TECHNOLOGIES SL |
22/01/2016 |
2 |
|
PROXY |
SERRA TELLA ADRIA |
20/05/2008 |
3 |
|
|
VALL OMS PERE |
20/05/2008 |
2 |
|
REPRESENTATIVE |
SERRA TELLA ADRIAN |
22/01/2016 |
2 |
|
|
PAYAS PUIGARNAU BLANCA |
26/10/2005 |
3 |
|
ACCOUNTS' AUDITOR / HOLDER |
JOSEP PUIGDELLIVOL PRAT |
14/01/2015 |
2 |
|
DEPUTY ACCOUNTS' AUDITOR |
JOSEP TRULLAS FLOTATS |
14/01/2015 |
2 |
Historical
Social Bodies
|
|
|
|
|
|
Social Body's Name |
Post published |
End Date |
Other Positions in this Company |
|
ALFONSO OLIVERO JOAN MARIA |
MEMBER OF THE BOARD |
13/10/2006 |
1 |
|
AUDIGRUP AUDITORS ASSOCIATS D'ARRAU CUYAS CALVET I |
ACCOUNTS' AUDITOR / HOLDER |
24/01/2007 |
1 |
|
GALL FERNANDEZ XAVIER |
PROXY |
04/11/2005 |
3 |
|
|
PROXY |
19/10/2006 |
|
|
|
PROXY |
08/05/2008 |
|
|
JOSEP PUIGDELLIVOL PRAT |
ACCOUNTS' AUDITOR / HOLDER |
14/01/2015 |
2 |
|
JOSEP TRULLAS FLOTATS |
DEPUTY ACCOUNTS' AUDITOR |
14/01/2015 |
2 |
|
MONSERRAT ALBERTI JOSEP MARIA |
MEMBER OF THE BOARD |
13/10/2006 |
2 |
|
|
PRESIDENT |
13/10/2006 |
|
|
MUR TORNE IGNACIO |
MEMBER OF THE BOARD |
13/10/2006 |
1 |
|
PAYAS PUIGARNAU BLANCA |
REPRESENTATIVE |
26/10/2005 |
3 |
|
|
REPRESENTATIVE |
13/10/2006 |
|
|
PAYAS PUIGARNAU SL |
SECRETARY |
13/10/2006 |
3 |
|
|
MEMBER OF THE BOARD |
13/10/2006 |
|
|
|
MEMBER OF THE BOARD |
26/10/2005 |
|
|
PUIGARNAU UBACH SL |
PRESIDENT |
26/10/2005 |
3 |
|
|
MEMBER OF THE BOARD |
13/10/2006 |
|
|
|
MEMBER OF THE BOARD |
26/10/2005 |
|
|
PUIGDELLIVOL PRAT JOSEP |
ACCOUNTS' AUDITOR / HOLDER |
21/12/2007 |
1 |
|
RODO PUIGORIOL ENRIC |
REPRESENTATIVE |
26/10/2005 |
3 |
|
|
REPRESENTATIVE |
13/10/2006 |
|
|
|
REPRESENTATIVE |
23/03/2009 |
|
|
RODO PUIGORIOL ENRIQUE |
ADMINISTRATOR |
03/08/1992 |
4 |
|
|
ADMINISTRATOR |
10/09/1997 |
|
|
|
ADMINISTRATOR |
30/04/2002 |
|
|
|
ADMINISTRATOR |
19/04/2004 |
|
|
RODO VIDAL ENRIC |
PROXY |
08/05/2008 |
2 |
|
|
MEMBER OF THE BOARD |
13/10/2006 |
|
|
RODO VIDAL HOLDING SL |
SINGLE PARTNER |
23/03/2009 |
7 |
|
|
SECRETARY |
26/10/2005 |
|
|
|
CHIEF EXECUTIVE OFFICER |
13/10/2006 |
|
|
|
CHIEF EXECUTIVE OFFICER |
26/10/2005 |
|
|
|
MEMBER OF THE BOARD |
13/10/2006 |
|
|
|
MEMBER OF THE BOARD |
26/10/2005 |
|
|
|
SINGLE ADMINISTRATOR |
23/03/2009 |
|
|
SERRA TELLA ADRIA |
SINGLE ADMINISTRATOR |
12/03/2014 |
3 |
|
|
PROXY |
20/05/2008 |
|
|
SERRA TELLA ADRIAN |
SINGLE ADMINISTRATOR |
22/01/2016 |
2 |
|
SERRAT CALLIS ANTONI |
PROXY |
19/10/2006 |
1 |
|
TORT SEGURA IGNASI |
DEPUTY ACCOUNTS' AUDITOR |
21/12/2007 |
1 |
|
TRULLAS FLOTATS JOSEP |
DEPUTY ACCOUNTS' AUDITOR |
11/01/2012 |
1 |
|
VALL OMS PERE |
PROXY |
20/05/2008 |
2 |
Executive
board
|
||
|
|
|
|
|
Post |
NIF |
Name |
|
FINANCIAL DIRECTOR |
|
PEDRO VALL |
|
MANAGING DIRECTOR |
|
ADRIAN SERRA |
Defaults,
Legal Claims and Insolvency Proceedings
|
|
|
|
|
Section enabling assessment of the degree of
compliance of the company queried with its payment obligations. It provides information
on the existence and nature of all stages of Insolvency and Legal Proceedings
published with reference to the Company in the country's various Official
Bulletins and national newspapers, as well Defaults Registered in the main
national credit bureaus (ASNEF Industrial and RAI ).
> Summary
Chronological summary
|
|
|
Number of Publications |
Amount (€) |
Start date |
End date |
|
Insolvency Proceedings, Bankruptcy and
Suspension of Payments |
|
Unpublished |
--- |
--- |
--- |
|
Request/Declaration |
|
0 |
--- |
date |
|
|
Proceedings |
|
--- |
--- |
|
--- |
|
Resolution |
|
--- |
--- |
|
--- |
|
Defaults on debt with Financial
Institutions and Large Companies |
Bank and Commercial Delinquency |
None |
0 |
|
|
|
Status: Friendly |
|
--- |
|
|
|
|
Status: Pre-Litigation |
|
--- |
|
|
|
|
Status: Litigation |
|
--- |
|
|
|
|
Status: Non-performing |
|
--- |
|
|
|
|
Status: insolvency proceedings, bankruptcy
and suspension of payments |
|
--- |
|
|
|
|
Other status |
|
--- |
|
|
|
|
Legal and Administrative Proceedings |
|
Unpublished |
--- |
|
|
|
Notices of defaults and enforcement |
|
--- |
--- |
|
--- |
|
Seizures |
|
--- |
--- |
|
--- |
|
Auctions |
|
--- |
--- |
|
--- |
|
Declarations of insolvency and bad debt |
|
--- |
--- |
|
--- |
|
Proceedings heard by the Civil Court |
|
Unpublished |
--- |
|
|
|
Proceedings heard by the Labour Court |
|
Unpublished |
--- |
|
|
> Basis for scoring
|
Positive Factors |
Adverse Factors |
|
No judicial claims have been detected in
the Official Gazettes, regarding any Entity's outstanding debts with the Tax
Bureau or Social Security administrations, as submitted by Courts of the various
court jurisdictions. No irregular payment performance has been
detected based on information obtained from credit bureaus. Significant level of financial autonomy.
The asset is financed mostly with equity and financing with maturity
exceeding one year, providing a solid financial structure. PINTER CAIPO SA obtains economic
profitability from the necessary investments in the development of its
activity in comparison with its assets. High financial profitability. Net return
from the company's main activity performed using its own equity is high. This
income return has decreased in comparison with the previous financial year. |
|
TREND
OF SCORING
|
|
|
|
|
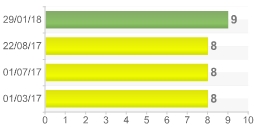
> Latest Scoring Changes :
|
Scoring |
Evolution |
Date |
Event |
|
|
Positive |
29/01/18 |
Updating of information related to
subsidies or other public aid. |
|
Neutral |
22/08/17 |
Updating of financial statements. |
|
|
Neutral |
01/07/17 |
Revision of the scoring due to
modifications in activity consideration |
|
|
Negative |
01/03/17 |
Revision of the scoring due to
modifications in activity consideration |
Grants or Publics aids Update for the
company.
Probability of default
|
|
|
|
|
> Estimated Probability of Default for
the next 12 months: 0.212 %
|
Sector in which comparison is carried out: 289 Manufacture of other
special-purpose machinery |
|
|
Relative Position:
|
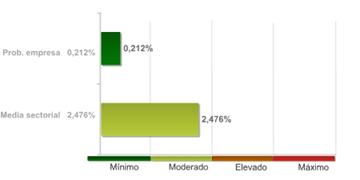
The company's comparative analysis with the
rest of the companies that comprise the sector, shows the company holds a
better position with regard to the probability of non-compliance.
The 99.00% of the companies of the sector
PINTER CAIPO SA belongs to show a higher probability of non-compliance.
The probability of the company's
non-compliance with its payment obligations within deadlines estimated by our
qualifications models is 0,212%.
In the event they fail to comply with the
payment, the seriousness of the loss will depend on factors such as the
promptness of the commencement of the charging management, the existence of
executive documents which match the credit or the existence of guarantees and
free debt assets under the name of the debtor. Therefore, the probability of
non-compliance should not be solely interpreted as the total loss of the owed
amount.
|
Result of
query submitted to the R.A.I. (Spanish Bad Debt Register) on |
LEGAL CLAIMS
|
|
Summary of Judicial Claims |
|
|
|
|
|
|
|
|
||
|
|
|
Not published |
|
|
|
|
Not published |
|
|
|
|
||
|
|
|
Not published |
|
|
|
|
Not published |
|
|
|
|
Not published |
|
|
|
|
Not published |
|
|
|
|
||
|
|
|
Not published |
|
|
|
|
Not published |
|
|
|
|
||
|
|
|
Not published |
|
Guarantees
|
|
References |
|
|
|
|
Link
List
|
|
HAS IN ITS ADMINISTRATION BOARD TO: |
1 Entities |
|
IS RELATED WITH: |
2 Entities |
|
PARTICIPATES IN: |
2 Entities |
|
SHAREHOLDERS: |
1 Entities |
> Shareholders
|
Relationship |
Entity |
Province |
Shareholding stake |
|
SHAREHOLDERS |
PINTER CAIPO TECHNOLOGIES SL |
BARCELONA |
100 |
|
PARTICIPATES IN |
PINTER SERVICE INDIA |
|
50 |
|
|
PINTER YUHUA CHINA TECNOLOGIES |
|
50 |
> Other relationships
|
Relationship |
Entity |
Province |
Shareholding stake |
|
IS RELATED WITH |
| | |
|
|
|
|
DISTAFF & SPINDLE SL |
BARCELONA |
|
|
|
CAIPO AUTOMAZIONE INDUSTRIALE |
|
|
|
HAS IN ITS ADMINISTRATION BOARD TO |
PINTER CAIPO TECHNOLOGIES SL |
BARCELONA |
|
Turnover
|
|
|
Total Sales 2016 |
21.487.212,17 |
The sales data is from the latest available
financial statements in. Failing that, are estimates data calculated by
statistical methods.
Estimated
Balance
|
|
2017 ESTIMATED FIGURES: -NON-CURRENT ASSETS
1.679.000 Euro/s -CURRENT ASSETS 11.218.000 Euro/s -NET EQUITY 6.841.000
Euro/s -NON-CURRENT LIABILITIES 5.000 Euro/s -CURRENT LIABILITIES 6.051.000
Euro/s -TOTAL ASSETS AND LIABILITIES 12.897.000 Euro/s -SALES 23.100.000
Euro/s |
Financial
Accounts and Balance Sheets
|
|
|
|
|
Financial Years Presented
|
Ejercicio |
Tipo de Cuentas Anuales |
Fecha Presentacion |
|
2016 |
Normales |
August 2017 |
|
2015 |
Normales |
October 2016 |
|
2014 |
Normales |
August 2015 |
|
2013 |
Normales |
August 2014 |
|
2012 |
Normales |
August 2013 |
|
2011 |
Normales |
August 2012 |
|
2010 |
Normales |
July 2011 |
|
2009 |
Normales |
July 2010 |
|
2008 |
Normales |
October 2009 |
|
2007 |
Normales |
September 2008 |
|
2006 |
Normales |
August 2007 |
|
2005 |
Normales |
January 2007 |
|
2004 |
Normales |
October 2005 |
|
2003 |
Normales |
June 2004 |
|
2002 |
Normales |
September 2003 |
|
2001 |
Normales |
August 2002 |
|
2000 |
Normales |
August 2001 |
|
1999 |
Normales |
August 2000 |
|
1998 |
Normales |
October 1999 |
|
1997 |
Normales |
August 1998 |
|
1996 |
Normales |
August 1997 |
|
1995 |
Normales |
July 1996 |
|
1994 |
Normales |
August 1995 |
|
1993 |
Normales |
August 1994 |
|
1992 |
Normales |
July 1993 |
|
1991 |
Normales |
July 1992 |
|
1990 |
Normales |
August 1991 |
|
1989 |
Normales |
July 1990 |
The data in the report regarding the last Company
Accounts submitted by the company is taken from the TRADE REGISTER serving the
region in which the company's address is located 31/12/2016
> Normal format Balance in
accordance with the New Accounting Plan 2007
Information corresponding to the fiscal year
2016 2015 2014 2013 2012 is taken from information
submitted to the TRADE REGISTER. Data corresponding to fiscal years before
2016 2015 2014 2013 2012 has been compiled based on
the equivalence criteria stipulated in Act JUS/206/2009. Where the provisions
of the Act did not establish relevant equivalence criteria, created such
criteria using its own methodology. To view details on the methodology.
|
|
ORIGINAL |
ORIGINAL |
ORIGINAL |
ORIGINAL |
ORIGINAL |
|
|
Assets |
2016 |
2015 |
2014 |
2013 |
2012 |
|
|
A) NON-CURRENT ASSETS: 11000 |
1.562.538,00 |
1.500.825,00 |
1.333.131,00 |
1.608.205,00 |
988.117,00 |
|
|
I. Intangible fixed
assets : 11100 |
81.756,00 |
12.720,00 |
20.440,00 |
33.600,00 |
38.600,00 |
|
|
1. Development: 11110 |
0,00 |
0,00 |
0,00 |
0,00 |
0,00 |
|
|
2. Concessions: 11120 |
0,00 |
0,00 |
0,00 |
0,00 |
0,00 |
|
|
3. Patents, licencing, trade marks and similar: 11130 |
5.000,00 |
10.000,00 |
15.000,00 |
20.000,00 |
43.131,00 |
|
|
4. Goodwill: 11140 |
0,00 |
0,00 |
0,00 |
0,00 |
0,00 |
|
|
5. IT applications: 11150 |
0,00 |
0,00 |
0,00 |
0,00 |
0,00 |
|
|
6.
Investigation: 11160 |
0,00 |
2.720,00 |
5.440,00 |
13.600,00 |
-4.531,00 |
|
|
7. Intellectual property: 11180 |
0,00 |
0,00 |
0,00 |
0,00 |
0,00 |
|
|
8. Greenhouse gas emission allowance: 11190 |
0,00 |
0,00 |
0,00 |
0,00 |
0,00 |
|
|
9. Other intangible fixed assets. : 11170 |
76.756,00 |
0,00 |
0,00 |
0,00 |
0,00 |
|
|
II. Tangible fixed
assets : 11200 |
978.085,00 |
982.689,00 |
928.931,00 |
795.716,00 |
888.008,00 |
|
|
1. Land and buildings: 11210 |
576.726,00 |
599.261,00 |
503.700,00 |
522.709,00 |
541.719,00 |
|
|
2. Technical installations and other tangible fixed assets: 11220 |
401.359,00 |
383.428,00 |
243.736,00 |
273.007,00 |
346.290,00 |
|
|
3. Tangible asset in progress and advances: 11230 |
0,00 |
0,00 |
181.495,00 |
0,00 |
0,00 |
|
|
III. Real estate
investment: 11300 |
0,00 |
0,00 |
0,00 |
0,00 |
0,00 |
|
|
1. Land: 11310 |
0,00 |
0,00 |
0,00 |
0,00 |
0,00 |
|
|
2. Buildings: 11320 |
0,00 |
0,00 |
0,00 |
0,00 |
0,00 |
|
|
IV. Long-term
investments in Group companies and associates : 11400 |
142.929,00 |
73.524,00 |
4.118,00 |
4.118,00 |
4.118,00 |
|
|
1. Equity instruments: 11410 |
142.929,00 |
73.524,00 |
4.118,00 |
4.118,00 |
4.118,00 |
|
|
2. Credits to businesses: 11420 |
0,00 |
0,00 |
0,00 |
0,00 |
0,00 |
|
|
3.
Debt securities: 11430 |
0,00 |
0,00 |
0,00 |
0,00 |
0,00 |
|
|
4. Derivatives : 11440 |
0,00 |
0,00 |
0,00 |
0,00 |
0,00 |
|
|
5. Other financial assets : 11450 |
0,00 |
0,00 |
0,00 |
0,00 |
0,00 |
|
|
6. Other investments: 11460 |
0,00 |
0,00 |
0,00 |
0,00 |
0,00 |
|
|
V. Long-term
financial investments: 11500 |
342.767,00 |
412.767,00 |
358.391,00 |
763.411,00 |
57.391,00 |
|
|
1. Equity instruments: 11510 |
41.406,00 |
82.030,00 |
57.030,00 |
57.030,00 |
57.030,00 |
|
|
2. Credits to third parties : 11520 |
0,00 |
0,00 |
0,00 |
5.020,00 |
0,00 |
|
|
3. Debt securities: 11530 |
300.000,00 |
254.376,00 |
0,00 |
0,00 |
0,00 |
|
|
4. Derivatives : 11540 |
0,00 |
0,00 |
0,00 |
0,00 |
0,00 |
|
|
5. Other financial assets : 11550 |
1.361,00 |
76.361,00 |
301.361,00 |
701.361,00 |
361,00 |
|
|
6. Other investments: 11560 |
0,00 |
0,00 |
0,00 |
0,00 |
0,00 |
|
|
VII. Non-current
trade debts : 11700 |
0,00 |
0,00 |
0,00 |
0,00 |
0,00 |
|
|
VI. Assets for
deferred tax : 11600 |
17.001,00 |
19.126,00 |
21.251,00 |
11.361,00 |
0,00 |
|
|
B) CURRENT ASSETS: 12000 |
10.434.652,00 |
9.347.385,00 |
6.086.938,00 |
6.561.570,00 |
5.865.481,00 |
|
|
I. Non-current assets
held for sale : 12100 |
0,00 |
0,00 |
0,00 |
0,00 |
0,00 |
|
|
II. Stocks:
12200 |
2.074.147,00 |
2.196.116,00 |
1.351.657,00 |
1.024.579,00 |
1.983.750,00 |
|
|
1. Commercial: 12210 |
2.061.517,00 |
2.196.116,00 |
1.351.657,00 |
1.021.355,00 |
1.983.750,00 |
|
|
2. Primary material and other supplies: 12220 |
0,00 |
0,00 |
0,00 |
0,00 |
0,00 |
|
|
a) Long-term primary material and other supplies:
12221 |
0,00 |
0,00 |
0,00 |
0,00 |
0,00 |
|
|
b) Short-term primary material and other supplies:
12222 |
0,00 |
0,00 |
0,00 |
0,00 |
0,00 |
|
|
3. Work in progress: 12230 |
0,00 |
0,00 |
0,00 |
0,00 |
0,00 |
|
|
a) Of long-term production cycle : 12231 |
0,00 |
0,00 |
0,00 |
0,00 |
0,00 |
|
|
b) Of short-term production cycle : 12232 |
0,00 |
0,00 |
0,00 |
0,00 |
0,00 |
|
|
4. Finished goods: 12240 |
0,00 |
0,00 |
0,00 |
0,00 |
0,00 |
|
|
a) Of long-term production cycle : 12241 |
0,00 |
0,00 |
0,00 |
0,00 |
0,00 |
|
|
b) Of short-term production cycle : 12242 |
0,00 |
0,00 |
0,00 |
0,00 |
0,00 |
|
|
5. By-products, residues and recycled materials: 12250 |
0,00 |
0,00 |
0,00 |
0,00 |
0,00 |
|
|
6. Advances to suppliers: 12260 |
12.630,00 |
0,00 |
0,00 |
3.223,00 |
0,00 |
|
|
III. Trade debtors
and others receivable accounts: 12300 |
1.113.067,00 |
2.818.150,00 |
957.213,00 |
1.160.486,00 |
2.327.516,00 |
|
|
1.
Trade debtors / accounts receivable: 12310 |
743.225,00 |
2.163.519,00 |
606.283,00 |
1.003.319,00 |
1.750.058,00 |
|
|
a) Long-term receivables from sales and services
supplied : 12311 |
0,00 |
0,00 |
0,00 |
0,00 |
0,00 |
|
|
b) Customers for sales and provisions of services :
12312 |
743.225,00 |
2.163.519,00 |
606.283,00 |
1.003.319,00 |
1.750.058,00 |
|
|
2. Customers, Group companies and associates : 12320 |
0,00 |
0,00 |
0,00 |
0,00 |
0,00 |
|
|
3. Other accounts receivable: 12330 |
0,00 |
0,00 |
0,00 |
0,00 |
0,00 |
|
|
4. Personnel: 12340 |
0,00 |
0,00 |
5.020,00 |
4.980,00 |
0,00 |
|
|
5. Assets for deferred tax: 12350 |
0,00 |
0,00 |
0,00 |
0,00 |
0,00 |
|
|
6. Other debtors, including tax and social security: 12360 |
369.842,00 |
654.631,00 |
345.910,00 |
152.187,00 |
577.458,00 |
|
|
7. Called up share capital: 12370 |
0,00 |
0,00 |
0,00 |
0,00 |
0,00 |
|
|
IV. Short-term
investments in Group companies and associates: 12400 |
0,00 |
0,00 |
0,00 |
0,00 |
0,00 |
|
|
1. Equity instruments: 12410 |
0,00 |
0,00 |
0,00 |
0,00 |
0,00 |
|
|
2. Credits to businesses: 12420 |
0,00 |
0,00 |
0,00 |
0,00 |
0,00 |
|
|
3. Debt securities: 12430 |
0,00 |
0,00 |
0,00 |
0,00 |
0,00 |
|
|
4. Derivatives : 12440 |
0,00 |
0,00 |
0,00 |
0,00 |
0,00 |
|
|
5. Other financial assets : 12450 |
0,00 |
0,00 |
0,00 |
0,00 |
0,00 |
|
|
6. Other investments: 12460 |
0,00 |
0,00 |
0,00 |
0,00 |
0,00 |
|
|
V. Short-term
financial investments : 12500 |
19.750,00 |
44.750,00 |
27.750,00 |
17.750,00 |
0,00 |
|
|
1. Equity instruments: 12510 |
0,00 |
0,00 |
0,00 |
0,00 |
0,00 |
|
|
2. Credits to businesses: 12520 |
19.750,00 |
44.750,00 |
27.750,00 |
17.750,00 |
0,00 |
|
|
3.
Debt securities: 12530 |
0,00 |
0,00 |
0,00 |
0,00 |
0,00 |
|
|
4. Derivatives : 12540 |
0,00 |
0,00 |
0,00 |
0,00 |
0,00 |
|
|
5. Other financial assets : 12550 |
0,00 |
0,00 |
0,00 |
0,00 |
0,00 |
|
|
6. Other investments: 12560 |
0,00 |
0,00 |
0,00 |
0,00 |
0,00 |
|
|
VI. Short-term
accruals: 12600 |
0,00 |
0,00 |
0,00 |
0,00 |
0,00 |
|
|
VII. Cash and other
equivalent liquid assets : 12700 |
7.227.687,00 |
4.288.370,00 |
3.750.318,00 |
4.358.755,00 |
1.554.215,00 |
|
|
1. Treasury: 12710 |
7.227.687,00 |
4.288.370,00 |
3.442.798,00 |
4.054.274,00 |
1.554.215,00 |
|
|
2. Other equivalent liquid assets: 12720 |
0,00 |
0,00 |
307.521,00 |
304.482,00 |
0,00 |
|
|
TOTAL ASSETS (A + B) : 10000 |
11.997.189,00 |
10.848.210,00 |
7.420.069,00 |
8.169.775,00 |
6.853.598,00 |
|
|
|
ORIGINAL |
ORIGINAL |
ORIGINAL |
ORIGINAL |
ORIGINAL |
|
|
Liabilities and Net Worth |
2016 |
2015 |
2014 |
2013 |
2012 |
|
|
A) NET WORTH: 20000 |
6.362.538,00 |
4.471.051,00 |
3.455.929,00 |
3.173.251,00 |
2.474.068,00 |
|
|
A-1) Shareholders'
equity: 21000 |
6.362.538,00 |
4.471.051,00 |
3.455.929,00 |
3.173.251,00 |
2.474.068,00 |
|
|
I. Capital:
21100 |
150.100,00 |
150.100,00 |
150.100,00 |
150.100,00 |
150.100,00 |
|
|
1. Registered capital : 21110 |
150.100,00 |
150.100,00 |
150.100,00 |
150.100,00 |
150.100,00 |
|
|
2. (Uncalled capital): 21120 |
0,00 |
0,00 |
0,00 |
0,00 |
0,00 |
|
|
II. Share premium:
21200 |
0,00 |
0,00 |
0,00 |
0,00 |
0,00 |
|
|
III. Reserves:
21300 |
4.320.952,00 |
3.305.829,00 |
3.023.151,00 |
2.323.969,00 |
2.196.090,00 |
|
|
1. Legal and statutory: 21310 |
60.101,00 |
60.101,00 |
60.101,00 |
60.101,00 |
60.101,00 |
|
|
2. Other reserves: 21320 |
4.260.850,00 |
3.245.728,00 |
2.963.050,00 |
2.263.867,00 |
2.135.989,00 |
|
|
3. Revaluation reserves: 21330 |
0,00 |
0,00 |
0,00 |
0,00 |
0,00 |
|
|
2. Capitalisation Reserves: 21350 |
0,00 |
0,00 |
0,00 |
0,00 |
0,00 |
|
|
IV. (Common stock equity):
21400 |
0,00 |
0,00 |
0,00 |
0,00 |
0,00 |
|
|
V. Results from
previous periods: 21500 |
0,00 |
0,00 |
0,00 |
0,00 |
0,00 |
|
|
1. Brought forward: 21510 |
0,00 |
0,00 |
0,00 |
0,00 |
0,00 |
|
|
2.
(Negative results from previous periods): 21520 |
0,00 |
0,00 |
0,00 |
0,00 |
0,00 |
|
|
VI. Other
shareholders' contributions: 21600 |
0,00 |
0,00 |
0,00 |
0,00 |
0,00 |
|
|
VII. Result of the
period: 21700 |
1.891.486,00 |
1.015.123,00 |
282.678,00 |
699.182,00 |
477.879,00 |
|
|
VIII. (Interim
dividend): 21800 |
0,00 |
0,00 |
0,00 |
0,00 |
-350.000,00 |
|
|
IX. Other net worth
instruments: 21900 |
0,00 |
0,00 |
0,00 |
0,00 |
0,00 |
|
|
A-2) Adjustments due
to changes in value: 22000 |
0,00 |
0,00 |
0,00 |
0,00 |
0,00 |
|
|
I. Financial assets
held for sale: 22100 |
0,00 |
0,00 |
0,00 |
0,00 |
0,00 |
|
|
II. Hedge operations:
22200 |
0,00 |
0,00 |
0,00 |
0,00 |
0,00 |
|
|
III. Linked
non-current assets and liabilities held for sale : 22300 |
0,00 |
0,00 |
0,00 |
0,00 |
0,00 |
|
|
IV. Exchange rate
difference: 22400 |
0,00 |
0,00 |
0,00 |
0,00 |
0,00 |
|
|
V. Other: 22500 |
0,00 |
0,00 |
0,00 |
0,00 |
0,00 |
|
|
A-3) Received
subsidies, donations and legacies: 23000 |
0,00 |
0,00 |
0,00 |
0,00 |
0,00 |
|
|
B) NON-CURRENT LIABILITIES: 31000 |
5.152,00 |
7.471,00 |
20.587,00 |
6.896,00 |
3.865,00 |
|
|
I. Long-term
provisions: 31100 |
0,00 |
0,00 |
0,00 |
0,00 |
0,00 |
|
|
1. Long-term employee benefits liability: 31110 |
0,00 |
0,00 |
0,00 |
0,00 |
0,00 |
|
|
2. Environmental actions: 31120 |
0,00 |
0,00 |
0,00 |
0,00 |
0,00 |
|
|
3. Restructuring provisions: 31130 |
0,00 |
0,00 |
0,00 |
0,00 |
0,00 |
|
|
4. Other provisions: 31140 |
0,00 |
0,00 |
0,00 |
0,00 |
0,00 |
|
|
II Long-term
creditors: 31200 |
5.152,00 |
7.471,00 |
20.587,00 |
6.896,00 |
3.865,00 |
|
|
1. Liabilities and other securities: 31210 |
0,00 |
0,00 |
0,00 |
0,00 |
0,00 |
|
|
2. Amounts owed to credit institutions: 31220 |
0,00 |
0,00 |
0,00 |
0,00 |
0,00 |
|
|
3. Creditors from financial leasing: 31230 |
0,00 |
0,00 |
1.910,00 |
6.896,00 |
3.865,00 |
|
|
4. Derivatives : 31240 |
0,00 |
0,00 |
0,00 |
0,00 |
0,00 |
|
|
5.
Other financial liabilities : 31250 |
5.152,00 |
7.471,00 |
18.677,00 |
0,00 |
0,00 |
|
|
III. Long-term debts
with Group companies and associates: 31300 |
0,00 |
0,00 |
0,00 |
0,00 |
0,00 |
|
|
IV. Liabilities for deferred
tax: 31400 |
0,00 |
0,00 |
0,00 |
0,00 |
0,00 |
|
|
V. Long-term
accruals: 31500 |
0,00 |
0,00 |
0,00 |
0,00 |
0,00 |
|
|
VI. Non-current trade
creditors : 31600 |
0,00 |
0,00 |
0,00 |
0,00 |
0,00 |
|
|
VII. Special
long-term debts : 31700 |
0,00 |
0,00 |
0,00 |
0,00 |
0,00 |
|
|
C) CURRENT LIABILITIES : 32000 |
5.629.499,00 |
6.369.688,00 |
3.943.553,00 |
4.989.628,00 |
4.375.664,00 |
|
|
I. Liabilities linked
to non-current assets held for sale: 32100 |
0,00 |
0,00 |
0,00 |
0,00 |
0,00 |
|
|
II. Short-term
provisions: 32200 |
0,00 |
0,00 |
0,00 |
0,00 |
0,00 |
|
|
1. Provisions from greenhouse gas emission allowance: 32210 |
0,00 |
0,00 |
0,00 |
0,00 |
0,00 |
|
|
2. Other provisions: 32220 |
0,00 |
0,00 |
0,00 |
0,00 |
0,00 |
|
|
III. Short-term
creditors : 32300 |
9.011,00 |
13.117,00 |
16.193,00 |
5.992,00 |
14.064,00 |
|
|
1.
Liabilities and other securities: 32310 |
0,00 |
0,00 |
0,00 |
0,00 |
0,00 |
|
|
2. Amounts owed to credit institutions: 32320 |
0,00 |
0,00 |
0,00 |
0,00 |
0,00 |
|
|
3. Creditors from financial leasing: 32330 |
0,00 |
0,00 |
0,00 |
0,00 |
0,00 |
|
|
4. Derivatives : 32340 |
0,00 |
0,00 |
0,00 |
0,00 |
0,00 |
|
|
5. Other financial liabilities : 32350 |
9.011,00 |
13.117,00 |
16.193,00 |
5.992,00 |
14.064,00 |
|
|
IV. Short-term debts
with Group companies and associates: 32400 |
0,00 |
0,00 |
0,00 |
0,00 |
0,00 |
|
|
V. Trade creditors
and other accounts payable: 32500 |
5.620.488,00 |
6.356.571,00 |
3.927.361,00 |
4.983.636,00 |
4.361.600,00 |
|
|
1. Suppliers: 32510 |
3.796.791,00 |
3.617.210,00 |
2.599.446,00 |
3.127.231,00 |
3.722.449,00 |
|
|
a) Long-term debts : 32511 |
0,00 |
0,00 |
0,00 |
0,00 |
0,00 |
|
|
b) Short-term debts : 32512 |
3.796.791,00 |
3.617.210,00 |
2.599.446,00 |
3.127.231,00 |
3.722.449,00 |
|
|
2. Suppliers, Group companies and associates: 32520 |
88.020,00 |
1.240.880,00 |
452.119,00 |
758.443,00 |
0,00 |
|
|
3. Other creditors: 32530 |
1.152.642,00 |
791.053,00 |
362.159,00 |
481.805,00 |
124.983,00 |
|
|
4. Personnel (remuneration due): 32540 |
37.375,00 |
33.463,00 |
32.558,00 |
28.763,00 |
0,00 |
|
|
5.
Liabilities for current tax: 32550 |
0,00 |
0,00 |
0,00 |
0,00 |
0,00 |
|
|
6. Other accounts payable to Public Administrations.: 32560 |
79.885,00 |
177.695,00 |
137.200,00 |
189.852,00 |
90.044,00 |
|
|
7.
Advances from clients: 32570 |
465.775,00 |
496.270,00 |
343.878,00 |
397.541,00 |
424.125,00 |
|
|
VI. Short-term
accruals: 32600 |
0,00 |
0,00 |
0,00 |
0,00 |
0,00 |
|
|
VII. Special
short-term debts : 32700 |
0,00 |
0,00 |
0,00 |
0,00 |
0,00 |
|
|
TOTAL NET WORTH AND LIABILITIES (A + B +
C) : 30000 |
11.997.189,00 |
10.848.210,00 |
7.420.069,00 |
8.169.775,00 |
6.853.598,00 |
|
|
|
ORIGINAL |
ORIGINAL |
ORIGINAL |
ORIGINAL |
ORIGINAL |
|
|
Profit and Loss |
2016 |
2015 |
2014 |
2013 |
2012 |
|
|
1. Net turnover: 40100 |
21.487.212,00 |
18.908.848,00 |
13.826.104,00 |
23.175.034,00 |
16.059.162,00 |
|
|
a) Sales: 40110 |
21.147.088,00 |
18.636.803,00 |
13.577.195,00 |
22.846.150,00 |
15.660.489,00 |
|
|
b) Rendering of
services: 40120 |
340.124,00 |
272.044,00 |
248.909,00 |
328.883,00 |
398.674,00 |
|
|
c) Income of
financial nature of holding companies: 40130 |
0,00 |
0,00 |
0,00 |
0,00 |
0,00 |
|
|
2. Changes in stocks of finished goods and
work in progress: 40200 |
0,00 |
0,00 |
0,00 |
0,00 |
0,00 |
|
|
3. Works carried out by the company for
its assets: 40300 |
0,00 |
0,00 |
0,00 |
0,00 |
0,00 |
|
|
4. Supplies : 40400 |
-14.372.939,00 |
-12.787.979,00 |
-9.189.855,00 |
-17.533.147,00 |
-11.803.168,00 |
|
|
a) Stock consumption:
40410 |
-12.850.521,00 |
-11.352.697,00 |
-8.317.473,00 |
-15.625.500,00 |
-11.467.351,00 |
|
|
b) Consumption of raw
materials and miscellaneous consumable ones: 40420 |
-1.091.254,00 |
-1.042.604,00 |
-533.533,00 |
-1.384.400,00 |
-148.855,00 |
|
|
c) Works carried out
by other companies: 40430 |
-431.164,00 |
-392.679,00 |
-338.850,00 |
-523.247,00 |
-186.962,00 |
|
|
d) Impairment of
stock, primary material and other supplies: 40440 |
0,00 |
0,00 |
0,00 |
0,00 |
0,00 |
|
|
5. Other operating income: 40500 |
6.438,00 |
11.738,00 |
13.767,00 |
4.602,00 |
10.575,00 |
|
|
a) Auxiliary income
and other from current management: 40510 |
2.400,00 |
2.400,00 |
2.400,00 |
1.350,00 |
0,00 |
|
|
b) Operation
subsidies included in the Period's result: 40520 |
4.038,00 |
9.338,00 |
11.367,00 |
3.252,00 |
10.575,00 |
|
|
6. Personnel costs: 40600 |
-1.332.705,00 |
-1.373.111,00 |
-1.242.360,00 |
-1.175.421,00 |
-964.752,00 |
|
|
a) Wages, salaries et
al.: 40610 |
-1.032.716,00 |
-1.061.471,00 |
-968.590,00 |
-923.630,00 |
-757.142,00 |
|
|
b) Social security
costs: 40620 |
-299.989,00 |
-311.640,00 |
-273.770,00 |
-251.791,00 |
-207.610,00 |
|
|
c) Provisions :
40630 |
0,00 |
0,00 |
0,00 |
0,00 |
0,00 |
|
|
7. Other operating costs: 40700 |
-3.322.858,00 |
-3.386.618,00 |
-2.882.611,00 |
-3.351.454,00 |
-2.439.789,00 |
|
|
a) External services:
40710 |
-3.311.617,00 |
-3.377.168,00 |
-2.888.307,00 |
-3.334.709,00 |
-2.379.299,00 |
|
|
b) Taxes: 40720 |
-11.241,00 |
-9.450,00 |
-9.105,00 |
-16.745,00 |
-10.500,00 |
|
|
c) Losses,
impairments and variation in provisions from trade operations : 40730 |
0,00 |
0,00 |
14.800,00 |
0,00 |
-49.989,00 |
|
|
d) Other current
management expenditure : 40740 |
0,00 |
0,00 |
0,00 |
0,00 |
0,00 |
|
|
e) Expenses due to
greenhouse gas emissions: 40750 |
0,00 |
0,00 |
0,00 |
0,00 |
0,00 |
|
|
8. Amortisation of fixed assets:
40800 |
-117.462,00 |
-115.061,00 |
-109.893,00 |
-126.230,00 |
-122.202,00 |
|
|
9. Allocation of subsidies of
non-financial fixed assets and other: 40900 |
0,00 |
0,00 |
0,00 |
0,00 |
10.000,00 |
|
|
10. Excess provisions : 41000 |
0,00 |
0,00 |
0,00 |
0,00 |
0,00 |
|
|
11. Impairment and result of transfers of
fixed assets: 41100 |
13.125,00 |
0,00 |
7.603,00 |
0,00 |
-26.616,00 |
|
|
a) Impairment and
losses : 41110 |
0,00 |
0,00 |
0,00 |
0,00 |
0,00 |
|
|
b) Results for transfers
and other : 41120 |
13.125,00 |
0,00 |
7.603,00 |
0,00 |
-26.616,00 |
|
|
c) Impairment and
profit due to disposals of assets of holding companies: 41130 |
0,00 |
0,00 |
0,00 |
0,00 |
0,00 |
|
|
12. Negative difference in combined
businesses: 41200 |
0,00 |
0,00 |
0,00 |
0,00 |
0,00 |
|
|
13. Other results : 41300 |
4.451,00 |
286,00 |
2.172,00 |
13.333,00 |
5.613,00 |
|
|
A.1) OPERATING INCOME (1 + 2 + 3 + 4 + 5 +
6 + 7 + 8 + 9 + 10 + 11 + 12 + 13) : 49100 |
2.365.261,00 |
1.258.103,00 |
424.927,00 |
1.006.718,00 |
728.824,00 |
|
|
14. Financial income : 41400 |
16.770,00 |
25.942,00 |
35.762,00 |
41.326,00 |
23.012,00 |
|
|
a) Of shares in equity
instruments : 41410 |
0,00 |
23.443,00 |
29.450,00 |
36.844,00 |
11.008,00 |
|
|
a 1) In Group companies and associates: 41411 |
0,00 |
23.443,00 |
29.450,00 |
36.844,00 |
11.008,00 |
|
|
a
2) In third parties: 41412 |
0,00 |
0,00 |
0,00 |
0,00 |
0,00 |
|
|
b) From negotiable
securities and other financial instruments : 41420 |
16.770,00 |
2.498,00 |
6.312,00 |
4.482,00 |
12.004,00 |
|
|
b
1) From Group companies and associates : 41421 |
0,00 |
0,00 |
2.500,00 |
0,00 |
9.800,00 |
|
|
b 2) From third parties : 41422 |
16.770,00 |
2.498,00 |
3.812,00 |
4.482,00 |
2.204,00 |
|
|
c) Allocation of financial
subsidies, donations and legacies : 41430 |
0,00 |
0,00 |
0,00 |
0,00 |
0,00 |
|
|
15. Financial expenditure: 41500 |
-67.601,00 |
-58.169,00 |
-55.284,00 |
-114.920,00 |
-97.772,00 |
|
|
a) Amounts owed to Group
companies and associates : 41510 |
-5,00 |
0,00 |
-102,00 |
-23.136,00 |
-20.407,00 |
|
|
b) For debts with
third parties : 41520 |
-67.596,00 |
-58.169,00 |
-55.182,00 |
-91.785,00 |
-77.365,00 |
|
|
c) Stock renewal : 41530 |
0,00 |
0,00 |
0,00 |
0,00 |
0,00 |
|
|
16. Changes in fair value of financial
instruments : 41600 |
-174,00 |
0,00 |
3.039,00 |
0,00 |
0,00 |
|
|
a) Trading book and
other : 41610 |
-174,00 |
0,00 |
3.039,00 |
0,00 |
0,00 |
|
|
b) Allocation of
financial assets held for sale to the result for the period: 41620 |
0,00 |
0,00 |
0,00 |
0,00 |
0,00 |
|
|
17. Exchange rate differences :
41700 |
-8.503,00 |
4.267,00 |
-4.619,00 |
-4.665,00 |
-10.292,00 |
|
|
18. Impairment and result for transfers of
financial instruments: 41800 |
0,00 |
-45.624,00 |
0,00 |
0,00 |
0,00 |
|
|
a) Impairment and
losses : 41810 |
0,00 |
-45.624,00 |
0,00 |
0,00 |
0,00 |
|
|
b) Results for transfers
and other : 41820 |
0,00 |
0,00 |
0,00 |
0,00 |
0,00 |
|
|
19. Other financial income and
expenditure: 42100 |
0,00 |
0,00 |
0,00 |
0,00 |
0,00 |
|
|
a) Incorporation of
financial expenditure to assets: 42110 |
0,00 |
0,00 |
0,00 |
0,00 |
0,00 |
|
|
b) Financial income
from arrangement with creditors: 42120 |
0,00 |
0,00 |
0,00 |
0,00 |
0,00 |
|
|
c) Other income and
expenditure: 42130 |
0,00 |
0,00 |
0,00 |
0,00 |
0,00 |
|
|
A.2) FINANCIAL REVENUE (14+15+16+17+18+19)
: 49200 |
-59.507,00 |
-73.584,00 |
-21.101,00 |
-78.259,00 |
-85.052,00 |
|
|
A.3) NET RESULT BEFORE TAXES (A.1+A.2) :
49300 |
2.305.754,00 |
1.184.519,00 |
403.826,00 |
928.459,00 |
643.772,00 |
|
|
20. Income taxes: 41900 |
-414.268,00 |
-169.396,00 |
-121.148,00 |
-229.276,00 |
-165.893,00 |
|
|
A.4) PROFIT AFTER TAXES (A.3+20) :
49400 |
1.891.486,00 |
1.015.123,00 |
282.678,00 |
699.182,00 |
477.879,00 |
|
|
21. Result of the year coming from
interrupted operations : 42000 |
0,00 |
0,00 |
0,00 |
0,00 |
0,00 |
|
|
A.5) RESULT OF THE PERIOD (A.4+21) :
49500 |
1.891.486,00 |
1.015.123,00 |
282.678,00 |
699.182,00 |
477.879,00 |
|
> Normal Balance Sheet under the rules of
the 1990 General Accounting Plan (repealed since 1st January of 2008)
Information corresponding to the fiscal year
2016 2015 2014 2013 2012 has been compiled based on
the equivalence criteria stipulated in Act JUS/206/2009. Where the provisions
of the Act did not establish relevant equivalence criteria, created such
criteria using its own methodology. To view details on the methodology
2016 2015 2014 2013 2012 is taken from information
submitted to the TRADE REGISTER.
|
|
EQUIVALENCIA |
EQUIVALENCIA |
EQUIVALENCIA |
EQUIVALENCIA |
EQUIVALENCIA |
|
|
ASSETS |
2016 |
2015 |
2014 |
2013 |
2012 |
|
|
A) SHAREHOLDERS (PARTNERS) BY UNCALLED
SUSCRIBED CAPITAL: |
0,00 |
0,00 |
0,00 |
0,00 |
0,00 |
|
|
B) FIXED ASSETS: |
1.545.537,00 |
1.481.699,00 |
1.311.880,00 |
1.596.845,00 |
988.117,00 |
|
|
I. Formation
expenses: |
0,00 |
0,00 |
0,00 |
0,00 |
0,00 |
|
|
II. Intangible fixed
assets: |
81.756,00 |
12.720,00 |
20.440,00 |
33.600,00 |
38.600,00 |
|
|
1. Research and development costs: |
0,00 |
2.720,00 |
5.440,00 |
13.600,00 |
-4.531,00 |
|
|
2. Concessions, patents, licences, trademarks et al.: |
5.000,00 |
10.000,00 |
15.000,00 |
20.000,00 |
43.131,00 |
|
|
3. Goodwill: |
0,00 |
0,00 |
0,00 |
0,00 |
0,00 |
|
|
4. Key money paid for premises: |
0,00 |
0,00 |
0,00 |
0,00 |
0,00 |
|
|
5. Software: |
0,00 |
0,00 |
0,00 |
0,00 |
0,00 |
|
|
6. Assets under capital leases: |
0,00 |
0,00 |
0,00 |
0,00 |
0,00 |
|
|
7. Payments on account: |
76.756,00 |
0,00 |
0,00 |
0,00 |
0,00 |
|
|
8. Provisions: |
0,00 |
0,00 |
0,00 |
0,00 |
0,00 |
|
|
9. Accumulated depreciation: |
0,00 |
0,00 |
0,00 |
0,00 |
0,00 |
|
|
III. Tangible fixed
assets: |
978.085,00 |
982.689,00 |
928.931,00 |
795.716,00 |
888.008,00 |
|
|
1. Land and construction: |
576.726,00 |
599.261,00 |
503.700,00 |
522.709,00 |
541.719,00 |
|
|
2. Technical installations and machinery: |
401.359,00 |
383.428,00 |
243.736,00 |
273.007,00 |
346.290,00 |
|
|
3. Other installations, tools and furniture: |
0,00 |
0,00 |
0,00 |
0,00 |
0,00 |
|
|
4. Payments on account and tangible fixed assets under construction: |
0,00 |
0,00 |
181.495,00 |
0,00 |
0,00 |
|
|
5.
Other tangible assets: |
0,00 |
0,00 |
0,00 |
0,00 |
0,00 |
|
|
6. Provisions: |
0,00 |
0,00 |
0,00 |
0,00 |
0,00 |
|
|
7. Accumulated depreciation: |
0,00 |
0,00 |
0,00 |
0,00 |
0,00 |
|
|
IV. Financial
investments: |
485.696,00 |
486.290,00 |
362.509,00 |
767.529,00 |
61.509,00 |
|
|
1. Equity investments in group companies: |
142.929,00 |
73.524,00 |
4.118,00 |
4.118,00 |
4.118,00 |
|
|
2.
Receivables from group companies: |
0,00 |
0,00 |
0,00 |
0,00 |
0,00 |
|
|
3. Equity investment in associated companies: |
0,00 |
0,00 |
0,00 |
0,00 |
0,00 |
|
|
4. Credits to associated companies: |
0,00 |
0,00 |
0,00 |
0,00 |
0,00 |
|
|
5. Long-term securities portfolio: |
341.406,00 |
336.406,00 |
57.030,00 |
57.030,00 |
57.030,00 |
|
|
6. Other receivables: |
0,00 |
0,00 |
0,00 |
5.020,00 |
0,00 |
|
|
7.
Long term guarantees and deposits: |
1.361,00 |
76.361,00 |
301.361,00 |
701.361,00 |
361,00 |
|
|
8. Provisions: |
0,00 |
0,00 |
0,00 |
0,00 |
0,00 |
|
|
9. Long-term receivables from public bodies: |
0,00 |
0,00 |
0,00 |
0,00 |
0,00 |
|
|
V. Own shares: |
0,00 |
0,00 |
0,00 |
0,00 |
0,00 |
|
|
VI. Long-term trade
receivables: |
0,00 |
0,00 |
0,00 |
0,00 |
0,00 |
|
|
C) Deferred expenses: |
0,00 |
0,00 |
0,00 |
0,00 |
0,00 |
|
|
D) CURRENT ASSETS: |
10.451.653,00 |
9.366.511,00 |
6.108.189,00 |
6.572.930,00 |
5.865.481,00 |
|
|
I. Called-up share
capital (not paid): |
0,00 |
0,00 |
0,00 |
0,00 |
0,00 |
|
|
II. Stocks: |
2.074.147,00 |
2.196.116,00 |
1.351.657,00 |
1.024.579,00 |
1.983.750,00 |
|
|
1. Goods for resale: |
2.061.517,00 |
2.196.116,00 |
1.351.657,00 |
1.021.355,00 |
1.983.750,00 |
|
|
2. Raw materials and other consumables: |
0,00 |
0,00 |
0,00 |
0,00 |
0,00 |
|
|
3. Goods in process and semifinished ones: |
0,00 |
0,00 |
0,00 |
0,00 |
0,00 |
|
|
4. Finished products: |
0,00 |
0,00 |
0,00 |
0,00 |
0,00 |
|
|
5.
Byproducts, scrap and recovered materials: |
0,00 |
0,00 |
0,00 |
0,00 |
0,00 |
|
|
6. Payments on account: |
12.630,00 |
0,00 |
0,00 |
3.223,00 |
0,00 |
|
|
7. Provisions: |
0,00 |
0,00 |
0,00 |
0,00 |
0,00 |
|
|
III. Debtors: |
1.130.068,00 |
2.837.276,00 |
978.464,00 |
1.171.847,00 |
2.327.516,00 |
|
|
1. Trade debtors / accounts receivable: |
743.225,00 |
2.163.519,00 |
606.283,00 |
1.003.319,00 |
1.750.058,00 |
|
|
2. Accounts receivable, Group companies: |
0,00 |
0,00 |
0,00 |
0,00 |
0,00 |
|
|
3. Accounts receivable, associated companies: |
0,00 |
0,00 |
0,00 |
0,00 |
0,00 |
|
|
4. Other debtors: |
0,00 |
0,00 |
0,00 |
0,00 |
0,00 |
|
|
5. Staff: |
0,00 |
0,00 |
5.020,00 |
4.980,00 |
0,00 |
|
|
6. Public bodies: |
386.843,00 |
673.757,00 |
367.161,00 |
163.548,00 |
577.458,00 |
|
|
7. Provisions: |
0,00 |
0,00 |
0,00 |
0,00 |
0,00 |
|
|
IV. Short-term
investments: |
19.750,00 |
44.750,00 |
335.271,00 |
322.231,00 |
0,00 |
|
|
1. Equity investments in group companies: |
0,00 |
0,00 |
0,00 |
0,00 |
0,00 |
|
|
2. Receivables from group companies: |
0,00 |
0,00 |
0,00 |
0,00 |
0,00 |
|
|
3. Equity investment in associated companies: |
0,00 |
0,00 |
0,00 |
0,00 |
0,00 |
|
|
4. Credits to associated companies: |
0,00 |
0,00 |
0,00 |
0,00 |
0,00 |
|
|
5. Short term securities portfolio: |
0,00 |
0,00 |
307.521,00 |
304.482,00 |
0,00 |
|
|
6. Other receivables: |
19.750,00 |
44.750,00 |
27.750,00 |
17.750,00 |
0,00 |
|
|
7. Shor term guarantees and deposits: |
0,00 |
0,00 |
0,00 |
0,00 |
0,00 |
|
|
8. Provisions: |
0,00 |
0,00 |
0,00 |
0,00 |
0,00 |
|
|
V. Short-term
treasury shares: |
0,00 |
0,00 |
0,00 |
0,00 |
0,00 |
|
|
VI. Cash at bank and
in hand: |
7.227.687,00 |
4.288.370,00 |
3.442.798,00 |
4.054.274,00 |
1.554.215,00 |
|
|
VII. Prepayments and
accrued income: |
0,00 |
0,00 |
0,00 |
0,00 |
0,00 |
|
|
GENERAL TOTAL (A + B + C + D): |
11.997.189,00 |
10.848.210,00 |
7.420.069,00 |
8.169.775,00 |
6.853.598,00 |
|
MERCANTILE REGISTRY.
|
|
EQUIVALENCIA |
EQUIVALENCIA |
EQUIVALENCIA |
EQUIVALENCIA |
EQUIVALENCIA |
|
|
LIABILITIES |
2016 |
2015 |
2014 |
2013 |
2012 |
|
|
A) EQUITY: |
6.362.538,00 |
4.471.051,00 |
3.455.929,00 |
3.173.251,00 |
2.474.068,00 |
|
|
I. Subscribed
capital: |
150.100,00 |
150.100,00 |
150.100,00 |
150.100,00 |
150.100,00 |
|
|
II. Share premium:
|
0,00 |
0,00 |
0,00 |
0,00 |
0,00 |
|
|
III. Revaluation
reserves: |
0,00 |
0,00 |
0,00 |
0,00 |
0,00 |
|
|
IV. Reserves: |
4.320.952,00 |
3.305.829,00 |
3.023.151,00 |
2.323.969,00 |
2.196.090,00 |
|
|
1. Legal reserve: |
60.101,00 |
60.101,00 |
60.101,00 |
60.101,00 |
60.101,00 |
|
|
2. Reserves for own shares: |
0,00 |
0,00 |
0,00 |
0,00 |
0,00 |
|
|
3. Reserves for shares of the controlling company: |
0,00 |
0,00 |
0,00 |
0,00 |
0,00 |
|
|
4. Statutory reserves: |
0,00 |
0,00 |
0,00 |
0,00 |
0,00 |
|
|
5. Miscellaneous reserves: |
4.260.839,00 |
3.245.719,00 |
2.963.041,00 |
2.263.861,00 |
2.135.983,00 |
|
|
6.
Differences due to capital adjustment to euros: |
12,00 |
9,00 |
8,00 |
6,00 |
6,00 |
|
|
V. Profit or loss
brought forward: |
0,00 |
0,00 |
0,00 |
0,00 |
0,00 |
|
|
1. Retained earnings: |
0,00 |
0,00 |
0,00 |
0,00 |
0,00 |
|
|
2. Prior year losses: |
0,00 |
0,00 |
0,00 |
0,00 |
0,00 |
|
|
3. Partners' contributions so as to compensate losses: |
0,00 |
0,00 |
0,00 |
0,00 |
0,00 |
|
|
VI. Profit or loss for
the financial year: |
1.891.486,00 |
1.015.123,00 |
282.678,00 |
699.182,00 |
477.879,00 |
|
|
VII. Interim dividend
paid: |
0,00 |
0,00 |
0,00 |
0,00 |
-350.000,00 |
|
|
VIII. Own shares for
capital reduction: |
0,00 |
0,00 |
0,00 |
0,00 |
0,00 |
|
|
B) Deferred income: |
0,00 |
0,00 |
0,00 |
0,00 |
0,00 |
|
|
1. Capital grants: |
0,00 |
0,00 |
0,00 |
0,00 |
0,00 |
|
|
2. Unrealised exchange gains: |
0,00 |
0,00 |
0,00 |
0,00 |
0,00 |
|
|
3. Other deferred income: |
0,00 |
0,00 |
0,00 |
0,00 |
0,00 |
|
|
4. Public revenues to distribute in several financial years: |
0,00 |
0,00 |
0,00 |
0,00 |
0,00 |
|
|
C) PROVISIONS FOR LIABILITIES AND CHARGES:
|
0,00 |
0,00 |
0,00 |
0,00 |
0,00 |
|
|
1. Provisions for pension fund and other similar obligations: |
0,00 |
0,00 |
0,00 |
0,00 |
0,00 |
|
|
2. Provisions for taxes: |
0,00 |
0,00 |
0,00 |
0,00 |
0,00 |
|
|
3. Other provisions: |
0,00 |
0,00 |
0,00 |
0,00 |
0,00 |
|
|
4. Reversion fund: |
0,00 |
0,00 |
0,00 |
0,00 |
0,00 |
|
|
D) LONG TERM LIABILITIES: |
5.152,00 |
7.471,00 |
20.587,00 |
6.896,00 |
3.865,00 |
|
|
I. Issued debentures
and other marketable securities: |
0,00 |
0,00 |
0,00 |
0,00 |
0,00 |
|
|
1. Non-convertible debentures: |
0,00 |
0,00 |
0,00 |
0,00 |
0,00 |
|
|
2. Convertible debentures: |
0,00 |
0,00 |
0,00 |
0,00 |
0,00 |
|
|
3. Other debt securities: |
0,00 |
0,00 |
0,00 |
0,00 |
0,00 |
|
|
II. Amounts owed to
credit institutions: |
0,00 |
0,00 |
1.910,00 |
6.896,00 |
3.865,00 |
|
|
1. Loans and other liabilities: |
0,00 |
0,00 |
0,00 |
0,00 |
0,00 |
|
|
2. Long-term liabilities from capital leases: |
0,00 |
0,00 |
1.910,00 |
6.896,00 |
3.865,00 |
|
|
III. Debts with companies
of the group and affiliated ones: |
0,00 |
0,00 |
0,00 |
0,00 |
0,00 |
|
|
1. Amounts owed to group companies: |
0,00 |
0,00 |
0,00 |
0,00 |
0,00 |
|
|
2. Amounts owed to associated companies: |
0,00 |
0,00 |
0,00 |
0,00 |
0,00 |
|
|
IV. Other creditors:
|
5.152,00 |
7.471,00 |
18.677,00 |
0,00 |
0,00 |
|
|
1. Long-term bills of exchange payable: |
0,00 |
0,00 |
0,00 |
0,00 |
0,00 |
|
|
2.
Other creditors: |
5.152,00 |
7.471,00 |
18.677,00 |
0,00 |
0,00 |
|
|
3. Long term guarantees and deposits received: |
0,00 |
0,00 |
0,00 |
0,00 |
0,00 |
|
|
4. Long term payables to public bodies: |
0,00 |
0,00 |
0,00 |
0,00 |
0,00 |
|
|
V. Unpaid portion of
equity investment: |
0,00 |
0,00 |
0,00 |
0,00 |
0,00 |
|
|
1. Group companies: |
0,00 |
0,00 |
0,00 |
0,00 |
0,00 |
|
|
2. Associated companies: |
0,00 |
0,00 |
0,00 |
0,00 |
0,00 |
|
|
3. Third parties: |
0,00 |
0,00 |
0,00 |
0,00 |
0,00 |
|
|
VI. Long term trade
creditors: |
0,00 |
0,00 |
0,00 |
0,00 |
0,00 |
|
|
E) SHORT TERM CREDITORS: |
5.629.499,00 |
6.369.688,00 |
3.943.553,00 |
4.989.628,00 |
4.375.664,00 |
|
|
I. Issued debentures
and other marketable securities: |
0,00 |
0,00 |
0,00 |
0,00 |
0,00 |
|
|
1. Non-convertible debentures: |
0,00 |
0,00 |
0,00 |
0,00 |
0,00 |
|
|
2. Convertible debentures: |
0,00 |
0,00 |
0,00 |
0,00 |
0,00 |
|
|
3. Other debt securities: |
0,00 |
0,00 |
0,00 |
0,00 |
0,00 |
|
|
4.
Accrued interest on debentures and other debt securities: |
0,00 |
0,00 |
0,00 |
0,00 |
0,00 |
|
|
II. Amounts owed to
credit institutions: |
0,00 |
0,00 |
0,00 |
0,00 |
0,00 |
|
|
1. Loans and other liabilities: |
0,00 |
0,00 |
0,00 |
0,00 |
0,00 |
|
|
2. Accrued interest on liabilities with credit institutions: |
0,00 |
0,00 |
0,00 |
0,00 |
0,00 |
|
|
3. Short-term liabilities from capital leases: |
0,00 |
0,00 |
0,00 |
0,00 |
0,00 |
|
|
III. Short-term
amounts owed to group and associated companies: |
88.020,00 |
1.240.880,00 |
452.119,00 |
758.443,00 |
0,00 |
|
|
1. Amounts owed to group companies: |
88.020,00 |
1.240.880,00 |
452.119,00 |
758.443,00 |
0,00 |
|
|
2. Amounts owed to associated companies: |
0,00 |
0,00 |
0,00 |
0,00 |
0,00 |
|
|
IV. Trade creditors:
|
5.415.208,00 |
4.904.534,00 |
3.305.483,00 |
4.006.578,00 |
4.271.556,00 |
|
|
1. Advanced payments from customers: |
465.775,00 |
496.270,00 |
343.878,00 |
397.541,00 |
424.125,00 |
|
|
2. Amounts owed for purchases of goods or services: |
4.949.433,00 |
4.408.263,00 |
2.961.605,00 |
3.609.037,00 |
3.847.431,00 |
|
|
3. Debts represented by notes payable: |
0,00 |
0,00 |
0,00 |
0,00 |
0,00 |
|
|
V. Other creditors:
|
126.271,00 |
224.275,00 |
185.951,00 |
224.607,00 |
104.108,00 |
|
|
1.
Public bodies: |
79.885,00 |
177.695,00 |
137.200,00 |
189.852,00 |
90.044,00 |
|
|
2. Bills of exchange payable: |
9.011,00 |
13.117,00 |
16.193,00 |
5.992,00 |
14.064,00 |
|
|
3. Miscellaneous debts: |
0,00 |
0,00 |
0,00 |
0,00 |
0,00 |
|
|
4. Wages and salaries payable: |
37.375,00 |
33.463,00 |
32.558,00 |
28.763,00 |
0,00 |
|
|
5. Guarantees and deposits received at short term: |
0,00 |
0,00 |
0,00 |
0,00 |
0,00 |
|
|
VI. Provisions:
|
0,00 |
0,00 |
0,00 |
0,00 |
0,00 |
|
|
VII. Prepayments and
accrued income: |
0,00 |
0,00 |
0,00 |
0,00 |
0,00 |
|
|
F) SHORT-TERM PROVISIONS FOR LIABILITIES
AND CHARGES: |
0,00 |
0,00 |
0,00 |
0,00 |
0,00 |
|
|
GENERAL TOTAL (A + B + C + D + E + F):
|
11.997.189,00 |
10.848.210,00 |
7.420.069,00 |
8.169.775,00 |
6.853.598,00 |
|
MERCANTILE REGISTRY.
|
|
EQUIVALENCIA |
EQUIVALENCIA |
EQUIVALENCIA |
EQUIVALENCIA |
EQUIVALENCIA |
|
|
DEBIT |
2016 |
2015 |
2014 |
2013 |
2012 |
|
|
A) CHARGES (A.1 to A.15): |
19.636.509,00 |
17.935.959,00 |
13.605.770,00 |
22.535.113,00 |
15.630.484,00 |
|
|
A.1. Operating consumption: |
14.372.939,00 |
12.787.979,00 |
9.189.855,00 |
17.533.147,00 |
11.803.168,00 |
|
|
A.2. Staff Costs: |
1.332.705,00 |
1.373.111,00 |
1.242.360,00 |
1.175.421,00 |
964.752,00 |
|
|
a) Wages, salaries et al.: |
1.032.716,00 |
1.061.471,00 |
968.590,00 |
923.630,00 |
757.142,00 |
|
|
b) Social security costs: |
299.989,00 |
311.640,00 |
273.770,00 |
251.791,00 |
207.610,00 |
|
|
A.3. Depreciation expense: |
117.462,00 |
115.061,00 |
109.893,00 |
126.230,00 |
122.202,00 |
|
|
A.4. Variation of trade provisions and losses of unrecovered receivables:
|
0,00 |
0,00 |
0,00 |
0,00 |
0,00 |
|
|
A.5. Other operating charges: |
3.322.858,00 |
3.386.618,00 |
2.882.611,00 |
3.351.454,00 |
2.439.789,00 |
|
|
A.I. OPERATING
BENEFITS (B.1-A.1-A.2-A.3-A.4-A.5): |
2.347.686,00 |
1.257.816,00 |
415.152,00 |
993.384,00 |
739.827,00 |
|
|
A.6. Financial and similar charges: |
67.601,00 |
103.793,00 |
55.284,00 |
114.920,00 |
97.772,00 |
|
|
a) Due to liabilities with companies of the group:
|
5,00 |
0,00 |
102,00 |
23.136,00 |
20.407,00 |
|
|
b) Due to liabilities with associated companies: |
0,00 |
0,00 |
0,00 |
0,00 |
0,00 |
|
|
c) Due to other debts: |
67.596,00 |
58.169,00 |
55.182,00 |
91.785,00 |
77.365,00 |
|
|
d) Losses from financial investments: |
0,00 |
45.624,00 |
0,00 |
0,00 |
0,00 |
|
|
A.7. Financial investment provision change: |
174,00 |
0,00 |
0,00 |
0,00 |
0,00 |
|
|
A.8. Exchange losses: |
8.503,00 |
0,00 |
4.619,00 |
4.665,00 |
10.292,00 |
|
|
A.II. POSITIVE
FINANCIAL RESULTS (B.2+B.3-A.6-A.7-A.8): |
0,00 |
0,00 |
0,00 |
0,00 |
0,00 |
|
|
A.III. PROFIT FROM
ORDINARY ACTIVITIES (A.I+A.II-B.I-B.II): |
2.288.179,00 |
1.184.232,00 |
394.051,00 |
915.125,00 |
654.775,00 |
|
|
A.9. Changes in provisions for intangible, tangible and securities portfolio:
|
0,00 |
0,00 |
0,00 |
0,00 |
0,00 |
|
|
A.10.
Losses from tangible and intangible fixed assets and portfolio: |
0,00 |
0,00 |
0,00 |
0,00 |
26.616,00 |
|
|
A.11. Losses from transactions with own shares and debentures: |
0,00 |
0,00 |
0,00 |
0,00 |
0,00 |
|
|
A.12. Extraordinary expenses: |
0,00 |
0,00 |
0,00 |
0,00 |
0,00 |
|
|
A.13. Prior year expenses and losses: |
0,00 |
0,00 |
0,00 |
0,00 |
0,00 |
|
|
A.IV. EXTRAORDINARY PROFIT
(B.4+B.5+B.6+B.7+B.8-A.9-A.10-A.11-A.12-A.13): |
17.575,00 |
286,00 |
9.775,00 |
13.333,00 |
0,00 |
|
|
A.V. PROFIT BEFORE
TAXES (A.III+A.IV-B.III-B.IV): |
2.305.754,00 |
1.184.519,00 |
403.826,00 |
928.459,00 |
643.772,00 |
|
|
A.14. Corporation Tax: |
414.268,00 |
169.396,00 |
121.148,00 |
229.276,00 |
165.893,00 |
|
|
A.15. Miscellaneous taxes: |
0,00 |
0,00 |
0,00 |
0,00 |
0,00 |
|
|
A.VI. FINANCIAL YEAR RESULT
(PROFIT) (A.V-A.14-A.15): |
1.891.486,00 |
1.015.123,00 |
282.678,00 |
699.182,00 |
477.879,00 |
|
MERCANTILE REGISTRY.
|
|
EQUIVALENCIA |
EQUIVALENCIA |
EQUIVALENCIA |
EQUIVALENCIA |
EQUIVALENCIA |
|
|
CREDIT |
2016 |
2015 |
2014 |
2013 |
2012 |
|
|
B) INCOME ( B.1 to B.8): |
21.527.995,00 |
18.951.082,00 |
13.888.448,00 |
23.234.295,00 |
16.108.363,00 |
|
|
B.1. Operating income: |
21.493.650,00 |
18.920.586,00 |
13.839.871,00 |
23.179.635,00 |
16.069.737,00 |
|
|
a) Net total sales: |
21.487.212,00 |
18.908.848,00 |
13.826.104,00 |
23.175.034,00 |
16.059.162,00 |
|
|
b) Miscellaneous operating income: |
6.438,00 |
11.738,00 |
13.767,00 |
4.602,00 |
10.575,00 |
|
|
B.I. PÉRDIDAS DE
EXPLOTACIÓN (A.1+A.2+A.3+A.4+A.5-B.1 ): |
0,00 |
0,00 |
0,00 |
0,00 |
0,00 |
|
|
B.2. Financial income: |
16.770,00 |
25.942,00 |
38.802,00 |
41.326,00 |
23.012,00 |
|
|
a) Companies of the group: |
0,00 |
23.443,00 |
31.950,00 |
36.844,00 |
20.808,00 |
|
|
b) In associated companies: |
0,00 |
0,00 |
0,00 |
0,00 |
0,00 |
|
|
c) Miscellaneous: |
16.770,00 |
2.498,00 |
6.851,00 |
4.482,00 |
2.204,00 |
|
|
d) Profit on financial investment: |
0,00 |
0,00 |
0,00 |
0,00 |
0,00 |
|
|
B.3. Exchange gains: |
0,00 |
4.267,00 |
0,00 |
0,00 |
0,00 |
|
|
B.II. NEGATIVE
FINANCIAL RESULTS (A.6+A.7+A.8-B.2-B.3): |
59.507,00 |
73.584,00 |
21.101,00 |
78.259,00 |
85.052,00 |
|
|
B.III. LOSSES ON
ORDINARY ACTIVITIES ( B.I + B.II - A.I - A.II ): |
0,00 |
0,00 |
0,00 |
0,00 |
0,00 |
|
|
B.4. Profit on disposal of both tangible and intangible fixed assets and
securities portfolio: |
13.125,00 |
0,00 |
7.603,00 |
0,00 |
0,00 |
|
|
B.5. Profit on transactions with own shares and debentures: |
0,00 |
0,00 |
0,00 |
0,00 |
0,00 |
|
|
B.6. Capital grants transferred to profit and loss: |
0,00 |
0,00 |
0,00 |
0,00 |
10.000,00 |
|
|
B.7. Extraordinary income: |
4.451,00 |
286,00 |
2.172,00 |
13.333,00 |
5.613,00 |
|
|
B.8. Income and profit of former financial years: |
0,00 |
0,00 |
0,00 |
0,00 |
0,00 |
|
|
B.IV. NEGATIVE
EXTRAORDINARY RESULTS (A.9+A.10+A.11+A.12+A.13-B.4-B.5-B.6-B.7-B.8): |
0,00 |
0,00 |
0,00 |
0,00 |
11.003,00 |
|
|
B.V. LOSSES BEFORE
TAXES (B.III+B.IV-A.III-A.IV): |
0,00 |
0,00 |
0,00 |
0,00 |
0,00 |
|
|
B.VI. FINANCIAL YEAR
RESULTS (LOSSES) (B.V+A.14+A.15): |
0,00 |
0,00 |
0,00 |
0,00 |
0,00 |
|
MERCANTILE REGISTRY.
|
|
|
|
|
Model: Normal
> Source of information: Data contained
in this section is taken from the information declared in the Annual Accounts
submitted to the Trade Register.
|
Net Rights Granted |
2016 |
2015 |
2014 |
2013 |
2012 |
|
|
1. Fiscal year result before taxes.:
61100 |
2.305.754,00 |
1.184.519,00 |
403.826,00 |
928.459,00 |
643.772,00 |
|
|
2. Results adjustments.: 61200 |
155.342,00 |
151.953,00 |
134.033,00 |
204.489,00 |
219.865,00 |
|
|
a) Fixed Assets
Amortization (+).: 61201 |
117.462,00 |
115.061,00 |
109.893,00 |
126.230,00 |
122.202,00 |
|
|
b) Obsolescence
Allowances (+/-). : 61202 |
0,00 |
0,00 |
0,00 |
0,00 |
22.611,00 |
|
|
d) Allocation of
grants (-).: 61204 |
0,00 |
0,00 |
0,00 |
0,00 |
-10.000,00 |
|
|
e) Results on
disposal of fixed assets (+/-). : 61205 |
-13.125,00 |
0,00 |
0,00 |
0,00 |
0,00 |
|
|
f) Results on
disposal of financial instruments (+/-).: 61206 |
174,00 |
0,00 |
0,00 |
0,00 |
0,00 |
|
|
g) Financial income
(-).: 61207 |
-16.770,00 |
-25.942,00 |
-35.762,00 |
-41.326,00 |
-23.012,00 |
|
|
h) Financial Expenses
(+). : 61208 |
67.601,00 |
58.169,00 |
55.284,00 |
114.920,00 |
97.772,00 |
|
|
i) Exchange
differences (+/-). : 61209 |
0,00 |
4.665,00 |
4.619,00 |
4.665,00 |
10.292,00 |
|
|
3. Changes in current capital equity.:
61300 |
1.191.818,00 |
-390.484,00 |
-1.180.081,00 |
2.652.771,00 |
992.079,00 |
|
|
a) Stock (+/-).:
61301 |
121.969,00 |
-844.459,00 |
-327.079,00 |
959.172,00 |
292.351,00 |
|
|
d) Debtors and other
accounts receivable (+/-). : 61302 |
1.705.083,00 |
-1.860.937,00 |
203.273,00 |
1.158.632,00 |
-1.074.639,00 |
|
|
c) Other current
assets (+/-). : 61303 |
0,00 |
0,00 |
0,00 |
0,00 |
96.444,00 |
|
|
d) Creditors and
other accounts payable (+/-). : 61304 |
-635.233,00 |
2.314.912,00 |
-1.056.275,00 |
534.967,00 |
1.677.924,00 |
|
|
4. Cash Flows from Other Operating
Activities: 61400 |
-563.824,00 |
-87.324,00 |
-95.678,00 |
-218.766,00 |
-154.262,00 |
|
|
a) Interest payments
(-). : 61401 |
-67.601,00 |
-58.169,00 |
-55.284,00 |
-114.920,00 |
-97.772,00 |
|
|
c) Interest
collection (+). : 61403 |
16.770,00 |
25.942,00 |
35.762,00 |
41.326,00 |
23.012,00 |
|
|
d) Income tax payment
collection (payments) (+/-).: 61404 |
-512.993,00 |
-55.097,00 |
-76.157,00 |
-145.171,00 |
-80.356,00 |
|
|
e) Other payments
(payment collection) (-/+) : 61405 |
0,00 |
0,00 |
0,00 |
0,00 |
854,00 |
|
|
5. Cash Flows from Operating Activities (1
+ 2 + 3 + 4) : 61500 |
3.089.091,00 |
858.664,00 |
-737.900,00 |
3.566.953,00 |
1.701.454,00 |
|
|
6. Payments for investment (-).:
62100 |
-287.972,00 |
-301.881,00 |
210.177,00 |
-752.707,00 |
-1.104,00 |
|
|
a) Companies of the
group and affiliates. : 62101 |
-69.406,00 |
-86.406,00 |
0,00 |
0,00 |
0,00 |
|
|
b) Intangible fixed
assets. : 62102 |
-71.756,00 |
0,00 |
0,00 |
-17.750,00 |
-1.104,00 |
|
|
c) Fixed assets. :
62103 |
-116.810,00 |
-161.099,00 |
-194.843,00 |
-28.937,00 |
0,00 |
|
|
e) Other financial
assets. : 62105 |
-30.000,00 |
-54.376,00 |
405.020,00 |
-706.020,00 |
0,00 |
|
|
7. Divestment payment collection (+). : 62200 |
152.326,00 |
0,00 |
0,00 |
0,00 |
30.000,00 |
|
|
c) Fixed assets. :
62203 |
27.500,00 |
0,00 |
0,00 |
0,00 |
0,00 |
|
|
e) Other financial
assets. : 62205 |
124.826,00 |
0,00 |
0,00 |
0,00 |
30.000,00 |
|
|
8. Cash Flow from Investing Activities
(6+7) less Amortization: 62300 |
-135.646,00 |
-301.881,00 |
210.177,00 |
-752.707,00 |
28.896,00 |
|
|
9. Payment collection and payments for
equity instruments. : 63100 |
0,00 |
0,00 |
0,00 |
0,00 |
-100.000,00 |
|
|
a) Issuance of equity
instruments (+). : 63101 |
0,00 |
0,00 |
0,00 |
0,00 |
-100.000,00 |
|
|
10. Payment collection and payments for
financial liabilities instruments.: 63200 |
-14.127,00 |
-23.891,00 |
-76.095,00 |
-5.040,00 |
-54.871,00 |
|
|
a) Issuance :
63201 |
28.376,00 |
8.023,00 |
0,00 |
114.873,00 |
17.929,00 |
|
|
2. Debts incurred
with credit institutions (+). : 63203 |
0,00 |
0,00 |
0,00 |
88.000,00 |
0,00 |
|
|
4. Special
characteristic debts (+). : 63205 |
0,00 |
8.023,00 |
0,00 |
0,00 |
0,00 |
|
|
5. Other debts (+). :
63206 |
28.376,00 |
0,00 |
0,00 |
26.873,00 |
17.929,00 |
|
|
b) Repayment and
amortization of : 63207 |
-42.502,00 |
-31.914,00 |
-76.095,00 |
-119.914,00 |
-72.800,00 |
|
|
2. Debts incurred
with credit institutions (-).: 63209 |
0,00 |
0,00 |
-72.000,00 |
-88.000,00 |
-31.950,00 |
|
|
5. Other debts (-). :
63212 |
-42.502,00 |
-31.914,00 |
-4.095,00 |
-31.914,00 |
-40.850,00 |
|
|
11. Payments from dividends and
remunerations from other assets instruments. : 63300 |
0,00 |
0,00 |
0,00 |
0,00 |
-350.000,00 |
|
|
a) Dividends (-).:
63301 |
0,00 |
0,00 |
0,00 |
0,00 |
-350.000,00 |
|
|
12. Cash Flows from Financing Activities
(9+10+11): 63400 |
-14.127,00 |
-23.891,00 |
-76.095,00 |
-5.040,00 |
-504.871,00 |
|
|
D) EFFECT OF EXCHANGE RATE CHANGES:
64000 |
0,00 |
5.159,00 |
-4.619,00 |
-4.665,00 |
0,00 |
|
|
E) NET INCREASE/DECREASE OF CASH OR
EQUIVALENT ASSETS (+/-5+/-8+/12+/-D) : 65000 |
2.939.318,00 |
538.051,00 |
-608.437,00 |
2.804.541,00 |
1.225.479,00 |
|
|
Cash or equivalent
assets as of beginning of the fiscal year.: 65100 |
4.288.370,00 |
3.750.318,00 |
4.358.755,00 |
1.554.215,00 |
328.735,00 |
|
|
Cash or equivalent
assets as of end of the fiscal year.: 65200 |
7.227.687,00 |
4.288.370,00 |
3.750.318,00 |
4.358.755,00 |
1.554.215,00 |
|
FINANCIAL
DIAGNOSIS
|
> Economic-Financial Comparative Analysis
Data used in the following ratios and
indicators is taken from the Annual Accounts submitted by the company to the
TRADE REGISTER.
> Comparison within the Sector
|
Cash Flow |
2016 |
2015 |
Variación 2016 - 2015 |
|
|||
|
|
Empresa |
Sector |
Empresa |
Sector |
Empresa |
Sector |
|
|
Cash Flow over Sales: |
0,14 % |
0,01 % |
0,03 % |
0,06 % |
380,74 % |
-84,22 % |
|
|
Net Financial Debt: |
-2,93 |
2,06 |
-3,14 |
2,84 |
6,59 |
-27,60 |
|
|
Cash Flow Yield: |
0,25 % |
0,01 % |
0,05 % |
0,03 % |
393,97 % |
-83,73 % |
|
|
EBITDA over Sales: |
11,47 % |
12,17 % |
7,26 % |
10,44 % |
58,01 % |
16,59 % |
|
|
Profitability |
2016 |
2015 |
Variación 2016 - 2015 |
|
|||
|
|
Empresa |
Sector |
Empresa |
Sector |
Empresa |
Sector |
|
|
Operating economic profitability: |
20,54 % |
9,05 % |
12,19 % |
6,93 % |
68,51 % |
30,59 % |
|
|
Total economic profitability: |
19,78 % |
5,18 % |
11,46 % |
3,20 % |
72,69 % |
62,17 % |
|
|
Financial profitability: |
29,73 % |
7,80 % |
22,70 % |
4,15 % |
30,94 % |
87,88 % |
|
|
Margin: |
10,98 % |
7,93 % |
6,65 % |
6,34 % |
65,22 % |
25,21 % |
|
|
Mark-up: |
10,71 % |
7,37 % |
6,26 % |
3,79 % |
71,07 % |
94,65 % |
|
|
Solvency |
2016 |
2015 |
Variación 2016 - 2015 |
|
|||
|
|
Empresa |
Sector |
Empresa |
Sector |
Empresa |
Sector |
|
|
Liquidity: |
1,28 |
0,16 |
0,67 |
0,14 |
90,70 |
13,88 |
|
|
Acid Test: |
1,49 |
0,89 |
1,12 |
0,87 |
32,28 |
3,04 |
|
|
Working Capital / Investment: |
0,40 |
0,03 |
0,27 |
0,03 |
45,92 |
3,54 |
|
|
Solvency: |
1,86 |
1,20 |
1,47 |
1,19 |
26,26 |
1,30 |
|
|
Indebtedness |
2016 |
2015 |
Variación 2016 - 2015 |
|
|||
|
|
Empresa |
Sector |
Empresa |
Sector |
Empresa |
Sector |
|
|
Indebtedness level: |
0,89 |
1,21 |
1,43 |
1,31 |
-37,91 |
-7,76 |
|
|
Borrowing Composition: |
0,00 |
1,02 |
0,00 |
1,04 |
|
-2,10 |
|
|
Repayment Ability: |
2,29 |
8,87 |
4,65 |
11,05 |
-50,79 |
-19,73 |
|
|
Warranty: |
2,13 |
1,85 |
1,70 |
1,78 |
25,16 |
3,67 |
|
|
Generated resources / Total creditors:
|
0,36 |
0,10 |
0,18 |
0,08 |
93,37 |
26,80 |
|
|
Efficiency |
2016 |
2015 |
Variación 2016 - 2015 |
|
|||
|
|
Empresa |
Sector |
Empresa |
Sector |
Empresa |
Sector |
|
|
Productivity: |
2,85 |
1,92 |
2,00 |
1,80 |
42,50 |
6,96 |
|
|
Turnover of Collection Rights : |
19,31 |
5,12 |
6,71 |
5,22 |
187,62 |
-1,92 |
|
|
Turnover of Payment Entitlements: |
3,15 |
3,53 |
2,54 |
3,69 |
23,73 |
-4,32 |
|
|
Stock rotation: |
9,23 |
8,15 |
8,04 |
7,79 |
14,77 |
4,60 |
|
|
Assets turnover: |
1,87 |
1,14 |
1,83 |
1,09 |
1,99 |
4,30 |
|
|
Borrowing Cost: |
1,20 |
2,35 |
0,91 |
2,45 |
31,53 |
-4,17 |
|
> Trend of indicators under the General
Accounting Plan of 2007 (2016, 2015, 2014, 2013, 2012)
|
Cash Flow |
2016 |
2015 |
2014 |
2013 |
2012 |
|
|
Cash Flow over Sales: |
0,14 % |
0,03 % |
-0,04 % |
0,12 % |
0,08 % |
|
|
Net Financial Debt: |
-2,93 |
-3,14 |
-7,13 |
-3,90 |
-1,78 |
|
|
Cash Flow Yield: |
0,25 % |
0,05 % |
-0,08 % |
0,34 % |
0,18 % |
|
|
EBITDA over Sales: |
11,47 % |
7,26 % |
3,80 % |
4,83 % |
5,37 % |
|
|
Profitability |
2016 |
2015 |
2014 |
2013 |
2012 |
|
|
Operating economic profitability: |
20,54 % |
12,19 % |
6,01 % |
13,45 % |
10,65 % |
|
|
Total economic profitability: |
19,78 % |
11,46 % |
6,19 % |
12,77 % |
10,82 % |
|
|
Financial profitability: |
29,73 % |
22,70 % |
8,18 % |
22,03 % |
19,32 % |
|
|
Margin: |
10,98 % |
6,65 % |
3,05 % |
4,29 % |
4,50 % |
|
|
Mark-up: |
10,71 % |
6,26 % |
2,90 % |
3,95 % |
3,97 % |
|
|
Solvency |
2016 |
2015 |
2014 |
2013 |
2012 |
|
|
Liquidity: |
1,28 |
0,67 |
0,95 |
0,87 |
0,36 |
|
|
Acid Test: |
1,49 |
1,12 |
1,20 |
1,11 |
0,89 |
|
|
Working Capital / Investment: |
0,40 |
0,27 |
0,29 |
0,19 |
0,22 |
|
|
Solvency: |
1,86 |
1,47 |
1,55 |
1,32 |
1,34 |
|
|
Indebtedness |
2016 |
2015 |
2014 |
2013 |
2012 |
|
|
Indebtedness level: |
0,89 |
1,43 |
1,15 |
1,57 |
1,77 |
|
|
Borrowing Composition: |
0,00 |
0,00 |
0,01 |
0,00 |
0,00 |
|
|
Repayment Ability: |
2,29 |
4,65 |
7,55 |
4,46 |
5,08 |
|
|
Warranty: |
2,13 |
1,70 |
1,87 |
1,64 |
1,56 |
|
|
Generated resources / Total creditors:
|
0,36 |
0,18 |
0,10 |
0,17 |
0,14 |
|
|
Efficiency |
2016 |
2015 |
2014 |
2013 |
2012 |
|
|
Productivity: |
2,85 |
2,00 |
1,42 |
1,95 |
1,89 |
|
|
Turnover of Collection Rights : |
19,31 |
6,71 |
14,46 |
19,97 |
6,90 |
|
|
Turnover of Payment Entitlements: |
3,15 |
2,54 |
3,07 |
4,19 |
3,27 |
|
|
Stock rotation: |
9,23 |
8,04 |
9,93 |
21,65 |
7,73 |
|
|
Assets turnover: |
1,87 |
1,83 |
1,97 |
3,14 |
2,37 |
|
|
Borrowing Cost: |
1,20 |
0,91 |
1,39 |
2,30 |
2,23 |
|
COMPARATIVE SECTORIAL BALANCE
|
Sector-based Comparison under the rules of
the New General Accounting Plan.
|
Net Rights Granted |
Variación - |
|
|
|
Empresa |
Sector |
|
Net Rights Granted |
Variación - |
|
|
|
Empresa |
Sector |
|
Net Rights Granted |
Variación - |
|
|
|
Empresa |
Sector |
News
|
Public
Tenders and Works Won
|
No Public Tenders assigned to the name of
the company.
Detail
of Subsidies appearing in Balances Memories
|
|
Entity |
FORCEM |
|
Status |
CONCEDIDA |
|
Amount Granted |
4.037,52 |
|
Notes |
Dicho importe corresponde al aplicado a
pérdidas y ganancias. |
|
Entity |
FUNDACION PARA LA FORMACION CONTINUA DE
EMPLEO |
|
Subsidy Concept |
Subvencion de explotación |
|
Status |
CONCEDIDA |
|
Amount Granted |
3.900,90 |
|
Entity |
FUNDACION PARA LA FORMACION CONTINUA DE
EMPLEO |
|
Subsidy Concept |
Subvencion de explotación |
|
Status |
CONCEDIDA |
|
Amount Granted |
3.251,70 |
|
Entity |
FUNDACION PARA LA FORMACION CONTINUA DE
EMPLEO |
|
Subsidy Concept |
Subvencion de explotación |
|
Status |
CONCEDIDA |
|
Amount Granted |
10.574,95 |
|
Entity |
ORGANISMO NO ESPECIFICADO |
|
Subsidy Concept |
Subvención de capital |
|
Status |
CONCEDIDA |
|
Amount Granted |
10.000,00 |
|
Entity |
ORGANISMO NO ESPECIFICADO. |
|
Subsidy Concept |
subvencion de capital |
|
Status |
CONCEDIDA |
|
Amount Granted |
10.000,00 |
|
Entity |
ORGANISMO NO ESPECIFICADO |
|
Subsidy Concept |
Subvención de explotación. |
|
Status |
CONCEDIDA |
|
Amount Granted |
239,49 |
|
Entity |
ORGANISMO NO ESPECIFICADO |
|
Subsidy Concept |
Subvención de explotación. |
|
Status |
CONCEDIDA |
|
Amount Granted |
7.464,51 |
|
Entity |
ORGANISMO NO ESPECIFICADO |
|
Subsidy Concept |
Subvención de explotación. |
|
Status |
CONCEDIDA |
|
Amount Granted |
19.511,90 |
Research
Summary
|
|
The subject was incorporated in 1974 and
is engaged in the manufacture and sale of textile machinery. It operates at
the national and international level. There are no negative comments made
upon the subject, according to the consulted sources of reference. Having the
above-mentioned into account, credit operations can be envisioned under
normal terms. |
Sources
|
|
Registry of Commerce's Official Gazette.
Own and external data bases Company References |
FOREIGN EXCHANGE RATES
|
Currency |
Unit
|
Indian Rupees |
|
US Dollar |
1 |
INR 64.36 |
|
|
1 |
INR 89.71 |
|
Euro |
1 |
INR 78.89 |
|
EURO |
1 |
INR 78.95 |
Note :
Above are approximate rates obtained from sources believed to be correct
INFORMATION DETAILS
|
Analysis Done by
: |
VAR |
|
|
|
|
Report Prepared
by : |
DNS |
RATING EXPLANATIONS
|
Credit Rating |
Explanation |
Rating Comments |
|
A++ |
Minimum Risk |
Business dealings permissible with minimum
risk of default |
|
A+ |
Low Risk |
Business dealings permissible with low risk
of default |
|
A |
Acceptable Risk |
Business dealings permissible with
moderate risk of default |
|
B |
Medium Risk |
Business dealings permissible on a regular
monitoring basis |
|
C |
Medium High Risk |
Business dealings permissible preferably on
secured basis |
|
D |
High Risk |
Business dealing not recommended or on
secured terms only |
|
NB |
New Business |
No recommendation can be done due to
business in infancy stage |
|
NT |
No Trace |
No recommendation can be done as the
business is not traceable |
NB is stated where there is insufficient information to facilitate rating. However, it is not to be considered as unfavourable.
This score
serves as a reference to assess SC’s credit risk and to set the amount of
credit to be extended. It is calculated from a composite of weighted scores
obtained from each of the major sections of this report. The assessed factors
are as follows:
·
Financial
condition covering various ratios
·
Company
background and operations size
·
Promoters
/ Management background
·
Payment
record
·
Litigation
against the subject
·
Industry
scenario / competitor analysis
·
Supplier
/ Customer / Banker review (wherever available)
This report is issued at
your request without any risk and responsibility on the part of MIRA INFORM
PRIVATE LIMITED (MIPL) or its officials.