|
|
|


MIRA INFORM REPORT
|
Report No. : |
489814 |
|
Report Date : |
13.02.2018 |
IDENTIFICATION DETAILS
|
Name : |
GRUPO AVINTIA SL |
|
|
|
|
Registered Office : |
C/ Emisora, 20. - Pozuelo De Alarcon - 28224 - Madrid |
|
|
|
|
Country : |
Spain |
|
|
|
|
Financials (as on) : |
2016 |
|
|
|
|
Date of Incorporation : |
17.06.2010 |
|
|
|
|
Legal Form : |
Private company |
|
|
|
|
Line of Business : |
Activities of holding companies |
|
|
|
|
No. of Employees : |
50 |
RATING & COMMENTS
(Mira Inform has adopted New Rating mechanism w.e.f. 23rd
January 2017)
|
MIRA’s Rating : |
C |
|
Credit Rating |
Explanation |
Rating Comments |
|
C |
Medium High Risk |
Business dealings permissible preferably
on secured basis |
|
Status : |
Activities of holding companies |
|
|
|
|
Payment Behaviour : |
Unknown |
|
|
|
|
Litigation : |
Clear |
NOTES :
Any query related to this report can be made
on e-mail : infodept@mirainform.com
while quoting report number, name and date.
ECGC Country Risk Classification List
|
Country Name |
Previous Rating (30.06.2017) |
Current Rating (30.09.2017) |
|
Spain |
A1 |
A1 |
|
Risk Category |
ECGC
Classification |
|
Insignificant |
A1 |
|
Low Risk |
A2 |
|
Moderately Low Risk |
B1 |
|
Moderate Risk |
B2 |
|
Moderately High Risk |
C1 |
|
High Risk |
C2 |
|
Very High Risk |
D |
SPAIN - ECONOMIC OVERVIEW
After experiencing a prolonged recession in the wake of the global financial crisis that began in 2008, in 2017 Spain marked the fourth full year of positive economic growth in ten years, largely due to increased private consumption. At the onset of the financial crisis, Spain's GDP contracted by 3.7% in 2009, ending a 16-year growth trend, and continued contracting through most of 2013. In that year, the government successfully shored up struggling banks - exposed to the collapse of Spain's depressed real estate and construction sectors - and in January 2014 completed an EU-funded restructuring and recapitalization program for its financial sector.
Until 2014, credit contraction in the private sector, fiscal austerity, and high unemployment weighed on domestic consumption and investment. The unemployment rate rose from a low of about 8% in 2007 to more than 26% in 2013, but labor reforms prompted a modest reduction to 17% in 2017. High unemployment has strained Spain's public finances, as spending on social benefits increased while tax revenues fell. Spain’s budget deficit peaked at 11.4% of GDP in 2010, but Spain gradually reduced the deficit to about 3.3% of GDP in 2017. Public debt has increased substantially – from 60.1% of GDP in 2010 to nearly 96.7% in 2017.
Exports were resilient throughout the economic downturn and helped to bring Spain's current account into surplus in 2013 for the first time since 1986, where it remained through 2016. Rising labor productivity and an internal devaluation resulting from moderating labor costs and lower inflation have helped to improve foreign investor interest in the economy and positive FDI flows have been restored.
Political gridlock after the national elections in December 2015 and June 2016 and ensuing government formation process constrained the caretaker government’s ability to implement needed labor, pension, health care, tax, and education reforms— in 2016. The European Commission criticized Spain’s 2016 budget for easing austerity measures and for its alleged overly optimistic growth and deficit projections. Spain’s borrowing costs are dramatically lower since their peak in mid-2012, and with the recent uptick in economic activity, inflation has reappeared, at 2% per year.
|
Source
: CIA |
|
EXECUTIVE
SUMMARY
|
|
|
|
|
|
Name: |
GRUPO AVINTIA SL |
|
NIF / Fiscal code: |
B85984235 |
|
Status: |
ACTIVE |
|
Incorporation Date: |
17/06/2010 |
|
Register Data |
Register Section 8 Sheet 501998 |
|
Last Publication in
BORME: |
23/01/2017 [Appointments] |
|
Last Published Account Deposit: |
2016 |
|
Share Capital: |
259.779 |
|
|
|
|
Localization: |
C/ EMISORA, 20. - POZUELO DE ALARCON - 28224 - MADRID |
|
Telephone - Fax - Email - Website: |
Telephone. 915 122 711 Email. info@grupoavintia.com Website.
www.grupoavintia.com |
|
|
|
|
Activity: |
|
|
NACE: |
6420 - Activities of holding companies |
|
Registered Trademarks: |
|
|
Audited / Opinion: |
Si / |
|
Tenders and Awards: |
|
|
Subsidies: |
0 for a total cost of 0 |
|
Quality Certificate: |
No |
|
|
|
|
Payment Behaviour: |
According to the agreed terms |
|
Prospects: |
Consolidation |
|
Industry situation: |
Maturity |
|
|
|
|
Defaults, Legal Claims
and Insolvency Proceedings : |
|
|
|
|
|
|
|
Number |
Amount (€) |
Most Recent Entry |
|
Insolvency Proceedings, Bankruptcy and Suspension of Payments |
|
Unpublished |
--- |
--- |
|
Defaults on debt with Financial Institutions and Large Companies |
|
5 |
1.118,92 |
--- |
|
Judicial Claims (Notices, Executive Proceedings, Attachments,
Auctions, Bad Debt) |
|
None |
0 |
--- |
|
Proceedings heard by the Civil Court |
|
2 |
0 |
--- |
|
Proceedings heard by the Labour Court |
|
Unpublished |
0 |
--- |
|
|
|
Partners: |
|
|
|
PATRIMONIOS JIVAR 2000 SL |
100 % |
|
|
Shares: |
34 |
|
|
Other Links: |
26 |
|
|
No. of Active Corporate Bodies: |
CHIEF EXECUTIVE OFFICER 1 |
|
|
Ratios |
2016 |
2015 |
Change |
|
|
Nº of employees: |
50 |
|
|
|
|
|
|
|
Guarantees: |
|
|
Properties Registered: |
Company NO, Administrator NO |
|
Financing / Guarantee Sources : |
Sources NO, Guarantees NO |
|
|
|
|
|
|
|
INVESTIGATION SUMMARY |
|
|
The subject was incorporated in 2010 and is engaged in the
holding activities within the so-called 'GRUPO AVINTIA' The 'Grupo Avintia',
apart from being a construction company, is a comprehensive services platform
that manages and control all the real estate cycle, from the land development
to the real estate management. It operates mainly at the national level.
There are no negative comments made upon the subject, according to the
consulted sources. Having into account all the above-mentioned, credit
operations can be envisioned under normal terms. |
|
|
Interviewed Person: |
|
|
Enquiry
Details
|
Identification
|
|
|
Social Denomination: |
GRUPO AVINTIA SL |
|
NIF / Fiscal code: |
B85984235 |
|
Corporate Status: |
ACTIVE |
|
Start of activity: |
2010 |
|
Registered Office: |
C/ EMISORA, 20. |
|
Locality: |
POZUELO DE ALARCON |
|
Province: |
MADRID |
|
Postal Code: |
28224 |
|
Telephone: |
915 122 711 |
|
Website: |
www.grupoavintia.com |
|
Email: |
info@grupoavintia.com |
|
Interviewed Person: |
The information in this report has been gathered through indirect sources due to the refusal of the company's responsible people to collaborate. |
|
Branch
Offices
|
|
Activity
|
|
|
NACE: |
6420 |
|
Corporate Purpose: |
The subject is
engaged in hiring, exploiting, managing, promoting and preserving all sorts
of public and private works. |
|
Additional Information: |
The subject belongs
to the so-called 'GRUPO AVINTIA' and is engaged in the holding actitivites.
The 'Grupo Avintia' is, apart from a construction company, a comprehensive
services platform that manages and control all the real estate cycle, from
the land development to the real estate management. |
|
Additional Address: |
The Registered
Office and offices are located at the heading address. |
|
Franchise: |
No |
|
Import / export: |
DOES NOT
IMPORT / DOES NOT EXPORT |
|
Future Perspective: |
Consolidation |
|
Industry situation: |
Maturity |
|
Number
of Employees
|
|
|
|
|
|
|
Year |
No. of employees |
Established |
Incidentals |
|
|
|
2016 |
50 |
|
|
|
The data of employees is from the latest available financial statements in. Failing that, are estimates data calculated by statistical methods
|
Chronological
Summary
|
|||
|
|
|
|
|
|
|
Year |
Act |
|
|
|
2010 |
Appointments/ Re-elections (2) Company Formation (1) |
|
|
|
2011 |
Appointments/ Re-elections (2) |
|
|
|
2012 |
Accounts deposit (year 2010, 2011) |
|
|
|
2013 |
Accounts deposit (year 2012) Appointments/ Re-elections
(3) Cessations/ Resignations/ Reversals (2) |
|
|
|
2014 |
Accounts deposit (year 2013) Appointments/ Re-elections
(1) Capital Reduction (1) Increase of Capital (1) Statutory Modifications (1) |
|
|
|
2015 |
Accounts deposit (year 2014 consolidated, 2014)
Appointments/ Re-elections (1) |
|
|
|
2016 |
Accounts deposit (year 2015 consolidated, 2015)
Appointments/ Re-elections (4) Cessations/ Resignations/ Reversals (2) Change
of Social address (1) Declaration of Sole Propietorship (1) |
|
|
|
2017 |
Accounts deposit (year 2016 consolidated) Appointments/
Re-elections (1) |
|
|
|
2018 |
Accounts deposit (year 2016) |
|
|
Breakdown
of Owners' Equity
|
|
|
Registered Capital: |
259.779 |
|
Paid up capital: |
259.779 |
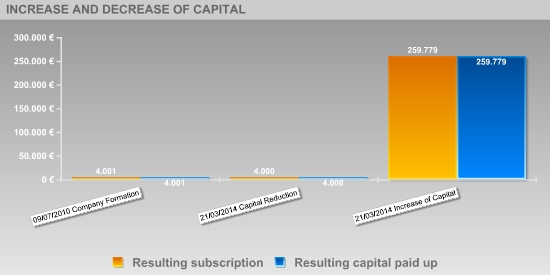
Updated
Evolution of the Subscribed and Paid-in Capital
|
|||||
|
|
|||||
|
|
|
|
|
|
|
|
Publishing Date |
Registration Type |
Capital Subscribed |
Paid up capital |
Underwritten result |
Disbursed Result |
|
09/07/2010 |
Company Formation |
4.001 |
4.001 |
4.001 |
4.001 |
|
21/03/2014 |
Capital Reduction |
-1 |
-1 |
4.000 |
4.000 |
|
21/03/2014 |
Increase of Capital |
255.779 |
255.779 |
259.779 |
259.779 |
|
Active
Social Bodies
|
|
|
|
|
|
Post published |
Social Body's Name |
Appointment Date |
Other Positions in this Company |
|
SINGLE PARTNER |
PATRIMONIOS JIVAR 2000 SL |
08/03/2016 |
2 |
|
PRESIDENT |
MARTIN JIMENEZ ANTONIO |
09/07/2010 |
4 |
|
MEMBER OF THE BOARD |
MARTIN JIMENEZ ANTONIO |
09/07/2010 |
4 |
|
|
PATRIMONIOS JIVAR 2000 SL |
09/07/2010 |
2 |
|
JOINT ATTORNEY/COMBINED PROXY |
GARCIA ACEBEDO ALFONSO JESUS |
27/05/2013 |
1 |
|
PROXY |
ORTIZ BLANCO JOSE |
16/01/2017 |
4 |
|
|
PEREZ RAMOS JOSE |
16/01/2017 |
9 |
|
|
GARCIA ACEVEDO ALONSO JESUS |
16/01/2017 |
5 |
|
|
AMIGO GOMEZ LUIS JOSE |
28/11/2016 |
2 |
|
CHIEF EXECUTIVE OFFICER |
MARTIN JIMENEZ ANTONIO |
09/07/2010 |
4 |
|
SECRETARY |
PEREZ RAMOS JOSE |
08/03/2016 |
9 |
|
REPRESENTATIVE |
MARTIN JIMENEZ ANTONIO |
09/07/2010 |
4 |
|
CONSOLIDATED ACCOUNTS' AUDITOR |
PRICEWATERHOUSECOOPERS AUDITORES SL |
10/04/2015 |
1 |
|
Historical
Social Bodies
|
|
|
|
|
|
Social Body's Name |
Post published |
End Date |
Other Positions in this Company |
|
AMIGO GOMEZ LUIS JOSE |
JOINT ATTORNEY/COMBINED PROXY |
28/11/2016 |
2 |
|
GARCIA ACEBEDO ALONSO JESUS |
JOINT ATTORNEY/COMBINED PROXY |
08/03/2016 |
1 |
|
GARCIA ACEVEDO ALONSO JESUS |
MEMBER OF THE BOARD |
08/03/2016 |
5 |
|
|
JOINT ATTORNEY |
08/03/2016 |
|
|
|
SECRETARY |
08/03/2016 |
|
|
|
JOINT ATTORNEY/COMBINED PROXY |
27/05/2013 |
|
|
ORTIZ BLANCO JOSE |
PROXY |
27/05/2013 |
4 |
|
|
JOINT ATTORNEY |
16/01/2017 |
|
|
|
JOINT ATTORNEY/COMBINED PROXY |
22/04/2014 |
|
|
PEREZ RAMOS JOSE |
MEMBER OF THE BOARD |
08/03/2016 |
9 |
|
|
PROXY |
22/04/2014 |
|
|
|
PROXY |
16/01/2017 |
|
|
|
JOINT ATTORNEY |
30/05/2016 |
|
|
|
JOINT ATTORNEY/COMBINED PROXY |
27/05/2013 |
|
|
|
JOINT ATTORNEY/COMBINED PROXY |
27/05/2013 |
|
|
|
JOINT ATTORNEY/COMBINED PROXY |
09/08/2013 |
|
|
PLAZA RUIZ JORGE |
PROXY |
27/05/2013 |
1 |
|
Executive
board
|
||
|
|
|
|
|
Post |
NIF |
Name |
|
CHIEF BUYER |
|
ALBERTO ESCOLAR |
Defaults,
Legal Claims and Insolvency Proceedings
|
|
|
|
|
Section enabling assessment of the degree of compliance of
the company queried with its payment obligations. It provides information on the
existence and nature of all stages of Insolvency and Legal Proceedings
published with reference to the Company in the country's various Official
Bulletins and national newspapers, as well Defaults Registered in the main
national credit bureaus (ASNEF Industrial and RAI ).
> Summary
Chronological summary
|
|
|
Number of Publications |
Amount (€) |
Start date |
End date |
|
Insolvency Proceedings, Bankruptcy and Suspension of Payments |
|
Unpublished |
--- |
--- |
--- |
|
Request/Declaration |
|
0 |
--- |
date |
|
|
Proceedings |
|
--- |
--- |
|
--- |
|
Resolution |
|
--- |
--- |
|
--- |
|
Defaults on debt with Financial Institutions and Large Companies |
Bank and Commercial Delinquency |
5 |
0 |
22/08/2015 |
09/02/2018 |
|
Status: Friendly |
|
1 |
217.52 |
22/08/2015 |
22/08/2015 |
|
Status: Pre-Litigation |
|
--- |
|
|
|
|
Status: Litigation |
|
--- |
|
|
|
|
Status: Non-performing |
|
--- |
|
|
|
|
Status: insolvency proceedings, bankruptcy and suspension of
payments |
|
--- |
|
|
|
|
Other status |
|
4 |
|
|
|
|
Legal and Administrative Proceedings |
|
Unpublished |
--- |
|
|
|
Notices of defaults and enforcement |
|
--- |
--- |
|
--- |
|
Seizures |
|
--- |
--- |
|
--- |
|
Auctions |
|
--- |
--- |
|
--- |
|
Declarations of insolvency and bad debt |
|
--- |
--- |
|
--- |
|
Proceedings heard by the Civil Court |
|
2 |
--- |
27/02/2017 |
16/11/2017 |
|
Proceedings heard by the Labour Court |
|
Unpublished |
--- |
|
|
> Details
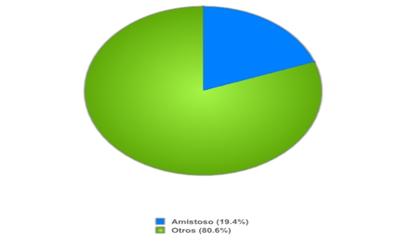
IMPAGOS EN ENTIDADES FINANCIERAS Y GRANDES EMPRESAS
Section comprising a list of the instances of default
recorded in the ASNEF Industrial file under the name of .
|
20.00% of contract defaults, which represent 19.44% of the
amount, are in amicable debt collection status; the creditor entities have
not initiated legal action for recovery. The total unpaid amount registered with ASNEF Empresas is
the maximum one among all of this debtor's reported defaults available. Highlight that the Company has payment defaults older than
twelve months. |
List of current instances of default for each of the transactions
in progress
|
Type of creditor |
Product |
Value of transactions (€) |
Status |
No. of defaults |
Default balance (€) |
Date of first default |
Date of last default |
|
INDUSTRIA |
Otros |
661.76 |
Otros |
--- |
661.76 |
22/10/15 |
22/10/15 |
|
INDUSTRIA |
Otros |
217.52 |
Amistoso |
--- |
217.52 |
22/08/15 |
22/08/15 |
|
INDUSTRIA |
Otros |
101.48 |
Otros |
--- |
101.48 |
22/12/15 |
22/12/15 |
|
INDUSTRIA |
Otros |
94.94 |
Otros |
--- |
94.94 |
16/12/15 |
16/12/15 |
|
INDUSTRIA |
Otros |
43.22 |
Otros |
--- |
43.22 |
16/02/16 |
16/02/16 |
|
|
|
1.118,92 |
|
|
|
||
|
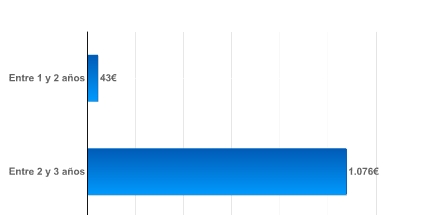
Default by status
|
|
|
Age of current debt
|
|
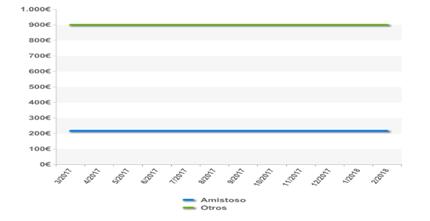
Change in values of defaults and settled debts
|
Changes in defaults by status
|
Changes in defaults by product |
|
Change in values of defaults and settled debts
|
Legal Notice:
This data has been obtained from consultation of the ASNEF
Industrial register. It may only be used for the purposes of awarding credit,
monitoring credit and managing loans. This data may not be reused or included
in any database, and may not be ceded .
Basis for
scoring
|
Positive
Factors |
Adverse
Factors |
|
|
|
|
Result
of query submitted to the R.A.I. (Spanish Bad Debt Register) on
|
LEGAL
CLAIMS
|
|
Summary of Judicial Claims |
|
|
|
|
|
|
|
|
||
|
|
|
Not published |
|
|
|
|
Not published |
|
|
|
|
||
|
|
|
Not published |
|
|
|
|
Not published |
|
|
|
|
Not published |
|
|
|
|
Not published |
|
|
|
|
||
|
|
|
2 Legal Claims for a total cost of 830,00 E |
|
|
|
|
Not published |
|
|
|
|
||
|
|
|
Not published |
|
|
Incidences Detailed |
|
Procedures by the Civil Procedural Law 1/2000 |
|
|
|
Last Published Stage: |
SENTENCE |
|
Record Number: |
342/2017 |
|
Amount of the incidence: |
829,74 E |
|
Requested by: |
LEOPOLDO RICO SANCHEZ |
|
Published domicile: |
MOSTOLES (MADRID) |
|
Source: |
BOLETIN OFICIAL DE LA COMUNIDAD DE MADRID Nº295, 2017 PAGINA 336 |
|
|
|
Last Published Stage: |
COURT SUMMONS |
|
Record Number: |
798/2016 |
|
Requested by: |
BALTASAR TORRES GARCIA |
|
Published domicile: |
ALBACETE |
|
Source: |
BOLETIN OFICIAL DE LA COMUNIDAD DE MADRID Nº68, 2017 PAGINA 337 |
|
Guarantees
|
|
References |
|
|
|
|
|
Link
List
|
|
|
|
|
|
PARTICIPATES
IN: |
34 Entities |
|
SHAREHOLDERS: |
1 Entities |
|
BELONGS TO THE
ADMINISTRATION BOARD OF: |
14 Entities |
|
HAS IN ITS
ADMINISTRATION BOARD TO: |
1 Entities |
|
IS RELATED
WITH: |
11 Entities |
>
Shareholders
|
Relationship |
Entity |
Province |
Shareholding
stake |
|
SHAREHOLDERS |
PATRIMONIOS JIVAR
2000 SL |
MADRID |
100 |
|
PARTICIPATES
IN |
AVINTIA
PROYECTOS Y CONSTRUCCIONES SL |
MADRID |
90 |
|
|
BRICK O'CLOCK
SL |
MADRID |
100 |
|
|
AVINTIA
DESARROLLOS INMOBILIARIOS SL |
MADRID |
100 |
|
|
AVINTIA GRUPO
HOTELERO SL |
MADRID |
100 |
|
|
AVINTIA
EMPRESAS LEVANTE SL |
MADRID |
100 |
|
|
AVINTIA
TERCIARIO SL |
MADRID |
100 |
|
|
AVINTIA
ACTIVOS PATRIMONIALES SL |
MADRID |
100 |
|
|
AVINTIA
INTERNATIONAL SL |
MADRID |
100 |
|
|
BALTERPLAN SL |
MADRID |
|
|
|
AVINTIA
DESARROLLOS HOTELEROS SL |
MADRID |
100 |
|
|
AVINTIA
DESARROLLOS HOTELEROS SUR SL |
MADRID |
|
|
|
AVINFORMA
SERVICIOS INFORMATICOS SL |
MADRID |
100 |
|
|
ACTIVOS
SINGULARES HOTELEROS SL |
MADRID |
100 |
|
|
AVIFERCO SAS
(COLOMBIA) |
|
|
|
|
AVINTIA RACING
TEAM, S.L. |
|
50 |
|
|
AVORA SAS
(COLOMBIA) |
|
|
|
|
INDIPSA PERU
SAC |
|
|
|
|
TERBAL 2014,
S.L. |
|
|
|
|
UNION TEMPORAL
DE EMPRESAS FRACOS |
|
50 |
|
|
UNION TEMPORAL
DE EMPRESAS SEVILLAS LA NUEVA |
|
85 |
|
|
VIVIENDAS Y
SOLUCIONES, S.L. |
|
|
|
|
MINDELO
DIRECTORSHIP SL |
MADRID |
|
|
|
ACTA DE DISEÑO
Y GESTION URBANO, SOCIEDAD ANONIMA, C (PERU) |
|
|
|
|
AVINTIA
DESARROLLOS HOTELEROS ISLANTIL |
|
|
|
|
AVINTIA
EMPRESAS SL |
MADRID |
100 |
|
|
CAAF
CONSTRUCTORA COLOMBIA |
|
|
|
|
DNA REAL
ESTATE LUXURY SOLUTIONS SL |
BARCELONA |
|
|
|
GENARLAR
INMUEBLES, S.L. |
|
|
|
|
POSNOVA
INMUEBLES |
|
|
|
|
UNION TEMPORAL
DE EMPRESAS MISASIERRA |
|
50 |
|
|
AVINTIA PERU
SAC (PERU) |
|
|
|
|
DESARROLLOS
SOVEFIN 6, S.L. |
|
|
|
|
RETIRO DE
INMUEBLES, S.L. |
|
|
|
|
UNION TEMPORAL
DE EMPRESAS LEGATEC |
|
50 |
> Other
relationships
|
Relationship |
Entity |
Province |
Shareholding
stake |
|
IS RELATED
WITH |
| | |
|
|
|
|
ACTIVOS
SINGULARES HOTELEROS SL |
MADRID |
|
|
|
AVINFORMA
SERVICIOS INFORMATICOS SL |
MADRID |
|
|
|
AVINTIA
EMPRESAS SL |
MADRID |
|
|
|
AVINTIA
EUSKADI SOCIEDAD LIMITADA |
VIZCAYA |
|
|
|
DELFOS ACTIVOS
INMOBILIARIOS SOCIMI SA |
MADRID |
|
|
IS RELATED
WITH |
AELCA
DESARROLLOS INMOBILIARIOS SL |
MADRID |
|
|
|
AVINTIA
INTERNATIONAL SL |
MADRID |
|
|
|
AVINTIA
DESARROLLOS HOTELEROS SL |
MADRID |
|
|
|
AVINTIA
EMPRESAS SL |
MADRID |
|
|
|
VESTIS URBANA
SL |
MADRID |
|
|
|
ABAN
DESARROLLOS INMOBILIARIOS SL |
MADRID |
|
|
HAS IN ITS
ADMINISTRATION BOARD TO |
PATRIMONIOS
JIVAR 2000 SL |
MADRID |
|
|
|
AVINTIA GRUPO
HOTELERO SL |
MADRID |
|
|
|
AVINTIA
EMPRESAS LEVANTE SL |
MADRID |
|
|
|
AVINTIA
TERCIARIO SL |
MADRID |
|
|
|
AVINTIA
ACTIVOS PATRIMONIALES SL |
MADRID |
|
|
|
AVINTIA
EUSKADI SOCIEDAD LIMITADA |
VIZCAYA |
|
|
|
AVINTIA
EMPRESAS SL |
MADRID |
|
|
|
ACTIVOS
SINGULARES HOTELEROS SL |
MADRID |
|
|
|
AVINFORMA
SERVICIOS INFORMATICOS SL |
MADRID |
|
|
|
AVINTIA
DESARROLLOS HOTELEROS SL |
MADRID |
|
|
BELONGS TO THE
ADMINISTRATION BOARD OF |
AVINTIA
INFRAESTRUCTURAS SA |
MADRID |
|
|
|
AVINTIA RACING
SL |
MADRID |
|
|
|
BRICK O'CLOCK
SL |
MADRID |
|
|
|
AVINTIA DESARROLLOS
INMOBILIARIOS SL |
MADRID |
|
|
|
AVINTIA
INTERNATIONAL SL |
MADRID |
|
|
Turnover
|
|
|
Total Sales 2016 |
3.309.317,32 |
The sales data
is from the latest available financial statements in. Failing that, are estimates
data calculated by statistical methods.
|
Estimated
Balance
|
|
Given the
features of the subject at matter, we cannot include any accounts in this
section. |
|
Financial
Accounts and Balance Sheets
|
|
|
|
|
|
Ejercicio |
Tipo de Cuentas Anuales |
Fecha Presentacion |
|
2016 |
Consolidadas |
October 2017 |
|
2016 |
Normales |
January 2018 |
|
2015 |
Consolidadas |
December 2016 |
|
2015 |
Normales |
October 2016 |
|
2014 |
Consolidadas |
October 2015 |
|
2014 |
Normales |
September 2015 |
|
2013 |
Normales |
September 2014 |
|
2012 |
Normales |
November 2013 |
|
2011 |
Normales |
October 2012 |
|
2010 |
Normales |
January 2012 |
The data in the report regarding
the last Company Accounts submitted by the company is taken from the TRADE
REGISTER serving the region in which the company's address is located
31/12/2016
> Balance en formato Abreviado de acuerdo al Nuevo Plan
General Contable 2007
Information
corresponding to the fiscal year
2016 2015 2014 2013 2012 is taken from information
submitted to the TRADE REGISTER. Data corresponding to fiscal years before
2016 2015 2014 2013 2012 has been compiled based on
the equivalence criteria stipulated in Act JUS/206/2009. Where the provisions
of the Act did not establish relevant equivalence criteria, To view details on
the methodology.
|
|
ORIGINAL |
ORIGINAL |
ORIGINAL |
ORIGINAL |
ORIGINAL |
|
|
Assets |
2016 |
2015 |
2014 |
2013 |
2012 |
|
|
A) NON-CURRENT ASSETS: 11000 |
19.654.488,00 |
18.224.925,00 |
12.451.579,00 |
8.843.300,00 |
6.327.800,00 |
|
|
I. Intangible fixed assets : 11100 |
1.427.650,00 |
9.673,00 |
0,00 |
0,00 |
0,00 |
|
|
II. Tangible fixed assets : 11200 |
296.570,00 |
1.231.500,00 |
0,00 |
1.166.500,00 |
1.166.500,00 |
|
|
III. Real estate investment: 11300 |
1.166.500,00 |
0,00 |
1.166.500,00 |
0,00 |
0,00 |
|
|
IV. Long-term investments in Group
companies and associates : 11400 |
16.665.252,00 |
16.983.752,00 |
11.285.079,00 |
7.676.800,00 |
5.161.300,00 |
|
|
V. Long-term financial investments:
11500 |
98.516,00 |
0,00 |
0,00 |
0,00 |
0,00 |
|
|
VI. Assets for deferred tax : 11600 |
0,00 |
0,00 |
0,00 |
0,00 |
0,00 |
|
|
VII. Non-current trade debtors :
11700 |
0,00 |
0,00 |
0,00 |
0,00 |
0,00 |
|
|
B) CURRENT ASSETS: 12000 |
2.896.028,00 |
976.882,00 |
1.112.088,00 |
994.188,00 |
1.051.929,00 |
|
|
I. Non-current assets held for sale :
12100 |
0,00 |
0,00 |
0,00 |
0,00 |
0,00 |
|
|
II. Stocks: 12200 |
45.819,00 |
283.237,00 |
408.377,00 |
408.377,00 |
408.377,00 |
|
|
III. Trade debtors and others receivable
accounts: 12300 |
2.707.943,00 |
543.221,00 |
573.732,00 |
436.100,00 |
55.911,00 |
|
|
1.- Customers for
sales and provisions of services : 12380 |
2.702.968,00 |
538.325,00 |
572.733,00 |
436.100,00 |
55.911,00 |
|
|
a) Long-term receivables from sales and services supplied : 12381 |
0,00 |
0,00 |
0,00 |
0,00 |
0,00 |
|
|
b) Customers for sales and provisions of services : 12382 |
2.702.968,00 |
538.325,00 |
572.733,00 |
436.100,00 |
55.911,00 |
|
|
2.- Called up share
capital : 12370 |
0,00 |
0,00 |
0,00 |
0,00 |
0,00 |
|
|
3.- Other accounts
receivable : 12390 |
4.974,00 |
4.897,00 |
999,00 |
0,00 |
0,00 |
|
|
IV. Short-term investments in Group
companies and associates: 12400 |
3.537,00 |
11.842,00 |
0,00 |
0,00 |
316,00 |
|
|
V. Short-term financial investments :
12500 |
20.311,00 |
0,00 |
5.842,00 |
2.809,00 |
0,00 |
|
|
VI. Short-term accruals: 12600 |
0,00 |
0,00 |
0,00 |
0,00 |
0,00 |
|
|
VII. Cash and other equivalent liquid
assets : 12700 |
118.417,00 |
138.581,00 |
124.136,00 |
146.902,00 |
587.324,00 |
|
|
TOTAL ASSETS (A + B) : 10000 |
22.550.515,00 |
19.201.807,00 |
13.563.667,00 |
9.837.488,00 |
7.379.729,00 |
|
|
|
ORIGINAL |
ORIGINAL |
ORIGINAL |
ORIGINAL |
ORIGINAL |
|
|
Liabilities and Net Worth |
2016 |
2015 |
2014 |
2013 |
2012 |
|
|
A) NET WORTH: 20000 |
8.674.970,00 |
8.664.820,00 |
3.498.626,00 |
88.244,00 |
57.161,00 |
|
|
A1) Shareholders' equity :
21000 |
8.674.970,00 |
8.664.820,00 |
3.498.626,00 |
88.244,00 |
57.161,00 |
|
|
I. Capital:
21100 |
259.779,00 |
259.779,00 |
259.779,00 |
4.001,00 |
4.001,00 |
|
|
1.- Registered capital: 21110 |
259.779,00 |
259.779,00 |
259.779,00 |
4.001,00 |
4.001,00 |
|
|
2.-
(Uncalled capital) : 21120 |
0,00 |
0,00 |
0,00 |
0,00 |
0,00 |
|
|
II. Share premium:
21200 |
3.137.501,00 |
3.137.501,00 |
3.137.501,00 |
0,00 |
0,00 |
|
|
III. Reserves:
21300 |
5.267.539,00 |
101.346,00 |
84.243,00 |
53.160,00 |
18.211,00 |
|
|
1. Capitalisation Reserves: 21350 |
0,00 |
0,00 |
0,00 |
0,00 |
0,00 |
|
|
2. Otras Reservas: 21360 |
5.267.539,00 |
0,00 |
0,00 |
0,00 |
0,00 |
|
|
IV. (Common stock
equity): 21400 |
0,00 |
0,00 |
0,00 |
0,00 |
0,00 |
|
|
V. Profit or loss
brought forward: 21500 |
0,00 |
0,00 |
0,00 |
0,00 |
0,00 |
|
|
VI. Other
shareholders' contributions: 21600 |
0,00 |
0,00 |
0,00 |
0,00 |
0,00 |
|
|
VII. Result of the
period: 21700 |
15.120.850,00 |
6.166.193,00 |
17.103,00 |
31.082,00 |
34.950,00 |
|
|
VIII. (Interim
dividend): 21800 |
-15.110.700,00 |
-1.000.000,00 |
0,00 |
0,00 |
0,00 |
|
|
IX. Other net worth
instruments: 21900 |
0,00 |
0,00 |
0,00 |
0,00 |
0,00 |
|
|
A-2) Adjustments due to changes in value:
22000 |
0,00 |
0,00 |
0,00 |
0,00 |
0,00 |
|
|
A-3) Received subsidies, donations and
legacies: 23000 |
0,00 |
0,00 |
0,00 |
0,00 |
0,00 |
|
|
B) NON-CURRENT LIABILITIES: 31000 |
10.357.900,00 |
9.844.337,00 |
9.554.542,00 |
9.326.262,00 |
401.772,00 |
|
|
I. Long-term provisions: 31100 |
0,00 |
0,00 |
0,00 |
0,00 |
0,00 |
|
|
II. Long-term creditors : 31200 |
0,00 |
0,00 |
52.122,00 |
203.724,00 |
401.772,00 |
|
|
1.- Amounts owed to
credit institutions: 31220 |
0,00 |
0,00 |
52.122,00 |
203.724,00 |
401.772,00 |
|
|
2.- Creditors from
financial leasing : 31230 |
0,00 |
0,00 |
0,00 |
0,00 |
0,00 |
|
|
3.- Other long-term
creditors : 31290 |
0,00 |
0,00 |
0,00 |
0,00 |
0,00 |
|
|
III. Long-term debts with Group companies
and associates: 31300 |
10.357.900,00 |
9.844.337,00 |
9.502.420,00 |
9.122.539,00 |
0,00 |
|
|
IV. Liabilities for deferred tax:
31400 |
0,00 |
0,00 |
0,00 |
0,00 |
0,00 |
|
|
V. Long-term accruals: 31500 |
0,00 |
0,00 |
0,00 |
0,00 |
0,00 |
|
|
VI. Non-current trade creditors :
31600 |
0,00 |
0,00 |
0,00 |
0,00 |
0,00 |
|
|
VII. Special long-term debts : 31700 |
0,00 |
0,00 |
0,00 |
0,00 |
0,00 |
|
|
C) CURRENT LIABILITIES : 32000 |
3.517.645,00 |
692.650,00 |
510.498,00 |
422.982,00 |
6.920.795,00 |
|
|
I. Liabilities linked to non-current assets
held for sale : 32100 |
0,00 |
0,00 |
0,00 |
0,00 |
0,00 |
|
|
II. Short-term provisions: 32200 |
0,00 |
0,00 |
0,00 |
0,00 |
0,00 |
|
|
III. Short-term creditors : 32300 |
0,00 |
0,00 |
146.609,00 |
200.014,00 |
236.595,00 |
|
|
1.- Amounts owed to
credit institutions: 32320 |
0,00 |
0,00 |
146.609,00 |
200.014,00 |
201.146,00 |
|
|
2.- Creditors from
financial leasing : 32330 |
0,00 |
0,00 |
0,00 |
0,00 |
0,00 |
|
|
3.- Other short-term
creditors : 32390 |
0,00 |
0,00 |
0,00 |
0,00 |
35.449,00 |
|
|
IV. Short-term debts with Group companies
and associates: 32400 |
373.504,00 |
127.743,00 |
7.326,00 |
688,00 |
6.492.864,00 |
|
|
V. Trade creditors and other accounts
payable: 32500 |
3.144.141,00 |
564.907,00 |
356.563,00 |
222.280,00 |
191.336,00 |
|
|
1.- Suppliers:
32580 |
2.972.574,00 |
333.811,00 |
63.547,00 |
18.297,00 |
1.430,00 |
|
|
a) Long-term debts : 32581 |
0,00 |
0,00 |
0,00 |
0,00 |
0,00 |
|
|
b)
Short-term debts : 32582 |
2.972.574,00 |
333.811,00 |
63.547,00 |
18.297,00 |
1.430,00 |
|
|
2.- Other creditors :
32590 |
171.568,00 |
231.096,00 |
293.016,00 |
203.983,00 |
189.907,00 |
|
|
VI. Short-term accruals: 32600 |
0,00 |
0,00 |
0,00 |
0,00 |
0,00 |
|
|
VII. Special short-term debts : 32700 |
0,00 |
0,00 |
0,00 |
0,00 |
0,00 |
|
|
TOTAL NET WORTH AND LIABILITIES (A + B + C) : 30000 |
22.550.515,00 |
19.201.807,00 |
13.563.667,00 |
9.837.488,00 |
7.379.729,00 |
|
|
|
ORIGINAL |
ORIGINAL |
ORIGINAL |
ORIGINAL |
ORIGINAL |
|
|
Profit and Loss |
2016 |
2015 |
2014 |
2013 |
2012 |
|
|
1. Net turnover: 40100 |
3.309.317,00 |
1.616.994,00 |
1.312.920,00 |
1.008.500,00 |
738.733,00 |
|
|
2. Changes in stocks of finished goods and
work in progress: 40200 |
0,00 |
0,00 |
0,00 |
0,00 |
0,00 |
|
|
3. Works carried out by the company for its
assets: 40300 |
0,00 |
0,00 |
0,00 |
0,00 |
0,00 |
|
|
4. Supplies : 40400 |
-131.300,00 |
0,00 |
-161,00 |
0,00 |
-1.211,00 |
|
|
5. Other operating income: 40500 |
630,00 |
24,00 |
0,00 |
0,00 |
0,00 |
|
|
6. Personnel costs: 40600 |
-1.458.714,00 |
-936.027,00 |
-791.505,00 |
-486.482,00 |
-420.738,00 |
|
|
7. Other operating costs: 40700 |
-1.367.456,00 |
-663.411,00 |
-106.791,00 |
-102.333,00 |
-15.499,00 |
|
|
8. Amortisation of fixed assets:
40800 |
-207.336,00 |
-2.227,00 |
0,00 |
0,00 |
0,00 |
|
|
9. Allocation of subsidies of non-financial
fixed assets and other: 40900 |
0,00 |
0,00 |
0,00 |
0,00 |
0,00 |
|
|
10. Excess provisions : 41000 |
0,00 |
0,00 |
0,00 |
0,00 |
0,00 |
|
|
11. Impairment and result of transfers of
fixed assets: 41100 |
0,00 |
-112.977,00 |
0,00 |
0,00 |
0,00 |
|
|
12. Negative difference in combined
businesses: 41200 |
0,00 |
0,00 |
0,00 |
0,00 |
0,00 |
|
|
13. Other results : 41300 |
0,00 |
0,00 |
0,00 |
0,00 |
0,00 |
|
|
A) OPERATING INCOME (1 + 2 + 3 + 4 + 5 + 6 + 7 + 8 + 9 + 10 + 11
+ 12 + 13) : 49100 |
145.141,00 |
-97.624,00 |
414.463,00 |
419.685,00 |
301.285,00 |
|
|
14. Financial income : 41400 |
15.110.730,00 |
1.000.196,00 |
96,00 |
2,00 |
1.939,00 |
|
|
a) Allocation of
financial subsidies, donations and legacies: 41430 |
0,00 |
0,00 |
0,00 |
0,00 |
0,00 |
|
|
b) Other financial
income: 41490 |
15.110.730,00 |
1.000.196,00 |
96,00 |
2,00 |
1.939,00 |
|
|
15. Financial expenditure: 41500 |
-135.020,00 |
-397.051,00 |
-390.126,00 |
-375.283,00 |
-253.296,00 |
|
|
16. Changes in fair value of financial
instruments : 41600 |
0,00 |
0,00 |
0,00 |
0,00 |
0,00 |
|
|
17. Exchange rate differences : 41700 |
0,00 |
0,00 |
0,00 |
0,00 |
0,00 |
|
|
18. Impairment and result for transfers of financial
instruments: 41800 |
0,00 |
5.660.672,00 |
0,00 |
0,00 |
0,00 |
|
|
19. Other financial income and expenditure:
42100 |
0,00 |
0,00 |
0,00 |
0,00 |
0,00 |
|
|
a) Incorporation of financial
expenditure to assets: 42110 |
0,00 |
0,00 |
0,00 |
0,00 |
0,00 |
|
|
b) Financial income
from arrangement with creditors: 42120 |
0,00 |
0,00 |
0,00 |
0,00 |
0,00 |
|
|
c) Other income and
expenditure: 42130 |
0,00 |
0,00 |
0,00 |
0,00 |
0,00 |
|
|
B) FINANCIAL REVENUE (14 + 15 + 16 + 17 + 18 + 19) : 49200 |
14.975.709,00 |
6.263.817,00 |
-390.029,00 |
-375.281,00 |
-251.357,00 |
|
|
C) NET RESULT BEFORE TAXES (A + B) : 49300 |
15.120.850,00 |
6.166.193,00 |
24.433,00 |
44.403,00 |
49.928,00 |
|
|
20. Income taxes: 41900 |
0,00 |
0,00 |
-7.330,00 |
-13.321,00 |
-14.978,00 |
|
|
D) RESULT OF THE PERIOD (C + 20) : 49500 |
15.120.850,00 |
6.166.193,00 |
17.103,00 |
31.082,00 |
34.950,00 |
|
|
CASHFLOW
STATEMENT
|
|
|
|
|
Model: Normal
> Source of information: Data contained in this section is
taken from the information declared in the Annual Accounts submitted to the
Trade Register.
|
Net Rights Granted |
2016 |
2015 |
2014 |
2013 |
2012 |
|
|
1. Fiscal year result before taxes.: 61100 |
15.120.850,00 |
6.166.193,00 |
24.433,00 |
44.403,00 |
49.928,00 |
|
|
2. Results adjustments.: 61200 |
-14.768.373,00 |
-600.918,00 |
390.029,00 |
375.281,00 |
251.357,00 |
|
|
a) Fixed Assets Amortization (+).: 61201 |
207.336,00 |
2.227,00 |
0,00 |
0,00 |
0,00 |
|
|
g) Financial income (-).: 61207 |
-15.110.730,00 |
-1.000.196,00 |
-96,00 |
-2,00 |
-1.939,00 |
|
|
h) Financial Expenses (+). : 61208 |
135.020,00 |
397.051,00 |
390.126,00 |
375.283,00 |
253.296,00 |
|
|
3. Changes in current capital equity.: 61300 |
639.924,00 |
357.995,00 |
-13.713,00 |
-365.059,00 |
492.715,00 |
|
|
a) Stock (+/-).: 61301 |
237.417,00 |
125.140,00 |
0,00 |
0,00 |
0,00 |
|
|
d) Debtors and other accounts receivable
(+/-). : 61302 |
-2.164.721,00 |
30.511,00 |
-137.632,00 |
-380.189,00 |
367.891,00 |
|
|
c) Other current assets (+/-). :
61303 |
-12.006,00 |
-6.000,00 |
-3.034,00 |
-2.493,00 |
-316,00 |
|
|
d) Creditors and other accounts payable
(+/-). : 61304 |
2.579.234,00 |
208.344,00 |
126.953,00 |
17.622,00 |
125.140,00 |
|
|
4. Cash Flows from Other Operating Activities: 61400 |
14.975.709,00 |
603.145,00 |
-390.029,00 |
-375.281,00 |
-251.357,00 |
|
|
a) Interest payments (-). : 61401 |
-135.020,00 |
-397.051,00 |
-390.126,00 |
-375.283,00 |
-253.296,00 |
|
|
c) Interest collection (+). : 61403 |
15.110.730,00 |
1.000.196,00 |
96,00 |
2,00 |
1.939,00 |
|
|
5. Cash Flows from Operating Activities (1 + 2 + 3 + 4) :
61500 |
15.968.111,00 |
6.526.415,00 |
10.721,00 |
-320.656,00 |
542.643,00 |
|
|
6. Payments for investment (-).: 62100 |
-2.682.993,00 |
-6.939.846,00 |
-4.774.779,00 |
-2.515.500,00 |
-5.161.300,00 |
|
|
a) Companies of the group and affiliates. :
62101 |
0,00 |
-5.698.673,00 |
-3.608.279,00 |
-2.515.500,00 |
-5.161.300,00 |
|
|
b) Intangible fixed assets. : 62102 |
-1.417.977,00 |
-9.673,00 |
0,00 |
0,00 |
0,00 |
|
|
c) Fixed assets. : 62103 |
0,00 |
-1.231.500,00 |
0,00 |
0,00 |
0,00 |
|
|
d) Real estate investment. : 62104 |
-1.166.500,00 |
0,00 |
-1.166.500,00 |
0,00 |
0,00 |
|
|
e) Other financial assets. : 62105 |
-98.516,00 |
0,00 |
0,00 |
0,00 |
0,00 |
|
|
7. Divestment payment collection (+). : 62200 |
1.253.430,00 |
1.166.500,00 |
1.166.500,00 |
0,00 |
974.300,00 |
|
|
a) Companies of the group and affiliates. :
62201 |
318.500,00 |
0,00 |
0,00 |
0,00 |
0,00 |
|
|
c) Fixed assets. : 62203 |
934.930,00 |
0,00 |
1.166.500,00 |
0,00 |
0,00 |
|
|
d) Real estate investment. : 62204 |
0,00 |
1.166.500,00 |
0,00 |
0,00 |
0,00 |
|
|
e) Other financial assets. : 62205 |
0,00 |
0,00 |
0,00 |
0,00 |
974.300,00 |
|
|
8. Cash Flow from Investing Activities (6+7) less Amortization:
62300 |
-1.636.899,00 |
-5.775.573,00 |
-3.608.279,00 |
-2.515.500,00 |
-4.187.000,00 |
|
|
9. Payment collection and payments for equity instruments. :
63100 |
-1.000.000,00 |
0,00 |
3.393.279,00 |
0,00 |
0,00 |
|
|
a) Issuance of equity instruments (+). :
63101 |
0,00 |
0,00 |
3.393.279,00 |
0,00 |
0,00 |
|
|
b) Amortization of assets instruments (-).
: 63102 |
-1.000.000,00 |
0,00 |
0,00 |
0,00 |
0,00 |
|
|
10. Payment collection and payments for financial liabilities
instruments.: 63200 |
759.324,00 |
263.602,00 |
181.513,00 |
2.395.734,00 |
3.955.641,00 |
|
|
a) Issuance : 63201 |
759.324,00 |
462.334,00 |
386.520,00 |
9.122.539,00 |
4.554.221,00 |
|
|
2. Debts incurred with credit institutions
(+). : 63203 |
0,00 |
0,00 |
0,00 |
0,00 |
401.772,00 |
|
|
3. Debts incurred with companies of the
group and affiliates (+).: 63204 |
759.324,00 |
462.334,00 |
386.520,00 |
9.122.539,00 |
4.117.000,00 |
|
|
5. Other debts (+). : 63206 |
0,00 |
0,00 |
0,00 |
0,00 |
35.449,00 |
|
|
b) Repayment and amortization of :
63207 |
0,00 |
-198.731,00 |
-205.007,00 |
-6.726.805,00 |
-598.580,00 |
|
|
2. Debts incurred with credit institutions
(-).: 63209 |
0,00 |
0,00 |
-205.007,00 |
-199.179,00 |
-598.580,00 |
|
|
3. Debts incurred with companies of the
group and affiliates (-). : 63210 |
0,00 |
0,00 |
0,00 |
-6.492.176,00 |
0,00 |
|
|
5. Other debts (-). : 63212 |
0,00 |
-198.731,00 |
0,00 |
-35.449,00 |
0,00 |
|
|
11. Payments from dividends and remunerations from other assets
instruments. : 63300 |
-14.110.700,00 |
-1.000.000,00 |
0,00 |
0,00 |
0,00 |
|
|
a) Dividends (-).: 63301 |
-14.110.700,00 |
-1.000.000,00 |
0,00 |
0,00 |
0,00 |
|
|
12. Cash Flows from Financing Activities (9+10+11): 63400 |
-14.351.376,00 |
-736.398,00 |
3.574.792,00 |
2.395.734,00 |
3.955.641,00 |
|
|
D) EFFECT OF EXCHANGE RATE CHANGES: 64000 |
0,00 |
0,00 |
0,00 |
0,00 |
0,00 |
|
|
E) NET INCREASE/DECREASE OF CASH OR EQUIVALENT ASSETS
(+/-5+/-8+/12+/-D) : 65000 |
-20.164,00 |
14.445,00 |
-22.766,00 |
-440.422,00 |
311.284,00 |
|
|
Cash or equivalent assets as of beginning
of the fiscal year.: 65100 |
138.581,00 |
124.136,00 |
146.902,00 |
587.324,00 |
276.040,00 |
|
|
Cash or equivalent assets as of end of the
fiscal year.: 65200 |
118.417,00 |
138.581,00 |
124.136,00 |
146.902,00 |
587.324,00 |
|
|
FINANCIAL
DIAGNOSIS
|
> Economic-Financial Comparative Analysis
Data used in the following ratios and indicators is taken from the Annual Accounts submitted by the company to the TRADE REGISTER.
> Comparison within the Sector
|
Cash Flow |
2016 |
2015 |
Variación 2016 - 2015 |
|
|||
|
|
Empresa |
Sector |
Empresa |
Sector |
Empresa |
Sector |
|
|
Cash Flow over Sales: |
-0,01 % |
0,11 % |
0,01 % |
0,02 % |
-168,21 % |
485,43 % |
|
|
Net Financial Debt: |
-0,39 |
3,12 |
-7,88 |
3,74 |
95,01 |
-16,77 |
|
|
Cash Flow Yield: |
0,00 % |
0,03 % |
0,00 % |
0,01 % |
|
505,27 % |
|
|
EBITDA over Sales: |
10,65 % |
11,13 % |
1,09 % |
11,51 % |
879,68 % |
-3,29 % |
|
|
Profitability |
2016 |
2015 |
Variación 2016 - 2015 |
|
|||
|
|
Empresa |
Sector |
Empresa |
Sector |
Empresa |
Sector |
|
|
Operating economic profitability: |
2,52 % |
4,35 % |
-4,42 % |
4,58 % |
156,92 % |
-4,96 % |
|
|
Total economic profitability: |
67,65 % |
3,52 % |
34,18 % |
3,84 % |
97,93 % |
-8,14 % |
|
|
Financial profitability: |
174,30 % |
3,90 % |
71,16 % |
4,67 % |
144,93 % |
-16,50 % |
|
|
Margin: |
4,38 % |
6,75 % |
-6,04 % |
7,44 % |
172,63 % |
-9,19 % |
|
|
Mark-up: |
456,83 % |
7,50 % |
381,33 % |
8,66 % |
19,80 % |
-13,35 % |
|
|
Solvency |
2016 |
2015 |
Variación 2016 - 2015 |
|
|||
|
|
Empresa |
Sector |
Empresa |
Sector |
Empresa |
Sector |
|
|
Liquidity: |
0,03 |
0,27 |
0,20 |
0,23 |
-83,17 |
16,96 |
|
|
Acid Test: |
0,81 |
1,08 |
1,00 |
0,97 |
-19,09 |
10,75 |
|
|
Working Capital / Investment: |
-0,03 |
0,13 |
0,01 |
0,10 |
-286,23 |
30,28 |
|
|
Solvency: |
0,82 |
1,68 |
1,41 |
1,48 |
-41,63 |
13,48 |
|
|
Indebtedness |
2016 |
2015 |
Variación 2016 - 2015 |
|
|||
|
|
Empresa |
Sector |
Empresa |
Sector |
Empresa |
Sector |
|
|
Indebtedness level: |
1,60 |
0,82 |
1,22 |
0,88 |
31,53 |
-7,43 |
|
|
Borrowing Composition: |
2,94 |
1,14 |
14,21 |
1,09 |
-79,28 |
4,73 |
|
|
Repayment Ability: |
39,37 |
13,53 |
599,37 |
14,14 |
-93,43 |
-4,30 |
|
|
Warranty: |
1,63 |
2,23 |
1,82 |
2,14 |
-10,82 |
4,51 |
|
|
Generated resources / Total creditors: |
1,10 |
0,08 |
0,05 |
0,10 |
2.192,51 |
-17,74 |
|
|
Efficiency |
2016 |
2015 |
Variación 2016 - 2015 |
|
|||
|
|
Empresa |
Sector |
Empresa |
Sector |
Empresa |
Sector |
|
|
Productivity: |
1,24 |
1,52 |
1,02 |
1,57 |
21,87 |
-2,84 |
|
|
Turnover of Collection Rights : |
1,22 |
4,24 |
2,98 |
3,80 |
-58,94 |
11,66 |
|
|
Turnover of Payment Entitlements: |
0,48 |
2,79 |
1,17 |
2,72 |
-59,41 |
2,37 |
|
|
Stock rotation: |
69,07 |
2,65 |
5,65 |
2,90 |
1.121,45 |
-8,82 |
|
|
Assets turnover: |
0,57 |
0,64 |
0,73 |
0,62 |
-21,64 |
4,66 |
|
|
Borrowing Cost: |
0,97 |
2,32 |
3,77 |
2,40 |
-74,18 |
-3,50 |
|
> Trend of indicators under the General Accounting Plan of 2007
(2016, 2015, 2014, 2013, 2012)
|
Cash Flow |
2016 |
2015 |
2014 |
2013 |
2012 |
|
|
Cash Flow over Sales: |
-0,01 % |
0,01 % |
-0,02 % |
-0,44 % |
0,42 % |
|
|
Net Financial Debt: |
-0,39 |
-7,88 |
0,17 |
0,61 |
0,17 |
|
|
Cash Flow Yield: |
0,00 % |
0,00 % |
0,00 % |
-0,04 % |
0,04 % |
|
|
EBITDA over Sales: |
10,65 % |
1,09 % |
31,57 % |
41,61 % |
40,78 % |
|
|
Profitability |
2016 |
2015 |
2014 |
2013 |
2012 |
|
|
Operating economic profitability: |
2,52 % |
-4,42 % |
18,24 % |
19,45 % |
13,58 % |
|
|
Total economic profitability: |
67,65 % |
34,18 % |
3,06 % |
4,27 % |
4,11 % |
|
|
Financial profitability: |
174,30 % |
71,16 % |
0,49 % |
35,22 % |
61,14 % |
|
|
Margin: |
4,38 % |
-6,04 % |
31,57 % |
41,61 % |
40,78 % |
|
|
Mark-up: |
456,83 % |
381,33 % |
1,86 % |
4,40 % |
6,76 % |
|
|
Solvency |
2016 |
2015 |
2014 |
2013 |
2012 |
|
|
Liquidity: |
0,03 |
0,20 |
0,24 |
0,35 |
0,08 |
|
|
Acid Test: |
0,81 |
1,00 |
1,38 |
1,38 |
0,09 |
|
|
Working Capital / Investment: |
-0,03 |
0,01 |
0,04 |
0,06 |
-0,80 |
|
|
Solvency: |
0,82 |
1,41 |
2,18 |
2,35 |
0,15 |
|
|
Indebtedness |
2016 |
2015 |
2014 |
2013 |
2012 |
|
|
Indebtedness level: |
1,60 |
1,22 |
2,88 |
110,48 |
128,10 |
|
|
Borrowing Composition: |
2,94 |
14,21 |
18,72 |
22,05 |
0,06 |
|
|
Repayment Ability: |
39,37 |
599,37 |
24,28 |
23,23 |
24,30 |
|
|
Warranty: |
1,63 |
1,82 |
1,35 |
1,01 |
1,01 |
|
|
Generated resources / Total creditors: |
1,10 |
0,05 |
0,00 |
0,00 |
0,00 |
|
|
Efficiency |
2016 |
2015 |
2014 |
2013 |
2012 |
|
|
Productivity: |
1,24 |
1,02 |
1,52 |
1,86 |
1,72 |
|
|
Turnover of Collection Rights : |
1,22 |
2,98 |
2,29 |
2,31 |
13,21 |
|
|
Turnover of Payment Entitlements: |
0,48 |
1,17 |
0,30 |
0,46 |
0,09 |
|
|
Stock rotation: |
69,07 |
5,65 |
2,20 |
1,44 |
1,07 |
|
|
Assets turnover: |
0,57 |
0,73 |
0,58 |
0,47 |
0,33 |
|
|
Borrowing Cost: |
0,97 |
3,77 |
3,88 |
3,85 |
3,46 |
|
COMPARATIVE
SECTORIAL BALANCE
|
Sector-based Comparison
under the rules of the New General Accounting Plan.
|
Net Rights Granted |
Variación - |
|
|
|
Empresa |
Sector |
|
Net Rights Granted |
Variación - |
|
|
|
Empresa |
Sector |
|
Net Rights Granted |
Variación - |
|
|
|
Empresa |
Sector |
|
News
|
|
Europa Press |
31/01/2018 |
|
Grupo Avintia reduce su siniestralidad un 17,79% con la campaña
'Cero Daños' |
|
|
Companies related |
|
|
|
|
|
LA VANGUARDIA |
11/12/2017 |
|
Avintia Construcción comienza en Málaga capital las obras de la
promoción Teatinos Sky Garden, de 297 viviendas |
|
|
Companies related |
|
|
AVINTIA PROYECTOS Y CONSTRUCCIONES SL |
|
|
Public
Tenders and Works Won
|
No Public Tenders assigned
to the name of the company.
|
Research
Summary
|
|
The subject was incorporated in 2010 and is engaged in the
holding activities within the so-called 'GRUPO AVINTIA' The 'Grupo Avintia', apart
from being a construction company, is a comprehensive services platform that
manages and control all the real estate cycle, from the land development to
the real estate management. It operates mainly at the national level. There
are no negative comments made upon the subject, according to the consulted
sources. Having into account all the above-mentioned, credit operations can
be envisioned under normal terms. |
|
Sources
|
|
Registry of Commerce's Official Gazette. Own and external data
bases Company References |
FOREIGN EXCHANGE RATES
|
Currency |
Unit
|
Indian Rupees |
|
US Dollar |
1 |
INR 64.28 |
|
|
1 |
INR 89.02 |
|
Euro |
1 |
INR 78.93 |
|
Euro |
1 |
INR 79.16 |
Note :
Above are approximate rates obtained from sources believed to be correct
INFORMATION DETAILS
|
Analysis Done by
: |
VAR |
|
|
|
|
Report Prepared
by : |
KET |
RATING EXPLANATIONS
|
Credit Rating |
Explanation |
Rating Comments |
|
A++ |
Minimum Risk |
Business dealings permissible with minimum
risk of default |
|
A+ |
Low Risk |
Business dealings permissible with low
risk of default |
|
A |
Acceptable Risk |
Business dealings permissible with
moderate risk of default |
|
B |
Medium Risk |
Business dealings permissible on a regular
monitoring basis |
|
C |
Medium High Risk |
Business dealings permissible preferably
on secured basis |
|
D |
High Risk |
Business dealing not recommended or on
secured terms only |
|
NB |
New Business |
No recommendation can be done due to
business in infancy stage |
|
NT |
No Trace |
No recommendation can be done as the
business is not traceable |
NB is stated where there is insufficient information to facilitate rating. However, it is not to be considered as unfavourable.
This score serves as a reference to assess
SC’s credit risk and to set the amount of credit to be extended. It is
calculated from a composite of weighted scores obtained from each of the major
sections of this report. The assessed factors are as follows:
·
Financial
condition covering various ratios
·
Company
background and operations size
·
Promoters
/ Management background
·
Payment
record
·
Litigation
against the subject
·
Industry
scenario / competitor analysis
·
Supplier
/ Customer / Banker review (wherever available)
This report is issued at
your request without any risk and responsibility on the part of MIRA INFORM
PRIVATE LIMITED (MIPL) or its officials.