|
|
|


MIRA INFORM REPORT
|
Report No. : |
491481 |
|
Report Date : |
13.02.2018 |
IDENTIFICATION DETAILS
|
Name : |
THE GREAT EASTERN SHIPPING COMPANY LIMITED |
|
|
|
|
Registered
Office : |
Ocean House, 134/A, Dr. Annie Besant, Worli, Mumbai – 400018, |
|
Tel. No.: |
91-22-66613000/ 24922100/ 2200 |
|
|
|
|
Country : |
India |
|
|
|
|
Financials (as
on) : |
31.03.2017 |
|
|
|
|
Date of
Incorporation : |
03.08.1948 |
|
|
|
|
Com. Reg. No.: |
11-006472 |
|
|
|
|
Capital
Investment / Paid-up Capital : |
INR 1507.800 Million |
|
|
|
|
CIN No.: [Company Identification
No.] |
L35110MH1948PLC006472 |
|
|
|
|
IEC No.: |
0389019721 |
|
|
|
|
TAN No.: [Tax Deduction & Collection
Account No.] |
Not Available |
|
|
|
|
GST No.: |
Not Available |
|
|
|
|
PAN No.: [Permanent Account No.] |
AAACT1565C |
|
|
|
|
Legal Form : |
A Public Limited Liability Company. The Company’s Shares are Listed on
the Stock Exchanges. |
|
|
|
|
Line of Business
: |
Subject is engaged in the business of Providing Shipping Services. (Registered activity) |
|
|
|
|
No. of Employees
: |
413 (Approximately) |
RATING & COMMENTS
(Mira Inform has adopted New Rating mechanism w.e.f. 23rd January
2017)
|
MIRA’s Rating : |
A+ |
|
Credit Rating |
Explanation |
Rating Comments |
|
A+ |
Low Risk |
Business dealings permissible with low
risk of default |
|
Maximum Credit Limit : |
USD 147486000 |
|
|
|
|
Status : |
Excellent |
|
|
|
|
Payment Behaviour : |
Regular |
|
|
|
|
Litigation : |
Clear |
|
|
|
|
Comments : |
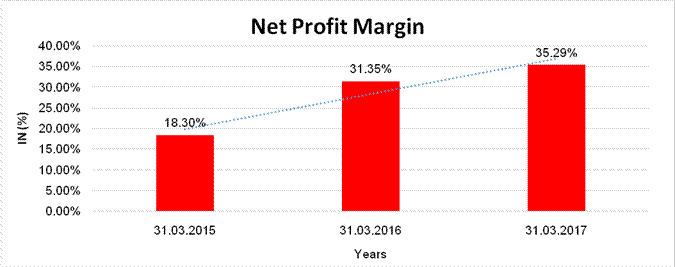
Subject was incorporated in the year 1948. The company is engaged in providing shipping services. As per the financial records of 2017, the company has achieved a favourable profitability margin of 35.29% but has reported a decline in its revenue as compared to the previous year. The strong financial position of the company is reflected by robust net worth base along with strong debt coverage indicator due to low debt balance sheet profile and satisfactory liquidity base. Rating takes into consideration the company’s fair Earnings Per Share (EPS) of INR 39.89 as against its Face Value (FV) of INR 10. The company has its share price trading at around INR 390.95 on BSE as on February 9, 2018 as against the Face Value (FV) of INR 10. Business is active. Payment seems to be regular. In view of aforesaid, the company can be considered for business dealings at usual trade terms and condition. |
NOTES :
Any query related to this report can be made
on e-mail : infodept@mirainform.com
while quoting report number, name and date.
ECGC Country Risk Classification List
|
Country Name |
Previous Rating (30.06.2017) |
Current Rating (30.09.2017) |
|
India |
A1 |
A1 |
|
Risk Category |
ECGC
Classification |
|
Insignificant |
A1 |
|
Low Risk |
A2 |
|
Moderately Low Risk |
B1 |
|
Moderate Risk |
B2 |
|
Moderately High Risk |
C1 |
|
High Risk |
C2 |
|
Very High Risk |
D |
RBI DEFAULTERS’ LIST STATUS
Subject’s name is not enlisted as a defaulter
in the publicly available RBI Defaulters’ list.
EPF (Employee Provident Fund) DEFAULTERS’ LIST STATUS
Subject’s name is not enlisted as a defaulter in
the publicly available EPF (Employee Provident Fund) Defaulters’ list as of
31-03-2016.
BIFR (Board for Industrial & Financial Reconstruction) LISTING
STATUS
Subject’s name is not listed as a Sick Unit in
the publicly available BIFR (Board for Industrial & Financial
Reconstruction) list as of 13.02.2018
IBBI (Insolvency and Bankruptcy Board of India) LISTING STATUS
Subject’s name is not listed in the publicly
available IBBI (Insolvency and Bankruptcy Board of India) list as of report
date.
LOCATIONS
|
Registered Office : |
Ocean House, 134/A, Dr. Annie Besant, Worli, Mumbai – 400018,
Maharashtra, India |
|
Tel. No.: |
91-22-66613000/ 24922100/ 2200 |
|
Fax No.: |
91-22-24925900 |
|
E-Mail : |
|
|
Website : |
|
|
|
|
|
Head Office : |
Indiabulls Finance Centre, Tower 3, 23rd Floor, Senapati Bapat Marg, Elphinstone Road (West), Mumbai - 400013, Maharashtra, India |
DIRECTORS
AS ON: 31.03.2017
|
Name : |
Mr. Vineet Sohanlal Nayyar |
|
Designation : |
Director |
|
Address: |
5A, Friends Colony, Mathura Road, New Delhi – 110065, Delhi, India |
|
Date of Appointment : |
24.03.2004 |
|
DIN No.: |
00018243 |
|
|
|
|
Name : |
Mr. Kanaiyalal Maneklal Sheth |
|
Designation : |
Director |
|
Address: |
19-B, Manek, 11, L.D. Ruparel Marg, Mumbai - 400006, Maharashtra, India |
|
Date of Appointment : |
03.04.1970 |
|
DIN No.: |
00022079 |
|
|
|
|
Name : |
Mr. Bharat Kanaiyalal Sheth |
|
Designation : |
Managing Director |
|
Address: |
19-B, Manek, 11, L.D. Ruparel Marg, Mumbai - 400006, Maharashtra, India |
|
Date of Appointment : |
01.04.2010 |
|
DIN No.: |
00022102 |
|
|
|
|
Name : |
Mr. |
|
Designation : |
Executive Director |
|
Address: |
12-B, Manek, 11, L.D. Ruparel Marg, Mumbai - 400006, Maharashtra, India |
|
Date of Appointment : |
30.01.2006 |
|
DIN No.: |
00022121 |
|
|
|
|
Name : |
Mr. Farrokh Kaikhushru Kavarana |
|
Designation : |
Director |
|
Address: |
CCI Chambers 5th Floor, Dinshaw Vachha Road, Mumbai - 400020, Maharashtra, India |
|
Date of Appointment : |
12.08.2015 |
|
DIN No.: |
00027689 |
|
|
|
|
Name : |
Mr. Shankar Nath Acharya |
|
Designation : |
Director |
|
Address: |
S-523A, Second Floor, Greater Kailash 2, New Delhi - 110048, India |
|
Date of Appointment : |
12.08.2015 |
|
DIN No.: |
00033242 |
|
|
|
|
Name : |
Mr. Cyrus Jamshed Guzder |
|
Designation : |
Director |
|
Address: |
D-11, Sea Face Park, Bhulabhai Desai Road, Mumbai - 400026, Maharashtra, India |
|
Date of Appointment : |
14.03.2003 |
|
DIN No.: |
00080358 |
|
|
|
|
Name : |
Mr. Berjis Minoo Desai |
|
Designation : |
Director |
|
Address: |
Yezerina-II Road No 5, 740/741 Dadar Parsi Colony Dadar, Mumbai - 400014, Maharashtra, India |
|
Date of Appointment : |
18.12.2006 |
|
DIN No.: |
00153675 |
|
|
|
|
Name : |
Mr. Tapas Icot |
|
Designation : |
Director |
|
Address: |
1101, Seaking, Dr. H K Bhabha Road, Bandstand, Bandra West, Mumbai - 400050, Maharashtra, India |
|
Date of Appointment : |
12.08.2014 |
|
DIN No.: |
00905882 |
|
|
|
|
Name : |
Mr. Shivakumar Gomathinayagam |
|
Designation : |
Director |
|
Address: |
Flat No 05-D 10th Floor, Ashok Gardens T J Road Sewree, Mumbai - 400015, Maharashtra, India |
|
Date of Appointment : |
14.11.2014 |
|
DIN No.: |
03632124 |
|
|
|
|
Name : |
Ms. Rita Bhagwati |
|
Designation : |
Director |
|
Address: |
D-1/10, 1st Floor, Vasant Vihar, New Delhi - 110057, India |
|
Date of Appointment : |
12.08.2015 |
|
DIN No.: |
06990589 |
KEY EXECUTIVES
|
Name : |
Mr. Jayesh M Trivedi |
|
Designation : |
Company Secretary |
|
Address: |
Flat No. 231, 2nd Floor, Akshay Girikunj 3, Behind Bses Hospital, Paliram Road, A Ndheri - W Mumbai 400058 , Maharashtra, India |
|
Date of Appointment : |
01.09.2001 |
|
PAN No.: |
AACPT4040R |
|
|
|
|
Name : |
Mr. Shivakumar Natarajan Gomathinayagam |
|
Designation : |
Chief Finance Officer |
|
Address: |
Flat No 05-D 10th Floor, Ashok Gardens T J Road Sewree, Mumbai - 400015, Maharashtra, India |
|
Date of Appointment : |
07.05.201 |
|
PAN No.: |
AAKPG4618E |
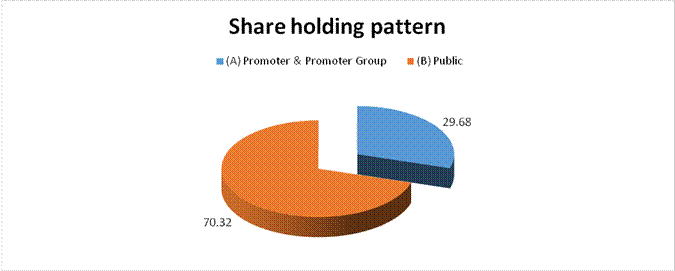
MAJOR SHAREHOLDERS / SHAREHOLDING PATTERN
AS ON: 31.12.2017
|
Category of shareholder |
Total nos. shares held |
Shareholding as a % of total no. of shares
(calculated as per SCRR, 1957)As a % of (A+B+C2) |
|
|
(A) Promoter &
Promoter Group |
44750614 |
29.68 |
|
|
(B) Public |
106022275 |
70.32 |
|
|
(C1) Shares
underlying DRs |
4176 |
0.00 |
|
|
(C) Non
Promoter-Non Public |
4176 |
0.00 |
|
|
Grand Total |
150777065 |
100.00 |
Statement showing
shareholding pattern of the Promoter and Promoter Group
|
Category of shareholder |
Total nos. shares held |
Shareholding as a % of total no. of shares (calculated as per SCRR,
1957)As a % of (A+B+C2) |
|
|
A1) Indian |
0.00 |
||
|
Individuals/Hindu
undivided Family |
38498757 |
25.53 |
|
|
SACHIN MULJI |
1065000 |
0.71 |
|
|
KABIR MULJI |
529615 |
0.35 |
|
|
RAVI KANAIYALAL
SHETH |
512504 |
0.34 |
|
|
SANGITA MULJI |
582415 |
0.39 |
|
|
AMITA R SHETH |
183808 |
0.12 |
|
|
JYOTSNA KANAIYALAL
SHETH |
247968 |
0.16 |
|
|
KANAIYALAL
MANEKLAL SHETH |
278133 |
0.18 |
|
|
BHARAT KANAIYALAL
SHETH |
519490 |
0.34 |
|
|
ASHA VASANT SHETH |
2122851 |
1.41 |
|
|
KETAKI VASANT
SHETH |
989980 |
0.66 |
|
|
ROSALEEN MULJI |
432000 |
0.29 |
|
|
GOPALI MULJI |
420000 |
0.28 |
|
|
PRADEEP PADGAOKAR
. |
151282 |
0.10 |
|
|
JYOTI B SHETH |
137796 |
0.09 |
|
|
NIRJA BHARAT SHETH |
105317 |
0.07 |
|
|
NISHA VIRAJ MEHTA
. |
112037 |
0.07 |
|
|
RAHUL RAVI SHETH |
108521 |
0.07 |
|
|
ARJUN RAVI SHETH |
50040 |
0.03 |
|
|
B K SHETH |
15200000 |
10.08 |
|
|
R K SHETH |
14750000 |
9.78 |
|
|
Any Other
(specify) |
6251857 |
4.15 |
|
|
A H BHIWANDIWALLA
INVESTMENTS PVT LTD |
3600 |
0.00 |
|
|
LAADKI TRADING AND
INVESTMENTS LTD |
5524981 |
3.66 |
|
|
GOPA INVESTMENTS
CO (PVT) LTD |
424000 |
0.28 |
|
|
V J SHARE
ENTERPRISES LLP |
95832 |
0.06 |
|
|
ASHADEEP TRADING
LLP |
203444 |
0.13 |
|
|
Sub Total A1 |
44750614 |
29.68 |
|
|
A=A1+A2 |
44750614 |
29.68 |
Statement showing
shareholding pattern of the Public shareholder
|
Category & Name of the Shareholders |
Total no. shares held |
Shareholding % calculated as per SCRR, 1957 As a % of (A+B+C2) |
|
|
B1) Institutions |
0.00 |
||
|
Mutual Funds/ |
25575892 |
16.96 |
|
|
ICICI PRUDENTIAL
VALUE FUND - SERIES 1 |
12869434 |
8.54 |
|
|
UTI-DIVIDEND YIELD
FUND |
1827881 |
1.21 |
|
|
SBI MAGNUM TAXGAIN
SCHEME |
8171414 |
5.42 |
|
|
Foreign Portfolio
Investors |
35111129 |
23.29 |
|
|
FIDELITY PURITAN TRUST-FIDELITY
LOW-PRICED STOCK FUND |
5100000 |
3.38 |
|
|
FRANKLIN TEMPLETON
INVESTMENT FUNDS |
2701247 |
1.79 |
|
|
NALANDA INDIA
EQUITY FUND LIMITED |
10524139 |
6.98 |
|
|
Financial
Institutions/ Banks |
109955 |
0.07 |
|
|
Insurance
Companies |
5135295 |
3.41 |
|
|
GENERAL INSURANCE
CORPORATION OF INDIA |
3147696 |
2.09 |
|
|
Sub Total B1 |
65932271 |
43.73 |
|
|
B2) Central
Government/ State Government(s)/ President of India |
0.00 |
||
|
Central
Government/ State Government(s)/ President of India |
10238 |
0.01 |
|
|
Sub Total B2 |
10238 |
0.01 |
|
|
B3)
Non-Institutions |
0.00 |
||
|
Individual share
capital up to INR 0.200 Million |
23074863 |
15.30 |
|
|
Individual share
capital in excess of INR 0.200 Million |
7131775 |
4.73 |
|
|
NBFCs registered
with RBI |
6685 |
0.00 |
|
|
Any Other
(specify) |
9866443 |
6.54 |
|
|
ICICI PRUDENTIAL
LIFE INSURANCE COMPANY LTD |
4754786 |
3.15 |
|
|
Sub Total B3 |
40079766 |
26.58 |
|
|
B=B1+B2+B3 |
106022275 |
70.32 |
BUSINESS DETAILS
|
Line of Business : |
Subject is engaged in the business of Providing Shipping Services. (Registered activity) |
|
|
|
|
Brand Names : |
Not Available |
|
|
|
|
Agencies Held : |
Not Available |
|
|
|
|
Exports : |
Not Available |
|
|
|
|
Imports : |
Not Available |
|
|
|
|
Terms : |
|
|
Selling : |
Not Available |
|
|
|
|
Purchasing : |
Not Available |
PRODUCTION STATUS: NOT AVAILABLE
GENERAL INFORMATION
|
Suppliers : |
|
|||||||||||||||||||||||||||
|
|
|
|||||||||||||||||||||||||||
|
Customers : |
|
|||||||||||||||||||||||||||
|
|
|
|||||||||||||||||||||||||||
|
No. of Employees
: |
413 (Approximately) |
|||||||||||||||||||||||||||
|
|
|
|||||||||||||||||||||||||||
|
Bankers : |
· Citi Bank N.A. 4th Floor, Jeevan Bharti Building, Connaught Place, New Delhi-110001, India · IndusInd Bank Limited Peninsula Corporate Park, Tower A, 4th Floor, Ganpatrao Kadam Marg, Lower Parel, Mumbai-400013, Maharashtra, India · Standard Chartered Bank 1 Basinghall Avenue, United Kingdom, London, NAEC2V5DDGB · The Bank Of Nova Scotia Asia Limited One Raffles Quay#20-01 North Tower, Singapore, NA048583SG |
|||||||||||||||||||||||||||
|
|
|
|||||||||||||||||||||||||||
|
Facilities : |
|
|
|
|
|
Auditors : |
|
|
Name : |
Kalyaniwalla and Mistry LLP Chartered Accountants |
|
Address : |
Kalpataru Heritage 127, Mahatama Gandhi Road, Mumbai - 400
001, Maharashtra, Idnia |
|
|
|
|
Memberships : |
Not Available |
|
|
|
|
Collaborators : |
Not Available |
|
|
|
|
Subsidiary
Companies : |
· The Great Eastern Shipping Co. (London) Ltd. (wound up as at March 31, 2016) The Greatship (Singapore) Pte. Ltd. The Great Eastern
Chartering L.L.C. (FZC) and its subsidiary : · The Great Eastern Chartering (Singapore) Pte. Ltd., Singapore · Great Eastern CSR Foundation, India Greatship (India)
Ltd., India and its subsidiaries : · Greatship Global Holdings Ltd., Mauritius · Greatship Global Offshore Services Pte. Ltd., Singapore · GGOS Labuan Ltd., Malaysia. (deregistered on March 4, 2017) · Greatship Global Energy Services Pte. Ltd., Singapore. ·
Greatship (UK) Ltd., UK. - Greatship Oilfield
Services Ltd., India (incorporated on July 9, 2015) |
|
|
|
|
Other Related
Parties : |
· The Provident Fund of The Great Eastern Shipping Company Ltd · The Great Eastern Shipping Co Ltd Employees Gratuity Fund · The Great Eastern Shipping Co Limited Executives Superannuation Fund · The Great Eastern Shipping Co Ltd Floating Staff Superannuation Fund · The Great Eastern Shipping Co Ltd Staff Superannuation Fun |
CAPITAL STRUCTURE
AS ON: 31.03.2017
Authorised Capital:
|
No. of Shares |
Type |
Value |
Amount |
|
|
|
|
|
|
300000000 |
Equity Shares |
INR 10/- each |
INR 3000.000 Million |
|
200000000 |
Preference Shares |
|
INR 2000.000 Million |
|
|
|
|
|
|
|
Total |
|
INR 5000.000
Million |
Subscribed & Paid-up Capital:
|
No. of Shares |
Type |
Value |
Amount |
|
|
|
|
|
|
151163426 |
Equity Shares |
INR 10/- each |
INR 1511.600
Million |
|
|
|
|
|
Subscribed & Paid-up Capital:
|
No. of Shares |
Type |
Value |
Amount |
|
|
|
|
|
|
150777065 |
Equity Shares |
INR 10/- each |
INR 1507.800
Million |
|
|
|
|
|
a) Terms/Rights attached to Equity Shares:
The Company has only one class of equity shares having a face
value of INR 10 each. Each holder of equity shares is entitled to one vote per
share. The Company declares and pays dividends in Indian rupees. Interim
dividend is paid as recommended by the Board of Directors. In the event of
liquidation, the equity shareholders are eligible to receive remaining assets
of the Company, after distribution of all preferential amounts in proportion to
their shareholding.
b) Details of shareholders holding more than
5% equity shares in the Company:
|
|
As at 31.03.2017 |
|
|
Equity shares of INR 10 each fully paid |
|
|
|
Bharat Kanaiyalal Sheth |
15719490 |
10.43% |
|
Ravi Kanaiyalal Sheth |
15262504 |
10.12% |
|
Nalanda India Equity Fund Limited |
10524139 |
6.98% |
c) There are no shares reserved for issue under options and contracts or commitments for the sale of shares.
d) For the period of five years immediately preceding the date as at which the Balance Sheet is prepared :
i) No shares were allotted pursuant to contracts without payment being received in cash.
ii)
No bonus shares have been issued.
iii)
15,45,019 equity shares have been bought back
during the financial year 2013-14
e)
There are no securities convertible into
equity/preference shares.
f)
Under orders from the Special Court (Trial of
Offences Relating to Transactions in Securities) Act, 1992, the allotment of
2,53,522 (as at March 31, 2016 : 2,53,522; as at April 1, 2015 : 2,53,522)
rights equity shares of the Company have been kept in abeyance in accordance
with Section 126(b) of the Companies Act, 2013 till such time as the title of
the bonafide owner is certified by the concerned Stock Exchanges. Additional
40,608 (as at March 31, 2016 : 40,608; as at April 1, 2015 : 40,608) shares
have also been kept in abeyance for disputed cases in consultation with the
Bombay Stock Exchange.
FINANCIAL DATA
[all figures are
in INR Million]
ABRIDGED
BALANCE SHEET
|
SOURCES OF FUNDS |
31.03.2017 |
31.03.2016 |
31.03.2015 |
|
I.
EQUITY AND LIABILITIES |
|
|
|
|
(1)Shareholders' Funds |
|
|
|
|
(a) Share Capital |
1507.800 |
1507.800 |
1507.800 |
|
(b) Reserves & Surplus |
50112.400 |
44693.000 |
42007.300 |
|
(c) Money received against share warrants |
0.000 |
0.000 |
0.000 |
|
|
|
|
|
|
(2) Share
Application money pending allotment |
0.000 |
0.000 |
0.000 |
|
Total Shareholders’
Funds (1) + (2) |
51620.200 |
46200.800 |
43515.100 |
|
|
|
|
|
|
(3)
Non-Current Liabilities |
|
|
|
|
(a) Long-term borrowings |
37484.700 |
26061.400 |
25585.200 |
|
(b) Deferred tax liabilities (Net) |
0.000 |
0.000 |
0.000 |
|
(c)
Other long term liabilities |
0.000 |
0.000 |
0.000 |
|
(d)
long-term provisions |
281.000 |
249.600 |
241.000 |
|
Total
Non-current Liabilities (3) |
37765.700 |
26311.000 |
25826.200 |
|
|
|
|
|
|
(4) Current Liabilities |
|
|
|
|
(a)
Short term borrowings |
1701.700 |
0.000 |
0.000 |
|
(b)
Trade payables |
1003.600 |
1193.300 |
1144.200 |
|
(c)
Other current liabilities |
13843.800 |
14498.300 |
15268.800 |
|
(d)
Short-term provisions |
482.000 |
349.700 |
337.700 |
|
Total
Current Liabilities (4) |
17031.100 |
16041.300 |
16750.700 |
|
|
|
|
|
|
TOTAL |
106417.000 |
88553.100 |
86092.000 |
|
|
|
|
|
|
II.
ASSETS |
|
|
|
|
(1) Non-current assets |
|
|
|
|
(a)
Fixed Assets |
|
|
|
|
(i)
Tangible assets |
55941.200 |
36657.800 |
34841.300 |
|
(ii)
Intangible Assets |
3.000 |
2.700 |
3.500 |
|
(iii)
Capital work-in-progress |
217.100 |
3282.800 |
1219.800 |
|
(iv) Intangible assets under development |
6.700 |
1.500 |
1.600 |
|
(b) Non-current
Investments |
16801.700 |
16781.900 |
17311.200 |
|
(c) Deferred tax assets
(net) |
0.000 |
0.000 |
0.000 |
|
(d) Long-term Loan
and Advances |
0.000 |
0.000 |
0.000 |
|
(e)
Other Non-current assets |
291.400 |
38.300 |
38.900 |
|
Total
Non-Current Assets |
73261.100 |
56765.000 |
53416.300 |
|
|
|
|
|
|
(2) Current assets |
|
|
|
|
(a)
Current investments |
8628.900 |
8857.000 |
12210.300 |
|
(b)
Inventories |
604.100 |
281.400 |
528.300 |
|
(c)
Trade receivables |
498.700 |
916.700 |
1339.100 |
|
(d)
Cash and cash equivalents |
21984.700 |
20251.700 |
17285.300 |
|
(e)
Short-term loans and advances |
0.000 |
0.000 |
0.000 |
|
(f)
Other current assets |
1439.500 |
1481.300 |
1312.700 |
|
Total
Current Assets |
33155.900 |
31788.100 |
32675.700 |
|
|
|
|
|
|
TOTAL |
106417.000 |
88553.100 |
86092.000 |
PROFIT
& LOSS ACCOUNT
|
|
PARTICULARS |
31.03.2017 |
31.03.2016 |
31.03.2015 |
|
|
|
SALES |
|
|
|
|
|
|
|
Revenue from Operations |
17039.600 |
19724.900 |
17340.800 |
|
|
|
Other Income |
5227.800 |
1379.000 |
2786.100 |
|
|
|
TOTAL |
22267.400 |
21103.900 |
20126.900 |
|
|
|
|
|
|
|
|
Less |
EXPENSES |
|
|
|
|
|
|
|
Employees benefits expense |
3124.600 |
2560.000 |
2409.300 |
|
|
|
Other expenses |
6523.100 |
7460.900 |
9308.300 |
|
|
|
TOTAL |
9647.700 |
10020.900 |
11717.600 |
|
|
|
|
|
|
|
|
|
PROFIT
BEFORE INTEREST, TAX, DEPRECIATION AND AMORTISATION |
12619.700 |
11083.000 |
8409.300 |
|
|
|
|
|
|
|
|
|
Less |
FINANCIAL
EXPENSES |
2469.800 |
1833.700 |
1885.800 |
|
|
|
|
|
|
|
|
|
|
PROFIT/
(LOSS) BEFORE TAX, DEPRECIATION AND AMORTISATION |
10149.900 |
9249.300 |
6523.500 |
|
|
|
|
|
|
|
|
|
Less/ Add |
DEPRECIATION/
AMORTISATION |
3736.000 |
2876.500 |
3190.500 |
|
|
|
|
|
|
|
|
|
|
PROFIT/ (LOSS)
BEFORE TAX |
6413.900 |
6372.800 |
3333.000 |
|
|
|
|
|
|
|
|
|
Less |
TAX |
400.000 |
190.000 |
160.000 |
|
|
|
|
|
|
|
|
|
|
PROFIT/ (LOSS)
AFTER TAX |
6013.900 |
6182.800 |
3173.000 |
|
|
|
|
|
|
|
|
|
|
Earnings/ (Loss)
Per Share (INR) |
|
|
|
|
|
|
Basic |
39.89 |
41.01 |
21.04 |
|
|
|
Diluted
|
39.81 |
40.93 |
21.00 |
|
CURRENT MATURITIES OF LONG TERM DEBT DETAILS
|
PARTICULARS |
31.03.2017 |
31.03.2016 |
31.03.2015 |
|
Current Maturities of Long term debt |
5130.700 |
2717.800 |
4903.600 |
|
|
|
|
|
|
Cash generated from operations |
7003.700 |
10825.000 |
5582.600 |
|
|
|
|
|
|
Net cash (used in) / generated from operating activities |
6742.900 |
10573.100 |
5301.200 |
KEY
RATIOS
EFFICIENCY RATIOS
|
PARTICULARS |
31.03.2017 |
31.03.2016 |
31.03.2015 |
|
Average Collection Days (Sundry
Debtors / Income * 365 Days) |
10.68 |
16.96 |
28.19 |
|
|
|
|
|
|
Account Receivables Turnover (Income / Sundry Debtors) |
34.17 |
21.52 |
12.95 |
|
|
|
|
|
|
Average Payment Days (Sundry Creditors / Purchases * 365 Days) |
0.00 |
0.00 |
0.00 |
|
|
|
|
|
|
Inventory Turnover (Operating Income / Inventories) |
20.89 |
39.39 |
15.92 |
|
|
|
|
|
|
Asset Turnover (Operating Income / Net Fixed Assets) |
0.22 |
0.28 |
0.23 |
LEVERAGE RATIOS
|
PARTICULARS |
31.03.2017 |
31.03.2016 |
31.03.2015 |
|
Debt Ratio ((Borrowing
+ Current Liabilities) / Total Assets) |
0.56 |
0.51 |
0.55 |
|
|
|
|
|
|
Debt Equity Ratio (Total Liability / Networth) |
0.86 |
0.62 |
0.70 |
|
|
|
|
|
|
Current Liabilities to Networth (Current Liabilities / Net Worth) |
0.33 |
0.35 |
0.38 |
|
|
|
|
|
|
Fixed Assets to Networth (Net Fixed Assets / Networth) |
1.09 |
0.86 |
0.83 |
|
|
|
|
|
|
Interest Coverage Ratio (PBIT / Financial Charges) |
5.11 |
6.04 |
4.46 |
PROFITABILITY RATIOS
|
PARTICULARS |
|
31.03.2017 |
31.03.2016 |
31.03.2015 |
|
Net Profit Margin ((PAT / Sales) * 100) |
% |
35.29 |
31.35 |
18.30 |
|
|
|
|
|
|
|
Return on Total Assets ((PAT / Total Assets) * 100) |
% |
5.65 |
6.98 |
3.69 |
|
|
|
|
|
|
|
Return on Investment (ROI) ((PAT / Networth) * 100) |
% |
11.65 |
13.38 |
7.29 |
SOLVENCY RATIOS
|
PARTICULARS |
31.03.2017 |
31.03.2016 |
31.03.2015 |
|
Current Ratio (Current
Assets / Current Liabilities) |
1.95 |
1.98 |
1.95 |
|
|
|
|
|
|
Quick Ratio ((Current Assets – Inventories) / Current
Liabilities) |
1.91 |
1.96 |
1.92 |
|
|
|
|
|
|
G-Score Ratio Financial (Networth / Total Assets) |
0.49 |
0.52 |
0.51 |
|
|
|
|
|
|
G-Score Ratio Debt (Debts / Equity Capital) |
29.39 |
19.09 |
20.22 |
|
|
|
|
|
|
G-Score Ratio Liquidity (Total Current Assets / Total Current Liabilities) |
1.95 |
1.98 |
1.95 |
Total
Liability = Short-term Debt + Long-term Debt + Current Maturities of Long-term
debts
STOCK
PRICES
|
Face Value |
INR 10.00/- |
|
|
|
|
Market Value |
INR 390.95/- |
FINANCIAL ANALYSIS
[all figures are
in INR Million]
DEBT EQUITY RATIO
|
Particular |
31.03.2015 |
31.03.2016 |
31.03.2017 |
|
|
INR
In Million |
INR
In Million |
INR
In Million |
|
Share Capital |
1507.800 |
1507.800 |
1507.800 |
|
Reserves & Surplus |
42007.300 |
44693.000 |
50112.400 |
|
Money received against share
warrants |
0.000 |
0.000 |
0.000 |
|
Share Application money
pending allotment |
0.000 |
0.000 |
0.000 |
|
Net
worth |
43515.100 |
46200.800 |
51620.200 |
|
|
|
|
|
|
long-term borrowings |
25585.200 |
26061.400 |
37484.700 |
|
Short term borrowings |
0.000 |
0.000 |
1701.700 |
|
Current Maturities of Long
term debt |
4903.600 |
2717.800 |
5130.700 |
|
Total
borrowings |
30488.800 |
28779.200 |
44317.100 |
|
Debt/Equity
ratio |
0.701 |
0.623 |
0.859 |
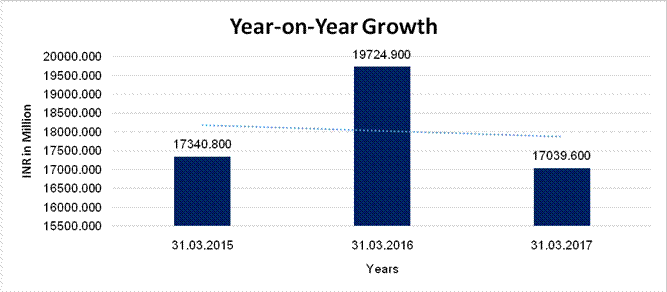
YEAR-ON-YEAR GROWTH
|
Year
on Year Growth |
31.03.2015 |
31.03.2016 |
31.03.2017 |
|
|
INR
In Million |
INR
In Million |
INR
In Million |
|
Sales |
17340.800 |
19724.900 |
17039.600 |
|
|
|
13.749 |
-13.614 |
NET PROFIT MARGIN
|
Net
Profit Margin |
31.03.2015 |
31.03.2016 |
31.03.2017 |
|
|
INR
In Million |
INR
In Million |
INR
In Million |
|
Sales |
17340.800 |
19724.900 |
17039.600 |
|
Profit/ (Loss) |
3173.000 |
6182.800 |
6013.900 |
|
|
18.30% |
31.35% |
35.29% |
LOCAL AGENCY FURTHER INFORMATION
|
Sr. No. |
Check list by
info agents |
Available in
Report (Yes/No) |
|
1 |
Year of establishment |
Yes |
|
2 |
Constitution of the entity -Incorporation
details |
Yes |
|
3 |
Locality of the entity |
Yes |
|
4 |
Premises details |
No |
|
5 |
Buyer visit details |
-- |
|
6 |
Contact numbers |
Yes |
|
7 |
Name of the person contacted |
No |
|
8 |
Designation of contact person |
No |
|
9 |
Promoter’s background |
Yes |
|
10 |
Date of Birth of Proprietor / Partners /
Directors |
Yes |
|
11 |
Pan Card No. of Proprietor / Partners |
No |
|
12 |
Voter Id Card No. of Proprietor / Partners |
No |
|
13 |
Type of business |
Yes |
|
14 |
Line of Business |
Yes |
|
15 |
Export/import details (if applicable) |
No |
|
16 |
No. of employees |
Yes |
|
17 |
Details of sister concerns |
Yes |
|
18 |
Major suppliers |
No |
|
19 |
Major customers |
No |
|
20 |
Banking Details |
Yes |
|
21 |
Banking facility details |
Yes |
|
22 |
Conduct of the banking account |
-- |
|
23 |
Financials, if provided |
Yes |
|
24 |
Capital in the business |
Yes |
|
25 |
Last accounts filed at ROC, if applicable |
Yes |
|
26 |
Turnover of firm for last three years |
Yes |
|
27 |
Reasons for variation <> 20% |
-- |
|
28 |
Estimation for coming financial year |
No |
|
29 |
Profitability for last three years |
Yes |
|
30 |
Major shareholders, if available |
Yes |
|
31 |
Litigations that the firm/promoter
involved in |
-- |
|
32 |
Market information |
-- |
|
33 |
Payments terms |
No |
|
34 |
Negative Reporting by Auditors in the
Annual Report |
No |
INDEX OF CHARGES
|
CHARGES REGISTERED |
||||||||
|
SNO |
SRN |
CHARGE ID |
CHARGE HOLDER NAME |
DATE OF CREATION |
DATE OF MODIFICATION |
DATE OF SATISFACTION |
AMOUNT |
ADDRESS |
|
1 |
G70143664 |
100137302 |
VISTRA ITCL (INDIA) LIMITED |
31/10/2017 |
23/11/2017 |
- |
1500000000.0 |
IL & FS FINANCIAL CENTREPLOT NO C22 G BLOCK BANDRAKURLA COMPLEX BANDRA EASTMUMBAIMA400051IN |
|
2 |
G43033935 |
100084712 |
CITI BANK N.A. |
22/02/2017 |
21/04/2017 |
- |
2380175000.0 |
4TH FLOOR, JEEVAN BHARTI BUILDING,CONNAUGHT PLACENEW DELHIDL110001IN |
|
3 |
G42727479 |
100052872 |
CITI BANK N.A. |
01/09/2016 |
27/03/2017 |
- |
1215687000.0 |
4TH FLOOR, JEEVAN BHARTI BUILDING,CONNAUGHT PLACENEW DELHIDL110001IN |
|
4 |
G31992639 |
10604919 |
INDUSIND BANK LIMITED |
14/10/2015 |
16/12/2016 |
- |
1000000000.0 |
PENINSULA CORPORATE PARK,TOWER A, 4TH FLOORGANPATRAO KADAM MARG, LOWER PARELMUMBAIMH400013IN |
|
5 |
C67060194 |
10596566 |
STANDARD CHARTERED BANK |
14/09/2015 |
- |
- |
1949514000.0 |
1 BASINGHALL AVENUEUNITED KINGDOMLONDONNAEC2V5DDGB |
|
6 |
G00370270 |
10572081 |
BNP PARIBAS |
03/06/2015 |
01/04/2016 |
- |
2555200000.0 |
20, COLLYER QUAY, #01-01SINGAPORENA049319SG |
|
7 |
C44686301 |
10551317 |
THE BANK OF NOVA SCOTIA ASIA LIMITED |
27/02/2015 |
- |
- |
2157280389.6 |
ONE RAFFLES QUAY#20-01 NORTH TOWERSINGAPORENA048583SG |
|
8 |
G59810184 |
10520540 |
CITI BANK N.A. |
25/08/2014 |
04/09/2017 |
- |
1622283389.59 |
PLOT NO. C-54 AND C-55,G- BLOCK, BANDRA KURLA COMPLEX, BANDRA (EAST),MUMBAIMH400051IN |
|
9 |
G73877524 |
10306207 |
BNS ASIA LIMITED (FORMERLY KNOWN AS THE BANK OF NOVA SCOTIA ASIA LIMITED) |
16/09/2011 |
21/12/2017 |
- |
1530992000.0 |
ONE RAFFLES QUAY#20-01 NORTH TOWERSINGAPORENA048583SG |
|
10 |
G30464291 |
10182105 |
VISTRA ITCL (INDIA) LIMITED |
30/09/2009 |
05/12/2016 |
- |
2500000000.0 |
IL & FS FINANCIAL CENTREPLOT NO C22 G BLOCK BANDRAKURLA COMPLEX BANDRA EASTMUMBAIMA400051IN |
UNSECURED LOANS
|
UNSECURED LOANS |
31.03.2017 (INR
In Million) |
31.03.2016 (INR
In Million) |
|
LONG-TERM BORROWINGS |
|
|
|
Redeemable
Non-Convertible Debentures of INR10,00,000 each |
|
|
|
8.24% 2000 Debentures redeemable on November 11, 2026 |
2000.000 |
0.000 |
|
8.70% 2500 Debentures redeemable on May 6, 2026 |
2500.000 |
0.000 |
|
8.24% 2000 Debentures redeemable on November 11, 2025 |
2000.000 |
0.000 |
|
8.70% 2500 Debentures redeemable on May 31, 2025 |
2500.000 |
0.000 |
|
7.99% 2500 Debentures redeemable on January 18, 2025 |
2500.000 |
0.000 |
|
7.99% 2500 Debentures redeemable on January 18, 2024 |
2500.000 |
0.000 |
|
9.70% 1000 Debentures redeemable on January 18, 2023 |
1000.000 |
1000.000 |
|
9.70% 1000 Debentures redeemable on January 7, 2023 |
1000.000 |
1000.000 |
|
9.70% 500 Debentures redeemable on April 25, 2021 |
500.000 |
500.000 |
|
9.70% 1500 Debentures redeemable on April 15, 2021 |
1500.000 |
1500.000 |
|
9.70% 1000 Debentures redeemable on February 2, 2021 |
1000.000 |
1000.000 |
|
9.60% 2000 Debentures redeemable on November 10, 2019 |
2000.000 |
2000.000 |
|
9.75% 2350 (Previous Years : 2500) Debentures redeemable
on August 20, 2019 [150 Redeemable Non-Convertible Debentures of INR10,00,000
each bought back during the year] |
2350.000 |
2500.000 |
|
9.35% 425 (Previous Years : 500) Debentures redeemable on
February 8, 2019 and 425 (Previous Years : 500) Debentures redeemable on
February 8, 2018 [150 Redeemable Non-Convertible Debentures of INR10,00,000
each bought back during the year] |
425.000 |
1000.000 |
|
9.40% 900 (Previous Years : 1000) Debentures redeemable on January 6, 2019 [100 Redeemable Non-Convertible Debentures of INR
10,00,000 each bought back during the year] |
900.000 |
1000.000 |
|
9.19% 1000 Debentures redeemable on December 24, 2018 |
1000.000 |
1000.000 |
|
9.35% 425 (Previous Years : 500) Debentures redeemable on February 8, 2019 and 425 (Previous Years : 500) Debentures redeemable on February 8, 2018 [150 Redeemable Non-Convertible Debentures of INR 10,00,000 each bought back during the year |
425.000 |
1000.000 |
|
9.40% 1000 Debentures redeemable on January 6, 2018 |
0.000 |
1000.000 |
|
|
|
|
|
SHORT TERM BORROWINGS |
|
|
|
Term Loans from
Bank |
|
|
|
Loan repayable on demand |
1701.700 |
0.000 |
|
|
|
|
|
Total |
27801.700 |
14500.000 |
CONTINGENT
LIABILITIES:
|
Particulars |
31.03.2017 (INR
In Million) |
31.03.2016 (INR
In Million) |
|
Sales Tax demands under BST Act, CST Act and VAT Act
against which the Company has preferred appeals. |
74.600 |
74.600 |
|
Demand from the Office of the Collector & District
Magistrate, Mumbai City and from Brihanmumbai Mahanagarpalika towards transfer
charges for transfer of premises not acknowledged by the Company. |
43.400 |
43.400 |
|
Demand for Custom Duty disputed by the Company [The
Company has given bank guarantees amounting to INR 36.300 million (as at
March 31, 2016 : INR 36.300 million; as at April 1, 2015 : INR 36.300
million) against the said Custom Duty demand] |
65.000 |
72.900 |
|
Service Tax Demands disputed by the Company |
0.000 |
47.500 |
|
Income Tax Demands for various Assessment Years disputed by the Company |
348.000 |
234.600 |
|
Demand for wharfage charges against which the Company has tendered a bank guarantee. Stay obtained under a Writ Petition filed against Chennai Port Trust for restraining encashment of bank guarantee. |
9.900 |
9.900 |
UNAUDITED FINANCIAL RESULTS FOR THE QUARTER AND HALF
YEAR ENDED 30.09.2017
(INR IN MILLION)
|
Particulars |
Quarter Ended 30.09.2017 |
Quarter Ended 30.06.2017 |
Half Year Ended 30.09.2017 |
|
|
(Unaudited) |
(Unaudited) |
(Unaudited) |
|
|
|
|
|
|
Income from operations |
|
|
|
|
Freight and Charter Hire |
4406.000 |
4585.700 |
8991.700 |
|
Other Operating Income |
66.600 |
62.500 |
129.100 |
|
Total Income |
4472.600 |
4648.200 |
9120.800 |
|
|
|
|
|
|
Other Income |
|
|
|
|
Profit on sale of ships and assets [Net] |
0.000 |
0.700 |
0.700 |
|
Grain/ (loss) on foreign currency transactions [net] |
77.900 |
(58.400) |
137.200 |
|
Grain on derivatives transaction [Net] |
800.500 |
802.700 |
1485.500 |
|
Other Income |
228.600 |
478.300 |
706.900 |
|
Total |
1107.000 |
1223.300 |
2330.300 |
|
|
|
|
|
|
Total Income |
5579.600 |
5871.500 |
11451.100 |
|
|
|
|
|
|
Expenses |
|
|
|
|
Employee
benefits expense |
1034.800 |
1015.600 |
2050.400 |
|
Finance
Costs |
865.500 |
787.800 |
1653.300 |
|
Depreciation
and amortisation expense |
1205.300 |
1158.800 |
2364.100 |
|
Impairment
on certain assets |
0.000 |
0.000 |
0.00 |
|
Other expenditure |
|
|
|
|
Fuel
oil and water |
664.700 |
678.200 |
7342.900 |
|
Port,
light and canal dues |
372.500 |
389.600 |
762.100 |
|
Hire
of chartered ships/ equipments |
2.000 |
68.400 |
70.400 |
|
consumption
od spares and stores |
378.600 |
288.900 |
667.500 |
|
Repairs
and maintenance |
202.600 |
303.000 |
505.600 |
|
Others
|
441.000 |
387.700 |
828.700 |
|
Total Expenses |
51670.000 |
5078.000 |
10245.000 |
|
|
|
|
|
|
Profit before tax |
412.600 |
793.500 |
1206.100 |
|
Tax
expense |
(50.000) |
70.000 |
20.000 |
|
Net profit/ loss for the year |
426.600 |
723.500 |
1186.100 |
|
Other comprehensive income |
|
|
|
|
Items
that will not be reclassified to profit or loss |
9.000 |
6.700 |
15.700 |
|
Income
tax relating to items that will not be reclassified to profit or loss |
0.000 |
0.000 |
0.000 |
|
Items
that will be reclassified to profit or loss |
4.500 |
5.800 |
10.300 |
|
Income
tax relating to items that will be reclassified to profit or loss |
5.300 |
(4.500) |
0.800 |
|
|
18.000 |
8.000 |
26.800 |
|
Total comprehensive income |
481.400 |
731.500 |
1212.900 |
|
Paid - up Equity Share Capital (Face value of INR 10/- per share) |
1507.800 |
1507.800 |
1507.800 |
|
Other Equity |
|
|
|
|
Debt Service Coverage ratio |
0.00 |
0.00 |
1.33 |
|
Interest services coverage ratio |
0.00 |
0.00 |
3.16 |
|
Debt Equity Ratio |
0.00 |
0.00 |
0.87 |
|
Earnings Per Share (EPS) |
|
|
|
|
a) Basic |
3.07 |
4.80 |
7.87 |
|
b) Diluted |
3.06 |
4.79 |
7.85 |
STANDALONE STATEMENT OF ASSETS AND LIABILITIES
|
SOURCES OF FUNDS |
30.09.2017 |
|
|
(Unaudited) |
|
I.
EQUITY
AND LIABILITIES |
|
|
Equity |
|
|
(a) Equity Share Capital |
1507.800 |
|
(b) Other Equity |
50191.300 |
|
Total
Shareholders’ Funds |
51699.100 |
|
|
|
|
Liabilities
|
|
|
Non-Current
Liabilities |
|
|
(a)
Financial Liabilities |
|
|
Borrowing |
39565.200 |
|
Provisions |
272.100 |
|
Differed tax liabilities |
0.000 |
|
Other non-current assets |
0.000 |
|
Total Non-current Liabilities |
39837.300 |
|
|
|
|
Current Liabilities |
|
|
(a)
Financial Liabilities |
|
|
Borrowing |
1714.800 |
|
Trade
payables |
990.300 |
|
Other Financial Liabilities |
10860.200 |
|
Other
Current Liabilities |
926.700 |
|
Provisions |
52.300 |
|
Current tax Labilities |
198.600 |
|
Sub Total
Current Liabilities |
14742.900 |
|
|
|
|
TOTAL EQUITY AND LIABILITIES |
106279.300 |
|
|
|
|
II.
ASSETS |
|
|
(1) Non-current assets |
|
|
Property, plant and Equipments |
57621.100 |
|
Capital work in progress |
420.100 |
|
Other intangible assets |
12.400 |
|
Intangible assets under development |
3.500 |
|
(D)Financial Assets |
|
|
Investments |
16696.000 |
|
Other Financial Assets
[Net] |
229.400 |
|
Current tax assets |
402.300 |
|
Differed tax Assets [Net] |
190.000 |
|
Other non-current assets |
40.500 |
|
Total Non-Current
Assets |
75615.300 |
|
|
|
|
(2) Current assets |
|
|
Inventories |
643.200 |
|
(b)Financial Assets |
|
|
Investments |
7583.900 |
|
Trade
receivables |
1046.200 |
|
Cash and
cash equivalents |
5465.100 |
|
Bank
Balance Other than |
14930.700 |
|
Other Financial liabilities |
67.600 |
|
Other current liabilities |
927.300 |
|
Sub Total
Current Assets |
30664.000 |
|
|
|
|
TOTAL
ASSETS |
106279.300 |
NOTES:
1. The above results have been reviewed by the Audit Committee and approved by the Board of Directors at their meeting held on November 10, 2017.The Statutory Auditors of the Company have carried out a Limited Review of the results for the quarter and six months year ended September 30, 2017.
2. During the quarter under review, the Company undertook the following transactions –
- contracted to buy and took delivery of a secondhand Long Range 2 Product Tanker (LR 2) built in 2009 renamed as “Jag Lokesh”.
- contracted to buy and took delivery of a secondhand Medium Gas Carrier built in 1997 renamed as “Jag Vijaya”.
1. The results for the quarter ended September 30, 2017, are available on the Bombay Stock Exchange website (URL:www.bseindia.com/corporates), the National Stock Exchange website (URL:www.nseindia.com/corporates) and on the Company website (URL: www.greatship.com/ financial_result.html).
2. Comparative financial information has been regrouped and reclassified, wherever necessary, to correspond to the figures of the current quarter / period.
CORPORATE INFORMATION
Subject (the Company) is a public limited company registered in India under the provisions of the Companies Act, 1913. Its shares are listed on the Bombay Stock Exchange and the National Stock Exchange of India and on the Luxembourg Stock Exchange. The Company is a major player in the Indian Shipping industry.
MANAGEMENT DISCUSSION AND
ANALYSIS
COMPANY PERFORMANCE
In Financial Year (FY) 17, the Company recorded a total
income of INR 22267.400 million (Previous year INR 21103.900 million) and
earned a PBIDT of INR 12619.700 crores (previous year `1,108.30 million).
ORDER BOOK AND
OUTLOOK
The tanker order book stands at about 12.6% of the fleet. The majority of this order book is slated to be delivered over the next 12 -15 months. As this order book delivers, coupled with the expected extension of OPEC cuts and lower refinery throughputs, the tanker freight markets are expected to remain subdued over the next 6-9 months where after secular demand is expected to make its effect felt on the markets.
The Dry Bulk order book stands at about 8.1% of the fleet and the majority of it is slated to be delivered over the next 12-15 months. Whilst this order book does not seem large, the Company has already seen a large growth in fleet over the last few years and thus it is critical that the order book does not grow. The strength in the freight markets coupled with low asset values is however encouraging owners to order more new buildings which can postpone the return of robust earnings for these vessels. The Company expects the market to plateau around the current earnings level over the next 6 months and the trajectory thereafter shall be guided by additional demand for dry bulk commodities and the increase/decrease of order book in the interim.
FIXED ASSETS:
- Fleet
- Land (Freehold and Perpetual Lease)
- Ownership Flats
- Buildings
- Plant and Equipment
- Furniture, Fixtures and
- Office Equipment
- Vehicles
PRESS RELEASE:
17.01.2018
G E SHIPPING TO SELL
SUPRAMAX VESSEL
The Great Eastern Shipping Co. Ltd (G E Shipping) has contracted to sell its 2003-built supramax dry bulk carrier Jag Rahul of about 52 364 DWT. The vessel will be delivered to the new buyer in Q4 FY 2017 – 2018.
The company’s current fleet (including Jag Rahul) stands at 48 vessels, comprising 32 tankers (12 crude carriers, 17 product tankers, three LPG carrier) and 16 dry bulk carriers (one capesize, eight kamsarmax, seven supramax) with an average age of 10.24 years aggregating 3.93 million DWT.
CMT REPORT (Corruption, Money Laundering & Terrorism]
The Public Notice information has been collected from various sources
including but not limited to: The Courts, India Prisons Service,
Interpol, etc.
1] INFORMATION ON
DESIGNATED PARTY
No records exist designating subject or any of its beneficial owners,
controlling shareholders or senior officers as terrorist or terrorist
organization or whom notice had been received that all financial transactions
involving their assets have been blocked or convicted, found guilty or against
whom a judgement or order had been entered in a proceedings for violating
money-laundering, anti-corruption or bribery or international economic or
anti-terrorism sanction laws or whose assets were seized, blocked, frozen or
ordered forfeited for violation of money laundering or international
anti-terrorism laws.
2] Court Declaration :
No records exist to suggest that subject is
or was the subject of any formal or informal allegations, prosecutions or other
official proceeding for making any prohibited payments or other improper
payments to government officials for engaging in prohibited transactions or
with designated parties.
3] Asset Declaration :
No records exist to suggest that the property or assets of the subject
are derived from criminal conduct or a prohibited transaction.
4] Record on Financial
Crime :
Charges or conviction
registered against subject: None
5] Records on Violation of
Anti-Corruption Laws :
Charges or
investigation registered against subject: None
6] Records on Int’l
Anti-Money Laundering Laws/Standards :
Charges or
investigation registered against subject: None
7] Criminal Records
No available
information exist that suggest that subject or any of its principals have been
formally charged or convicted by a competent governmental authority for any
financial crime or under any formal investigation by a competent government
authority for any violation of anti-corruption laws or international anti-money
laundering laws or standard.
8] Affiliation with
Government :
No record
exists to suggest that any director or indirect owners, controlling
shareholders, director, officer or employee of the company is a government
official or a family member or close business associate of a Government
official.
9] Compensation Package :
Our market
survey revealed that the amount of compensation sought by the subject is fair
and reasonable and comparable to compensation paid to others for similar
services.
10] Press Report :
No press reports / filings exists on
the subject.
CORPORATE GOVERNANCE
MIRA INFORM as part of its Due Diligence do provide comments on
Corporate Governance to identify management and governance. These factors often
have been predictive and in some cases have created vulnerabilities to credit
deterioration.
Our Governance Assessment focuses principally on the interactions
between a company’s management, its Board of Directors, Shareholders and other
financial stakeholders.
CONTRAVENTION
Subject is not known to have contravened any existing local laws,
regulations or policies that prohibit, restrict or otherwise affect the terms
and conditions that could be included in the agreement with the subject.
FOREIGN EXCHANGE RATES
|
Currency |
Unit
|
INR |
|
US Dollar |
1 |
INR 64.28 |
|
UK Pound |
1 |
INR 89.02 |
|
Euro |
1 |
INR 78.93 |
INFORMATION DETAILS
|
Analysis Done by
: |
NIY |
|
|
|
|
Report Prepared
by : |
RUP |
SCORE FACTORS
|
DEMERIT POINTS |
|
|
|
--BANK CHARGES |
YES/NO |
YES |
|
--LITIGATION |
YES/NO |
NO |
|
--OTHER ADVERSE INFORMATION |
YES/NO |
NO |
|
MERIT POINTS |
|
|
|
--SOLE DISTRIBUTORSHIP |
YES/NO |
NO |
|
--EXPORT ACTIVITIES |
YES/NO |
NO |
|
--AFFILIATION |
YES/NO |
YES |
|
--LISTED |
YES/NO |
YES |
|
--OTHER MERIT FACTORS |
YES/NO |
YES |
RATING EXPLANATIONS
|
Credit Rating |
Explanation |
Rating Comments |
|
A++ |
Minimum Risk |
Business dealings permissible with minimum
risk of default |
|
A+ |
Low Risk |
Business dealings permissible with low
risk of default |
|
A |
Acceptable Risk |
Business dealings permissible with
moderate risk of default |
|
B |
Medium Risk |
Business dealings permissible on a regular
monitoring basis |
|
C |
Medium High Risk |
Business dealings permissible preferably
on secured basis |
|
D |
High Risk |
Business dealing not recommended or on
secured terms only |
|
NB |
New Business |
No recommendation can be done due to
business in infancy stage |
|
NT |
No Trace |
No recommendation can be done as the
business is not traceable |
NB is stated where there is insufficient information to facilitate rating. However, it is not to be considered as unfavourable.
This score serves as a reference to assess
SC’s credit risk and to set the amount of credit to be extended. It is
calculated from a composite of weighted scores obtained from each of the major
sections of this report. The assessed factors are as follows:
·
Financial
condition covering various ratios
·
Company
background and operations size
·
Promoters
/ Management background
·
Payment
record
·
Litigation
against the subject
·
Industry
scenario / competitor analysis
·
Supplier
/ Customer / Banker review (wherever available)
This report is issued at
your request without any risk and responsibility on the part of MIRA INFORM
PRIVATE LIMITED (MIPL) or its officials.