|
|
|


MIRA INFORM REPORT
|
Report No. : |
491312 |
|
Report Date : |
16.02.2018 |
IDENTIFICATION DETAILS
|
Name : |
MANA PHARMA SL |
|
|
|
|
Registered Office : |
Crta. Fuencarral, Km 22. - Alcobendas - 28108 – Madrid |
|
|
|
|
Country : |
Spain |
|
|
|
|
Financials (as on) : |
2016 |
|
|
|
|
Date of Incorporation : |
22.05.2015 |
|
|
|
|
Legal Form : |
Private Company |
|
|
|
|
Line of Business : |
The subject is engaged in the intermediation of commerce in the sale
of medications, pharmaceutical products and complements. |
|
|
|
|
No. of Employees : |
2 [2018] |
RATING & COMMENTS
(Mira Inform has adopted New Rating mechanism w.e.f. 23rd
January 2017)
|
MIRA’s Rating : |
A+ |
|
Credit Rating |
Explanation |
Rating Comments |
|
A+ |
Low Risk |
Business dealings permissible with low
risk of default |
|
Status : |
Good |
|
|
|
|
Payment Behaviour : |
Slow |
|
|
|
|
Litigation : |
Clear |
NOTES :
Any query related to this report can be made
on e-mail : infodept@mirainform.com
while quoting report number, name and date.
ECGC Country Risk Classification List
|
Country Name |
Previous Rating (30.06.2017) |
Current Rating (30.09.2017) |
|
Spain |
A1 |
A1 |
|
Risk Category |
ECGC
Classification |
|
Insignificant |
A1 |
|
Low Risk |
A2 |
|
Moderately Low Risk |
B1 |
|
Moderate Risk |
B2 |
|
Moderately High Risk |
C1 |
|
High Risk |
C2 |
|
Very High Risk |
D |
SPAIN - ECONOMIC OVERVIEW
After experiencing a prolonged recession in the wake of the global financial
crisis that began in 2008, in 2017 Spain marked the fourth full year of
positive economic growth in ten years, largely due to increased private
consumption. At the onset of the financial crisis, Spain's GDP contracted by
3.7% in 2009, ending a 16-year growth trend, and continued contracting through
most of 2013. In that year, the government successfully shored up struggling
banks - exposed to the collapse of Spain's depressed real estate and
construction sectors - and in January 2014 completed an EU-funded restructuring
and recapitalization program for its financial sector.
Until 2014, credit contraction in the private sector, fiscal austerity,
and high unemployment weighed on domestic consumption and investment. The
unemployment rate rose from a low of about 8% in 2007 to more than 26% in 2013,
but labor reforms prompted a modest reduction to 17% in 2017. High unemployment
has strained Spain's public finances, as spending on social benefits increased
while tax revenues fell. Spain’s budget deficit peaked at 11.4% of GDP in 2010,
but Spain gradually reduced the deficit to about 3.3% of GDP in 2017. Public
debt has increased substantially – from 60.1% of GDP in 2010 to nearly 96.7% in
2017.
Exports were resilient throughout the economic downturn and helped to
bring Spain's current account into surplus in 2013 for the first time since
1986, where it remained through 2016. Rising labor productivity and an internal
devaluation resulting from moderating labor costs and lower inflation have
helped to improve foreign investor interest in the economy and positive FDI
flows have been restored.
Political gridlock after the national elections in December 2015 and
June 2016 and ensuing government formation process constrained the caretaker
government’s ability to implement needed labor, pension, health care, tax, and
education reforms— in 2016. The European Commission criticized Spain’s 2016
budget for easing austerity measures and for its alleged overly optimistic
growth and deficit projections. Spain’s borrowing costs are dramatically lower
since their peak in mid-2012, and with the recent uptick in economic activity,
inflation has reappeared, at 2% per year.
|
Source
: CIA |
EXECUTIVE
SUMMARY
|
|
Name: |
MANA PHARMA SL |
|
NIF / Fiscal code: |
B87295101 |
|
Status: |
ACTIVE |
|
Incorporation Date: |
22/05/2015 |
|
Register Data |
Register Section 8 Sheet 603629 |
|
Last Publication
in BORME: |
16/01/2018 [Appointments] |
|
Last Published Account Deposit: |
2016 |
|
Share Capital: |
7.000 |
|
|
|
|
Localization: |
CRTA. FUENCARRAL, KM 22. - ALCOBENDAS - 28108 - MADRID |
|
Telephone - Fax - Email - Website: |
Telephone. 683 761 106 / 910 684 450 Email.
info@manapharma.net/omartinez@manapharma.net Website. www.manapharma.es/ |
|
|
|
|
Activity: |
|
|
NACE: |
4646 - Wholesale of pharmaceutical goods |
|
Registered Trademarks: |
|
|
Audited / Opinion: |
No |
|
Tenders and Awards: |
|
|
Subsidies: |
0 for a total cost of 0 |
|
Quality Certificate: |
No |
|
|
|
|
Payment Behaviour: |
According to the agreed terms |
|
Prospects: |
Consolidation |
|
Industry situation: |
Maturity |
|
|
|
|
Defaults, Legal Claims
and Insolvency Proceedings : |
|
|
|
|
Number |
Amount (€) |
Most Recent
Entry |
|
Insolvency Proceedings, Bankruptcy and Suspension of Payments |
|
Unpublished |
--- |
--- |
|
Defaults on debt with Financial Institutions and Large Companies |
|
None |
--- |
--- |
|
Judicial Claims (Notices, Executive Proceedings, Attachments,
Auctions, Bad Debt) |
|
None |
0 |
--- |
|
Proceedings heard by the Civil Court |
|
Unpublished |
0 |
--- |
|
Proceedings heard by the Labour Court |
|
Unpublished |
0 |
--- |
|
Partners: |
|
Shares: |
0 |
|
|
Other Links: |
0 |
|
|
No. of Active Corporate Bodies: |
JOINT MANAGER 2 |
|
|
Ratios |
2016 |
2015 |
Change |
|
|
Guarantees: |
|
|
Properties Registered: |
Company NO, Administrator NO |
|
Financing / Guarantee Sources : |
Sources NO, Guarantees NO |
|
|
|
|
INVESTIGATION
SUMMARY |
|
|
The Company was incorporated in 2015, engaged in the pharmaceutical
distribution, it operates normally. Its scope for action is very good, which
means that part of the current assets are being financed with permanent
resources (own and non-long term), which indicates that the company maintains
a correct financial turnover. |
|
|
Interviewed Person: |
|
Enquiry
Details
|
|
|
Business address
regime: |
Rented |
Identification
|
|
|
Social
Denomination: |
MANA PHARMA SL |
|
NIF / Fiscal
code: |
B87295101 |
|
Corporate
Status: |
ACTIVE |
|
Start of
activity: |
2015 |
|
Registered
Office: |
CRTA. FUENCARRAL, KM 22. |
|
Locality: |
ALCOBENDAS |
|
Province: |
MADRID |
|
Postal Code: |
28108 |
|
Telephone: |
683 761 106 / 910 684 450 |
|
Fax: |
910 684 456 |
|
Website: |
www.manapharma.es/ |
|
Email: |
info@manapharma.net/omartinez@manapharma.net |
|
Interviewed
Person: |
Ms. Olga Martínez |
Activity
|
|
|
NACE: |
4646 |
|
Corporate
Purpose: |
THE SUBJECT IS ENGAGED IN THE INTERMEDIATION OF COMMERCE IN THE SALE
OF MEDICATIONS, PHARMACEUTICAL PRODUCTS AND COMPLEMENTS. |
|
Additional
Information: |
It is engaged in the export and marketing of medications, sanitary
products, cosmetics and other pharmaceutical products. |
|
Additional
Address: |
Registered office, offices, rented and located in: CRTA. FUENCARRAL,
KM 22. 28108 ALCOBENDAS ( MADRID ) Warehouse located in: CTRA FUENCARRAL A
ALCOBENDAS , 6 28050 MADRID Previously had its registered office in:C/
Venecia, 16 28420 GALAPAGAR ( MADRID ). |
|
Import / export: |
IMPORT / EXPORT |
|
Future
Perspective: |
Consolidation |
|
Industry
situation: |
Maturity |
Number
of Employees
|
|
Year |
No. of employees |
Established |
Incidentals |
|
2018 |
2 |
|
|
The data of employees is from the latest available financial statements
in axesor. Failing that, are estimates data calculated by statistical methods
Chronological
Summary
|
|||
|
|
Year |
Act |
|
|
|
2015 |
Appointments/ Re-elections (1) Change of Social Purpose (1) Company
Formation (1) |
|
|
|
2016 |
Accounts deposit (year 2015) |
|
|
|
2017 |
Accounts deposit (year 2016) Change of Social address (1) |
|
|
|
2018 |
Appointments/ Re-elections (1) |
|
Breakdown
of Owners' Equity
|
|
|
Registered
Capital: |
7.000 |
|
Paid up capital: |
7.000 |
Shareholders
|
|
Name |
NIF |
% Shareholding
stake |
|
MANUEL ALONSO SECO |
|
% |
|
MANAVI TABATABI KATAYUN |
|
% |
Updated
Evolution of the Subscribed and Paid-in Capital
|
|||||
|
|
|||||
|
Publishing Date |
Registration
Type |
Capital
Subscribed |
Paid up capital |
Underwritten
result |
Disbursed Result |
|
03/06/2015 |
Company Formation |
7.000 |
7.000 |
7.000 |
7.000 |
Active
Social Bodies
|
|
Post published |
Social Body's
Name |
Appointment Date |
Other Positions
in this Company |
|
JOINT MANAGER |
ALONSO SECO MANUEL |
03/06/2015 |
1 |
|
|
MANAVI TABATABI KATAYUN |
03/06/2015 |
1 |
|
ACCOUNTS' AUDITOR / HOLDER |
FEDATA AUDITORES SLP |
08/01/2018 |
1 |
Historical
Social Bodies
|
|
Social Body's Name |
Post published |
End Date |
Other Positions in this Company |
|
|
| //c\\ |
|
|
Executive
board
|
||
|
|
|
|
|
Post |
NIF |
Name |
|
ADMINISTRATOR |
|
MANAVI TABATABI KATAYUN |
|
ADMINISTRATOR |
|
MANUEL ALONSO SECO |
Defaults,
Legal Claims and Insolvency Proceedings
|
Section enabling assessment of the degree of compliance of the company queried
with its payment obligations. It provides information on the existence and
nature of all stages of Insolvency and Legal Proceedings published with
reference to the Company in the country's various Official Bulletins and
national newspapers, as well Defaults Registered in the main national credit
bureaus (ASNEF Industrial and RAI ).
> Summary
Chronological summary
|
|
|
Number of
Publications |
Amount (€) |
Start date |
End date |
|
Insolvency Proceedings, Bankruptcy and Suspension of Payments |
|
Unpublished |
--- |
--- |
--- |
|
Request/Declaration |
|
0 |
--- |
date |
|
|
Proceedings |
|
--- |
--- |
|
--- |
|
Resolution |
|
--- |
--- |
|
--- |
|
Defaults on debt with Financial Institutions and Large Companies |
Bank and Commercial Delinquency |
None |
0 |
|
|
|
Status: Friendly |
|
--- |
|
|
|
|
Status: Pre-Litigation |
|
--- |
|
|
|
|
Status: Litigation |
|
--- |
|
|
|
|
Status: Non-performing |
|
--- |
|
|
|
|
Status: insolvency proceedings, bankruptcy and suspension of payments |
|
--- |
|
|
|
|
Other status |
|
--- |
|
|
|
|
Legal and Administrative Proceedings |
|
Unpublished |
--- |
|
|
|
Notices of defaults and enforcement |
|
--- |
--- |
|
--- |
|
Seizures |
|
--- |
--- |
|
--- |
|
Auctions |
|
--- |
--- |
|
--- |
|
Declarations of insolvency and bad debt |
|
--- |
--- |
|
--- |
|
Proceedings heard by the Civil Court |
|
Unpublished |
--- |
|
|
|
Proceedings heard by the Labour Court |
|
Unpublished |
--- |
|
|
> Details
Probability of default
|
> Estimated Probability of Default for the next 12 months:
0.573 %
|
Sector in which comparison is carried out: 464 Wholesale of household goods |
|
|
Relative Position:
|
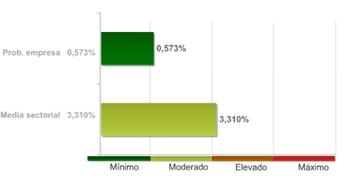
The company's comparative analysis with the rest of the companies that
comprise the sector, shows the company holds a better position with regard to
the probability of non-compliance.
The 99.00% of the companies of the sector MANA PHARMA SL belongs to show
a higher probability of non-compliance.
The probability of the company's non-compliance with its payment
obligations within deadlines estimated by our qualifications models is 0,573%.
In the event they fail to comply with the payment, the seriousness of
the loss will depend on factors such as the promptness of the commencement of
the charging management, the existence of executive documents which match the
credit or the existence of guarantees and free debt assets under the name of
the debtor. Therefore, the probability of non-compliance should not be solely
interpreted as the total loss of the owed amount.
LEGAL CLAIMS
|
|
Summary of Judicial Claims |
|
|
|
|
|
|
|
Not published |
|
|
|
Not published |
|
|
|
|
|
|
|
Not published |
|
|
|
Not published |
|
|
|
Not published |
|
|
|
Not published |
|
|
|
|
|
|
|
Not published |
|
|
|
Not published |
|
|
|
|
|
|
|
Not published |
Turnover
|
|
|
Total Sales 2017 |
11.000.000 |
The sales data is from the latest available financial statements in
axesor. Failing that, are estimates data calculated by statistical methods.
Financial
Accounts and Balance Sheets
|
Financial Years
Presented
|
Ejercicio |
Tipo de Cuentas Anuales |
Fecha Presentacion |
|
2016 |
Normales |
September 2017 |
|
2015 |
Normales |
October 2016 |
The data in the
report regarding the last Company Accounts submitted by the company is taken from
the TRADE REGISTER serving the region in which the company's address is located
31/12/2016
> Balance en formato Pyme de acuerdo al Nuevo Plan General
Contable 2007
Information
corresponding to the fiscal year 2016 2015 is taken from information
submitted to the TRADE REGISTER. Data corresponding to fiscal years before
2016 2015 has been compiled based on the equivalence criteria
stipulated in Act JUS/206/2009. Where the provisions of the Act did not
establish relevant equivalence criteria, such criteria using its own
methodology. To view details on the methodology.
|
|
ORIGINAL |
ORIGINAL |
|
|
Assets |
2016 |
2015 |
|
|
A) NON-CURRENT ASSETS: 11000 |
1.927,00 |
2.168,00 |
|
|
I. Intangible fixed assets : 11100 |
0,00 |
0,00 |
|
|
II. Tangible fixed assets : 11200 |
1.927,00 |
2.168,00 |
|
|
III. Real estate investment: 11300 |
0,00 |
0,00 |
|
|
IV. Long-term investments in Group companies and
associates : 11400 |
0,00 |
0,00 |
|
|
V. Long-term financial investments: 11500 |
0,00 |
0,00 |
|
|
VI. Assets for deferred tax : 11600 |
0,00 |
0,00 |
|
|
VII. Non-current trade debtors : 11700 |
0,00 |
0,00 |
|
|
B) CURRENT ASSETS: 12000 |
4.670.189,00 |
1.452.080,00 |
|
|
I. Stocks : 12200 |
0,00 |
0,00 |
|
|
II. Trade debtors and others receivable accounts
: 12300 |
4.173.582,00 |
1.445.362,00 |
|
|
1. Trade debtors / accounts
receivable: 12380 |
4.161.125,00 |
1.442.439,00 |
|
|
a)
Long-term receivables from sales and services supplied : 12381 |
0,00 |
0,00 |
|
|
b)
Customers for sales and provisions of services : 12382 |
4.161.125,00 |
1.442.439,00 |
|
|
2. Called up share capital:
12370 |
0,00 |
0,00 |
|
|
3. Other accounts receivable
: 12390 |
12.458,00 |
2.924,00 |
|
|
III. Short-term investment in Group companies and
associates: 12400 |
0,00 |
0,00 |
|
|
IV. Short-term financial investments :
12500 |
0,00 |
0,00 |
|
|
V. Short-term accruals : 12600 |
0,00 |
0,00 |
|
|
VI. Cash and other equivalent liquid assets :
12700 |
496.607,00 |
6.718,00 |
|
|
TOTAL ASSETS (A + B) : 10000 |
4.672.117,00 |
1.454.248,00 |
|
|
|
ORIGINAL |
ORIGINAL |
|
|
Liabilities and
Net Worth |
2016 |
2015 |
|
|
A) NET WORTH: 20000 |
2.018.392,00 |
438.716,00 |
|
|
A-1) Shareholders' equity: 21000 |
2.018.392,00 |
438.716,00 |
|
|
I. Capital: 21100 |
7.000,00 |
7.000,00 |
|
|
1. Registered capital :
21110 |
7.000,00 |
7.000,00 |
|
|
2. (Uncalled capital):
21120 |
0,00 |
0,00 |
|
|
II. Share premium: 21200 |
0,00 |
0,00 |
|
|
III. Reserves: 21300 |
1.400,00 |
0,00 |
|
|
1. Capitalisation Reserves:
21350 |
0,00 |
0,00 |
|
|
2. Otras Reservas:
21360 |
1.400,00 |
0,00 |
|
|
IV. (Common stock equity): 21400 |
0,00 |
0,00 |
|
|
V. Profit or loss brought forward: 21500 |
430.316,00 |
0,00 |
|
|
VI. Other shareholders' contributions:
21600 |
0,00 |
0,00 |
|
|
VII. Result of the period: 21700 |
1.579.676,00 |
431.716,00 |
|
|
VIII. (Interim dividend): 21800 |
0,00 |
0,00 |
|
|
A-2) Changes in net worth : 22000 |
0,00 |
0,00 |
|
|
A-3) Received subsidies, donations and legacies: 23000 |
0,00 |
0,00 |
|
|
B) NON-CURRENT LIABILITIES: 31000 |
0,00 |
0,00 |
|
|
I. Long-term provisions: 31100 |
0,00 |
0,00 |
|
|
II. Long-term creditors : 31200 |
0,00 |
0,00 |
|
|
1. Amounts owed to credit
institutions: 31220 |
0,00 |
0,00 |
|
|
2. Creditors from financial
leasing : 31230 |
0,00 |
0,00 |
|
|
3. Other long-term creditors
: 31290 |
0,00 |
0,00 |
|
|
III. Long-term debts with Group companies and
associates: 31300 |
0,00 |
0,00 |
|
|
IV. Liabilities for deferred tax: 31400 |
0,00 |
0,00 |
|
|
V. Long-term accruals: 31500 |
0,00 |
0,00 |
|
|
VI. Non-current trade creditors : 31600 |
0,00 |
0,00 |
|
|
VII. Special long-term debts : 31700 |
0,00 |
0,00 |
|
|
C) CURRENT LIABILITIES : 32000 |
2.653.724,00 |
1.015.532,00 |
|
|
I. Short-term provisions: 32200 |
0,00 |
0,00 |
|
|
II. Short-term creditors : 32300 |
19.312,00 |
91.315,00 |
|
|
1. Amounts owed to credit
institutions: 32320 |
0,00 |
0,00 |
|
|
2. Creditors from financial
leasing : 32330 |
0,00 |
0,00 |
|
|
3. Other short-term
creditors : 32390 |
19.312,00 |
91.315,00 |
|
|
III. Short-term amounts owed to group and
associated companies: 32400 |
0,00 |
0,00 |
|
|
IV. Trade creditors and other accounts payable:
32500 |
2.634.412,00 |
924.217,00 |
|
|
1. Suppliers: 32580 |
2.309.144,00 |
772.679,00 |
|
|
a)
Long-term debts : 32581 |
0,00 |
0,00 |
|
|
b) Short-term
debts : 32582 |
2.309.144,00 |
772.679,00 |
|
|
2. Other creditors:
32590 |
325.268,00 |
151.539,00 |
|
|
V. Short-term accruals : 32600 |
0,00 |
0,00 |
|
|
VI. Special short-term debts : 32700 |
0,00 |
0,00 |
|
|
TOTAL NET WORTH AND LIABILITIES (A + B + C) : 30000 |
4.672.117,00 |
1.454.248,00 |
|
|
|
ORIGINAL |
ORIGINAL |
|
|
Profit and
Loss |
2016 |
2015 |
|
|
1. Net turnover: 40100 |
10.657.343,00 |
2.435.673,00 |
|
|
2. Changes in stocks of finished goods and work
in progress: 40200 |
0,00 |
0,00 |
|
|
3. Works carried out by the company for its
assets: 40300 |
0,00 |
0,00 |
|
|
4. Supplies : 40400 |
-8.355.056,00 |
-1.804.036,00 |
|
|
5. Other operating income: 40500 |
0,00 |
0,00 |
|
|
6. Personnel costs: 40600 |
-261.165,00 |
-80.000,00 |
|
|
7. Other operating costs: 40700 |
-142.332,00 |
-43.495,00 |
|
|
8. Amortisation of fixed assets: 40800 |
-241,00 |
-241,00 |
|
|
9. Allocation of subsidies of non-financial fixed
assets and other: 40900 |
0,00 |
0,00 |
|
|
10. Excess provisions : 41000 |
0,00 |
0,00 |
|
|
11. Impairment and result of transfers of fixed
assets: 41100 |
0,00 |
0,00 |
|
|
12. Other results : 41300 |
0,00 |
0,00 |
|
|
A) OPERATING INCOME (1 + 2 + 3 + 4 + 5 + 6 + 7 + 8 + 9 + 10 + 11 + 12)
: 49100 |
1.898.548,00 |
507.901,00 |
|
|
13. Financial income : 41400 |
221,00 |
0,00 |
|
|
a) Allocation of financial
subsidies, donations and legacies: 41430 |
0,00 |
0,00 |
|
|
b) Other financial income:
41490 |
221,00 |
0,00 |
|
|
14. Financial expenditure : 41500 |
-51.621,00 |
0,00 |
|
|
15. Changes in fair value of financial
instruments : 41600 |
0,00 |
0,00 |
|
|
16. Exchange rate differences: 41700 |
0,00 |
0,00 |
|
|
17. Impairment and result for transfers of
financial instruments : 41800 |
0,00 |
0,00 |
|
|
18. Other financial income and expenditure:
42100 |
0,00 |
0,00 |
|
|
a) Incorporation of
financial expenditure to assets: 42110 |
0,00 |
0,00 |
|
|
b) Financial income from
arrangement with creditors: 42120 |
0,00 |
0,00 |
|
|
c) Other income and
expenditure: 42130 |
0,00 |
0,00 |
|
|
B) FINANCIAL REVENUE ( 13 + 14 + 15 + 16 + 17 +18 ) : 49200 |
-51.400,00 |
0,00 |
|
|
C) NET RESULT BEFORE TAXES ( A + B ) : 49300 |
1.847.148,00 |
507.901,00 |
|
|
19. Income taxes : 41900 |
-267.472,00 |
-76.185,00 |
|
|
D) RESULT OF THE PERIOD ( C + 19 ) : 49500 |
1.579.676,00 |
431.716,00 |
|
CASHFLOW
STATEMENT
|
Model: Normal
> Source of information: Data contained in this section is taken from
the information declared in the Annual Accounts submitted to the Trade
Register.
|
Net Rights
Granted |
2016 |
2015 |
|
|
1. Fiscal year result before taxes.: 61100 |
1.847.148,00 |
507.901,00 |
|
|
2. Results adjustments.: 61200 |
51.641,00 |
241,00 |
|
|
a) Fixed Assets Amortization (+).: 61201 |
241,00 |
241,00 |
|
|
g) Financial income (-).: 61207 |
-221,00 |
0,00 |
|
|
h) Financial Expenses (+). : 61208 |
51.621,00 |
0,00 |
|
|
3. Changes in current capital equity.: 61300 |
-1.285.497,00 |
-597.330,00 |
|
|
d) Debtors and other accounts receivable (+/-). :
61302 |
-2.728.220,00 |
-1.445.362,00 |
|
|
d) Creditors and other accounts payable (+/-). :
61304 |
1.442.723,00 |
848.032,00 |
|
|
4. Cash Flows from Other Operating Activities: 61400 |
-51.400,00 |
0,00 |
|
|
a) Interest payments (-). : 61401 |
-51.621,00 |
0,00 |
|
|
c) Interest collection (+). : 61403 |
221,00 |
0,00 |
|
|
5. Cash Flows from Operating Activities (1 + 2 + 3 + 4) : 61500 |
561.892,00 |
-89.188,00 |
|
|
6. Payments for investment (-).: 62100 |
0,00 |
-2.168,00 |
|
|
c) Fixed assets. : 62103 |
0,00 |
-2.168,00 |
|
|
7. Divestment payment collection (+). : 62200 |
241,00 |
0,00 |
|
|
c) Fixed assets. : 62203 |
241,00 |
0,00 |
|
|
8. Cash Flow from Investing Activities (6+7) less Amortization:
62300 |
0,00 |
-2.409,00 |
|
|
9. Payment collection and payments for equity instruments. :
63100 |
0,00 |
7.000,00 |
|
|
a) Issuance of equity instruments (+). :
63101 |
0,00 |
7.000,00 |
|
|
10. Payment collection and payments for financial liabilities
instruments.: 63200 |
-72.003,00 |
91.315,00 |
|
|
a) Issuance : 63201 |
0,00 |
91.315,00 |
|
|
5. Other debts (+). : 63206 |
0,00 |
91.315,00 |
|
|
b) Repayment and amortization of : 63207 |
-72.003,00 |
0,00 |
|
|
5. Other debts (-). : 63212 |
-72.003,00 |
0,00 |
|
|
11. Payments from dividends and remunerations from other assets
instruments. : 63300 |
0,00 |
0,00 |
|
|
12. Cash Flows from Financing Activities (9+10+11): 63400 |
-72.003,00 |
98.315,00 |
|
|
D) EFFECT OF EXCHANGE RATE CHANGES: 64000 |
0,00 |
0,00 |
|
|
E) NET INCREASE/DECREASE OF CASH OR EQUIVALENT ASSETS
(+/-5+/-8+/12+/-D) : 65000 |
489.889,00 |
6.718,00 |
|
|
Cash or equivalent assets as of beginning of the
fiscal year.: 65100 |
6.718,00 |
0,00 |
|
|
Cash or equivalent assets as of end of the fiscal
year.: 65200 |
496.607,00 |
6.718,00 |
|
FINANCIAL
DIAGNOSIS
|
> Economic-Financial Comparative Analysis
Data used in the following ratios and indicators is taken from the
Annual Accounts submitted by the company to the TRADE REGISTER.
> Comparison within the Sector
|
Cash Flow |
2016 |
2015 |
Variación 2016 -
2015 |
|
|||
|
|
Empresa |
Sector |
Empresa |
Sector |
Empresa |
Sector |
|
|
Cash Flow over Sales: |
0,05 % |
0,01 % |
0,00 % |
0,01 % |
|
10,77 % |
|
|
Net Financial Debt: |
-0,25 |
1,83 |
0,17 |
2,16 |
-250,99 |
-15,49 |
|
|
Cash Flow Yield: |
0,10 % |
0,01 % |
0,00 % |
0,01 % |
|
7,71 % |
|
|
EBITDA over Sales: |
17,82 % |
6,68 % |
20,86 % |
6,39 % |
-14,60 % |
4,53 % |
|
|
Profitability |
2016 |
2015 |
Variación 2016 -
2015 |
|
|||
|
|
Empresa |
Sector |
Empresa |
Sector |
Empresa |
Sector |
|
|
Operating economic profitability: |
40,64 % |
4,39 % |
34,93 % |
3,92 % |
16,35 % |
12,05 % |
|
|
Total economic profitability: |
40,64 % |
4,44 % |
34,93 % |
3,96 % |
16,36 % |
12,28 % |
|
|
Financial profitability: |
78,26 % |
5,55 % |
98,40 % |
4,60 % |
-20,47 % |
20,73 % |
|
|
Margin: |
17,81 % |
4,45 % |
20,85 % |
3,94 % |
-14,57 % |
13,07 % |
|
|
Mark-up: |
17,33 % |
4,49 % |
20,85 % |
3,56 % |
-16,88 % |
25,95 % |
|
|
Solvency |
2016 |
2015 |
Variación 2016 -
2015 |
|
|||
|
|
Empresa |
Sector |
Empresa |
Sector |
Empresa |
Sector |
|
|
Liquidity: |
0,19 |
0,38 |
0,01 |
0,34 |
2.728,96 |
12,46 |
|
|
Acid Test: |
1,76 |
1,19 |
1,43 |
1,17 |
23,08 |
1,72 |
|
|
Working Capital / Investment: |
0,43 |
0,23 |
0,30 |
0,21 |
43,78 |
10,07 |
|
|
Solvency: |
1,76 |
1,88 |
1,43 |
1,78 |
23,08 |
5,68 |
|
|
Indebtedness |
2016 |
2015 |
Variación 2016 -
2015 |
|
|||
|
|
Empresa |
Sector |
Empresa |
Sector |
Empresa |
Sector |
|
|
Indebtedness level: |
1,31 |
0,85 |
2,31 |
0,92 |
-43,20 |
-6,69 |
|
|
Borrowing Composition: |
0,00 |
0,66 |
0,00 |
0,67 |
|
-1,40 |
|
|
Repayment Ability: |
1,40 |
8,98 |
2,00 |
9,47 |
-30,07 |
-5,15 |
|
|
Warranty: |
1,76 |
2,17 |
1,43 |
2,09 |
22,95 |
3,73 |
|
|
Generated resources / Total creditors: |
0,60 |
0,10 |
0,43 |
0,09 |
39,97 |
9,42 |
|
|
Efficiency |
2016 |
2015 |
Variación 2016 -
2015 |
|
|||
|
|
Empresa |
Sector |
Empresa |
Sector |
Empresa |
Sector |
|
|
Productivity: |
8,27 |
1,30 |
7,35 |
1,30 |
12,50 |
0,16 |
|
|
Turnover of Collection Rights : |
2,55 |
4,85 |
1,69 |
4,74 |
51,53 |
2,31 |
|
|
Turnover of Payment Entitlements: |
3,23 |
3,12 |
2,00 |
3,16 |
61,36 |
-1,19 |
|
|
Stock rotation: |
|
4,30 |
|
4,91 |
|
-12,59 |
|
|
Assets turnover: |
2,28 |
0,99 |
1,67 |
0,99 |
36,19 |
-0,90 |
|
|
Borrowing Cost: |
1,95 |
1,53 |
0,00 |
1,77 |
|
-13,42 |
|
> Trend of indicators under the General Accounting Plan of 2007
(2016, 2015)
|
Cash Flow |
2016 |
2015 |
|
|
Cash Flow over Sales: |
0,05 % |
0,00 % |
|
|
Net Financial Debt: |
-0,25 |
0,17 |
|
|
Cash Flow Yield: |
0,10 % |
0,00 % |
|
|
EBITDA over Sales: |
17,82 % |
20,86 % |
|
|
Profitability |
2016 |
2015 |
|
|
Operating economic profitability: |
40,64 % |
34,93 % |
|
|
Total economic profitability: |
40,64 % |
34,93 % |
|
|
Financial profitability: |
78,26 % |
98,40 % |
|
|
Margin: |
17,81 % |
20,85 % |
|
|
Mark-up: |
17,33 % |
20,85 % |
|
|
Solvency |
2016 |
2015 |
|
|
Liquidity: |
0,19 |
0,01 |
|
|
Acid Test: |
1,76 |
1,43 |
|
|
Working Capital / Investment: |
0,43 |
0,30 |
|
|
Solvency: |
1,76 |
1,43 |
|
|
Indebtedness |
2016 |
2015 |
|
|
Indebtedness level: |
1,31 |
2,31 |
|
|
Borrowing Composition: |
0,00 |
0,00 |
|
|
Repayment Ability: |
1,40 |
2,00 |
|
|
Warranty: |
1,76 |
1,43 |
|
|
Generated resources / Total creditors: |
0,60 |
0,43 |
|
|
Efficiency |
2016 |
2015 |
|
|
Productivity: |
8,27 |
7,35 |
|
|
Turnover of Collection Rights : |
2,55 |
1,69 |
|
|
Turnover of Payment Entitlements: |
3,23 |
2,00 |
|
|
Assets turnover: |
2,28 |
1,67 |
|
|
Borrowing Cost: |
1,95 |
0,00 |
|
COMPARATIVE SECTORIAL BALANCE
|
Sector-based Comparison under
the rules of the New General Accounting Plan.
|
Net Rights Granted |
Variación - |
|
|
|
Empresa |
Sector |
|
Net Rights Granted |
Variación - |
|
|
|
Empresa |
Sector |
|
Net Rights Granted |
Variación - |
|
|
|
Empresa |
Sector |
Public
Tenders and Works Won
|
No Public Tenders assigned to the name of the company.
Research
Summary
|
|
The Company was incorporated in 2015, engaged in the pharmaceutical distribution,
it operates normally. Its scope for action is very good, which means that
part of the current assets are being financed with permanent resources (own
and non-long term), which indicates that the company maintains a correct
financial turnover. |
Sources
|
|
Registry of Commerce's Official Gazette. Own and external data bases
Company References |
FOREIGN EXCHANGE RATES
|
Currency |
Unit
|
Indian Rupees |
|
US Dollar |
1 |
INR 63.92 |
|
|
1 |
INR 89.55 |
|
Euro |
1 |
INR 79.68 |
|
Euro |
1 |
INR 80.18 |
Note :
Above are approximate rates obtained from sources believed to be correct
INFORMATION DETAILS
|
Analysis Done by
: |
NIY |
|
|
|
|
Report Prepared
by : |
TPT |
RATING EXPLANATIONS
|
Credit Rating |
Explanation |
Rating Comments |
|
A++ |
Minimum Risk |
Business dealings permissible with minimum
risk of default |
|
A+ |
Low Risk |
Business dealings permissible with low
risk of default |
|
A |
Acceptable Risk |
Business dealings permissible with moderate
risk of default |
|
B |
Medium Risk |
Business dealings permissible on a regular
monitoring basis |
|
C |
Medium High Risk |
Business dealings permissible preferably
on secured basis |
|
D |
High Risk |
Business dealing not recommended or on secured
terms only |
|
NB |
New Business |
No recommendation can be done due to
business in infancy stage |
|
NT |
No Trace |
No recommendation can be done as the
business is not traceable |
NB is stated where there is insufficient information to facilitate rating. However, it is not to be considered as unfavourable.
This score serves as a reference to assess
SC’s credit risk and to set the amount of credit to be extended. It is
calculated from a composite of weighted scores obtained from each of the major
sections of this report. The assessed factors are as follows:
·
Financial
condition covering various ratios
·
Company
background and operations size
·
Promoters
/ Management background
·
Payment
record
·
Litigation
against the subject
·
Industry
scenario / competitor analysis
·
Supplier
/ Customer / Banker review (wherever available)
This report is issued at
your request without any risk and responsibility on the part of MIRA INFORM
PRIVATE LIMITED (MIPL) or its officials.