|
|
|


MIRA INFORM REPORT
|
Report No. : |
487657 |
|
Report Date : |
16.02.2018 |
IDENTIFICATION DETAILS
|
Name : |
PRENIT WORLD LLP |
|
|
|
|
Registered
Office : |
C - 25, 1st Floor, C Block Market, Vasant Vihar, New Delhi-110057 |
|
Tel. No.: |
91-11-41676630/ 32 |
|
|
|
|
Country : |
India |
|
|
|
|
Financials (as
on) : |
31.03.2017 |
|
|
|
|
Date of
Incorporation : |
21.12.2011 |
|
|
|
|
Total Obligation of Contribution : |
INR 514.162 Million |
|
|
|
|
LLPIN : |
AAA-7360 |
|
|
|
|
IEC No.: |
Not Divulged |
|
|
|
|
GST No.: |
07AAKFP4166A2ZD [Delhi] 09AAKFP4166A1ZA [Lucknow] 10AAKFP4166A1ZR [Bihar] 08AAKFP4166A1ZC [Jaipur] 29AAKFP4166A1Z8 [Bangalore] |
|
|
|
|
TIN No.: |
Not Divulged |
|
|
|
|
TAN No.: [Tax Deduction &
Collection Account No.] |
Not Available |
|
|
|
|
PAN No.: [Permanent Account No.] |
AAKFP4166A |
|
|
|
|
Legal Form : |
Limited Liability Partnership Firm |
|
|
|
|
Line of Business
: |
· Providing Healthcare Infra Solution which includes Assembly/ Installation and set up of operation theatres, Paramedical Services, Medical Gas Pipelines, etc. [Confirmed by Management] · Dealing, Trading, Liasioning and C & F Agents of Medical and Electronics Items/ Equipments, All type of Furniture and Furnishing and Goods, etc. and to do the Real Estate Activities. [Registered Activity] |
|
|
|
|
No. of Employees
: |
44 (Approximately) |
RATING & COMMENTS
(Mira Inform has adopted New Rating mechanism w.e.f. 23rd
January 2017)
|
MIRA’s Rating : |
A |
|
Credit Rating |
Explanation |
Rating Comments |
|
A |
Acceptable Risk |
Business dealings permissible with
moderate risk of default |
|
Status : |
Satisfactory |
|
|
|
|
Payment Behaviour : |
Usually Correct |
|
|
|
|
Litigation : |
Clear |
|
|
|
|
Comments : |
Subject is a limited liability partnership concern established in the year 2011 having satisfactory track record. It is involved in providing health care infra solution which includes assembly installation and setup of operation theatres, paramedical services, medical gas pipelines, etc. For the financial year 2017, the concern has reported degrowth of 51.10% in its sales turnover as compared to its previous year but has maintained fair profit margin during the year. Rating takes into consideration, the satisfactory financial risk profile marked by adequate capital base and strong debt protection metrics. Rating continue to derive strength from its established track record of its business operation backed by its entrepreneurial experience of its partners in service industry. Further its customer “J. Kumar Infraprojects Limited” and “Megha Engineering and Infrastructure Limited” both claimed that they are satisfied with the subject’s product quality and delivery behaviour as well its supplier “Nat Steel Equipment Private Limited” and “Digiline Systems Private Limited”, both the companies are satisfied with their payment behaviour and market goodwill of the subject. Even, the subject’s Banker “Axis Bank” has given positive feedback about the subject. However, these rating strengths gets partially offset by high working capital nature and by volatile profitability margin and intensive competition in the service industry. Payments seems to be usually correct. In view of aforesaid, the subject can be considered for business dealings at usual trade terms and conditions. Note: Site visit was conducted at the given address and our executive has successfully traced the subject. At the premises our executive met Mr. Shailesh (Accounts Department) provided with contact no. (#08860077274). As per our executive observation, it is a 4 storey building and the subject is situated on 1st floor. Location is easy to find. Locality seems to be commercial and the area near the building premise seems to be neutral. Further, our executive has sighted the name board of the subject on the given premise address. |
NOTES :
Any query related to this report can be made
on e-mail : infodept@mirainform.com
while quoting report number, name and date.
ECGC Country Risk Classification List
|
Country Name |
Previous Rating (30.06.2017) |
Current Rating (30.09.2017) |
|
India |
A1 |
A1 |
|
Risk Category |
ECGC
Classification |
|
Insignificant |
A1 |
|
Low Risk |
A2 |
|
Moderately Low Risk |
B1 |
|
Moderate Risk |
B2 |
|
Moderately High Risk |
C1 |
|
High Risk |
C2 |
|
Very High Risk |
D |
EXTERNAL AGENCY RATING
NOT AVAILABLE
RBI DEFAULTERS’ LIST STATUS
Subject’s name is not enlisted as a defaulter
in the publicly available RBI Defaulters’ list.
EPF (Employee Provident Fund) DEFAULTERS’ LIST STATUS
Subject’s name is not enlisted as a defaulter
in the publicly available EPF (Employee Provident Fund) Defaulters’ list as of
31-03-2016.
BIFR (Board for Industrial & Financial Reconstruction) LISTING
STATUS
Subject’s name is not listed as a Sick Unit in
the publicly available BIFR (Board for Industrial & Financial
Reconstruction) list as of 16.02.2018.
IBBI (Insolvency and Bankruptcy Board of India) LISTING STATUS
Subject’s name is not listed in the publicly
available IBBI (Insolvency and Bankruptcy Board of India) list as of report
date.
INFORMATION PARTED BY
|
Name : |
Mr. Shailesh |
|
Designation : |
Accountant |
|
Contact No.: |
91-8860077274 |
|
Date : |
14.02.2018 |
LOCATIONS
|
Registered/ Head Office : |
C - 25, 1st Floor, C Block Market, Vasant Vihar, New Delhi-110057, India |
|
Tel. No.: |
91-11-41676630/ 32 |
|
Mobile No.: |
91-8860077274 [Mr. Shailesh] |
|
Fax No.: |
91-11-41676631 |
|
E-Mail : |
|
|
Website : |
|
|
Location : |
Rented |
|
Locality : |
Commercial |
|
|
|
|
Branch Office 1 : |
15/7 Madan Mohan Malviya Marg, Lucknow-226001, Uttar Pradesh, India |
|
|
|
|
Branch Office 2 : |
BO 725, 1st Floor, 4th Main Road, BEML, Layout 5th
Stage R.R. Nagar, Bangalore-560091, Karnataka, India |
|
|
|
|
Branch Office 3 : |
C-203, Block A, Omshail Baran Sheikhpura Bagan, Patna-800014, Bihar,
India |
|
|
|
|
Branch Office 4 : |
No. 805, 8th Floor, Regus KRM Plaza, South Towers, No. 2
Harrington Road, Chetpet, Chennai-600031, Tamilnadu, India |
|
Tel. No.: |
91-44-49042801 |
|
|
|
|
Warehouse : |
151-152, Gail No. 9, Road No. 4, Mahipalpur, New Delhi-110037, India |
PARTNERS
|
Name : |
Mrs. Rekha Srivastava |
||||||||
|
Designation : |
Designated Partner |
||||||||
|
Address : |
17, Paschimi Marg, Vasanta Vihar, Delhi-110057, India |
||||||||
|
Date of Birth/Age : |
15.07.1964 |
||||||||
|
Date of Appointment : |
21.12.2011 |
||||||||
|
PAN No.: |
ANYPS0781K |
||||||||
|
Passport No.: |
E4474089 |
||||||||
|
Aadhar Card No.: |
853183470826 |
||||||||
|
DPIN No.: |
00827219 |
||||||||
|
|
|
||||||||
|
Name : |
Mr. Nitin Kumar |
||||||||
|
Designation : |
Designated Partner |
||||||||
|
Address : |
C-6/3, First Floor, Vasant Vihar, New Delhi-110057, India |
||||||||
|
Date of Birth/Age : |
20.07.1985 |
||||||||
|
Date of Appointment : |
21.12.2011 |
||||||||
|
PAN No.: |
AXTPK1879R |
||||||||
|
Passport No.: |
J4077125 |
||||||||
|
Aadhar Card No.: |
615057623153 |
||||||||
|
DPIN No.: |
03058844 |
||||||||
|
Other Directorship : LIST OF COMPANIES
|
|||||||||
KEY EXECUTIVES
|
Name : |
Mr. Shailesh |
|
Designation : |
Accountant |
CONTRIBUTION DETAILS
|
Names of Persons |
INR in Million |
|
Nitin Kumar |
129.385 |
|
Rekha Srivastava |
163.793 |
|
|
|
|
Total |
293.178 |
BUSINESS DETAILS
|
Line of Business : |
· Providing Healthcare Infra Solution which includes Assembly/ Installation and set up of operation theatres, Paramedical Services, Medical Gas Pipelines, etc. [Confirmed by Management] · Dealing, Trading, Liasioning and C & F Agents of Medical and Electronics Items/ Equipments, All type of Furniture and Furnishing and Goods, etc. and to do the Real Estate Activities. [Registered Activity] |
|
|
|
|
Brand Names : |
Not Available |
|
|
|
|
Agencies Held : |
Not Available |
|
|
|
|
Exports : |
|
|
Products : |
Not Available |
|
Countries : |
Not Available |
|
|
|
|
Imports : |
|
|
Products : |
Operation Theatre Equipment |
|
Countries : |
· Germany · USA · Greece · Italy |
|
|
|
|
Terms : |
|
|
Selling : |
L/C, Cheque and Others [RTGS] |
|
|
|
|
Purchasing : |
L/C, Cheque and Others [RTGS] |
PRODUCTION STATUS: (NOT AVAILABLE)
GENERAL INFORMATION
|
Suppliers : |
· Danmedics Medical Engineering GmbH Germany · G. Samaras S.A · Medifa-Hessee GmbH & Co. · Stryker India Private Limited · Stefab India Limited · Shree Anand International Co. · Vimal Industries Kitchen Equipments · Classic Flooring and Interiors Private Limited |
||||||||||||||||||||||||||||||||||||||||||||
|
|
|
||||||||||||||||||||||||||||||||||||||||||||
|
Customers : |
OEMs
· ESIC Model Hospital Noida · Larsen and Toubro Limited · NBCC · NCC Limited · UP Jai Nigam Unit-36 Jhansi · UP Rajkiya Nirman Nigam Limited · Gravity Global · ESIC Ludhiana |
||||||||||||||||||||||||||||||||||||||||||||
|
|
|
||||||||||||||||||||||||||||||||||||||||||||
|
No. of Employees : |
44 (Approximately) |
||||||||||||||||||||||||||||||||||||||||||||
|
|
|
||||||||||||||||||||||||||||||||||||||||||||
|
Bankers : |
· Bank of India B-6/8, Local Shopping Centre, Chowdhary Harsukh Marg,, Safdarjung
Enclave, New Delhi, 110029, India Account No:
603620110000648 IFS Code:
BKID0006036 · The Hongkong and Shanghai Banking Corporation Limited 25, Barakhambha Road, New Delhi - 110001, India · State Bank of India Account No: 67082800877 IFS Code: SBIN0070603 |
||||||||||||||||||||||||||||||||||||||||||||
|
|
|
||||||||||||||||||||||||||||||||||||||||||||
|
Facilities : |
|
|
Auditors : |
|
|
Name : |
KSJ and Company Chartered Accountants |
|
Address : |
M-1, Malviya Nagar, New Delhi-17, India |
|
Tel. No.: |
91-11-41004252/ 41604252 |
|
Fax No.: |
91-11-41004252 |
|
E-Mail : |
|
|
|
|
|
Memberships : |
Not Available |
|
|
|
|
Collaborators : |
Not Available |
|
|
|
|
Associates/Subsidiaries : |
Not Available |
CAPITAL STRUCTURE
|
Particular |
INR in Million |
|
|
|
|
Total Obligation of
Contribution: |
INR 514.162 Million |
PARTNER’S
CAPITAL ACCOUNT AS ON 31.03.2017
|
Particulars |
Profit Share |
Op. Bal. 01.04.2015 |
Introduced |
Salary |
Profits |
Drawings |
Cl. Balance 31.03.2017 |
|
Rekha Srivastava |
2/3 |
305.751 |
143.943 |
9.000 |
20.679 |
144.313 |
335.060 |
|
Nitin Kumar |
1/3 |
192.203 |
34.421 |
9.000 |
10.340 |
66.863 |
179.102 |
|
|
|
|
|
|
|
|
|
|
|
----------- |
----------- |
----------- |
----------- |
----------- |
----------- |
----------- |
|
Total |
100% |
497.954 |
178.364 |
18.000 |
31.019 |
211.176 |
514.162 |
FINANCIAL DATA
[all figures are
in INR Million]
ABRIDGED
BALANCE SHEET
|
SOURCES OF FUNDS |
31.03.2017 |
31.03.2016 |
31.03.2015 |
|
|
SHAREHOLDERS FUNDS |
|
|
|
|
|
1] Partners Capital Account |
514.162 |
497.954 |
429.519 |
|
|
2] Reserves & Surplus |
0.000 |
0.000 |
0.000 |
|
|
NETWORTH |
514.162 |
497.954 |
429.519 |
|
|
LOAN FUNDS |
|
|
|
|
|
1] Secured Loans |
2.732 |
55.868 |
11.371 |
|
|
2] Unsecured Loans |
0.000 |
0.000 |
0.000 |
|
|
TOTAL BORROWING |
2.732 |
55.868 |
11.371 |
|
|
DEFERRED TAX LIABILITIES |
0.000 |
0.000 |
0.000 |
|
|
|
|
|
|
|
|
TOTAL |
516.894 |
553.822 |
440.890 |
|
|
|
|
|
|
|
|
APPLICATION OF FUNDS |
|
|
|
|
|
|
|
|
|
|
|
FIXED ASSETS [Net Block] |
10.523 |
40.877 |
39.330 |
|
|
Capital work-in-progress |
0.000 |
0.000 |
0.000 |
|
|
|
|
|
|
|
|
INVESTMENT |
40.683 |
43.300 |
1.500 |
|
|
DEFERREX TAX ASSETS |
0.000 |
0.000 |
0.000 |
|
|
|
|
|
|
|
|
CURRENT ASSETS, LOANS & ADVANCES |
|
|
|
|
|
|
Inventories |
119.904
|
100.663
|
95.617 |
|
|
Sundry Debtors |
379.891
|
418.939
|
428.123 |
|
|
Cash & Bank Balances |
1.342
|
3.548
|
5.016 |
|
|
Other Current Assets |
26.545
|
28.753
|
39.140 |
|
|
Loans & Advances |
16.919
|
21.771
|
38.979 |
|
Total
Current Assets |
544.601
|
573.674
|
606.875 |
|
|
Less : CURRENT
LIABILITIES & PROVISIONS |
|
|
|
|
|
|
Sundry Creditors |
73.792
|
89.621
|
170.103 |
|
|
Other Current Liabilities |
3.257
|
13.419
|
29.719 |
|
|
Provisions |
1.864
|
0.989
|
6.993 |
|
Total
Current Liabilities |
78.913
|
104.029
|
206.815 |
|
|
Net Current Assets |
465.688
|
469.645
|
400.060 |
|
|
|
|
|
|
|
|
MISCELLANEOUS EXPENSES |
0.000 |
0.000 |
0.000 |
|
|
|
|
|
|
|
|
TOTAL |
516.894 |
553.822 |
440.890 |
|
PROFIT
& LOSS ACCOUNT
|
|
PARTICULARS |
31.03.2017 |
31.03.2016 |
31.03.2015 |
|
|
|
SALES |
|
|
|
|
|
|
|
Sales |
310.721 |
635.399 |
567.189 |
|
|
|
Other Income |
41.188 |
15.209 |
76.003 |
|
|
|
TOTAL |
351.909 |
650.608 |
643.192 |
|
|
|
|
|
|
|
|
Less |
EXPENSES |
|
|
|
|
|
|
|
Cost of Goods Sold |
191.591 |
453.670 |
359.531 |
|
|
|
Direct Expenses |
13.135 |
9.336 |
10.002 |
|
|
|
Administrative and Other Expenses |
39.928 |
43.727 |
100.690 |
|
|
|
Freight and Cartage |
1.982 |
1.734 |
1.311 |
|
|
|
Staff Cost |
23.143 |
21.607 |
21.759 |
|
|
|
Vehicle Expenses |
0.446 |
0.523 |
0.385 |
|
|
|
Insurance Expenses |
1.485 |
0.562 |
0.433 |
|
|
|
Payment to Partners |
18.000 |
62.510 |
63.499 |
|
|
|
Loss on Sale of Property |
2.436 |
0.000 |
0.000 |
|
|
|
TOTAL |
292.146 |
593.669 |
557.610 |
|
|
|
|
|
|
|
|
Less |
PROFIT BEFORE
INTEREST, TAX, DEPRECIATION AND AMORTISATION |
59.763 |
56.939 |
85.582 |
|
|
|
|
|
|
|
|
|
Less |
FINANCIAL
EXPENSES |
8.435 |
7.700 |
9.952 |
|
|
|
|
|
|
|
|
|
|
PROFIT/ (LOSS)
BEFORE TAX, DEPRECIATION AND AMORTISATION |
51.328 |
49.239 |
75.630 |
|
|
|
|
|
|
|
|
|
Less/
Add |
DEPRECIATION/
AMORTISATION |
2.023 |
2.092 |
1.555 |
|
|
|
|
|
|
|
|
|
|
PROFIT/ (LOSS) BEFORE
TAX |
49.305 |
47.147 |
74.075 |
|
|
|
|
|
|
|
|
|
Less |
TAX |
18.286 |
(12.318) |
54.163 |
|
|
|
|
|
|
|
|
|
|
PROFIT/ (LOSS)
AFTER TAX |
31.019 |
59.465 |
19.912 |
|
KEY
RATIOS
EFFICIENCY RATIOS
|
PARTICULARS |
31.03.2017 |
31.03.2016 |
31.03.2015 |
|
Average Collection Days (Sundry
Debtors / Income * 365 Days) |
446.25 |
240.66 |
275.51 |
|
|
|
|
|
|
Account Receivables Turnover (Income / Sundry Debtors) |
0.82 |
1.52 |
1.32 |
|
|
|
|
|
|
Average Payment Days (Sundry Creditors / Purchases * 365 Days) |
140.58 |
72.10 |
172.69 |
|
|
|
|
|
|
Inventory Turnover (Operating Income / Inventories) |
0.50 |
0.57 |
0.90 |
|
|
|
|
|
|
Asset Turnover (Operating Income / Net Fixed Assets) |
5.68 |
1.39 |
2.18 |
LEVERAGE RATIOS
|
PARTICULARS |
31.03.2017 |
31.03.2016 |
31.03.2015 |
|
Debt Ratio ((Borrowing
+ Current Liabilities) / Total Assets) |
0.14 |
0.24 |
0.34 |
|
|
|
|
|
|
Debt Equity Ratio (Total Liability / Networth) |
0.01 |
0.11 |
0.03 |
|
|
|
|
|
|
Current Liabilities to Networth (Current Liabilities / Net Worth) |
0.15 |
0.21 |
0.48 |
|
|
|
|
|
|
Fixed Assets to Networth (Net Fixed Assets / Networth) |
0.02 |
0.08 |
0.09 |
|
|
|
|
|
|
Interest Coverage Ratio (PBIT / Financial Charges) |
7.09 |
7.39 |
8.60 |
PROFITABILITY RATIOS
|
PARTICULARS |
|
31.03.2017 |
31.03.2016 |
31.03.2015 |
|
Net Profit Margin ((PAT / Sales) * 100) |
% |
9.98 |
9.36 |
3.51 |
|
|
|
|
|
|
|
Return on Total Assets ((PAT / Total Assets) * 100) |
% |
5.21 |
9.04 |
3.07 |
|
|
|
|
|
|
|
Return on Investment (ROI) ((PAT / Networth) * 100) |
% |
6.03 |
11.94 |
4.64 |
SOLVENCY RATIOS
|
PARTICULARS |
31.03.2017 |
31.03.2016 |
31.03.2015 |
|
Current Ratio (Current
Assets / Current Liabilities) |
6.90 |
5.51 |
2.93 |
|
|
|
|
|
|
Quick Ratio ((Current Assets – Inventories) / Current
Liabilities) |
5.38 |
4.55 |
2.47 |
|
|
|
|
|
|
G-Score Ratio Financial (Networth / Total Assets) |
0.86 |
0.76 |
0.66 |
|
|
|
|
|
|
G-Score Ratio Debt (Debts / Equity Capital) |
0.01 |
0.11 |
0.03 |
|
|
|
|
|
|
G-Score Ratio Liquidity (Total Current Assets / Total Current Liabilities) |
6.90 |
5.51 |
2.93 |
Total
Liability = Short-term Debt + Long-term Debt + Current Maturities of Long-term
debts
FINANCIAL ANALYSIS
[all figures are
in INR Million]
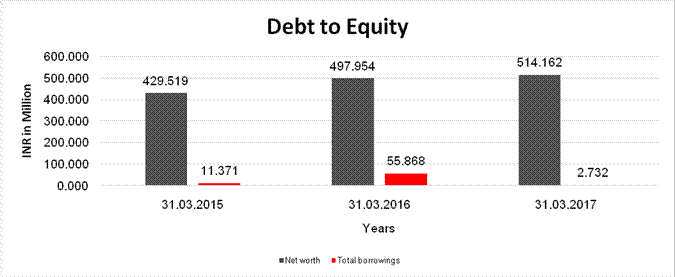
DEBT EQUITY RATIO
|
Particular |
31.03.2015 |
31.03.2016 |
31.03.2017 |
|
|
INR
In Million |
INR
In Million |
INR
In Million |
|
Partners Capital |
429.519 |
497.954 |
514.162 |
|
Reserves & Surplus |
0.000 |
0.000 |
0.000 |
|
Net
worth |
429.519 |
497.954 |
514.162 |
|
Secured Loans |
11.371 |
55.868 |
2.732 |
|
Unsecured Loans |
0.000 |
0.000 |
0.000 |
|
Total
borrowings |
11.371 |
55.868 |
2.732 |
|
Debt/Equity
ratio |
0.026 |
0.112 |
0.005 |
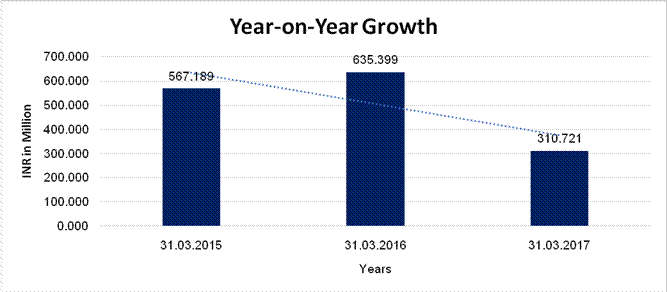
YEAR-ON-YEAR GROWTH
|
Year
on Year Growth |
31.03.2015 |
31.03.2016 |
31.03.2017 |
|
|
INR
In Million |
INR
In Million |
INR
In Million |
|
Sales |
567.189 |
635.399 |
310.721 |
|
|
|
12.026 |
(51.098) |
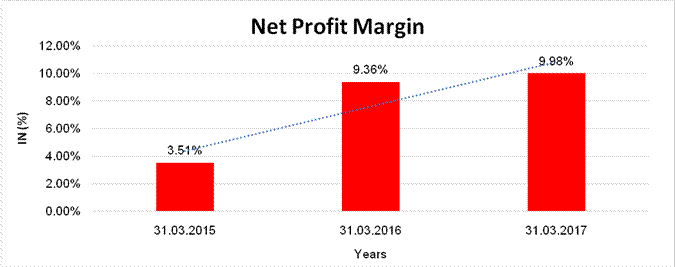
NET PROFIT MARGIN
|
Net
Profit Margin |
31.03.2015 |
31.03.2016 |
31.03.2017 |
|
|
INR
In Million |
INR
In Million |
INR
In Million |
|
Sales |
567.189 |
635.399 |
310.721 |
|
Profit |
19.912 |
59.465 |
31.019 |
|
|
3.51% |
9.36% |
9.98% |
LOCAL AGENCY FURTHER INFORMATION
|
Sr. No. |
Check list by
info agents |
Available in
Report (Yes/No) |
|
1 |
Year of establishment |
Yes |
|
2 |
Constitution of the entity -Incorporation
details |
Yes |
|
3 |
Locality of the entity |
Yes |
|
4 |
Premises details |
No |
|
5 |
Buyer visit details |
Yes |
|
6 |
Contact numbers |
Yes |
|
7 |
Name of the person contacted |
Yes |
|
8 |
Designation of contact person |
Yes |
|
9 |
Promoter’s background |
Yes |
|
10 |
Date of Birth of Proprietor / Partners /
Directors |
Yes |
|
11 |
Pan Card No. of Proprietor / Partners |
Yes |
|
12 |
Voter Id Card No. of Proprietor / Partners |
No |
|
13 |
Type of business |
Yes |
|
14 |
Line of Business |
Yes |
|
15 |
Export/import details (if applicable) |
Yes |
|
16 |
No. of employees |
Yes |
|
17 |
Details of sister concerns |
No |
|
18 |
Major suppliers |
Yes |
|
19 |
Major customers |
Yes |
|
20 |
Banking Details |
Yes |
|
21 |
Banking facility details |
Yes |
|
22 |
Conduct of the banking account |
Yes |
|
23 |
Financials, if provided |
Yes |
|
24 |
Capital in the business |
Yes |
|
25 |
Last accounts filed at ROC, if applicable |
Yes |
|
26 |
Turnover of firm for last three years |
Yes |
|
27 |
Reasons for variation <> 20% |
-- |
|
28 |
Estimation for coming financial year |
Yes |
|
29 |
Profitability for last three years |
Yes |
|
30 |
Major shareholders, if available |
Yes |
|
31 |
External Agency Rating, if available |
No |
|
32 |
Litigations that the firm/promoter
involved in |
-- |
|
33 |
Market information |
-- |
|
34 |
Payments terms |
Yes |
|
35 |
Negative Reporting by Auditors in the
Annual Report |
No |
-----------------------------------------------------------------------------------------------------------------------------
OBSERVATION POINTS
|
Name of Company : |
PRENIT WORLD LLP |
|
|
|
|
Address : |
C-25, 1st Floor, C Block Market, Vasant Vihar, New Delhi-110057, India |
|
Contact No.: |
91-8860077274 |
|
|
|
|
Person to whom we met: |
Mr. Shailesh [Accounts Department] |
|
|
|
|
Name Board : |
Sighted |
|
|
|
|
Location: |
Easy |
|
|
|
|
Total Floors of the Building : |
4 Floors |
|
|
|
|
Subject situated on: |
1st Floor |
|
|
|
|
Locality: |
Commercial |
|
|
|
|
Area : |
Neutral |
|
|
|
|
Visibility of
Items: |
·
Telephone ·
Fax Machine ·
Computers ·
Air Conditioner ·
Office Equipment ·
Xerox Machine |
|
|
|
|
Proof of visit: |
Photos |
-----------------------------------------------------------------------------------------------------------------------------
COMPUTATION OF TOTAL INCOME
(INR
IN MILLION)
|
PARTICULARS |
31.03.2017 |
|||
|
Income Heads |
|
Income Before Set
off |
|
Income After Set
off |
|
Income From Business or Profession |
|
50.917 |
|
50.917 |
|
|
|
|
|
|
|
Income from Capital Gains |
|
1.140 |
|
1.140 |
|
|
|
|
|
|
|
Income from Other Sources |
|
1.351 |
|
1.351 |
|
|
|
|
|
---------- |
|
Gross Total Income |
|
|
|
53.408 |
|
|
|
|
|
|
|
Less : Deduction under Chapter VIA |
|
|
|
0.000 |
|
|
|
|
|
---------- |
|
Total Income |
|
|
|
53.408 |
|
|
|
|
|
|
|
Rounding off u/s 288A |
|
|
|
53.408 |
|
|
|
|
|
|
|
Income Taxable at Normal Rate |
|
|
52.267 |
|
|
|
|
|
|
|
|
Income Taxable at Special Rate |
|
|
1.140 |
|
|
|
|
|
|
|
|
TAX CALCULATION |
||||
|
Tax at Normal Rates |
|
15.680 |
|
|
|
Tax 111A |
|
0.171 |
|
|
|
Total Tax |
|
|
|
15.851 |
|
Add : Surcharge |
|
|
|
1.902 |
|
|
|
|
|
---------- |
|
Total |
|
|
|
17.753 |
|
Add : Education Cess |
|
|
|
0.355 |
|
|
|
|
|
---------- |
|
Total |
|
|
|
18.109 |
|
Add : Secondary & Higher Education
Cess |
|
|
|
0.178 |
|
|
|
|
|
---------- |
|
Total |
|
|
|
18.286 |
|
Less : TDSrrcs |
|
|
|
5.722 |
|
|
|
|
|
---------- |
|
Assessed Tax |
|
|
|
12.564 |
|
Less : Advance Tax |
|
|
|
14.000 |
|
|
|
|
|
---------- |
|
Amount Refundable |
|
|
|
1.436 |
|
|
|
|
|
|
|
Amount Refundable Rounded Off u/s 288 B 1.436 |
|
|
|
|
------------------------------------------------------------------------------------------------------------------------------
PROJECTED PROFIT AND
LOSS ACCOUNT
(INR IN MILLION)
|
PARTICULARS |
OPERATING YEARS |
|||
|
31.03.2018 Estimated |
31.03.2019 Projected |
31.03.2020 Projected |
31.03.2021 Projected |
|
|
Sales |
466.082 |
582.603 |
699.123 |
838.948 |
|
|
|
|
|
|
|
Other Income |
51.484 |
64.355 |
80.444 |
100.555 |
|
|
|
|
|
|
|
Opening Stock |
119.904 |
46.608 |
87.390 |
104.868 |
|
|
|
|
|
|
|
Add: Purchase |
214.712 |
397.770 |
446.082 |
524.999 |
|
|
|
|
|
|
|
Add: Direct Expenses |
16.418 |
21.493 |
23.658 |
29.553 |
|
|
|
|
|
|
|
Less : Closing Stock |
46.608 |
87.390 |
104.868 |
125.842 |
|
|
|
|
|
|
|
Indirect Expenses |
137.702 |
172.087 |
206.253 |
249.830 |
|
|
|
|
|
|
|
Operating Profit Before Int. Depreciation |
75.438 |
96.389 |
121.052 |
156.094 |
|
|
|
|
|
|
|
Interest |
2.919 |
4.500 |
4.500 |
4.500 |
|
|
|
|
|
|
|
Depreciation |
1.626 |
1.322 |
1.100 |
0.927 |
|
|
|
|
|
|
|
Operating Profit After Int. Depreciation |
70.894 |
90.567 |
115.452 |
150.666 |
|
|
|
|
|
|
|
Add : Non Operating Income |
0.000 |
0.000 |
0.000 |
0.000 |
|
|
|
|
|
|
|
Less : Non Operating Expenses |
0.000 |
0.000 |
0.000 |
0.000 |
|
|
|
|
|
|
|
Profit Before Tax |
70.894 |
90.567 |
115.452 |
150.666 |
|
|
|
|
|
|
|
Net Profit Appropriation |
24.317 |
31.065 |
39.600 |
51.679 |
|
|
|
|
|
|
|
Retained Profit |
46.577 |
59.503 |
75.852 |
98.988 |
|
|
|
|
|
|
|
Break up of Sales Inclusive of Other Incomes |
466.082 |
582.603 |
699.123 |
838.948 |
------------------------------------------------------------------------------------------------------------------------------
PROJECTED BALANCE
SHEET
(INR IN MILLION)
|
PARTICULARS |
OPERATING YEARS |
|||
|
31.03.2018 Estimated |
31.03.2019 Projected |
31.03.2020 Projected |
31.03.2021 Projected |
|
|
LIABILITIES |
|
|
|
|
|
Capital/ Ordinary/ Share Capital |
465.189 |
481.070 |
539..339 |
591.889 |
|
|
|
|
|
|
|
Reserve and Surplus |
0.000 |
0.000 |
0.000 |
0.000 |
|
|
|
|
|
|
|
Term Liabilities |
1.798 |
1.019 |
0.162 |
0.000 |
|
|
|
|
|
|
|
Short Term Borrowings |
50.000 |
50.000 |
50.000 |
50.000 |
|
|
|
|
|
|
|
Sundry Creditors |
6.627 |
7.444 |
8.784 |
10.365 |
|
|
|
|
|
|
|
Other Current Liabilities |
5.150 |
6.750 |
7.287 |
8.399 |
|
|
|
|
|
|
|
Total |
528.765 |
546.283 |
605.572 |
660.652 |
|
|
|
|
|
|
|
Additional Information |
10.000 |
10.000 |
10.000 |
10.000 |
|
|
|
|
|
|
|
ASSETS |
|
|
|
|
|
Fixed Assets |
8.897 |
7.575 |
6.474 |
5.547 |
|
|
|
|
|
|
|
Non Current Assets |
140.000 |
0.000 |
0.000 |
0.000 |
|
|
|
|
|
|
|
Intangible Assets |
0.000 |
0.000 |
0.000 |
0.000 |
|
|
|
|
|
|
|
Investments |
63.000 |
143.000 |
143.000 |
143.000 |
|
|
|
|
|
|
|
Stock In Hand |
46.608 |
87.390 |
104.868 |
125.842 |
|
|
|
|
|
|
|
Sundry Debtors |
173.041 |
194.201 |
233.041 |
269.649 |
|
|
|
|
|
|
|
Other Current Assets |
80.108 |
93.760 |
96.760 |
93.760 |
|
|
|
|
|
|
|
Cash in Hand and Bank Balance |
17.110 |
20.357 |
21.428 |
22.853 |
|
|
|
|
|
|
|
Total |
528.765 |
546.283 |
605.572 |
660.652 |
------------------------------------------------------------------------------------------------------------------------------
CASH FLOW STATEMENT
(INR IN MILLION)
|
PARTICULARS |
OPERATING YEARS |
|||
|
31.03.2018 Estimated |
31.03.2019 Projected |
31.03.2020 Projected |
31.03.2021 Projected |
|
|
1. Cash Flow
From Operating Activities |
|
|
|
|
|
Add: Net profit before taxation |
70.894 |
90.567 |
115.452 |
150.666 |
|
|
|
|
|
|
|
Add: Depreciation |
1.626 |
1.322 |
1.100 |
0.927 |
|
|
|
|
|
|
|
Add: Increase in current liabilities |
0.000 |
9.165 |
10.412 |
14.772 |
|
|
|
|
|
|
|
Less: Decrease in current liabilities |
11.336 |
0.000 |
0.000 |
0.000 |
|
|
|
|
|
|
|
Less: Increase in current Assets |
0.000 |
155.594 |
59.318 |
54.582 |
|
|
|
|
|
|
|
Add: Decrease in current Assets |
221.184 |
0.000 |
0.000 |
0.000 |
|
|
|
|
|
|
|
Cash
generated from operations |
282.368 |
(54.540) |
67.646 |
111.784 |
|
|
|
|
|
|
|
Less: Income tax payable |
24.317 |
31.065 |
39.600 |
51.679 |
|
|
|
|
|
|
|
Net cash from operations |
258.051 |
(85.605) |
28.046 |
60.105 |
|
|
|
|
|
|
|
2. Cash Flow
From Investing Activities |
|
|
|
|
|
Add: Sale of fixed Assets |
0.000 |
0.000 |
0.000 |
0.000 |
|
|
|
|
|
|
|
Less: Purchase of fixed Assets |
0.000 |
0.000 |
0.000 |
0.000 |
|
|
|
|
|
|
|
Add: Change in non current Assets |
(140.000) |
140.000 |
0.000 |
0.000 |
|
|
|
|
|
|
|
Add: Change in intengible Assets |
0.000 |
0.000 |
0.000 |
0.000 |
|
|
|
|
|
|
|
Cash from investing activities |
(140.000) |
140.000 |
0.000 |
0.000 |
|
|
|
|
|
|
|
3. Cash Flow
From Financing Activity |
|
|
|
|
|
Add: Issue of capital |
(95.549) |
(43.622) |
(17.582) |
(46.439) |
|
|
|
|
|
|
|
Add: (+)/(-) in term liabilities |
(0.703) |
(0.779) |
(0.857) |
(0.162) |
|
|
|
|
|
|
|
Less: Dividend paid |
0.000 |
0.000 |
0.000 |
0.000 |
|
|
|
|
|
|
|
Cash from financing activities |
(96.252) |
(44.401) |
(18.439) |
(46.601) |
|
|
|
|
|
|
|
4. Cash flows from other
activities |
0.000 |
0.000 |
0.000 |
0.000 |
|
|
|
|
|
|
|
5. Opening cash and cash
equivalents |
19.628 |
41.427 |
51.421 |
61.028 |
|
|
|
|
|
|
|
Closing cash and cash equivalents (1 to 5) |
41.427 |
51.421 |
61.028 |
74.532 |
------------------------------------------------------------------------------------------------------------------------------
ASSESSMENT OF WORKING CAPITAL REQUIREMENTS
OPERATING STATEMENT
(INR IN MILLION)
|
SR. NO. |
PARTICULARS |
OPERATING YEARS |
|||
|
31.03.2018 Estimated |
31.03.2019 Projected |
31.03.2020 Projected |
31.03.2021 Projected |
||
|
1. |
Gross Sales |
|
|
|
|
|
i. |
Sales (Net of returns) |
|
|
|
|
|
|
a) Domestic Sales |
466.082 |
582.603 |
699.123 |
838.948 |
|
|
|
|
|
|
|
|
|
b) Export Sales |
0.000 |
0.000 |
0.000 |
0.000 |
|
|
|
|
|
|
|
|
|
c.) Sub-total(a+b) |
466.082 |
582.603 |
699.123 |
838.948 |
|
|
|
|
|
|
|
|
|
d.) % rise(+) or fall(-) in sales turnover as compared to Previous Year |
50 |
25 |
20 |
20 |
|
|
|
|
|
|
|
|
ii. |
Other Income |
|
|
|
|
|
|
a) Duty Drawback |
0.000 |
0.000 |
0.000 |
0.000 |
|
|
|
|
|
|
|
|
|
b) Cash assistance |
0.000 |
0.000 |
0.000 |
0.000 |
|
|
|
|
|
|
|
|
|
c.) Commission & brokerage received |
51.484 |
64.355 |
80.444 |
100.555 |
|
|
|
|
|
|
|
|
|
d.) Sub-total (a +
b + c) |
51.484 |
64.355 |
80.444 |
100.555 |
|
|
|
|
|
|
|
|
iii. |
Total (i) + (ii) |
517.566 |
646.958 |
779.567 |
939.503 |
|
|
|
|
|
|
|
|
2. |
Cost of Sales |
|
|
|
|
|
i. |
Purchases |
214.712 |
397.770 |
446.082 |
524.999 |
|
|
|
|
|
|
|
|
ii. |
Other trading exp.s (carriage inward, commission and brokerage on purchase) |
16.418 |
21.493 |
23.658 |
29.553 |
|
|
|
|
|
|
|
|
iii. |
Sub-total (i) +
(ii) |
231.130 |
419.264 |
469.740 |
554.553 |
|
|
|
|
|
|
|
|
iv. |
Add: Opening Stock |
119.904 |
46.608 |
87.390 |
104.868 |
|
|
|
|
|
|
|
|
v. |
Sub-total (iii) + (iv) |
351.034 |
465.872 |
557.130 |
659.421 |
|
|
|
|
|
|
|
|
vi. |
Less: Closing Stock |
46.608 |
87.390 |
104.868 |
125.842 |
|
|
|
|
|
|
|
|
vii. |
Total cost of sales
(v) - (vi) |
304.426 |
378.481 |
452.262 |
533.579 |
|
|
|
|
|
|
|
|
3. |
Selling, General and Administrative |
137.702 |
172.087 |
206.253 |
249.830 |
|
|
|
|
|
|
|
|
4. |
Operating Profit
(before Interest and Depreciation [1(iii) - 2(vii) - 3] |
75.438 |
96.389 |
121.052 |
156.094 |
|
|
|
|
|
|
|
|
5. |
Interest |
2.919 |
4.500 |
4.500 |
4.500 |
|
|
|
|
|
|
|
|
6. |
Depreciation |
1.626 |
1.322 |
1.100 |
0.927 |
|
|
|
|
|
|
|
|
7. |
Operating Profit (after Interest Depreciation)(4-5-6) |
70.894 |
90.567 |
115.452 |
150.666 |
|
|
|
|
|
|
|
|
8. i) |
Add: Other Non-operating Income |
|
|
|
|
|
|
Non Operating Income |
0.000 |
0.000 |
0.000 |
0.000 |
|
|
|
|
|
|
|
|
|
Other than above |
0.000 |
0.000 |
0.000 |
0.000 |
|
|
|
|
|
|
|
|
|
Sub-Total
(Income) |
0.000 |
0.000 |
0.000 |
0.000 |
|
|
|
|
|
|
|
|
ii) |
Less: Other Non-operating Expenses |
|
|
|
|
|
|
a) |
0.000 |
0.000 |
0.000 |
0.000 |
|
|
|
|
|
|
|
|
|
b) Other than above |
0.000 |
0.000 |
0.000 |
0.000 |
|
|
|
|
|
|
|
|
|
c) Sub-Total (Expenses) |
0.000 |
0.000 |
0.000 |
0.000 |
|
|
|
|
|
|
|
|
iii) |
Net of other non-operating Income/Expenses [net of 8(i) - 8(ii)] |
0.000 |
0.000 |
0.000 |
0.000 |
|
|
|
|
|
|
|
|
9. |
Profit Before Tax/Loss [7+8(iii)] |
70.894 |
90.567 |
115.452 |
150.666 |
|
|
|
|
|
|
|
|
10. |
Provision for Taxes |
24.317 |
31.065 |
39.560 |
51.679 |
|
|
|
|
|
|
|
|
11. |
Net Profit/ Loss (9-10) |
46.577 |
59.503 |
75.852 |
98.988 |
|
|
|
|
|
|
|
|
12. |
a) Equity dividend paid |
0.000 |
0.000 |
0.000 |
0.000 |
|
|
|
|
|
|
|
|
|
b) Dividend Rate |
0.000 |
0.000 |
0.000 |
0.000 |
|
|
|
|
|
|
|
|
13. |
Retained Profit (11-12) |
46.577 |
59.503 |
75.852 |
98.988 |
|
|
|
|
|
|
|
|
14. |
Retained Profit/Net Profit (%)(13/11)** In Case of firms, drawing made during the year by proprietors/partners |
100 |
100 |
100 |
100 |
------------------------------------------------------------------------------------------------------------------------------
ANALYSIS OF BALANCE SHEET
(INR IN MILLION)
|
SR. NO. |
PARTICULARS |
OPERATING YEARS |
|||
|
31.03.2018 Estimated |
31.03.2019 Projected |
31.03.2020 Projected |
31.03.2021 Projected |
||
|
|
CURRENT
LIABILITIES |
|
|
|
|
|
1 |
Short-Term borrowings from banks (including bills purchased Discount
& excess borrowings placed on repayment basis) |
|
|
|
|
|
|
From Applicant Bank |
50.000 |
50.000 |
50.000 |
50.000 |
|
|
|
|
|
|
|
|
|
From Other Banks |
0.000 |
0.000 |
0.000 |
0.000 |
|
|
|
|
|
|
|
|
|
(Of which BP and BD) |
0.000 |
0.000 |
0.000 |
0.000 |
|
|
|
|
|
|
|
|
|
SUB TOTAL (A) |
50.000 |
50.000 |
50.000 |
50.000 |
|
|
|
|
|
|
|
|
2 |
Short-term borrowing from others |
0.000 |
0.000 |
0.000 |
0.000 |
|
|
|
|
|
|
|
|
3 |
Sundry creditors(trade) |
6.627 |
7.444 |
8.784 |
10.365 |
|
|
|
|
|
|
|
|
4 |
Advance payments from customers/deposits from dealers |
0.000 |
0.000 |
0.000 |
0.000 |
|
|
|
|
|
|
|
|
5 |
Provision for taxation |
24.317 |
31.065 |
39.600 |
51.679 |
|
|
|
|
|
|
|
|
6 |
Dividend payable |
0.000 |
0.000 |
0.000 |
0.000 |
|
|
|
|
|
|
|
|
7 |
Other statutory liabilities (due within one year) |
3.500 |
4.500 |
5.500 |
6.500 |
|
|
|
|
|
|
|
|
8 |
Deposits/Instalments of term loans/DPGs/debentures,etc. (due within
one year) |
0.000 |
0.000 |
0.000 |
0.000 |
|
|
|
|
|
|
|
|
9 |
Other current liabilites & provisions (Due within 1 year)(Specify
major items) |
1.650 |
2.250 |
1.787 |
1.899 |
|
|
|
|
|
|
|
|
9 |
SUB TOTAL (B) |
36.094 |
45.259 |
55.670 |
70.442 |
|
|
|
|
|
|
|
|
10 |
TOTAL CURRENT
LIABILITIES [Total 1 to 9] |
86.094 |
95.259 |
105.670 |
120.442 |
|
|
|
|
|
|
|
|
|
TERM LIABILITIES |
|
|
|
|
|
11 |
Debentures(not maturing within one Year |
0.000 |
0.000 |
0.000 |
0.000 |
|
|
|
|
|
|
|
|
12 |
Preference Shares (redeemable after one year) |
0.000 |
0.000 |
0.000 |
0.000 |
|
|
|
|
|
|
|
|
13 |
Term loans (excluding instalments payable within one years) |
0.000 |
0.000 |
0.000 |
0.000 |
|
|
|
|
|
|
|
|
14 |
Deferred Payment Credits (excluding instalments due within one year) |
0.000 |
0.000 |
0.000 |
0.000 |
|
|
|
|
|
|
|
|
15 |
Terms deposits (repayment after 1 year) |
0.000 |
0.000 |
0.000 |
0.000 |
|
|
|
|
|
|
|
|
16 |
From Directors & relatives |
0.000 |
0.000 |
0.000 |
0.000 |
|
|
|
|
|
|
|
|
17 |
Other terms liabilities |
1.798 |
1.019 |
0.162 |
0.000 |
|
|
|
|
|
|
|
|
18 |
Total terms
liabilities(Add 11 to 17) |
1.798 |
1.019 |
0.162 |
0.000 |
|
|
|
|
|
|
|
|
19 |
Total Outside
Liabilites(10+18) |
87.892 |
96.278 |
105.833 |
120.442 |
|
|
|
|
|
|
|
|
|
NET WORTH |
|
|
|
|
|
20 |
Ordinary share capital |
465.189 |
481.070 |
539.339 |
591.889 |
|
|
|
|
|
|
|
|
21 |
General reserve |
0.000 |
0.000 |
0.000 |
0.000 |
|
|
|
|
|
|
|
|
22 |
Revaluation Reserve |
0.000 |
0.000 |
0.000 |
0.000 |
|
|
|
|
|
|
|
|
23 |
Other reserves(excluding provision) |
0.000 |
0.000 |
0.000 |
0.000 |
|
|
|
|
|
|
|
|
24 |
Surplus (+) or deficit (-) in profit and Loss account |
0.000 |
0.000 |
0.000 |
0.000 |
|
|
|
|
|
|
|
|
25 |
Net Worth |
465.189 |
481.070 |
539.339 |
591.889 |
|
|
|
|
|
|
|
|
26 |
Total Liabilities (19+25) |
553.081 |
577.348 |
645.172 |
712.331 |
|
|
|
|
|
|
|
|
|
CURRENT ASSETS |
|
|
|
|
|
27 |
Cash and bank balances |
41.427 |
51.421 |
61.028 |
74.532 |
|
|
|
|
|
|
|
|
28 |
Investment(other than long-term investments |
|
|
|
|
|
|
(i) Government and other Trustee Securities |
63.000 |
143.000 |
143.000 |
143.000 |
|
|
|
|
|
|
|
|
|
(ii) Fixed Deposits with Banks |
0.000 |
0.000 |
0.000 |
0.000 |
|
|
|
|
|
|
|
|
29 |
(i) Receivables other than deferred and exports(including bills
purchased & discounted by banks) |
173.041 |
194.201 |
233.041 |
269.649 |
|
|
|
|
|
|
|
|
|
(ii) Export receivables (including bills purchased/ discounted by
banks) |
0.000 |
0.000 |
0.000 |
0.000 |
|
|
|
|
|
|
|
|
30 |
Instalments of deferred receivables (due within one year) |
0.000 |
0.000 |
0.000 |
0.000 |
|
|
|
|
|
|
|
|
31 |
Inventory |
|
|
|
|
|
|
(i) Raw material(including stores and other items used in the process
manufacture) |
|
|
|
|
|
|
Imported |
0.000 |
0.000 |
0.000 |
0.000 |
|
|
|
|
|
|
|
|
|
Indigenous |
0.000 |
0.000 |
0.000 |
0.000 |
|
|
|
|
|
|
|
|
|
(ii) Stock-in process |
0.000 |
0.000 |
0.000 |
0.000 |
|
|
|
|
|
|
|
|
|
(iii) Finished goods |
46.608 |
87.390 |
104.868 |
125.842 |
|
|
|
|
|
|
|
|
|
(iv) Other consumable spares |
|
|
|
|
|
|
Imported |
0.000 |
0.000 |
0.000 |
0.000 |
|
|
|
|
|
|
|
|
|
Indigenous |
0.000 |
0.000 |
0.000 |
0.000 |
|
|
|
|
|
|
|
|
32 |
Advance to suppliers of raw material stores/spares |
0.000 |
0.000 |
0.000 |
0.000 |
|
|
|
|
|
|
|
|
33 |
Advances payment of taxes |
0.000 |
0.000 |
0.000 |
0.000 |
|
|
|
|
|
|
|
|
34 |
Other current assets (specify major items) |
80.108 |
93.760 |
96.760 |
93.760 |
|
|
|
|
|
|
|
|
35 |
Total Current
Assets(add 27 To 34) |
404.184 |
569.773 |
638.698 |
706.784 |
|
|
|
|
|
|
|
|
|
FIXED ASSETS |
|
|
|
|
|
36 |
Gross Block (land & bulding, machinery,Cap.work-in-progress) |
10.523 |
8.897 |
7.575 |
6.474 |
|
|
|
|
|
|
|
|
37 |
Depreciation To Date |
1.626 |
1.322 |
1.100 |
0.927 |
|
|
|
|
|
|
|
|
38 |
Net Block
(36-37) |
8.897 |
7.575 |
6.474 |
5.547 |
|
|
|
|
|
|
|
|
|
OTHER
NON-CURRENT ASSETS |
|
|
|
|
|
39 |
Investments/book debts/advances/ deposits which are not Current Assets |
|
|
|
|
|
i) |
Investments in subsidiary companies/affiliates |
0.000 |
0.000 |
0.000 |
0.000 |
|
|
Others |
|
|
|
|
|
|
|
|
|
|
|
|
ii) |
Advances to suppliers of capital goods & contractors |
0.000 |
0.000 |
0.000 |
0.000 |
|
|
|
|
|
|
|
|
iii) |
Deferred receivables (maturity exceeding one year) |
0.000 |
0.000 |
0.000 |
0.000 |
|
|
|
|
|
|
|
|
iv) |
Other |
140.000 |
0.000 |
0.000 |
0.000 |
|
|
|
|
|
|
|
|
40 |
Obsolete stock |
0.000 |
0.000 |
0.000 |
0.000 |
|
|
|
|
|
|
|
|
41 |
Other non-current assets including dues from directors |
0.000 |
0.000 |
0.000 |
0.000 |
|
|
|
|
|
|
|
|
42 |
Total other
non-current Assets (Total of 39 To 41) |
140.000 |
0.000 |
0.000 |
0.000 |
|
|
|
|
|
|
|
|
43 |
Intangible assets (patents,goodwill, preliminary expenses, bad/
doubtful debts not provided for, etc. |
0.000 |
0.000 |
0.000 |
0.000 |
|
|
|
|
|
|
|
|
44 |
Total Assets
(35+38+42+43) |
553.081 |
577.348 |
645.172 |
712.331 |
|
|
|
|
|
|
|
|
45 |
Tangible Net
worth(25-43) |
465.189 |
481.070 |
539.339 |
591.889 |
|
|
|
|
|
|
|
|
46 |
Net Working Capital
[(18+25) -(38+42+43)] Tally With Net Working
Capital (35-10) |
318.090 |
474.514 |
533.027 |
586.341 |
|
|
|
|
|
|
|
|
47 |
Current Ratio
(Items 35/10) |
4.69 |
5.98 |
6.04 |
5.87 |
|
|
|
|
|
|
|
|
48 |
Total Outside Liabilities/
Tangible Net worth(19/45) |
0.19 |
0.20 |
0.20 |
0.20 |
------------------------------------------------------------------------------------------------------------------------------
FUND FLOW STATEMENT
(INR IN MILLION)
|
PARTICULARS |
OPERATING YEARS |
|||
|
31.03.2018 Estimated |
31.03.2019 Projected |
31.03.2020 Projected |
31.03.2021 Projected |
|
|
1. Sources |
|
|
|
|
|
Net profit (After tax) |
46.577 |
59.503 |
75.852 |
98.988 |
|
|
|
|
|
|
|
Depreciation |
1.626 |
1.322 |
1.100 |
0.927 |
|
|
|
|
|
|
|
Increase in capital |
(95.549) |
(43.622) |
(17.582) |
(46.439) |
|
|
|
|
|
|
|
Increase in Term Liabilities (Including Public deposits) |
0.000 |
0.000 |
0.000 |
0.000 |
|
|
|
|
|
|
|
Decrease in |
|
|
|
|
|
Fixed Assets |
0.000 |
0.000 |
0.000 |
0.000 |
|
|
|
|
|
|
|
Other non-current assets |
0.000 |
140.000 |
0.000 |
0.000 |
|
|
|
|
|
|
|
Other |
0.000 |
0.000 |
0.000 |
0.000 |
|
|
|
|
|
|
|
Total |
(47.346) |
157.202 |
59.370 |
53.477 |
|
|
|
|
|
|
|
2. Uses |
|
|
|
|
|
|
|
|
|
|
|
Net loss |
0.000 |
0.000 |
0.000 |
0.000 |
|
|
|
|
|
|
|
Decrease in term Liabilities (Including public deposits) |
0.703 |
0.779 |
0.857 |
0.162 |
|
|
|
|
|
|
|
Increase in: |
|
|
|
|
|
Fixed Assets |
0.000 |
0.000 |
0.000 |
0.000 |
|
Other non-current assets |
140.000 |
0.000 |
0.000 |
0.000 |
|
|
|
|
|
|
|
Dividend payments |
0.000 |
0.000 |
0.000 |
0.000 |
|
|
|
|
|
|
|
Others |
0.000 |
0.000 |
0.000 |
0.000 |
|
|
|
|
|
|
|
Total |
140.703 |
0.779 |
0.857 |
0.162 |
|
|
|
|
|
|
|
3. Long-term Surplus (+)/Deficit (-) (1-2) |
(188.049) |
156.424 |
58.513 |
53.314 |
|
|
|
|
|
|
|
4. Increase/decrease in current assets |
(199.385) |
165.589 |
68.925 |
68.086 |
|
|
|
|
|
|
|
5. Increase/decrease in current liabilities other than Bank borrowings |
(61.105) |
9.165 |
10.412 |
14.772 |
|
|
|
|
|
|
|
6. Increase/decrease in working capital gap |
(138.280) |
156.424 |
58.513 |
53.314 |
|
|
|
|
|
|
|
7. Net surplus (+)/deficit (-) (Difference of 3 & 6) |
49.769 |
0.000 |
0.000 |
0.000 |
|
|
|
|
|
|
|
8. Increase/decrease in: |
|
|
|
|
|
Bank borrowing |
(49.769) |
0.000 |
0.000 |
0.000 |
|
|
|
|
|
|
|
Net Sales |
155.361 |
116.521 |
116.521 |
139.825 |
|
|
|
|
|
|
|
*Break-up of(4) |
|
|
|
|
|
|
|
|
|
|
|
Increase/Decrease
in: |
|
|
|
|
|
Raw Materials |
0.000 |
0.000 |
0.000 |
0.000 |
|
|
|
|
|
|
|
Stocks-in-Process |
0.000 |
0.000 |
0.000 |
0.000 |
|
|
|
|
|
|
|
Finished Goods |
(73.296) |
40.782 |
17.478 |
20.974 |
|
|
|
|
|
|
|
Increase/Decrease
in Receivables: |
|
|
|
|
|
Exports |
0.000 |
0.000 |
0.000 |
0.000 |
|
|
|
|
|
|
|
Domestic |
(206.849) |
21.160 |
38.840 |
36.608 |
|
|
|
|
|
|
|
Increase/Decrease in stores Spares |
0.000 |
0.000 |
0.000 |
0.000 |
|
|
|
|
|
|
|
Increase/Decrease in other current assets |
44.116 |
89.994 |
9.607 |
13.504 |
------------------------------------------------------------------------------------------------------------------------------
COMPARATIVE STATEMENT OF CURRENT ASSETS
& CURRENT LIABILITIES
(INR IN MILLION)
|
SR. NO. |
PARTICULARS |
OPERATING YEARS |
|||
|
31.03.2018 Estimated |
31.03.2019 Projected |
31.03.2020 Projected |
31.03.2021 Projected |
||
|
|
A. CURRENT ASSETS |
|
|
|
|
|
|
|
|
|
|
|
|
1 |
Stock
in Trade |
46.608 |
87.390 |
104.868 |
125.842 |
|
|
|
|
|
|
|
|
|
(Months
cost of sales) |
2 |
3 |
3 |
3 |
|
|
|
|
|
|
|
|
2 |
Receivables other than export and deferred receivables (including
bills purchased & discounted by bankers |
313.041 |
194.201 |
233.041 |
269.649 |
|
|
|
|
|
|
|
|
|
Month’s Domestic Sales |
8 |
4 |
4 |
4 |
|
|
|
|
|
|
|
|
3 |
Export receivables (including bills purchased & discounted) |
0.000 |
0.000 |
0.000 |
0.000 |
|
|
|
|
|
|
|
|
|
Month’s Export Sales |
0.00 |
0.00 |
0.00 |
0.00 |
|
|
|
|
|
|
|
|
4 |
Advance to suppliers of raw materials and stores/ spares, consumables |
0.000 |
0.000 |
0.000 |
0.000 |
|
|
|
|
|
|
|
|
5 |
Other current assets including cash and bank balances & deferred
receivables due within one year (specify major items) |
184.535 |
288.181 |
300.788 |
311.292 |
|
|
|
|
|
|
|
|
6 |
Total current
Assets (To agree with item 35 in Form III) |
404.184 |
569.773 |
638.698 |
706.784 |
|
|
|
|
|
|
|
|
|
B. Current Liabilities (Other
than bank borrowing for working capital) |
|
|
|
|
|
|
|
|
|
|
|
|
7 |
Sundry
Creditors (Trade) |
6.627 |
7.444 |
8.784 |
10.365 |
|
|
|
|
|
|
|
|
|
(Month’s Purchases) |
0.00 |
0.00 |
0.00 |
0.00 |
|
|
|
|
|
|
|
|
8 |
Advances payment from customers/ deposits from dealers |
0.000 |
0.000 |
0.000 |
0.000 |
|
|
|
|
|
|
|
|
9 |
Statutory Liabilities |
27.817 |
35.565 |
45.100 |
58.179 |
|
|
|
|
|
|
|
|
10 |
Other current liabilities (Specify major items such as Short-term borrowing,
unsecured loans, dividend payable, instalments of TL. DPG, Public
deposits,debentures, etc. |
1.650 |
2.250 |
1.787 |
1.899 |
|
|
|
|
|
|
|
|
11 |
Total (To agree
with sub-total B- Form III) |
36.094 |
45.259 |
55.670 |
70.442 |
------------------------------------------------------------------------------------------------------------------------------
COMPUTATION OF MAXIMUM PERMISSIBLE BANK
FINANCE FOR WORKING CAPITAL
(INR IN MILLION)
|
PARTICULARS |
OPERATING YEARS |
|||
|
31.03.2018 Estimated |
31.03.2019 Projected |
31.03.2020 Projected |
31.03.2021 Projected |
|
|
FIRST METHOD OF LENDING |
|
|
|
|
|
1. Total Current Assets,(6 in Form IV) |
404.184 |
569.773 |
638.698 |
706.784 |
|
|
|
|
|
|
|
2. Current Liabilities (Other than bank borrowing) (2 to 9 of Form III) |
36.094 |
45.259 |
55.670 |
70.442 |
|
|
|
|
|
|
|
3. Working Capital Gap (WCG)(1-2) |
368.090 |
524.514 |
583.027 |
636.341 |
|
|
|
|
|
|
|
4. Minimum stipulated net working Capital i.e. 25% of WCG/25% of total current asset as the case may be depending upon the method of lending being applied (Export receivables to be excluded under both methods) |
92.023 |
131.129 |
145.757 |
159.085 |
|
|
|
|
|
|
|
5. Actual/projected net working capital (46 in Form III) |
318.090 |
474.514 |
533.027 |
586.341 |
|
|
|
|
|
|
|
6. Assessed Bank Finance (3-4) |
276.068 |
393.386 |
437.270 |
477.256 |
|
|
|
|
|
|
|
7. Item 3 minus item 5 |
50.000 |
50.000 |
50.000 |
50.000 |
|
|
|
|
|
|
|
8. Maximum permissible bank finance (Item 6 or 7 whichever is Lower) |
50.000 |
50.000 |
50.000 |
50.000 |
|
|
|
|
|
|
|
9. Excess borrowings representing shortfall in NWC(4-5) |
(226.068) |
(343.386) |
(387.270) |
(427.256) |
|
|
|
|
|
|
|
SECOND METHOD OF LENDING |
|
|
|
|
|
|
|
|
|
|
|
1. Total Current Assets,(6 in Form IV) |
404.184 |
569.773 |
638.698 |
706.784 |
|
|
|
|
|
|
|
2. Current Liabilities (Other than bank borrowing) (2 to 9 of Form III) |
36.094 |
45.259 |
55.670 |
70.442 |
|
|
|
|
|
|
|
3. Working Capital Gap (WCG)(1-2) |
368.090 |
524.514 |
583.027 |
636.341 |
|
|
|
|
|
|
|
4. Minimum stipulated net working Capital i.e. 25% of WCG/25% of total current asset as the case may be depending upon the method of lending being applied (Export receivables to be excluded under both methods) |
101.046 |
142.443 |
159.674 |
176.696 |
|
|
|
|
|
|
|
5. Actual/projected net working capital (46 in Form III) |
318.090 |
474.514 |
533.027 |
586.341 |
|
|
|
|
|
|
|
6. Assessed Bank Finance (3-4) |
267.044 |
382.071 |
423.353 |
459.646 |
|
|
|
|
|
|
|
7. Item 3 minus item 5 |
50.000 |
50.000 |
50.000 |
50.000 |
|
|
|
|
|
|
|
8. Maximum permissible bank finance (Item 6 or 7 whichever is Lower) |
50.000 |
50.000 |
50.000 |
50.000 |
|
|
|
|
|
|
|
9. Excess borrowings representing shortfall in NWC(4-5) |
(217.044) |
(332.071) |
(373.353) |
(409.646) |
------------------------------------------------------------------------------------------------------------------------------
FINANCIAL RATIO
(INR IN MILLION)
|
PARTICULARS |
OPERATING YEARS |
|||
|
31.03.2018 Estimated |
31.03.2019 Projected |
31.03.2020 Projected |
31.03.2021 Projected |
|
|
1. General Parameter |
|
|
|
|
|
Growth In Net Sale |
50 |
25 |
20 |
20 |
|
|
|
|
|
|
|
Growth In Net Profit |
50.16 |
27.75 |
27.48 |
30.50 |
|
|
|
|
|
|
|
Growth In Net Worth |
(9.52) |
3.41 |
12.11 |
9.74 |
|
|
|
|
|
|
|
Export Sales/Total Sales |
0.00 |
0.00 |
0.00 |
0.00 |
|
|
|
|
|
|
|
Domestic Sales/Total Sales |
100 |
100 |
100 |
100 |
|
|
|
|
|
|
|
2. Liquidity Ratio |
|
|
|
|
|
Current Ratio |
4.69 |
5.98 |
6.04 |
5.87 |
|
|
|
|
|
|
|
Quick Ratio |
4.15 |
5.06 |
5.05 |
4.82 |
|
|
|
|
|
|
|
3. Turnover Ratio |
|
|
|
|
|
Stock Turnover
Ratio:- |
|
|
|
|
|
Raw Material |
N.A. |
N.A. |
N.A. |
N.A. |
|
|
|
|
|
|
|
Work in Process |
N.A. |
N.A. |
N.A. |
N.A. |
|
|
|
|
|
|
|
Finished Goods/ Traded Goods |
5.6 |
8.7 |
7.27 |
7.27 |
|
|
|
|
|
|
|
Debtor Turnover Ratio |
1.69 |
3.17 |
3.27 |
3.34 |
|
|
|
|
|
|
|
Average Collection Period |
213.02 |
113.56 |
110.09 |
107.78 |
|
|
|
|
|
|
|
Creditors Turnover Ratio |
5.3 |
56.54 |
54.98 |
54.83 |
|
|
|
|
|
|
|
Average Payment Period |
67.92 |
6.37 |
6.55 |
6.57 |
|
|
|
|
|
|
|
Fixed Assets Turnover Ratio |
52.39 |
76.91 |
107.98 |
151.24 |
|
|
|
|
|
|
|
Total Assets Turnover Ratio |
0.84 |
1.01 |
1.08 |
1.18 |
|
|
|
|
|
|
|
4. Solvency Ratio |
|
|
|
|
|
Debt-Equity Ratio |
0.00 |
0.00 |
0.00 |
0.00 |
|
|
|
|
|
|
|
Total Outside Liability/Total Net Worth |
0.19 |
0.20 |
0.20 |
0.20 |
|
|
|
|
|
|
|
Term Loan/Cash Profit |
0.01 |
0.00 |
0.00 |
0.00 |
|
|
|
|
|
|
|
Term Loan Interest/Term Borrowing |
0.00 |
0.00 |
0.00 |
0.00 |
|
|
|
|
|
|
|
WC Interest/WC Borrowing |
0.01 |
0.08 |
0.08 |
0.08 |
|
|
|
|
|
|
|
5. Coverage Ratio |
|
|
|
|
|
Interest Coverage Ratio |
25.29 |
21.13 |
26.66 |
34.48 |
|
|
|
|
|
|
|
6. Profitability Ratio |
|
|
|
|
|
Gross Profit Ratio |
34.68 |
35.04 |
35.31 |
36.40 |
|
|
|
|
|
|
|
Operating Profit Ratio |
15.21 |
15.55 |
16.51 |
17.96 |
|
|
|
|
|
|
|
Net Profit Ratio |
9.99 |
10.21 |
10.85 |
11.8 |
|
|
|
|
|
|
|
Return On Capital Employed |
5.95 |
6.23 |
7.07 |
8.40 |
|
|
|
|
|
|
|
Return On Net Worth |
10.01 |
12.37 |
14.06 |
16.72 |
|
|
|
|
|
|
|
Retention Ratio |
100 |
100 |
100 |
100 |
|
|
|
|
|
|
|
Payout Ratio |
0.00 |
0.00 |
0.00 |
0.00 |
|
|
|
|
|
|
|
7. Funding of Current Assets |
|
|
|
|
|
|
|
|
|
|
|
Bank Borrowing |
12.37 |
8.78 |
7.83 |
7.07 |
|
|
|
|
|
|
|
Trade Creditors |
1.64 |
1.31 |
1.38 |
1.47 |
|
|
|
|
|
|
|
Net Working Capital |
78.70 |
83.28 |
83.46 |
82.96 |
|
|
|
|
|
|
|
Other Current Liability |
7.29 |
6.64 |
7.34 |
8.50 |
|
|
|
|
|
|
|
Total Current Assets |
100 |
100 |
100 |
100 |
------------------------------------------------------------------------------------------------------------------------------
NETWORTH STATEMENT
MR. NITIN KUMAR
(INR IN MILLION)
|
PARTICULARS |
31.03.2017 |
|
HOUSE PROPERTY |
|
|
House Property at 104 Safdarjung New Delhi |
0.856 |
|
|
|
|
House Property at Lucknow |
7.812 |
|
|
|
|
House Property at Madangir New Delhi |
2.033 |
|
|
|
|
Agricultural Land |
17.898 |
|
|
|
|
Other Assets |
1.194 |
|
|
|
|
Total |
29.793 |
|
|
|
|
INVESTMENT |
|
|
PPF Deposit |
1.097 |
|
|
|
|
Share in Partnership Firm [Prenit World LLP] |
179.602 |
|
|
|
|
Investment in Listed Share |
9.567 |
|
|
|
|
SBI Saving Plan |
0.100 |
|
|
|
|
Investment in Mutual Fund |
22.030 |
|
|
|
|
Life Insurance |
3.986 |
|
|
|
|
NHAI Bond |
6.220 |
|
|
|
|
Unlisted Share |
0.700 |
|
|
|
|
Total |
223.302 |
|
|
|
|
CURRENT ASSETS |
|
|
Sundry Debtors |
0.379 |
|
|
|
|
Other Assets |
52.755 |
|
|
|
|
Total |
53.134 |
|
|
|
|
CASH & BANK BALANCE |
|
|
Cash at Bank |
6.718 |
|
|
|
|
Cash in Hand |
0.453 |
|
|
|
|
FDR with Bank |
0.497 |
|
|
|
|
Total |
7.668 |
|
|
|
|
TOTAL ASSETS |
313.897 |
|
|
|
|
LESS: LOANS AND OTHER LIABILITIES |
|
|
Unsecured Loans |
1.182 |
|
|
|
|
Other Current Liabilities |
0.041 |
|
|
|
|
TOTAL LIABILITIES |
1.223 |
|
|
|
|
NET WORTH |
312.674 |
------------------------------------------------------------------------------------------------------------------------------
NETWORTH STATEMENT
MRS. REKHA SRIVASTAVA
(INR IN MILLION)
|
PARTICULARS |
31.03.2017 |
|
HOUSE PROPERTY |
|
|
House Property at C-25 Vasant Vihar-New
Delhi |
21.918 |
|
|
|
|
House Property at 17, G.F. Vasant Vihar-New
Delhi |
256.404 |
|
|
|
|
House Property at 15/7 Madan Mohan Malviya
Marg Lucknow |
8.480 |
|
|
|
|
House Property at J-182 Rajoury Garden New Delhi |
6.306 |
|
|
|
|
House Property at B-24 Mayfair Garden New
Delhi |
107.826 |
|
|
|
|
House Property at Madangir 7/134 |
1.943 |
|
|
|
|
Agricultural Land |
9.470 |
|
|
|
|
Other Assets |
1.684 |
|
|
|
|
Total |
414.031 |
|
|
|
|
INVESTMENT |
|
|
Listed Shares |
0.736 |
|
|
|
|
PPF Deposit |
0.840 |
|
|
|
|
Share in Partnership Firm |
335.560 |
|
|
|
|
SBI Saving Plan |
0.100 |
|
|
|
|
ICICI Pru Elite Wealth LP |
1.500 |
|
|
|
|
NTPC Bond |
0.156 |
|
|
|
|
Mutual Fund |
42.913 |
|
|
|
|
Total |
381.805 |
|
|
|
|
CURRENT ASSETS |
|
|
Other Assets |
70.019 |
|
|
|
|
Total |
70.019 |
|
|
|
|
CASH & BANK BALANCE |
|
|
Cash at Bank |
2.704 |
|
|
|
|
Cash in Hand |
0.292 |
|
|
|
|
FDR with Bank |
15.534 |
|
|
|
|
Total |
18.530 |
|
|
|
|
TOTAL ASSETS |
884.385 |
|
|
|
|
LESS: LOANS AND OTHER LIABILITIES |
|
|
Unsecured Loans |
73.902 |
|
|
|
|
Secured Loans |
105.005 |
|
|
|
|
Other Current Liabilities |
0.035 |
|
|
|
|
TOTAL LIABILITIES |
178.942 |
|
|
|
|
NET WORTH |
705.443 |
-----------------------------------------------------------------------------------------------------------------------------
COMPANY PROFILE
NATURE OF BUSINESS:
The firm is into providing turkey medical infra solutions which include surgical operation theatres, medical gas pipeline systems, Intensive care units, etc.
YEAR OF COMMENCEMENT
OF BUSINESS
Prenit World was incepted as a partnership firm in 2008. The same was converted into an Limited Liability Partnership (LLP) on the 21st of December 2011. One of the three partners, Ms. Pallavi Srivastava, retired on 29th February 2012. Current two partners are Mr. Nitin Kumar and Mrs. Rekha Srivastava.
BRIEF BUSINESS
OPERATION MODEL
The firm is into providing healthcare infra solutions which includes Assembly/ installation and set-up of operation theatres, paramedical services, medical gas pipelines etc. The main source of revenue for the firm is from operations theatres. The main activities undertaken by the firm for setting up of operation theatres are as below:
DESIGN
The firm designs the critical care area taking into consideration the kind of surgeries to be performed, the traffic, number of surgeries, etc. to optimize the work flow and increase the overall efficiency of the hospital by performing more surgeries per day.
MODULAR CONSTRUCTION
·
WALL AND
CEILING SYSTEM
This includes installation of anti-bacterial materials, quick access to medical gases, electrical installations, ensuring required pressure conditions are met, meeting the fire resistant and sound insulation standards etc.
·
FLOOR
This includes specialized material to ensure that there are no static charges on personnel and equipment, seamless construction, anti-skid surfaces etc.
·
DOORS
This includes installation of hermetically sealing automatic doors, antibacterial surface, ease of operation, fire and smoke resistant doors etc.
·
ROOM
ILLUMINATION
This includes illuminating equipment’s which provide clear visibility and dust free illumination.
EQUIPMENT’S
The firm installs equipment’s including OT lights, double arm pendants, digital multiconsole systems, X ray view panel, etc.
The firm also provides equipment’s to control infection like particle filters, ventilation system and waste management passages.
These equipment are procured from Germany, USA, Greece, Italy as well as domestically. The firm is also getting into providing communication equipment in the OT to be able to enable teaching and facilitate video and audio transmission.
The company deals with two types of customer:
1. Government backed projects – these are the projects which are mainly awarded by government bodies like ESIC who is responsible for the setting up of and running up of government hospital in India. Apart from ESIC various state owned bodies are also setting up medical colleges and hospital which includes Uttar Pradesh Rajkiya Nirman Nigam Limited (UPRNNL), NBCC etc.
Private company projects – Company has also started to execute projects of private construction companies like Larsen and Toubro, NCC, J Kumar, etc.
INVESTMENT BUSINESS
Funds invested in real estate, Equities trade, Mutual Funds, Forex trade, Commodity trade, debt instruments trade, trading of other financial markets instruments.
FUTURE BUSINESS
Any business as specified in the partnership deed.
------------------------------------------------------------------------------------------------------------------------------
VALUATION REPORT
(GENERAL DETAILS)
|
Date as on which valuation is made |
23.01.2018 |
|
|
|
|
Name of the Owner/Owers |
Mr. Dhirendra Kumar S/o Late Mr. Prem Narain |
|
|
|
|
Location, Street, Ward No. |
Plot No. 8, Local Shopping centre, Block -B-
6 & 7, Safdarjung Enclave, New Delhi |
|
Fair Market Value |
INR 275.930 Million |
|
|
|
|
Realizable Value |
INR 234.541 Million |
|
|
|
|
Distress Sale value |
INR 220.744 Million |
|
|
|
|
Circle rate value |
INR 179.770 Million |
|
|
|
|
Insurance value |
INR 9.290 Million |
------------------------------------------------------------------------------------------------------------------------------
INDEX OF CHARGES:
|
SNO |
SRN |
CHARGE ID |
CHARGE HOLDER NAME |
DATE OF CREATION |
DATE OF MODIFICATION |
DATE OF SATISFACTION |
AMOUNT |
ADDRESS |
|
1 |
M05824941 |
100142325 |
BANK OF INDIA |
27/11/2017 |
- |
- |
20992000.0 |
B-6/8, Community Centre Safdarjung Enclave South Delhi DL 110029 IN |
|
2 |
M05365986 |
100130685 |
BANK OF INDIA |
05/10/2017 |
- |
- |
26292000.0 |
B-6/8, LOCAL SHOPPING CENTRE, CHOWDHARY HARSUKH MARG, NEW DELHI South Delhi DL 110029 IN |
|
3 |
L02227304 |
10541510 |
The Hongkong and Shanghai Banking Corporation Limited |
17/12/2014 |
- |
- |
14750000.0 |
25, Barakhamba Road New Delhi New Delhi DL 110001 IN |
|
4 |
L01189463 |
10450940 |
The Hongkong and Shanghai Banking Corporation |
26/09/2013 |
14/02/2014 |
- |
150000000.0 |
25, Barakhambha Road New Delhi New Delhi DL 110001 IN |
FIXED ASSETS:
Tangible Assets
· Land
· Building
· Furniture and Fixtures
· Electrical Fittings
· Air Conditioner
· Camera
· Mobile Phone
· Office Equipments
· Tools and Components
· Ups and Stablizer
· Inverter
· Camera
· Machinery and Tools, etc
------------------------------------------------------------------------------------------------------------------------------
CMT REPORT (Corruption, Money Laundering & Terrorism]
The Public Notice information has been collected from various sources
including but not limited to: The Courts, India Prisons Service, Interpol,
etc.
1] INFORMATION ON
DESIGNATED PARTY
No records exist designating subject or any of its beneficial owners,
controlling shareholders or senior officers as terrorist or terrorist
organization or whom notice had been received that all financial transactions
involving their assets have been blocked or convicted, found guilty or against
whom a judgement or order had been entered in a proceedings for violating
money-laundering, anti-corruption or bribery or international economic or
anti-terrorism sanction laws or whose assets were seized, blocked, frozen or
ordered forfeited for violation of money laundering or international
anti-terrorism laws.
2] Court Declaration :
No records exist to suggest that subject is
or was the subject of any formal or informal allegations, prosecutions or other
official proceeding for making any prohibited payments or other improper
payments to government officials for engaging in prohibited transactions or
with designated parties.
3] Asset Declaration :
No records exist to suggest that the property or assets of the subject
are derived from criminal conduct or a prohibited transaction.
4] Record on Financial
Crime :
Charges or conviction
registered against subject: None
5] Records on Violation of
Anti-Corruption Laws :
Charges or
investigation registered against subject: None
6] Records on Int’l
Anti-Money Laundering Laws/Standards :
Charges or
investigation registered against subject: None
7] Criminal Records
No available
information exist that suggest that subject or any of its principals have been
formally charged or convicted by a competent governmental authority for any
financial crime or under any formal investigation by a competent government
authority for any violation of anti-corruption laws or international anti-money
laundering laws or standard.
8] Affiliation with
Government :
No record
exists to suggest that any director or indirect owners, controlling
shareholders, director, officer or employee of the company is a government
official or a family member or close business associate of a Government
official.
9] Compensation Package :
Our market
survey revealed that the amount of compensation sought by the subject is fair
and reasonable and comparable to compensation paid to others for similar
services.
10] Press Report :
No press reports / filings exists on
the subject.
CORPORATE GOVERNANCE
MIRA INFORM as part of its Due Diligence do provide comments on
Corporate Governance to identify management and governance. These factors often
have been predictive and in some cases have created vulnerabilities to credit
deterioration.
Our Governance Assessment focuses principally on the interactions
between a company’s management, its Board of Directors, Shareholders and other
financial stakeholders.
CONTRAVENTION
Subject is not known to have contravened any existing local laws,
regulations or policies that prohibit, restrict or otherwise affect the terms
and conditions that could be included in the agreement with the subject.
FOREIGN EXCHANGE RATES
|
Currency |
Unit
|
INR |
|
US Dollar |
1 |
INR 63.92 |
|
UK Pound |
1 |
INR 89.55 |
|
Euro |
1 |
INR 79.68 |
INFORMATION DETAILS
|
Information
Gathered by : |
GYT |
|
|
|
|
Analysis Done by
: |
NIS |
|
|
|
|
Report Prepared
by : |
IND |
SCORE FACTORS
|
DEMERIT POINTS |
|
|
|
--BANK CHARGES |
YES/NO |
YES |
|
--LITIGATION |
YES/NO |
NO |
|
--OTHER ADVERSE INFORMATION |
YES/NO |
NO |
|
MERIT POINTS |
|
|
|
--SOLE DISTRIBUTORSHIP |
YES/NO |
NO |
|
--EXPORT ACTIVITIES |
YES/NO |
NO |
|
--AFFILIATION |
YES/NO |
NO |
|
--LISTED |
YES/NO |
NO |
|
--OTHER MERIT FACTORS |
YES/NO |
YES |
RATING EXPLANATIONS
|
Credit Rating |
Explanation |
Rating Comments |
|
A++ |
Minimum Risk |
Business dealings permissible with minimum
risk of default |
|
A+ |
Low Risk |
Business dealings permissible with low
risk of default |
|
A |
Acceptable Risk |
Business dealings permissible with
moderate risk of default |
|
B |
Medium Risk |
Business dealings permissible on a regular
monitoring basis |
|
C |
Medium High Risk |
Business dealings permissible preferably
on secured basis |
|
D |
High Risk |
Business dealing not recommended or on
secured terms only |
|
NB |
New Business |
No recommendation can be done due to
business in infancy stage |
|
NT |
No Trace |
No recommendation can be done as the
business is not traceable |
NB is stated where there is insufficient information to facilitate rating. However, it is not to be considered as unfavourable.
This score serves as a reference to assess
SC’s credit risk and to set the amount of credit to be extended. It is
calculated from a composite of weighted scores obtained from each of the major
sections of this report. The assessed factors are as follows:
·
Financial
condition covering various ratios
·
Company
background and operations size
·
Promoters
/ Management background
·
Payment
record
·
Litigation
against the subject
·
Industry
scenario / competitor analysis
·
Supplier
/ Customer / Banker review (wherever available)
This report is issued at
your request without any risk and responsibility on the part of MIRA INFORM
PRIVATE LIMITED (MIPL) or its officials.