|
|
|


MIRA
INFORM REPORT
|
Report No. : |
493826 |
|
Report Date : |
27.02.2018 |
IDENTIFICATION DETAILS
|
Name : |
ROCON TRADE JSC |
|
|
|
|
Registered Office : |
UL. 21-VI Vek 56A 1700 Sofia |
|
|
|
|
Country : |
Bulgaria |
|
|
|
|
Financials (as on) : |
31.12.2016 |
|
|
|
|
Date of Incorporation : |
14.02.1996 |
|
|
|
|
Legal Form : |
Joint Stock Company (AD) |
|
|
|
|
Line of Business : |
Research, development, manufacturing and maintenance of
wide range of world-class intelligent electronic devices (IEDs): relay
protections, bay monitoring and control units, testing and measuring
equipment for the power energy industry |
|
|
|
|
No. of Employees : |
3 (2017) |
RATING & COMMENTS
(Mira Inform has adopted New Rating mechanism w.e.f. 23rd
January 2017)
|
MIRA�s Rating : |
B |
|
Credit Rating |
Explanation |
Rating Comments |
|
B |
Medium Risk |
Business dealings permissible on a regular
monitoring basis |
|
Status : |
Moderate |
|
|
|
|
Payment Behaviour : |
Slow� |
|
|
|
|
Litigation : |
Clear |
NOTES :
Any query related to this report can be made
on e-mail : infodept@mirainform.com
while quoting report number, name and date.
ECGC Country Risk Classification List
|
Country Name |
Previous Rating (30.09.2017) |
Current Rating (31.12.2017) |
|
Bulgaria |
A2 |
A2 |
|
Risk Category |
ECGC Classification |
|
Insignificant |
A1 |
|
Low Risk |
A2 |
|
Moderately Low Risk |
B1 |
|
Moderate Risk |
B2 |
|
Moderately High Risk |
C1 |
|
High Risk |
C2 |
|
Very High Risk |
D |
BULGARIA - ECONOMIC
OVERVIEW
Bulgaria, a former communist country that entered the EU in 2007, has an open economy that historically has demonstrated strong growth, but its per-capita income remains the lowest among EU members and its reliance on energy imports and foreign demand for its exports makes its growth sensitive to external market conditions.
The government undertook significant structural economic reforms in the 1990s to move the economy from a centralized, planned economy to a more liberal, market-driven economy. These reforms included privatization of state-owned enterprises, liberalization of trade, and strengthening of the tax system - changes that initially caused some economic hardships but later helped to attract investment, spur growth, and make gradual improvements to living conditions. From 2000 through 2008, Bulgaria maintained robust, average annual real GDP growth in excess of 6%, which was followed by a deep recession in 2009 as the financial crisis caused domestic demand, exports, capital inflows and industrial production to contract, prompting the government to rein in spending. Real GDP growth remained slow - less than 2% annually - until 2015, when demand from EU countries for Bulgarian exports, plus an inflow of EU development funds, boosted growth to more than 3%. In recent years, strong domestic demand combined with low international energy prices have contributed to Bulgaria�s economic growth approaching 4% and have also helped to ease inflation which turned positive in 2017. Bulgaria�s prudent public financial management contributed to a balanced budget in 2016 and a near-balanced budget for 2017.
Bulgaria is heavily reliant on energy imports from Russia, a potential vulnerability, and is a participant in EU-backed efforts to diversify regional natural gas supplies. In late 2016, the Bulgarian Government provided funding to Bulgaria�s National Electric Company to cover the $695 million compensation owed to Russian nuclear equipment manufacturer Atomstroyexport for the cancellation of the Belene Nuclear Power Plant project, which the Bulgarian Government terminated in 2012. The natural gas market, however, continues to be dominated by state-owned Bulgargaz, which is almost entirely supplied by Russia. Infrastructure projects such as the Inter-Connector Greece-Bulgaria and Inter-Connector Bulgaria-Serbia, which would enable Bulgaria to have access to non-Russian gas, have either stalled or made limited progress. In 2016, the Bulgarian Government established the State eGovernment Agency. This new agency is responsible for the implementation of projects related to electronic governance as well as coordination of national policies in this area with the EU requirements and practices, as well as to strengthen cybersecurity.
Despite a favorable investment regime, including low, flat corporate income taxes, significant challenges remain. Corruption in public administration, a weak judiciary, low productivity, and the presence of organized crime continue to hamper the country's investment climate and economic prospects.
|
Source
: CIA |
COMPANY DETAILS
Local
name: ROKON TREYD AD
International
name: Rocon Trade JSC
Registered
address:
UL.
21-VI VEK 56A
1700 SOFIA
Bulgaria
Telephone: +359 2 962 22 74, +359 2 962 23 94
Fax: +359 2 962 86 40
E-Mail: rocon@roconbg.com
Internet: http://roconbg.com/
ESTABLISHMENT
& REGISTRATION:
Established:
14.02.1996
Registered at Sofia town court
Court number 2924/1996
Bulstat/VAT number: 121038382
Status
of the company:
Active
LEGAL
FORM:
Joint Stock Company (AD)
REGISTERED
CAPITAL:
BGN 50 000.00
SHAREHOLDERS/MANAGEMENT
SHAREHOLDERS:
|
OGNYAN MARINOV KATOV |
ID 5402136704 |
60,00% |
|
VLADISLAV KOSTADINOV HRISTOV |
ID 5402066680 |
40,00% |
MANAGEMENT:
|
Name |
ID |
Function |
Nationality |
|
VLADISLAV KOSTADINOV HRISTOV |
5402066680 |
Representative |
Bulgaria |
|
BOYKO NIKOLOV HRISTOV |
5407206980 |
Board of Directors |
Bulgaria |
|
OGNYAN MARINOV KATOV |
5402136704 |
Board of Directors |
Bulgaria |
|
VLADISLAV KOSTADINOV HRISTOV |
5402066680 |
Board of Directors |
Bulgaria |
RELATED
COMPANIES:
|
Company
ID |
Company
Name |
|
831681266 |
ROKON INJENERING AD |
|
121117171 |
ROKON IZSLEDOVATELSKI TSENTAR AD |
|
40573666 |
SOFIYSKI TEHNOLOGICHEN INSTITUT |
|
175157319 |
VIHOLD EOOD |
|
175157301 |
KATOV EOOD |
|
40031740 |
KOMTRON EOOD |
BUSINESS ACTIVITY
BUSINESS
OPERATION:
NACE 1.1: 51.87 Wholesale of
other machinery for use in industry, trade and navigation
Activity:
Research,
development, manufacturing and maintenance of wide range of world-class
intelligent electronic devices (IEDs): relay protections, bay monitoring and
control units, testing and measuring equipment for the power energy industry
Innovative concepts for substation automation.
Fast and excellent results in �€�turnkey�€� construction of modern
substations
Substantial achievements in research and development related to the use of new
and renewable energy sources and energy saving.
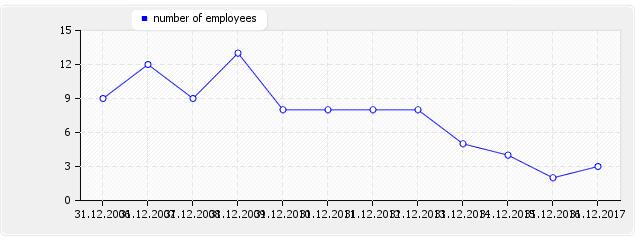
NUMBER
OF EMPLOYEES:
|
As
at date |
Value |
|
31.12.2006 |
9 |
|
31.12.2007 |
12 |
|
31.12.2008 |
9 |
|
31.12.2009 |
13 |
|
31.12.2010 |
8 |
|
31.12.2011 |
8 |
|
31.12.2012 |
8 |
|
31.12.2013 |
8 |
|
31.12.2014 |
5 |
|
31.12.2015 |
4 |
|
31.12.2016 |
2 |
|
31.12.2017 |
3 |
EXPORT:
Taiwan, India, Turkey, Russia,
Slovenia, Egypt, Indonesia, Malaysia, Myanmar
IMPORT:
EU
REAL
ESTATE:
None
FINANCIAL DATA
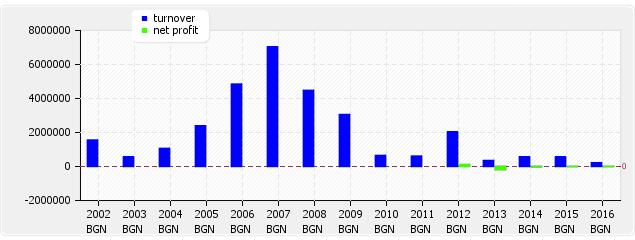
TURNOVER:
|
Year |
Currency |
Value |
|
2002 |
BGN |
1
557 000.00 |
|
2003 |
BGN |
564
000.00 |
|
2004 |
BGN |
1
069 000.00 |
|
2005 |
BGN |
2
393 000.00 |
|
2006 |
BGN |
4
849 000.00 |
|
2007 |
BGN |
7
035 000.00 |
|
2008 |
BGN |
4
483 000.00 |
|
2009 |
BGN |
3
061 000.00 |
|
2010 |
BGN |
654
000.00 |
|
2011 |
BGN |
613
000.00 |
|
2012 |
BGN |
2
033 000.00 |
|
2013 |
BGN |
357
000.00 |
|
2014 |
BGN |
573
000.00 |
|
2015 |
BGN |
562
000.00 |
|
2016 |
BGN |
226
000.00 |
MODES
OF PAYMENT:
Slow
DEBT
COLLECTION:
No debt collection cases are
registered against the company.
BANK
DISTRAINTS:
No shares of the company are
under bank distraint.
UNPAID
TAXES/ CONTRIBUTIONS TO GOVERNMENT:
There is no publication about
overdue unpaid taxes.
INVOLVEMENT
IN LEGAL DISPUTES:
There is no publication about
legal claims or disputes against the company.
OTHER
PAYMENT INFORMATION:
No adverse payment information
is available.
BRANCH
INDICATOR:
The company's payment behaviour
is average for the branch.
|
Ratio |
2013 |
2014 |
2015 |
2016 |
|
Accounting
period: |
1.1.2013
- |
1.1.2014
- |
1.1.2015
- |
1.1.2016
- |
|
Debt ratio |
0.21 |
0.21 |
0.31 |
0.19 |
|
Quick ratio |
0.65 |
0.55 |
0.67 |
0.53 |
|
Current ratio |
3.84 |
3.24 |
1.99 |
3.26 |
|
Days purchase in payables |
320.56 |
223.30 |
343.29 |
414.64 |
|
Operating margin in % |
0.00 |
0.00 |
0.18 |
0.89 |
|
Cash ratio (acid ratio) |
0.04 |
0.00 |
0.00 |
0.01 |
|
Return on sales ROS in % |
0.00 |
0.00 |
0.18 |
0.89 |
|
Return on assets ROA in % |
0.00 |
0.00 |
0.06 |
0.15 |
|
Return on equity ROE in % |
0.00 |
0.00 |
0.08 |
0.18 |
|
Days supply in inventory |
1
021.35 |
599.76 |
453.21 |
1
133.04 |
|
Days sales in receivables |
194.16 |
122.39 |
227.57 |
215.36 |
|
BALANCE SHEET in BGN'000 |
2013 |
2014 |
2015 |
2016 |
|
Accounting
period: |
1.1.2013
- |
1.1.2014
- |
1.1.2015
- |
1.1.2016
- |
|
A. UNPAID CAPITAL |
|
|
|
|
|
B. FIXED ASSETS |
|
|
|
|
|
I. Fixed Intangible Assets: |
|
|
|
|
|
R&D Products |
|
|
|
|
|
Concessions, patents, trade-marks etc |
|
|
|
|
|
Goodwill |
|
|
|
|
|
Intangible fixed assets under construction |
|
|
|
|
|
thereof advances |
|
|
|
|
|
Total I |
|
|
|
|
|
II. Fixed Tangible Assets |
|
|
|
|
|
Land and Buildings |
|
|
|
|
|
thereof Land |
|
|
|
|
|
thereof Buildings |
|
|
|
|
|
Machines, Vehicles |
1 |
|
|
1 |
|
Equipment |
|
|
|
|
|
Tangible fixed assets under construction |
|
|
|
|
|
thereof advances |
|
|
|
|
|
Total II. |
1 |
|
|
1 |
|
III. Fixed Financial Assets |
|
|
|
|
|
Shares in group companies |
|
|
|
|
|
Loans granted to group companies |
|
|
|
|
|
Shares in joint ventures |
25 |
25 |
25 |
25 |
|
Long term investments |
|
|
|
|
|
Other loans |
28 |
|
|
|
|
Bought back own shares |
|
|
|
|
|
Total III. |
286 |
480 |
657 |
525 |
|
IV. Deferred Taxes |
1 |
|
|
|
|
B. FIXED ASSETS TOTAL |
288 |
480 |
657 |
526 |
|
C. CURRENT ASSETS |
|
|
|
|
|
I. Inventories |
|
|
|
|
|
Raw Materials |
3 |
3 |
3 |
3 |
|
Work in progress |
|
|
|
|
|
thereof young animals |
|
|
|
|
|
Trading goods |
1007 |
835 |
702 |
702 |
|
thereof production |
|
|
|
|
|
thereof goods for sale |
1007 |
835 |
702 |
702 |
|
Advances |
|
|
|
|
|
Total I. |
1010 |
838 |
705 |
705 |
|
II. Receivables |
|
|
|
|
|
Receivables from customers |
28 |
22 |
11 |
100 |
|
thereof more than 1 year |
|
|
|
|
|
Receivables from group companies |
|
|
|
|
|
thereof more than 1 year |
|
|
|
|
|
Receivables from joint ventures |
149 |
133 |
332 |
33 |
|
thereof more than 1 year |
|
|
|
|
|
Other receivables |
15 |
16 |
11 |
1 |
|
thereof more than 1 year |
|
|
|
|
|
Total II. |
192 |
171 |
354 |
134 |
|
III. Current Financial Assets |
|
|
|
|
|
Current investments in related companies |
|
|
|
|
|
Bought back own shares |
|
|
|
|
|
Other current financial assets |
|
|
|
|
|
Total III. |
|
|
|
|
|
IV. Cash equivalents |
|
|
|
|
|
Cash and accounts in the country |
14 |
1 |
2 |
2 |
|
thereof cash |
|
1 |
2 |
|
|
Thereof cash in foreign currency (equivalent) |
|
|
|
|
|
thereof current accounts |
14 |
|
|
2 |
|
thereof blocked accounts |
|
|
|
|
|
thereof cash equivalents |
|
|
|
|
|
Cash and accounts abroad |
|
|
|
|
|
thereof cash |
|
|
|
|
|
Thereof cash in foreign currency (equivalent) |
|
|
|
|
|
thereof current accounts |
|
|
|
|
|
thereof blocked accounts |
|
|
|
|
|
Total IV. |
14 |
1 |
2 |
2 |
|
C. CURRENT ASSETS TOTAL |
1216 |
1010 |
1061 |
841 |
|
D. Deferred expenses |
8 |
8 |
3 |
1 |
|
TOTAL ASSETS |
1512 |
1498 |
1721 |
1368 |
|
A. OWNERS EQUITY |
|
|
|
|
|
I. Share capital |
50 |
50 |
50 |
50 |
|
II. Issue premium |
185 |
185 |
185 |
185 |
|
III. Revaluation reserves |
|
|
|
|
|
thereof revaluation reserves of financial instruments |
|
|
|
|
|
IV. Reserves |
|
|
|
|
|
legal reserves |
|
|
|
|
|
reserve related to bought back own shares |
|
|
|
|
|
reserve from company foundation |
5 |
5 |
5 |
5 |
|
other reserves |
60 |
60 |
60 |
60 |
|
Total IV. |
65 |
65 |
65 |
65 |
|
V. Result from previous period |
|
|
|
|
|
Undistributed profit |
1071 |
1071 |
1071 |
993 |
|
Uncovered loss |
|
-176 |
-185 |
-185 |
|
Total V. |
1071 |
895 |
886 |
808 |
|
VI. Current result profit (loss) |
-176 |
-9 |
1 |
2 |
|
A. OWNERS EQUITY TOTAL |
1195 |
1186 |
1187 |
1110 |
|
B. PROVISIONS |
|
|
|
|
|
Provisions for pensions |
|
|
|
|
|
Provisions for taxes |
|
|
|
|
|
thereof deferred taxes |
|
|
|
|
|
Other provisions |
|
|
|
|
|
B. PROVISIONS TOTAL |
|
|
|
|
|
C. LIABILITIES |
|
|
|
|
|
Bond-backed loans |
|
|
|
|
|
less than 1 year |
|
|
|
|
|
more than 1 year |
|
|
|
|
|
Bank loans |
|
|
|
|
|
less than 1 year |
|
|
|
|
|
more than 1 year |
|
|
|
|
|
Advances received |
28 |
|
|
|
|
less than 1 year |
28 |
|
|
|
|
more than 1 year |
|
|
|
|
|
Payables to suppliers |
8 |
3 |
13 |
6 |
|
less than 1 year |
8 |
3 |
13 |
6 |
|
more than 1 year |
|
|
|
|
|
Liabilities on policies |
|
|
|
|
|
less than 1 year |
|
|
|
|
|
more than 1 year |
|
|
|
|
|
Liabilities to group companies |
|
|
|
|
|
less than 1 year |
|
|
|
|
|
more than 1 year |
|
|
|
|
|
Liabilities to joint-venture companies |
151 |
117 |
322 |
143 |
|
less than 1 year |
151 |
117 |
322 |
143 |
|
more than 1 year |
|
|
|
|
|
Other liabilities |
130 |
192 |
199 |
109 |
|
less than 1 year |
130 |
192 |
199 |
109 |
|
more than 1 year |
|
|
|
|
|
thereof to personnel |
81 |
142 |
154 |
3 |
|
less than 1 year |
81 |
142 |
154 |
3 |
|
more than 1 year |
|
|
|
|
|
thereof to social insurance |
18 |
6 |
5 |
3 |
|
less than 1 year |
18 |
6 |
5 |
3 |
|
more than 1 year |
|
|
|
|
|
thereof for taxes |
13 |
22 |
24 |
17 |
|
less than 1 year |
13 |
22 |
24 |
17 |
|
more than 1 year |
|
|
|
|
|
C. LIABILITIES TOTAL |
317 |
312 |
534 |
258 |
|
less than 1 year |
317 |
312 |
534 |
258 |
|
more than 1 year |
|
|
|
|
|
D. FINANCING AND DEFERRED INCOME |
|
|
|
|
|
thereof |
|
|
|
|
|
Financing |
|
|
|
|
|
Deferred income |
|
|
|
|
|
TOTAL EQUITY AND LIABILITIES |
1512 |
1498 |
1721 |
1368 |
|
P&L ACCOUNT in BGN'000 |
2013 |
2014 |
2015 |
2016 |
|
Accounting
period: |
1.1.2013
- |
1.1.2014
- |
1.1.2015
- |
1.1.2016
- |
|
A. EXPENSES |
|
|
|
|
|
I. OPERATION EXPENSES |
|
|
|
|
|
Decrease of inventories |
|
|
|
|
|
thereof for materials |
13 |
16 |
4 |
4 |
|
thereof for services |
103 |
88 |
43 |
67 |
|
Personnel expenses |
170 |
137 |
97 |
105 |
|
thereof wages |
144 |
117 |
82 |
91 |
|
thereof social insurance |
26 |
20 |
15 |
14 |
|
thereof pensions |
18 |
15 |
10 |
10 |
|
Depreciation |
6 |
|
|
|
|
thereof Depreciation of fixed assets |
6 |
|
|
|
|
Other expenses |
231 |
330 |
407 |
44 |
|
thereof Book value of sold assets (without production) |
205 |
314 |
393 |
29 |
|
I. OPERATION EXPENSES TOTAL |
523 |
571 |
551 |
220 |
|
II. Financial expenditures |
|
|
|
|
|
Depreciation of financial assets |
|
|
1 |
|
|
thereof exchange rate losses |
|
|
1 |
|
|
Paid interest |
11 |
10 |
9 |
4 |
|
thereof interest to group companies |
|
|
|
|
|
Thereof expenditures for securities operations |
|
|
|
|
|
II. Financial expenditures Total |
11 |
10 |
10 |
4 |
|
B. Profit on ordinary activity |
|
|
1 |
2 |
|
III. Extraordinary expenses |
|
|
|
|
|
thereof expenses on disasters and emergency expenses |
|
|
|
|
|
C. Total expenses (I+II+III) |
534 |
581 |
561 |
224 |
|
D. Accounting profit |
|
|
1 |
2 |
|
IV. Taxation on profit |
|
|
|
|
|
V. Other taxes |
|
1 |
|
|
|
E. Net profit |
|
|
1 |
2 |
|
Total expenses |
534 |
582 |
562 |
226 |
|
A. REVENUES |
|
|
|
|
|
I. OPERATING REVENUES |
|
|
|
|
|
Net sales |
356 |
503 |
560 |
224 |
|
Production |
|
|
|
|
|
Goods |
272 |
384 |
531 |
158 |
|
Services |
84 |
119 |
29 |
66 |
|
Increase of production and work in progress |
|
|
|
|
|
Expenses on acquisition of assets |
|
|
|
|
|
Other revenues |
1 |
70 |
2 |
2 |
|
thereof financing |
|
|
|
|
|
I. TOTAL OPERATING REVENUES |
357 |
573 |
562 |
226 |
|
II. FINANCIAL REVENUES |
|
|
|
|
|
Income from shares |
|
|
|
|
|
thereof income from shares in group companies |
|
|
|
|
|
Income from investments and loans |
|
|
|
|
|
thereof from investments in group companies |
|
|
|
|
|
Income from interest |
1 |
|
|
|
|
thereof from interest from group companies |
|
|
|
|
|
II FINANCIAL REVENUES TOTAL |
1 |
|
|
|
|
TOTAL REVENUES FROM ORDINARY ACTIVITIES |
358 |
573 |
562 |
226 |
|
LOSS |
176 |
8 |
|
|
|
Extraordinary revenues |
|
|
|
|
|
AFTER TAX LOSS |
176 |
9 |
|
|
|
TOTAL REVENUES |
534 |
582 |
562 |
226 |
�
FOREIGN EXCHANGE RATES
|
Currency |
Unit
|
Indian Rupees |
|
US Dollar |
1 |
INR 64.66 |
|
|
1 |
INR 90.65 |
|
Euro |
1 |
INR 79.70 |
|
BGN |
1 |
INR 40.84 |
Note :
Above are approximate rates obtained from sources believed to be correct
INFORMATION DETAILS
|
Analysis Done by
: |
NIY |
|
|
|
|
Report Prepared
by : |
TRU |
������������������������������������������������
RATING EXPLANATIONS
|
Credit Rating |
Explanation |
Rating Comments |
|
A++ |
Minimum Risk |
Business dealings permissible with minimum
risk of default |
|
A+ |
Low Risk |
Business dealings permissible with low
risk of default |
|
A |
Acceptable Risk |
Business dealings permissible with
moderate risk of default |
|
B |
Medium Risk |
Business dealings permissible on a regular
monitoring basis |
|
C |
Medium High Risk |
Business dealings permissible preferably
on secured basis |
|
D |
High Risk |
Business dealing not recommended or on
secured terms only |
|
NB |
New Business |
No recommendation can be done due to
business in infancy stage |
|
NT |
No Trace |
No recommendation can be done as the
business is not traceable |
NB is stated where there is insufficient information to facilitate rating. However, it is not to be considered as unfavourable.
This score serves as a reference to assess
SC�s credit risk and to set the amount of credit to be extended. It is
calculated from a composite of weighted scores obtained from each of the major
sections of this report. The assessed factors are as follows:
�
Financial
condition covering various ratios
�
Company
background and operations size
�
Promoters
/ Management background
�
Payment
record
�
Litigation
against the subject
�
Industry
scenario / competitor analysis
�
Supplier
/ Customer / Banker review (wherever available)
This report is issued at
your request without any risk and responsibility on the part of MIRA INFORM
PRIVATE LIMITED (MIPL) or its officials.