|
|
|


MIRA
INFORM REPORT
|
Report No. : |
493357 |
|
Report Date : |
28.02.2018 |
|
|
|
IDENTIFICATION DETAILS
|
Name : |
FIRSTSOURCE SOLUTIONS LIMITED (w.e.f. 21.11.2006) |
|
|
|
|
Formerly Known
As : |
ICICI ONESOURCE LIMITED (w.e.f. 02.04.2002) ICICI INFOTECH UPSTREAM LIMITED |
|
|
|
|
Registered
Office : |
5th Floor, Paradigm ‘B’ Wing, Mindspace, Link Road, Malad
(West), Mumbai-400064, Maharashtra |
|
Tel. No.: |
91-22-66660888 |
|
|
|
|
Country : |
India |
|
|
|
|
Financials (as
on) : |
31.03.2017 |
|
|
|
|
Date of
Incorporation : |
06.12.2001 |
|
|
|
|
Com. Reg. No.: |
11-134147 |
|
|
|
|
Capital
Investment / Paid-up Capital : |
INR 6813.080 Million |
|
|
|
|
CIN No.: [Company Identification
No.] |
L64202MH2001PLC134147 |
|
|
|
|
IEC No.: [Import-Export Code No.] |
0302000615 |
|
|
|
|
GSTN : [Goods & Service Tax
Registration No.] |
27AAACI8904N1Z6 |
|
|
|
|
TAN No.: [Tax Deduction &
Collection Account No.] |
Not Available |
|
|
|
|
PAN No.: [Permanent Account No.] |
AAACI8904N |
|
|
|
|
Legal Form : |
A Public Limited Liability Company. The Company’s Shares are Listed on
the Stock Exchanges |
|
|
|
|
Line of Business
: |
The Company is engaged in the business of providing customer management services like contact center, transaction processing and debt collection services including revenue cycle management in the healthcare industry. [Registered Activity] |
|
|
|
|
No. of Employees
: |
16334 (Approximately) |
RATING & COMMENTS
(Mira Inform has adopted New Rating mechanism w.e.f. 23rd
January 2017)
|
MIRA’s Rating : |
A+ |
|
Credit Rating |
Explanation |
Rating Comments |
|
A+ |
Low Risk |
Business dealings permissible with low
risk of default |
|
Status : |
Good |
|
|
|
|
Payment Behaviour : |
Regular |
|
|
|
|
Litigation : |
Clear |
|
|
|
|
Comments : |
Firstsource Solutions Limited is owned by RP-Sanjiv Goenka Group. It was incorporated in the year 2001 and is a provider of business process outsourcing (BPO) services.
|
NOTES :
Any query related to this report can be made
on e-mail : infodept@mirainform.com
while quoting report number, name and date.
EXTERNAL AGENCY RATING
|
Rating Agency Name |
CRISIL |
|
Rating |
Long term borrowing = A- |
|
Rating Explanation |
Adequate degree of safety and low credit risk |
|
Date |
01.08.2017 |
|
|
|
|
Rating Agency Name |
CRISIL |
|
Rating |
Short term borrowing = A2+ |
|
Rating Explanation |
Strong degree of safety and low credit risk. |
|
Date |
01.08.2017 |
RBI DEFAULTERS’ LIST STATUS
Subject’s name is not enlisted as a defaulter
in the publicly available RBI Defaulters’ list.
EPF (Employee Provident Fund) DEFAULTERS’ LIST STATUS
Subject’s name is not enlisted as a defaulter
in the publicly available EPF (Employee Provident Fund) Defaulters’ list as of
31-03-2016.
BIFR (Board for Industrial & Financial Reconstruction) LISTING
STATUS
Subject’s name is not listed as a Sick Unit in
the publicly available BIFR (Board for Industrial & Financial
Reconstruction) list as of 28.02.2018.
IBBI (Insolvency and Bankruptcy Board of India) LISTING STATUS
Subject’s name is not listed in the publicly
available IBBI (Insolvency and Bankruptcy Board of India) list as of report
date.
INFORMATION DENIED BY
|
Name : |
Mr. Rakesh |
|
Designation : |
Finance Department |
|
Contact No.: |
91-22-67035700 |
|
Date : |
21.02.2018 |
Management Non-Cooperative (Tel. No.:91-22-66660888)
LOCATIONS
|
Registered Office : |
5th Floor, Paradigm ‘B’ Wing, Mindspace, Link Road, Malad
(West), Mumbai-400064, Maharashtra, India
|
|
Tel. No.: |
91-22-66660888/ 67035700 |
|
Fax No.: |
91-22-67035701 |
|
E-Mail : |
|
|
Website : |
|
|
|
|
|
Branch Offices: |
Located at:
|
|
|
|
|
Overseas Offices : |
Located At:
|
DIRECTORS
AS ON 2018
|
Name : |
Mr. Rajesh Subramaniam |
|
Designation : |
Managing Director |
|
Address : |
Prestige Ozone Villa No.C-67, Whitefield Road Varthur Kodi, Bangalore - 560066, Karnataka, India |
|
Date of Appointment : |
01.08.2011 |
|
DIN No.: |
02617781 |
|
|
|
|
Name : |
Mr. Pradip Kumar Khaitan |
|
Designation : |
Director |
|
Address : |
B-103, Rai Enclave, 7/1A, Sunny Park, Kolkata - 700019, West Bengal, India |
|
Date of Appointment : |
14.11.2014 |
|
DIN No.: |
00004821 |
|
|
|
|
Name : |
Mr. Pradip Roy |
|
Designation : |
Director |
|
Address : |
Building, 2C, Flat N0 -42, Kalpataru Estate, J V L Road, Andheri (East), Mumbai - 400093, Maharashtra, India |
|
Date of Appointment : |
03.12.2012 |
|
DIN No.: |
00026457 |
|
|
|
|
Name : |
Mr. Sanjiv Goenka |
|
Designation : |
Director |
|
Address : |
19, Belvedere Road, Kolkata - 700027, West Bengal, India |
|
Date of Appointment : |
03.12.2012 |
|
DIN No.: |
00074796 |
|
|
|
|
Name : |
Mr. Yezdi Hirji Malegam |
|
Designation : |
Director |
|
Address : |
Goolestan, 37,Cuffe Parade, Colaba, Mumbai - 400005, Maharashtra, India |
|
Date of Appointment : |
27.07.2006 |
|
DIN No.: |
00092017 |
|
|
|
|
Name : |
Mr. Charles Miller Smith |
|
Designation : |
Director |
|
Address : |
23 Egerton Terrace, London, SW32BU, United Kingdom |
|
Date of Appointment : |
19.08.2002 |
|
DIN No.: |
00950635 |
|
|
|
|
Name : |
Mr. Donald William Layden JR |
|
Designation : |
Director |
|
Address : |
923 E Kilbourn Ave, # 2901, Milwaukee, Wi, Milwaukee - 53202, United States of America |
|
Date of Appointment : |
20.04.2006 |
|
DIN No.: |
01268078 |
|
|
|
|
Name : |
Mr. Subrata Talukdar |
|
Designation : |
Director |
|
Address : |
Sivnath Bhavan, Gariahat Road, Flat No.Y-35, Kolkata - 700029, West Bengal, India |
|
Date of Appointment : |
05.12.2012 |
|
DIN No.: |
01794978 |
|
|
|
|
Name : |
Mr. Vinod Kumar Sharma |
|
Designation : |
Director |
|
Address : |
B 804 Park Titanium Park Street, Kalewadi Phata, Wakad, Hinjavadi, Pune - 411057, Maharashtra, India |
|
Date of Appointment : |
14.11.2014 |
|
DIN No.: |
02051084 |
|
|
|
|
Name : |
Mrs. Grace Elizabeth Koshie |
|
Designation : |
Director |
|
Address : |
A – 705, Pearl,Rajhans Dreams, Stella, Barampur, Vasai (West), Thane - 401202, Maharashtra, India |
|
Date of Appointment : |
09.02.2015 |
|
DIN No.: |
06765216 |
|
|
|
|
Name : |
Mr. Shashwat Goenka |
|
Designation : |
Director |
|
Address : |
19, Belvedere Road, Goenka Nivas, Kolkata-700027, West Bengal, India |
|
Date of Appointment : |
05.12.2012 |
|
DIN No.: |
03486121 |
KEY EXECUTIVES
|
Name : |
Mr. Dinesh Jain |
|
Designation : |
Company Financial Officer (KMP) |
|
Address : |
1504, 15th Floor, Rustomjee O Zone Tower No. 5, Behind GGN Tele. Exch., Goregaon (West), Mumbai-400062, Maharashtra, India |
|
Date of Appointment : |
29.10.2015 |
|
PAN No.: |
ACDPJ8780F |
|
|
|
|
Name : |
Ms. Pooja S Nambiar |
|
Designation : |
Company Secretary and Compliance Officer |
|
Address : |
D/310, Aaditya CHS., Sector-II, Charkop, Kandivali (West), Mumbai-400067, Maharashtra, India |
|
Date of Appointment : |
31.01.2017 |
|
PAN No.: |
ADWPR5859H |
|
|
|
|
Name : |
Mr. Rakesh |
|
Designation : |
Finance Department |
|
|
|
|
COMMITTEE DETAILS |
|
|
Audit Committee : |
|
|
|
|
|
Nomination and Remuneration
Committee : |
|
|
|
|
|
Stakeholders
Relationship Committee : |
|
|
|
|
|
Corporate Social
Responsibility Committee : |
|
|
|
|
|
Investment
Committee : |
|
|
|
|
|
Strategy Committee
: |
|
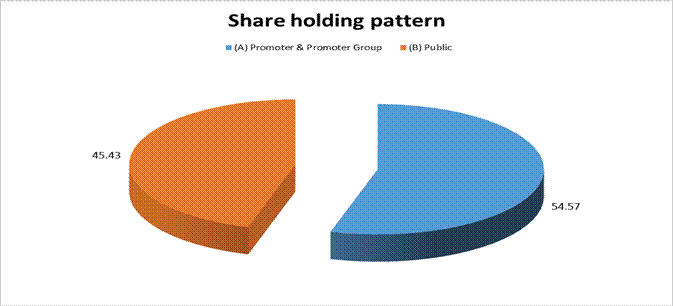
SHAREHOLDING PATTERN
AS ON DECEMBER 2017
|
Category of shareholder |
Total nos. shares held |
Shareholding as a % of total no. of
shares (calculated as per SCRR, 1957)As a % of (A+B+C2) |
|
|
(A) Promoter & Promoter Group |
373976673 |
54.57 |
|
|
(B) Public |
311283671 |
45.43 |
|
|
Grand Total |
685260344 |
100.00 |
STATEMENT SHOWING SHAREHOLDING PATTERN OF THE PROMOTER AND PROMOTER
GROUP
|
Category of shareholder |
Total nos. shares held |
Shareholding as a % of total no. of
shares (calculated as per SCRR, 1957)As a % of (A+B+C2) |
|
|
A1) Indian |
0.00 |
||
|
Any Other (specify) |
373976673 |
54.57 |
|
|
Spen Liq Private Limited |
373976673 |
54.57 |
|
|
Sub Total A1 |
373976673 |
54.57 |
|
|
A2) Foreign |
0.00 |
||
|
A=A1+A2 |
373976673 |
54.57 |
STATEMENT SHOWING SHAREHOLDING PATTERN OF THE PUBLIC SHAREHOLDER
|
Category & Name of the Shareholders |
Total no. shares held |
Shareholding % calculated as per SCRR,
1957 As a % of (A+B+C2) |
|
|
B1) Institutions |
0.00 |
||
|
Mutual Funds/ |
8550000 |
1.25 |
|
|
Aditya Birla Sun Life Trustee Private Limited A/C Aditya Birla Sun Life India Opportunities Fund |
8550000 |
1.25 |
|
|
Foreign Portfolio Investors |
40616166 |
5.93 |
|
|
Sterinberg India Emerging Opportunities Fund Limited |
17900000 |
2.61 |
|
|
Financial Institutions/ Banks |
34195267 |
4.99 |
|
|
ICICI Bank Limited |
33577356 |
4.90 |
|
|
Any Other (specify) |
39986 |
0.01 |
|
|
Sub Total B1 |
83401419 |
12.17 |
|
|
B2) Central Government/ State Government(s)/ President of India |
0.00 |
||
|
B3) Non-Institutions |
0.00 |
||
|
Individual share capital upto INR 0.200 million |
91571132 |
13.36 |
|
|
Individual share capital in excess of INR 0.200 million |
90807849 |
13.25 |
|
|
Jhunjhunwala Rakesh Radheyshyam |
20000000 |
2.92 |
|
|
Tarun Chandmal Jain. |
7798576 |
1.14 |
|
|
NBFCs registered with RBI |
729320 |
0.11 |
|
|
Any Other (specify) |
44773951 |
6.53 |
|
|
Sub Total B3 |
227882252 |
33.25 |
|
|
B=B1+B2+B3 |
311283671 |
45.43 |
BUSINESS DETAILS
|
Line of Business : |
The Company is engaged in the business of providing customer management services like contact center, transaction processing and debt collection services including revenue cycle management in the healthcare industry. [Registered Activity] |
||||
|
|
|
||||
|
Products / Services
: |
|
||||
|
|
|
||||
|
Brand Names : |
Not Available |
||||
|
|
|
||||
|
Agencies Held : |
Not Available |
||||
|
|
|
||||
|
Exports : |
Not Divulged |
||||
|
|
|
||||
|
Imports : |
Not Divulged |
||||
|
|
|
||||
|
Terms : |
Not Divulged |
PRODUCTION STATUS – (NOT AVAILABLE)
GENERAL INFORMATION
|
Suppliers : |
|
||||||||||||||||||||||||||||||
|
|
|
||||||||||||||||||||||||||||||
|
Customers : |
|
||||||||||||||||||||||||||||||
|
|
|
||||||||||||||||||||||||||||||
|
No. of Employees : |
16334 (Approximately) |
||||||||||||||||||||||||||||||
|
|
|
||||||||||||||||||||||||||||||
|
Bankers : |
|
||||||||||||||||||||||||||||||
|
|
|
||||||||||||||||||||||||||||||
|
Facilities : |
Notes: a External commercial borrowing is a dollar denominated borrowing carrying floating interest rate in the range of 3.20% to 3.75%. The loan is repayable by June 2019 in quarterly installments. The loan is secured against pari passu charge on all current assets, non-current assets and fixed assets of the company. b Finance lease obligation carries interest in the range of 4% - 12.5% for the period of 3 - 5 years from April 2013 to March 2018, repayable in quarterly installments. This is secured by way of hypothecation of underlying fixed assets taken on lease. c Loan from non-banking financing companies carries interest in the range of 6.62% - 12.26% for the period of 3 - 4 years from April 2014 to December 2019, repayable in quarterly installments from the date of its origination. d Export finance from banks including post-shipment and pre-shipment, carries interest in the range of 1.30% to 2.50%. The same is repayable on demand / receipt from customers. |
|
Auditors 1 : |
|
|
Name : |
B S R and Company LLP Chartered Accountants |
|
Address : |
1st
Floor, Lodha Excellus, Apollo Mills Compound, N. M. Joshi Marg, Mahalaxmi,
Mumbai – 400011, Maharashtra, India |
|
Tel. No.: |
91-22-43455300 |
|
Fax No.: |
91-22-43455399 |
|
|
|
|
Auditors 2 : |
|
|
Name : |
Deloitte Haskins and Sells LLP Chartered Accountants |
|
Address : |
Indiabulls Finance Centre, Tower 3, 27th-32th Floor,
Senapati Bapat Marg, Elphinstone Road (West), Mumbai-400013, Maharashtra,
India |
|
Tel. No.: |
91-22-61854000 |
|
Fax No.: |
91-22-61854001 |
|
|
|
|
Memberships : |
Not Available |
|
|
|
|
Collaborators : |
Not Available |
|
|
|
|
Ultimate Holding
Company : |
CESC Limited |
|
|
|
|
Holding Company : |
Spen Liq Private Limited (Spen Liq) |
|
|
|
|
Fellow Subsidiary
Companies : |
|
|
|
|
|
Associate Company : |
Nanobi Data and Analytics Private Limited (Nanobi) |
|
|
|
|
Subsidiaries wherein
control exists : |
|
CAPITAL STRUCTURE
AS ON 31.03.2017
Authorised Capital :
|
No. of Shares |
Type |
Value |
Amount |
|
|
|
|
|
|
872000000 |
Equity Shares |
INR 10/- each |
INR 8720.000 Million |
|
|
|
|
|
Issued, Subscribed & Paid-up Capital :
|
No. of Shares |
Type |
Value |
Amount |
|
|
|
|
|
|
681308337 |
Equity Shares |
INR 10/- each |
INR 6813.080
Million |
|
|
|
|
|
a) Reconciliation of
shares outstanding at the beginning and at the end of the year
|
Particulars |
31ST March 2017 |
|
|
|
No. of shares |
Amount |
|
At the commencement of the year |
673314912 |
6733.150 |
|
Shares allotted during the year- employee stock option scheme |
7993425 |
79.930 |
|
At the end of the year |
681308337 |
6813.080 |
b) Particulars of
shareholders holding more than 5% equity shares
|
Name of Shareholder |
31ST March 2017 |
|
|
|
No. of shares |
% |
|
Spen Liq Private Limited |
373976673 |
54.89% |
c) Shares held by holding
company
|
Name of Shareholder |
31ST March 2017 |
|
|
|
No. of shares |
Amount |
|
Spen Liq Private Limited |
373976673 |
3739.770 |
d) Employee stock
options
For stock options granted during the period to employees.
e) Shares reserved
for issue under options
19,270,187 (31 March 2016: 26495617, 1 April 2015: 42308052) number of shares are reserved for employees for issue under the employee stock options plan (ESOP) amounting to INR 242.36 (31 March 2016: INR 264.96, 1 April 2015: INR 423.08).
f) Rights, preferences
and restrictions attached to equity shares
The Company has a single class of equity shares. Accordingly, all equity shares rank equally with regard to dividends and share in the Company’s residual assets. The equity shareholders are entitled to receive dividend as declared from time to time. The voting rights of an equity shareholder are in proportion to its share of the paid-up equity capital of the Company.
On winding up of the Company, the holders of equity shares will be entitled to receive the residual assets of Company, remaining after distribution of all preferential amounts in proportion to the number of equity shares held.
FINANCIAL DATA
[all figures are
INR Million]
ABRIDGED
BALANCE SHEET [STANDALONE]
|
SOURCES OF FUNDS |
31.03.2017 |
31.03.2016 |
31.03.2015 |
|
|
|
|
|
|
I.
EQUITY AND LIABILITIES |
|
|
|
|
(1)Shareholders' Funds |
|
|
|
|
(a) Share Capital |
6813.080 |
6733.150 |
6662.910 |
|
(b) Reserves &
Surplus |
13180.920 |
10998.070 |
9620.160 |
|
(c) Money received
against share warrants |
0.000 |
0.000 |
0.000 |
|
|
|
|
|
|
(2) Share Application
money pending allotment |
0.000 |
0.000 |
0.200 |
|
Total Shareholders’ Funds
(1) + (2) |
19994.000 |
17731.220 |
16283.270 |
|
|
|
|
|
|
(3) Non-Current
Liabilities |
|
|
|
|
(a) long-term borrowings |
676.600 |
1159.510 |
1218.080 |
|
(b) Deferred tax liabilities
(Net) |
0.000 |
0.000 |
0.000 |
|
(c) Other long term
liabilities |
0.000 |
0.000 |
0.000 |
|
(d) long-term provisions |
117.620 |
111.480 |
73.410 |
|
Total Non-current
Liabilities (3) |
794.220 |
1270.990 |
1291.490 |
|
|
|
|
|
|
(4) Current Liabilities |
|
|
|
|
(a) Short term borrowings |
1184.980 |
770.090 |
1007.070 |
|
(b) Trade payables |
338.530 |
243.940 |
254.000 |
|
(c) Other current
liabilities |
327.300 |
513.720 |
755.440 |
|
(d) Short-term provisions |
41.690 |
33.700 |
38.110 |
|
Total Current Liabilities
(4) |
1892.500 |
1561.450 |
2054.620 |
|
|
|
|
|
|
TOTAL |
22680.720 |
20563.660 |
19629.380 |
|
|
|
|
|
|
II.
ASSETS |
|
|
|
|
(1) Non-current assets |
|
|
|
|
(a) Fixed Assets |
|
|
|
|
(i) Tangible assets |
292.870 |
256.600 |
322.270 |
|
(ii) Intangible Assets |
261.850 |
132.980 |
262.500 |
|
(iii) Capital
work-in-progress |
16.180 |
14.400 |
0.500 |
|
(iv) Intangible assets
under development |
0.000 |
0.000 |
0.000 |
|
(b) Non-current
Investments |
11954.740 |
11938.280 |
11813.710 |
|
(c) Deferred tax assets
(net) |
1596.530 |
1782.770 |
454.440 |
|
(d) Long-term Loan and Advances |
0.000 |
0.000 |
2036.050 |
|
(e) Other Non-current
assets |
1382.250 |
1235.570 |
26.220 |
|
Total Non-Current Assets |
15504.420 |
15360.600 |
14915.690 |
|
|
|
|
|
|
(2) Current assets |
|
|
|
|
(a) Current investments |
1495.170 |
740.240 |
649.110 |
|
(b) Inventories |
0.000 |
0.000 |
0.000 |
|
(c) Trade receivables |
3719.340 |
3195.570 |
2335.480 |
|
(d) Cash and cash
equivalents |
157.710 |
362.990 |
260.980 |
|
(e) Short-term loans and
advances |
0.000 |
0.000 |
486.900 |
|
(f) Other current assets |
1804.080 |
904.260 |
981.220 |
|
Total Current Assets |
7176.300 |
5203.060 |
4713.690 |
|
|
|
|
|
|
TOTAL |
22680.720 |
20563.660 |
19629.380 |
PROFIT
& LOSS ACCOUNT [STANDALONE]
|
|
PARTICULARS |
31.03.2017 |
31.03.2016 |
31.03.2015 |
|
|
SALES |
|
|
|
|
|
Income |
9400.650 |
8748.780 |
9141.390 |
|
|
Other Income |
147.860 |
183.250 |
186.670 |
|
|
TOTAL |
9548.510 |
8932.030 |
9328.060 |
|
|
|
|
|
|
|
Less |
EXPENSES |
|
|
|
|
|
Employees benefits
expense |
4579.960 |
4239.100 |
4377.190 |
|
|
Other expenses |
2523.120 |
2529.700 |
2685.160 |
|
|
TOTAL |
7103.080 |
6768.800 |
7062.350 |
|
|
|
|
|
|
|
|
PROFIT / (LOSS) BEFORE
INTEREST, TAX, DEPRECIATION AND AMORTISATION |
2445.430 |
2163.230 |
2265.710 |
|
|
|
|
|
|
|
Less |
FINANCIAL EXPENSES |
67.750 |
89.080 |
202.230 |
|
|
|
|
|
|
|
|
PROFIT / (LOSS) BEFORE
TAX, DEPRECIATION AND AMORTISATION |
2377.680 |
2074.150 |
2063.480 |
|
|
|
|
|
|
|
Less |
DEPRECIATION/
AMORTISATION |
190.320 |
318.090 |
464.300 |
|
|
|
|
|
|
|
|
PROFIT/ (LOSS) BEFORE TAX |
2187.360 |
1756.060 |
1599.180 |
|
|
|
|
|
|
|
Less |
TAX |
302.770 |
243.830 |
-38.360 |
|
|
|
|
|
|
|
|
PROFIT/ (LOSS) AFTER TAX
|
1884.590 |
1512.230 |
1637.540 |
|
|
|
|
|
|
|
PREVIOUS YEARS’ BALANCE
BROUGHT FORWARD |
9647.350 |
8135.120 |
6543.280 |
|
|
|
|
|
|
|
|
|
Balance Carried to the
B/S |
11531.940 |
9647.350 |
8180.820 |
|
|
|
|
|
|
|
|
EARNINGS IN FOREIGN
CURRENCY |
|
|
|
|
|
Income from services |
|
5004.190 |
5258.100 |
|
|
Other income |
|
79.860 |
80.890 |
|
|
Reimbursement of expense |
|
103.220 |
108.580 |
|
|
TOTAL EARNINGS |
5683.290 |
5187.270 |
5447.570 |
|
|
|
|
|
|
|
|
IMPORTS |
|
|
|
|
|
Capital Goods |
NA |
82.850 |
119.470 |
|
|
TOTAL IMPORTS |
NA |
82.850 |
119.470 |
|
|
|
|
|
|
|
|
Earnings / (Loss) Per
Share (INR) |
|
|
|
|
|
Basic |
2.79 |
2.26 |
2.47 |
|
|
Diluted |
2.75 |
2.16 |
2.33 |
CURRENT MATURITIES
OF LONG TERM DEBT DETAILS
|
Particulars |
31.03.2017 |
31.03.2016 |
31.03.2015 |
|
Current
Maturities of Long term debt |
|
|
|
|
Secured |
|
|
|
|
External commercial borrowing (ECB) |
NA |
132.510 |
62.500 |
|
Unsecured |
|
|
|
|
Loan from non-banking financing companies |
NA |
40.130 |
22.640 |
|
Interest accrued but not due on borrowings |
NA |
2.740 |
4.380 |
|
Total |
NA |
175.380 |
89.520 |
|
|
|
|
|
|
Cash generated from operations |
NA |
NA |
NA |
|
Net cash used in operating activities |
779.640 |
768.480 |
505.790 |
QUARTERLY
RESULTS
|
PARTICULARS |
30.06.2017 1st
Quarter |
30.09.2017 2nd
Quarter |
31.12.2017 3rd
Quarter |
|
|
(Unaudited) |
(Unaudited) |
(Unaudited) |
|
|
|
|
|
|
Net Sales |
2435.650 |
2123.270 |
2109.640 |
|
Total Expenditure |
1825.440 |
1584.310 |
1474.150 |
|
PBIDT (Excluding Other Income) |
610.210 |
538.960 |
635.490 |
|
Other Income |
47.330 |
47.560 |
20.500 |
|
Operating Profit |
657.540 |
586.520 |
655.990 |
|
Interest |
19.380 |
22.110 |
(6.110) |
|
Exceptional Items |
NA |
NA |
NA |
|
PBDT |
638.160 |
564.410 |
662.100 |
|
Depreciation |
50.080 |
54.100 |
56.04 |
|
Profit Before Tax |
588.080 |
510.310 |
606.060 |
|
Tax |
82.510 |
71.780 |
95.18 |
|
Provisions and contingencies |
NA |
NA |
NA |
|
Profit After Tax |
505.570 |
438.530 |
510.880 |
|
Extraordinary Items |
NA |
NA |
NA |
|
Prior Period Expenses |
NA |
NA |
NA |
|
Other Adjustments |
NA |
NA |
NA |
|
Net Profit |
505.570 |
438.530 |
510.880 |
KEY
RATIOS
EFFICIENCY RATIOS
|
PARTICULARS |
31.03.2017 |
31.03.2016 |
31.03.2015 |
|
Average Collection Days (Sundry Debtors
/ Income * 365) |
144.41 |
133.32 |
93.25 |
|
|
|
|
|
|
Account Receivables Turnover (Income /
Sunday Debtors) |
2.53 |
2.74 |
3.91 |
|
|
|
|
|
|
Average Payment Days (Sundry Creditors / Purchases * 365 Days) |
NA |
NA |
NA |
|
|
|
|
|
|
Inventory Turnover (Operating Income / Inventories) |
NA |
NA |
NA |
|
|
|
|
|
|
Asset Turnover (Operating Income / Net Fixed Assets) |
4.28 |
5.35 |
3.87 |
LEVERAGE RATIOS
|
PARTICULARS |
31.03.2017 |
31.03.2016 |
31.03.2015 |
|
Debt Ratio ((Borrowing
+ Current Liabilities) / Total Assets) |
0.11 |
0.14 |
0.17 |
|
|
|
|
|
|
Debt Equity Ratio (Total Liability / Networth) |
0.09 |
0.12 |
0.14 |
|
|
|
|
|
|
Current Liabilities to Networth (Current Liabilities / Net Worth) |
0.09 |
0.09 |
0.13 |
|
|
|
|
|
|
Fixed Assets to Networth (Net Fixed Assets / Networth) |
0.03 |
0.02 |
0.04 |
|
|
|
|
|
|
Interest Coverage Ratio (PBIT / Financial Charges) |
36.09 |
24.28 |
11.20 |
PROFITABILITY RATIOS
|
PARTICULARS |
|
31.03.2017 |
31.03.2016 |
31.03.2015 |
|
Net Profit Margin [(PAT / Sales) * 100] |
% |
20.05 |
17.29 |
17.91 |
|
|
|
|
|
|
|
Return on Total Assets ((PAT / Total Assets) * 100) |
% |
8.31 |
7.35 |
8.34 |
|
|
|
|
|
|
|
Return on Investment (ROI) ((PAT / Networth) * 100) |
% |
9.43 |
8.53 |
10.06 |
SOLVENCY RATIOS
|
PARTICULARS |
31.03.2017 |
31.03.2016 |
31.03.2015 |
|
Current Ratio (Current
Assets / Current Liabilities) |
3.79 |
3.33 |
2.29 |
|
|
|
|
|
|
Quick Ratio ((Current Assets – Inventories) / Current
Liabilities) |
3.79 |
3.33 |
2.29 |
|
|
|
|
|
|
G-Score Ratio Financial (Networth / Total Assets) |
0.88 |
0.86 |
0.83 |
|
|
|
|
|
|
G-Score Ratio Debt (Debts / Equity Capital) |
0.27 |
0.31 |
0.35 |
|
|
|
|
|
|
G-Score Ratio Liquidity (Total Current Assets / Total Current Liabilities) |
3.79 |
3.33 |
2.29 |
Total
Liability = Short-term Debt + Long-term Debt + Current Maturities of Long-term
debts
STOCK
PRICES
|
Face Value |
INR 10.00/- |
|
Market Value |
INR 48.25/- |
FINANCIAL ANALYSIS
[all figures are
INR Million]
DEBT EQUITY RATIO
|
Particular |
31.03.2015 |
31.03.2016 |
31.03.2017 |
|
|
INR In Million |
INR In Million |
INR In Million |
|
Share Capital |
6662.910 |
6733.150 |
6813.080 |
|
Reserves & Surplus |
9620.160 |
10998.070 |
13180.920 |
|
Money received against share
warrants |
0.000 |
0.000 |
0.000 |
|
Share Application money
pending allotment |
0.200 |
0.000 |
0.000 |
|
Net worth |
16283.070 |
17731.220 |
19994.000 |
|
|
|
|
|
|
long-term borrowings |
1218.080 |
1159.510 |
676.600 |
|
Short term borrowings |
1007.070 |
770.090 |
1184.980 |
|
Total borrowings |
2225.150 |
1929.600 |
1861.580 |
|
Debt/Equity ratio |
0.137 |
0.109 |
0.093 |
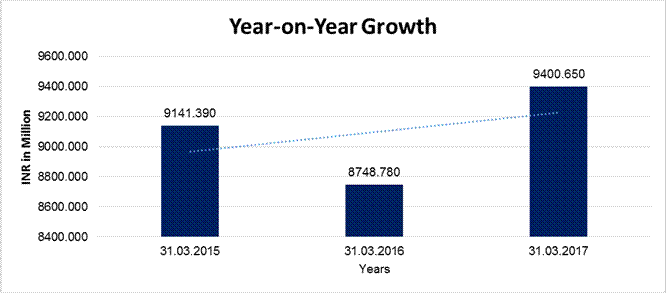
YEAR-ON-YEAR GROWTH
|
Year on Year Growth |
31.03.2015 |
31.03.2016 |
31.03.2017 |
|
|
INR In Million |
INR In Million |
INR In Million |
|
Sales |
9141.390 |
8748.780 |
9400.650 |
|
|
|
(4.295) |
7.451 |
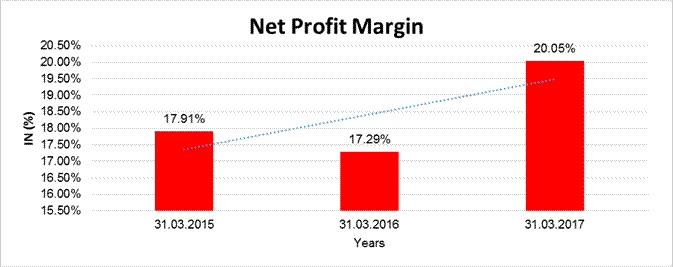
NET PROFIT MARGIN
|
Net Profit Margin |
31.03.2015 |
31.03.2016 |
31.03.2017 |
|
|
INR In Million |
INR In Million |
INR In Million |
|
Sales |
9141.390 |
8748.780 |
9400.650 |
|
Profit |
1637.540 |
1512.230 |
1884.590 |
|
|
17.91% |
17.29% |
20.05% |
ABRIDGED
BALANCE SHEET [CONSOLIDATED]
|
SOURCES OF FUNDS |
|
31.03.2017 |
31.03.2016 |
|
|
|
|
|
|
I.
EQUITY AND LIABILITIES |
|
|
|
|
(1)Shareholders' Funds |
|
|
|
|
(a) Share Capital |
|
6813.080 |
6733.150 |
|
(b) Reserves &
Surplus |
|
13466.950 |
11037.010 |
|
(c) Money received
against share warrants |
|
0.000 |
0.000 |
|
|
|
|
|
|
(2) Share Application
money pending allotment |
|
0.000 |
0.000 |
|
(3) Minority interest |
|
11.750 |
19.710 |
|
Total Shareholders’ Funds
(1) + (2) |
|
20291.780 |
17789.870 |
|
|
|
|
|
|
(4) Non-Current
Liabilities |
|
|
|
|
(a) long-term borrowings |
|
3579.940 |
4097.750 |
|
(b) Deferred tax
liabilities (Net) |
|
2874.020 |
2224.060 |
|
(c) Other long term
liabilities |
|
0.000 |
0.000 |
|
(d) long-term provisions |
|
287.490 |
265.880 |
|
Total Non-current
Liabilities (3) |
|
6741.450 |
6587.690 |
|
|
|
|
|
|
(5) Current Liabilities |
|
|
|
|
(a) Short term borrowings |
|
5644.710 |
4809.170 |
|
(b) Trade payables |
|
993.770 |
868.680 |
|
(c) Other current
liabilities |
|
1438.410 |
1626.210 |
|
(d) Short-term provisions |
|
82.850 |
81.810 |
|
Total Current Liabilities
(4) |
|
8159.740 |
7385.870 |
|
|
|
|
|
|
TOTAL |
|
35192.970 |
31763.430 |
|
|
|
|
|
|
II.
ASSETS |
|
|
|
|
(1) Non-current assets |
|
|
|
|
(a) Fixed Assets |
|
|
|
|
(i) Tangible assets |
|
878.050 |
784.690 |
|
(ii) Intangible Assets |
|
19800.100 |
19430.950 |
|
(iii) Capital
work-in-progress |
|
42.850 |
22.590 |
|
(iv) Intangible assets
under development |
|
0.000 |
0.000 |
|
(b) Non-current
Investments |
|
105.840 |
83.800 |
|
(c) Deferred tax assets
(net) |
|
4064.600 |
3702.120 |
|
(d) Long-term Loan and Advances |
|
0.000 |
0.000 |
|
(e) Other Non-current
assets |
|
2476.340 |
1264.410 |
|
Total Non-Current Assets |
|
27367.780 |
25288.560 |
|
|
|
|
|
|
(2) Current assets |
|
|
|
|
(a) Current investments |
|
1522.670 |
767.740 |
|
(b) Inventories |
|
0.000 |
0.000 |
|
(c) Trade receivables |
|
3041.270 |
3040.750 |
|
(d) Cash and cash
equivalents |
|
387.310 |
685.760 |
|
(e) Short-term loans and
advances |
|
0.000 |
0.000 |
|
(f) Other current assets |
|
2873.940 |
1980.620 |
|
Total Current Assets |
|
7825.190 |
6474.870 |
|
|
|
|
|
|
TOTAL |
|
35192.970 |
31763.430 |
PROFIT
& LOSS ACCOUNT [CONSOLIDATED]
|
|
PARTICULARS |
|
31.03.2017 |
31.03.2016 |
|
|
SALES |
|
|
|
|
|
Income |
|
35556.100 |
32172.530 |
|
|
Other Income |
|
32.050 |
94.440 |
|
|
TOTAL |
|
35588.150 |
32266.970 |
|
|
|
|
|
|
|
Less |
EXPENSES |
|
|
|
|
|
Employees benefits
expense |
|
23834.370 |
21726.730 |
|
|
Share in net (loss) of
associates |
|
0.010 |
0.000 |
|
|
Other expenses |
|
7341.830 |
6544.930 |
|
|
TOTAL |
|
31176.210 |
28271.660 |
|
|
|
|
|
|
|
|
PROFIT / (LOSS) BEFORE
INTEREST, TAX, DEPRECIATION AND AMORTISATION |
|
4411.940 |
3995.310 |
|
|
|
|
|
|
|
Less |
FINANCIAL EXPENSES |
|
453.160 |
524.380 |
|
|
|
|
|
|
|
|
PROFIT / (LOSS) BEFORE
TAX, DEPRECIATION AND AMORTISATION |
|
3958.780 |
3470.930 |
|
|
|
|
|
|
|
Less |
DEPRECIATION/
AMORTISATION |
|
589.610 |
608.820 |
|
|
|
|
|
|
|
|
PROFIT/ (LOSS) BEFORE TAX |
|
3369.170 |
2862.110 |
|
|
|
|
|
|
|
Less |
TAX |
|
576.790 |
252.860 |
|
|
|
|
|
|
|
|
PROFIT/ (LOSS) AFTER TAX
|
|
2792.380 |
2609.250 |
|
|
|
|
|
|
|
|
Other comprehensive
income |
|
|
|
|
|
Items that will not
be reclassified subsequently to profit or loss |
|
|
|
|
|
Remeasurement of the net defined benefit liability / asset |
|
(0.520) |
(31.480) |
|
|
|
|
|
|
|
|
Items that will be
reclassified subsequently to profit or loss |
|
|
|
|
|
Net changes in fair value of cash flow hedges |
|
206.150 |
(195.940) |
|
|
Exchange difference on translation of foreign operations |
|
(685.700) |
793.600 |
|
|
Total other comprehensive income, net of taxes |
|
(480.070) |
566.180 |
|
|
Total other comprehensive income for the year |
|
2312.310 |
3175.430 |
|
|
|
|
|
|
|
|
Earnings / (Loss) Per
Share (INR) |
|
|
|
|
|
Basic |
|
4.14 |
3.89 |
|
|
Diluted |
|
4.08 |
3.72 |
LOCAL AGENCY FURTHER INFORMATION
|
Sr. No. |
Check list by
info agents |
Available in
Report (Yes/No) |
|
1 |
Year of establishment |
Yes |
|
2 |
Constitution of the entity -Incorporation
details |
Yes |
|
3 |
Locality of the entity |
Yes |
|
4 |
Premises details |
No |
|
5 |
Buyer visit details |
-- |
|
6 |
Contact numbers |
Yes |
|
7 |
Name of the person contacted |
Yes |
|
8 |
Designation of contact person |
Yes |
|
9 |
Promoter’s background |
Yes |
|
10 |
Date of Birth of Proprietor / Partners /
Directors |
Yes |
|
11 |
Pan Card No. of Proprietor / Partners |
No |
|
12 |
Voter Id Card No. of Proprietor / Partners |
No |
|
13 |
Type of business |
Yes |
|
14 |
Line of Business |
Yes |
|
15 |
Export/import details (if applicable) |
No |
|
16 |
No. of employees |
Yes |
|
17 |
Details of sister concerns |
Yes |
|
18 |
Major suppliers |
No |
|
19 |
Major customers |
No |
|
20 |
Banking Details |
Yes |
|
21 |
Banking facility details |
Yes |
|
22 |
Conduct of the banking account |
-- |
|
23 |
Financials, if provided |
Yes |
|
24 |
Capital in the business |
Yes |
|
25 |
Last accounts filed at ROC, if applicable |
Yes |
|
26 |
Turnover of firm for last three years |
Yes |
|
27 |
Reasons for variation <> 20% |
-- |
|
28 |
Estimation for coming financial year |
No |
|
29 |
Profitability for last three years |
Yes |
|
30 |
Major shareholders, if available |
Yes |
|
31 |
External Agency Rating, if available |
Yes |
|
32 |
Litigations that the firm/promoter
involved in |
-- |
|
33 |
Market information |
-- |
|
34 |
Payments terms |
No |
|
35 |
Negative Reporting by Auditors in the
Annual Report |
No |
COMPANY OVERVIEW
The Company was incorporated on 6 December 2001. The Company is engaged in the business of providing customer management services like contact center, transaction processing and debt collection services including revenue cycle management in the healthcare industry.
The Company is a public limited company incorporated and domiciled in India having registered office at Mumbai, Maharashtra, India. The company is listed on the Bombay Stock Exchange and National Stock Exchange in India.
The Company’s financial statements are approved for issue by the Board of Directors on 5 May 2017.
FINANCIAL RESULTS:
The standalone total income increased from INR 8932.030 Million to INR 9548.510 Million, an increase of 6.90% over the previous financial year. The standalone Profit after Tax increased from INR 1512.230 Million to INR 1884.590 Million, an increase of 24.63% over the previous financial year.
MANAGEMENT’S
DISCUSSION AND ANALYSIS
GLOBAL ECONOMIC
OUTLOOK
A significant uncertainty on the global front compounded by the domestic volatility around the demonetisation exercise cast a shadow on the economy in general. Muted investments, stagnant global trade and currency volatility has left the global economy in a flux.
However, given the fiscal initiatives undertaken by the major economies to boost growth, the economy is expected to have a modest pickup in the coming years. The projections estimate a 3.3% growth in CY17, 3.5% in CY18 from 3.0% growth in CY16. Although this is quite a modest recovery, it would still leave the global growth, below the historical average of 4%, during the time prior to the economic downturn. This growth is expected to be in pockets, driven primarily by the emerging economies with China and India leading the growth pack; despite lowering of growth guidance by the World Bank for both these economies. Currency movements, especially the continued sharp decline of the British pound against the dollar and other major currencies have an impact on the companies that have operations in the UK or work for UK customers in other geographies.
Collectively, advanced economies are projected to grow by 1.9% in CY17 and 2.0% in CY18. The growth in the US economy is highly dependent on the potential policy changes and potential political stance of the new administration. As per the forecast the US economic growth will increase by 2.3% in 2017 and 2.5% in 2018 from dismal 1.6% growth rate in 2016. A slight recovery in the oil prices and stabilisation of the dollar helped the US economic activity accelerate during the last year. This boost will aid the economic recovery by initiating inventory re-stocking hence, encourage GDP growth.
The outlook for the European economies remains unchanged. They are expected to grow at the same moderate pace as that of 2016. High nonperforming loans and labor market slowdown in certain European countries will continue to hold back growth prospects for the Eurozone. The United Kingdom’s growth is projected to decline further than its rate in 2016 as rising inflation weighs on the real income and consumption and weak business investment due to the uncertainty about the future trading relations with the Eurozone after Brexit.
Changing policies and shifting priorities under the new administration in the United States and its global spillover, China’s global policy and fiscal stimulus and UK’s departure from the European Union will be viewed as major catalysts for growth rate revision. Therefore, even as the global economic environment remains challenging, the world is trying to take small steps towards recovery.
INDUSTRY STRUCTURE
AND DEVELOPMENT
The geo-political rumblings, namely—the Brexit referendum, calls for Border tax in the US, increase in salary wages for H1B visas—the disruptive technology advancement driven by automation, artificial intelligence, analytics and digital, are creating a highly volatile future for the global IT and BPO industries. Today, technology is not only restricted to the traditional corporate sector, but also has crossed over to different segments across a wide spectrum of industries. Enterprises in every sector look towards technology to facilitate their own transformations. Globalisation and the race for competitive advantage have led businesses everywhere to embrace cutting-edge technology. 2016, in particular, has been a year of continued technological disruptions, where technology has been imperative in connecting different business segments. From testing driverless cars on to the use of artificial-intelligence enabled robotics in the mainstream sectors; technology has played a vital role in establishing itself as a unifying force between different segments on one hand and consumers on the other.
After a few years of stagnation, the global technological industry saw a modest growth recovery of about 4% in 2016. The worldwide IT spending is projected to be USD 3.5 trillion in 2017, which is 2.7% increase from the spend rates in 2016. The Global IT-BPM market in 2016 stood at USD 1.2 trillion. However, the global sourcing growth continues to outperform the IT-BPM spend growth. As for 2016 the growth for sourcing was at 6.7% and stood at USD 173-178 billion. Adoption of digital technologies would act as a key driver for the global IT-BPM industry, where the addressable market is likely to expand to ~USD 4 trillion by 2025 and a CAGR of 3.6%. It is expected that the industry’s mix between traditional and digital will change significantly over the next decade.
The Indian IT-BPM industry has been experiencing the impact of the global economic downturn as well as the political developments around the world. According to NASSCOM strategic review 2017, Indian IT services and BPM industry’s sectoral revenue is expected to reach USD 200-225 billion in 2020 and revenue of USD 350 billion by 2025. Digital technologies have helped in both disrupting as well as transforming the business. From cloud-based applications to big data analytics, digital disruptions have reached a stage where it is important to adapt and adopt to sustain a business successfully. Digital technologies will play an important role in defining the sector and are likely to have 23% share by 2020 and greater than 38% share in 2025. ITBPM exports play a key role in India’s economy. Its share in India’s total service export is over 49% and it accounts for 32% on India’s forex reserves.
According to Business wire reports, the global BPM market size is estimated to grow to USD 13.52 billion in 2021, at a CAGR of 14.2% from 2016-2021. The key drivers for the BPM market are the need to improve efficiency and visibility, increased government compliance and overall Return on Investment from the companies.
The global business environment is going through fundamental economic, technology, consumer preference and demographic shift. These tectonic shifts have aided the global BPM market to increase enterprise operational efficiencies and gain deeper insight into the business. According to NASSCOM, the global BPM spend in 2016 grew at 4%, a CAGR of (2012- 2016) of 8-9% to reach USD 183 billion. Whereas the global BPM sourcing market has grown 7-8% in 2016, with India contributing 37% to the overall BPM sourcing market. Some of the main growth contributors for the BPM sector were emerging verticals such as healthcare and retail, established verticals such as BFSI, manufacturing and telecom contributed significantly due to their higher base. In terms of BPM segments, Process automation, platform / BPaaS / operation mechanisms and analytics were the main growth drivers. BPM solutions are expected to dominate the industry in the next five years due to the growing need of business compliance and their challenges faced by organisations worldwide. The Indian BPM industry has significantly evolved over the years; not only in terms of scale but also matured itself in terms of scope of service offerings, customer segments served and service delivery models, aiding a major transformation with the industry moving ahead from efficiency to effectiveness.
The Indian BPM sector has grown over 1.6 times in the last five years and is expected to cross USD 30 billion in revenues in 2017 at a growth rate of 7.4% over 2016. Over 87% of the revenues of the total Indian BPM market are contributed by exports, while the remaining 13% is from the domestic business. The export market is set to grow 7.5% in 2017 to reach USD 26.3 billion whereas the domestic market is clocking growth of 6.9% to reach 3.8
billion. NASSCOM projects the BPM sector revenues are set to grow to USD 50 billion by the year 2020.
Despite the uncertainty and volatility, the Company grew at an impressive 10.5% in rupee terms and 12.9% in constant currency terms which is among the leading growth rates in the industry.
SEGMENT-WISE OUTLOOK
HEALTHCARE
Firstsource addresses two segments within the Healthcare vertical, the Payer market represented by the Insurance companies and the Provider market represented by hospitals, physician groups in the US. The Global Healthcare BPO market is predicted to grow at a CAGR of almost 6% by 2020. Global healthcare IT-BPM market is expected to grow from USD 170.47 billion revenues in 2016 to USD 276.79 billion in 2021. The market drivers for the Healthcare IT-BPO industry are consolidation among and between payers and providers, telemedicine, consumerisation. In addition, the technological advances like robotics process automation, digital transformation and new new operations and billing models, will contribute to the forecasted growth. (Source: NelsonHall)
The Healthcare payer BPM market is segmented into claims processing services, member services, HR services, and finance and accounting services. The health insurance payer market grew by 5.5% in 2016 and is expected to grow to 6.1% in 2020. The impact of regulatory changes and key policyinitiatives are key factors boosting the healthcare payer BPM market.
The payer outsourcing sector is positioned to benefit from a number of key macro trends which had been set in motion in the previous years. These trends include escalating costs, widespread consolidation and regulatory complexity, changing business models, payer-provider convergence, and evolution of the patient-centric paradigm. It is being fuelled by mobile computing, social media platforms and ‘anytime-anywhere’ information access. This combination of both disruptive and legacy factors is forcing payers to adopt new technologies, while revamping their existing systems, processes and interfaces. Increasing stringency of regulatory landscape and needs for compliance creating pressure on the profitability of healthcare payers, and focus on value-based care creating challenges for both providers and payers are some of the factors driving adoption of BPO services. While there is still a significant need to reduce costs: administrative and medical, the relationship between healthcare organisations and service providers are expanding beyond cost reduction to quality, engagement and innovation.
During the last couple of years the industry has seen a shift in the market as consumerism, competition, and regulation have driven a broader swathe of clients to new operating models and opened the door to service providers. The client base is expanding to include “Blues” plans and networks, healthcare providers, a broader set of services including member-management, providernetwork management, along with health and care management as well as analytics. The solutions are increasingly leveraging third party, service provider tools and platforms to drive outcomes. The contracts are increasingly varied, based on not just headcount, or per member per month (PMPM), but also results.
Technology-led solutions are gaining traction in healthcare BPO, with platform solutions being the most preferred by the buyers. Robotic Process Automation (RPA) is expected to play an impactful role in the future. In commodity areas of sourcing claims and provider data/network management in particular, automation is helping to streamline and speed up processing. There is an increasing expectation among clients that automation is “baked into” the solution. Besides automation, the greatest take-up till date has been the increasing use of technology in call centers, and in web-enabling claims, member-management, and Medicaid Management Information Systems (MMIS). With expanding capabilities of service providers, the service provider landscape is expected to become more competitive.
In the context of Healthcare provider segment such as hospitals, 2017 is expected to be a year full of challenges and opportunities. The market size growth of the provider segment was 3.2% in 2016 and is expected to grow to 5.3% in 2020 at a CAGR of 4.9%. The Healthcare provider services is segmented into medical billing, medical coding, medical transcription, and revenue cycle management. According to the Everest Group, the USD 7.5- 8.5 billion Revenue Cycle Management (RCM) outsourcing services market represents a significant opportunity with 11%-14% anticipated CAGR growth. Some of the major drivers of this change include: Outsourcing in the RCM market gaining traction as continuously rising administrative expenses putting significant pressure on the profitability of hospitals.
Several regulatory changes such as MACRA, ICD-10 conversion, and HITECH act are also pushing towards increased use of outsourcing as a solution; consolidation among the payer community is also driving healthcare providers to optimise non-core spend. Additionally, rising cases of bad debt write-offs are also pushing healthcare providers towards more sophisticated technology systems and solutions.
Market for traditionally outsourced RCM functions, such as post-service (medical billing and denial management) getting matured, as over 80% hospitals in the US outsource some part of post-service functions to specialised service providers. However, opportunities in functions, such as pre-service (eligibility verification and appointment scheduling) and service (coding and charge capture), are gaining traction.
Automation is becoming the flavour of the industry with buyers asking for solutions that are integrated across different functions and involve automation. There are a lot of possibilities for leveraging automation software in the rulesbased work for utilisation management, and even ways to cut out steps by changing the processes. “Bundles” of care, for example, in packaging a predetermined set of procedures and associated costs for surgery and recovery are taking root and this type of plan will change the utilisation-management process. Legacy patient accounting and practice-management applications lack the automation and analytics to address new reimbursement models and today’s business office challenges. PPACA regulations, ICD-10, and complex processes in billing and collections are resulting in revenue losses while exposing the talent and technology gaps of many providers. For many healthcare finance leaders, a strategy to outsource RCM means resolving near-term cash leakages for long-term revenue integrity.
With all the change happening in the healthcare industry, there’s a need to better understand constituents, efficient ways to maximise reimbursements and meet federal regulations, etc., organisations need to aggregate and analyse data efficiently. This represents a significant opportunity that can be realised with analytics.
Firstsource is uniquely positioned to harness this growth opportunity as it works for 3 of the top 5 Payers and over 650 hospitals in the US and it offers an end-to-end suite of services to cater to the Payers and Providers. Its presence across both the segments of this market gives the Company a strong differentiating edge. Healthcare segment contributes 35.8% towards the company’s total revenue.
TELECOMMUNICATIONS
AND MEDIA (T&M):
Global Customer Management Services (CMS) market is estimated to be USD 62.7 billion and is expected to grow at a CAGR of 5.1% for the period of 2014 - 2019. The CMS market for Telecom is expected to reach USD 26.6 billion in 2018. The North American market for CMS is expected to grow to approx. USD 9.1 billion in 2018, up from USD 7.2 billion in 2014. The EMEA region is expected to have the largest market share in CMS sector as it is poised to grow to USD 9.5 billion in 2018 from USD 7.9 billion in 2014. Another emerging market for the CMS sector is the Latin American market which is expected to be rising to USD 4.4 billion in 2018. (Source: NelsonHall)
According to NelsonHall’s latest report, the global telecom operations’ market which, is estimated to be around USD 3 billion has the potential to grow to a USD 10 billion market. SMACA (Social, Mobility, Automation, Cloud, Analytics) segment contributes to about 7% to the telecom operations’ market and has the potential to reach about 25% of the market size. Although larger telecom companies have been early adopters of the telecom operations services sector, there is a great potential to expand and provide the services to smaller Tier 2 and Tier 3 Telecom companies. With Mobility and Automation are emerging as game-changers for the telecom industry, BPM companies will play a significant role in aiding telecom companies to automate their processes to enable speedy and consistent delivery of their services.
Telecom Operations As-a-Service will evolve even faster in the next few years than it has so far. The deployment of IoT solutions, the widespread adoption of network rollout management and other new services leveraging design thinking will lead to significant advances in this offering in the near term.
Although some telecom companies are still hesitant to replace their legacy systems, service providers have already started building new solution stacks which can replace legacy telco systems. So service providers are making investments in incremental solutions which are designed to work around or integrate with existing physical and technological investments. Greenfield operators, Mobile Virtual Network Operators, who don’t have legacy investments, are willing to leapfrog to new technology stacks that present significant opportunities.
With the world connecting with their networks using telecom as their primary channel of communication, telecom companies have access to large quantities of data. Yet, only a handful of companies have adopted big data architecture and analytics technologies to their advantage. However, with increasing number of telecoms considering investments in data science and over 30% companies already making heavy investments in the same, there is great scope for BPM companies to make a foray in this field. Combining its thorough understanding of socio-demographic data, the telecom industry can get valuable insights by applying big data analytics to consumer behaviour and heavy network usage.
The telecom sector continues to be a significant force for growth, innovation and disruption. With the increase of Smartphone usage by the masses, telecom companies have opened new opportunities for IT-BPM companies. One of the emerging areas of focus for the IT-BPM sector is implementation of Internet of Things (IoT) in telecom and media. With the advances in network technology along with higher speeds, IoT technology will help the telecom sector easily deliver content to user screens. Since IoT will push carriers to be frontrunners in the highly competitive environment, business operations and processes have the opportunity to prove their mettle.
In a global environment characterised by such rapid technology changes, intense competition and pricing pressures, it is critical for companies to focus on effective customer engagement, reduce churn and improve loyalty andadvocacy; Fortunately, telcos have a combination of traditional interaction channels (IVR, phone support, SMS, email, paper correspondence) and newage technology-driven communication channels (webchat, videochat, social media, and virtual-assistants) at their disposal. Investing in an effective omni-channel framework reduces the overall cost-to-serve for telecom and media organisations. The focus will be on customer journeys across different channels, while orchestrating the customer experience across different channels in a seamless, integrated and consistent manner.
Intelligent Automation leveraging RPA, cognitive and analytics is gaining the interest of telcos. Most of the early automation services in telcos came from either order-management or customer support, but lately automation has gained traction in other telco processes such as network design, billing audits, field-force-management, incident and problem management. Almost all service providers are now offering automation solutions either on their own
platforms or leveraging third party solutions.
US AND UK CABLE
INDUSTRY:
According to industry estimates, US cable industry’s broadband advantage and bundling stance will enhance revenues for the industry from 2016 to 2026. Residential revenues are projected to increase from USD 108.38 billion in 2016 to USD 117.7 billion in 2026 or USD 9.32 billion over the 10-year interval. Contributions from commercial services will help push total industry revenue from USD 130.57 billion in 2016 to USD 140.99 billion in 2026 — USD 10.42 billion growth over the 10-year period.
Over The Top providers like Netflix and Amazon have become serious competition and are finding rewarding niches by serving a library of movies and TV shows. The cable industry’s TV Everywhere initiative will play a key role in competitive positioning and subscriber retention. Widespread consumption of video on secondary devices, such tablets, will be driven by the competition between Over the Top providers and TV Everywhere, as well as DVR content and sports programming, which is not available on Netflix.
In an environment where customer retention is more critical than ever, the importance of Quad Play is growing. More companies are looking to bundle additional products and services with the traditional Triple Play to increase ARPU and customer stickiness. Some multiple system operators may seek to build or strengthen partnerships to offer their own version of an expansion of offerings. The traditional Quad Play adds wireless, though other service offerings (e.g. home security) may also be in the running.
While some efficiency has been achieved through technology, there will be another wave of acquisition and consolidation of cable operations. As a result of these shifts, the buying power of Multi-Channel Video programming distributors (MVPDs) will increase and the new scale will allow them to invest in services that compete with the best OTT players. Over the past year, US cable industry reported around USD 126 billion of M&A activity.
Availability of new technologies and innovations will make 2017 the year of digital transformation as many telecoms still heavily rely on manual processes. By investing to provide better data infrastructures and technologies, telecom companies will be able to achieve rapid growth and in turn bring about massive growth for IT/BPM sector as well. With connectivity and mobility becoming firmly embedded in today’s society and the ongoing change and innovation in the space of Technology in terms of business processes, 2017 will be an exciting year for the Telecom led IT-BPM sector.
The ability to provide an omni-channel interaction across different product lines through an interplay of digital and analytics provides a distinctive advantage to the Company in this business segment.
Telecommunication and Media segment contributes 32.2% towards the company’s total revenue.
AWARDS AND ACCOLADES:
The Company received the following awards and accolades during the year.
Welsh Contact Centre
Awards 2017
Won in three categories including Diverse Workplace Award, Trainer of the year and Special Industry Champion.
Global HR Excellence
Awards 2017
Won in Innovation in Retention Strategy category.
Asia’s Best Employer
Brand Awards 2016
Won the Best Employer Brand Award for excellence in building the Employer Brand as an Employer of Choice.
European Contact Centre & Customer Service Awards 2016
Honored with the Bronze award in the ‘Customer Service Team of the Year’ in partnership with our client giffgaff.
100 Best Companies
for Women in India
Recognised in the 100 Best Companies for Women in India by the 2016 Working Mother and AVTAR Best Companies for Women in India.
Times Ascent - Asia Pacific HRM Congress Awards 2016
Recognised in the Innovative HR practices award category for initiatives in Analytics, Talent Management, GES, Wings Within, INSIGHT – Knowledge capsules, JetSet and Firstsource Academy offerings.
Business in the Community
Awards
Honored as ‘Employer of Choice’ at the Business In The Community Northern Ireland Awards in Belfast.
Best Adversity
Management Stories of Asia 2016
Secured the 1st Runner-up position at the ‘Best Adversity Management Stories of Asia’ 2016 Awards for response to the Chennai floods in Nov- Dec 2015.
Asia’s Best Employer
Brand Awards 2016
Recognised in three categories - ‘Best B-school recruiting programme’, ‘Organisation with Innovative HR Practices’ and ‘Best HR Strategy in line with Business’.
UK Customer
Experience Awards 2016
Won in the Technology and Telecoms category in partnership with NOW TV client and received the silver award in the ‘Engaging Customers Online’ category in partnership with giffgaff client.
Aer Lingus Viscount
Awards
Received Employee Champion Award at the Aer Lingus Viscount Awards in association with Ulster
Business.
UNSECURED LOANS:
|
Unsecured Loan |
31.03.2017 INR In Million |
31.03.2016 INR In Million |
|
Long-term
Borrowings |
|
|
|
Loan from non-banking financing companies |
88.520 |
48.050 |
|
|
|
|
|
Short-term
borrowings |
|
|
|
Export finance from banks |
619.250 |
584.800 |
|
Loan from non-banking financing companies |
64.030 |
40.130 |
|
Interest accrued but not due on borrowings |
3.800 |
2.740 |
|
Total |
775.600 |
675.720 |
INDEX OF CHARGE:
|
SNo |
SRN |
Charge Id |
Charge Holder Name |
Date of Creation |
Date of Modification |
Date of Satisfaction |
Amount |
Address |
|
1 |
C64088651 |
10590699 |
ICICI Bank Limited |
18/08/2015 |
- |
- |
2840000000.0 |
Landmarkrace Cource Circle, Alkapuri, Vadodara-390015, Gujarat, India |
|
2 |
C67478396 |
10306196 |
IL and FS Trust Company Limited |
22/07/2011 |
27/01/2015 |
24/09/2015 |
17339999880.0 |
IL and FS Financial Centre, Plot No. C22 G Block, Bandra Kurla Complex, Bandra (East), Mumbai-400051, Maharashtra, India |
|
3 |
B16584542 |
10137871 |
3i Infotech Trusteeship Services Limited |
08/01/2009 |
- |
30/06/2011 |
60000000.0 |
3rd to 6th Floor, International Infotech Park, Tower No.5, Vashi Railway Station Complex, Vashi, Navi Mumbai-400703, Maharashtra, India |
|
4 |
B04835492 |
90350447 |
ICICI Bank Limited |
08/06/2004 |
- |
21/01/2011 |
690000000.0 |
Race Corse Circle, Vadodara, Gujarat, India |
|
5 |
A59827857 |
90350521 |
ABN Amro Bank N.A |
22/09/2004 |
- |
01/04/2009 |
11000000.0 |
Nariman Point, Mumbai, Maharashtra, India |
CONTINGENT
LIABILITIES:
(INR in million)
|
PARTICULARS |
31.03.2017 |
31.03.2016 |
|
The estimated amount of
contracts remaining to be executed on capital account and not provided for,
net of advances |
93.750 |
134.180 |
|
Claims not acknowledge as debt |
1.350 |
1.350 |
|
Guarantees and letters of credit given |
14141.540 |
11402.070 |
Direct tax matters
Income tax demands amounting to INR 1197.930 (31 March 2016: INR 1280.610) for the various assessment years are disputed in appeal by the Company in respect of which it has favorable decisions supporting its stand based on the past assessment or otherwise and hence, the provision for taxation is considered adequate. the Company has paid INR 10.38 (31 March 2016: INR 10.38) tax under protest against the demand raised for the assessment year 2004-05, INR 12.50 (31 March 2016: INR 12.50) tax under protest against the demand raised for the assessment year 2009-10, INR 80.00 (31 March 2016: INR 80.00) tax under protest against the demand raised for the assessment year 2011-12 and INR Nil (31 March 2016: INR 28.10) tax under protest against the demand raised for the assessment year 2012-13
Indirect tax matters
Service tax demands amounting to INR 172.11 (31 March 2016: INR 172.11) in respect of service tax input credit and FCCB issue expenses is disputed in appeal by the Company. The Company expects favourable appellate decision in this regard.
The Company’s pending litigations comprise of claims against the Company and pertaining to proceedings pending with Income tax and service tax. The Company has reviewed all its pending litigations and proceedings and has adequately provided for where provisions are required and disclosed as contingent liabilities where applicable, in the financial statements. The Company does not expect the outcome of these proceedings to have a materially adverse effect on its financial statements.
Guarantees and letters of
credit given consist of the following:
(INR in million)
|
Particulars |
31.03.2017 |
31.03.2016 |
|
Guarantees given for
working capital facilities and finance lease on behalf of Firstsource
Solution UK Limited (FSL-UK) |
3950.090 |
815.690 |
|
Guarantees given for
credit facilities and term loans on behalf of Firstsource Group USA, Inc. (FG
US) |
10173.450 |
10580.220 |
|
Guarantees given to the
Government of India, Customs and Central excise department in relation to
duty securities |
18.000 |
6.160 |
STANDALONE AUDITED
FINANCIAL RESULTS FOR THE QUARTER ENDED AND NINE MONTHS ENDED DECEMBER 31, 2017
(INR In Million)
|
Particulars |
Quarter ended |
Nine months ended |
|
|
|
31.12.2017 |
30.09.2017 |
31.12.2017 |
|
|
(Audited) |
(Audited) |
(Audited) |
|
INCOME FROM OPERATIONS |
|
|
|
|
Net Sales |
1860.200 |
1886.550 |
5921.810 |
|
Other Operating Income |
269.940 |
284.280 |
862.140 |
|
Total
Income from Operations |
2130.140 |
2170.830 |
6783.950 |
|
|
|
|
|
|
EXPENSES |
|
|
|
|
Employee benefits expense |
994.840 |
1053.320 |
3254.250 |
|
Depreciation and Amortization expenses |
56.040 |
54.100 |
160.220 |
|
Finance Costs |
(6.110) |
22.110 |
35.380 |
|
Other Expenditure |
479.310 |
530.990 |
654.290 |
|
Total
Expenses |
1524.080 |
1660.520 |
5079.500 |
|
Profit
/ (Loss) before Tax |
606.060 |
510.310 |
1704.450 |
|
Tax Expense |
95.180 |
71.780 |
249.470 |
|
Profit
/ (Loss) after Tax |
510.880 |
438.530 |
1454.980 |
|
Other
comprehensive income, net of taxes |
44.690 |
(189.850) |
(319.240) |
|
Total
comprehensive income |
555.570 |
248.680 |
1135.740 |
|
Earnings / (Loss) Per
Share (INR) |
|
|
|
|
Basic |
0.75 |
0.64 |
2.13 |
|
Diluted |
0.74 |
0.64 |
2.12 |
NOTES:
1. The audited interim condensed consolidated financial statements for the quarter and nine months ended December 31, 2017 have been taken on record by the Board of Directors at its meeting held on February 7, 2018. The statutory auditors have expressed an unmodified audit opinion. The information presented above is extracted from the audited interim condensed consolidated financial statements These financial statements are prepared in accordance with the Indian Accounting Standard (Ind AS) as prescribed under Section 133 o( Ihe Companies Act, 2013 read with Rule 3 of the Companies (Indian Accounting Standards) Rules, 2015 and Companies (Indian Accounting Standards) Amendment Rules, 2016.
2. During the nine months ended December 31, 2017, 3952007 equity shares were
issued pursuant to exercise of stock options under the Employee Stock Option
Scheme of the Company.
3. Tax expense for the quarter ended and nine months ended 31 December 2017, is
net of Deferred tax credit of INR 240.770 million, after taking into account
reduction in US Federal tax rate.
FIXED ASSETS:
- Leasehold improvements
- Computers
- Service equipment
- Office equipment
- Furniture and fixture
- Vehicles
PRESS RELEASE / WEBSITE DETAILS
IRSTSOURCE SOLUTIONS REPORTS THIRD QUARTER FISCAL 2018 RESULTS WITH
INCREASED REVENUES AND IMPROVED PROFIT MARGINS
Revenues of INR 8872.000 Million
EBIT of INR 990.000 Million
PAT of INR 995.000 Million
Kolkata, February 07, 2018: Firstsource Solutions Limited (NSE:FSL, BSE:532809), a global provider of customised Business Process Management (BPM) services and a RP-Sanjiv Goenka Group company, reported its consolidated financial results for the quarter ended December 2017 according to Ind AS.
Highlights for the
Quarter ended December 31, 2017:
- Revenues at INR 8872.000 million, 0.2% Y-o-Y and 2.4% in CC; 1.6% Q-o-Q and 0.6% in CC
- EBIT at INR 990.000 million or 11.2% of revenues, 8.0% Y-o-Y; 5.9% Q-o-Q
- PAT at INR 995.000 million or 11.2% of revenues, 42.2 Y-o-Y; 44.8% Q-o-Q
- Includes one-time deferred tax credit of INR 240.000 million due to reduction in US federal tax rate from 34% to 21%
- By Geography: Firstsource derived 54.0% revenues from the US, 45.0% from the UK and 1.0% from Rest of World, including India.
- By Vertical: Firstsource derived 37.4% revenues from Healthcare, 33.3% from Telecom & Media and 29.3% from BFSI.
- By Segment: Firstsource derived 54.5% revenues from Customer Management, 35.5% from Healthcare and 10.0% from Collections.
- Employee strength was 19,226 as of December 31, 2017, addition of 32 employees in the quarter.
- Q3 annualized attrition (post 180 days):
- Offshore (India and Philippines) – 39.8% compared to 38.8% in Q2 FY18
- Onshore (US and Europe) – 39.4% compared to 53.0% in Q2 FY18
Mr. Sanjiv Goenka, Chairman, RP-Sanjiv Goenka Group and Firstsource Solutions said “Their strategic call to exit from the domestic segment last quarter has started showing improvements in their profit margins. In the quarters ahead, they will continue on the growth trajectory, focusing on improving their financial performance and shareholder’s value. As always, they will work on aggressively building their clientele in the segments and markets they operate in.”
Business Highlights
for the Quarter ended December 31, 2017:
Business Wins
Won additional contracts in the quarter for the Customer Management, Healthcare, Mortgage and Collections business with existing and new clients.
- Amongst other contracts won this quarter in Healthcare, notable one is the Eligibility Contract won from one of the largest Health Systems in North America where the customer partnered with Firstsource on a successful concept of automating the Eligibility Services process and subsequently chose Firstsource to be one of the preferred partners to deliver the services for their directly owned and managed hospitals.
Debt Repayment
Firstsource Group USA, wholly owned subsidiary of
Firstsource Solutions successfully made the quarterly principal repayment of
USD 11.25 million on its outstanding debt on December 31, 2017.
Awards and
Recognitions
- Recognised as a ‘Major Contender’ in Everest Group’s Mortgage BPS Service Provider Landscape with Services PEAK Matrix™ Assessment 2017. The positioning recognises Firstsource’s focus on excellence and delivery, and highlights the company’s commitment to providing a smart and collaborative partnership for clients.
- Healthcare Provider and Payer businesses were also recognised as ‘Major Contender’ in Everest Group’s Service Provider Landscape PEAK Matrix™ Assessment 2017. The positioning recognises the investments and strides made in the digital arena, especially with RPA deployment for Payer and automation solutions for Provider services.
- Won 3 awards at the European Contact Centre and Customer Service Awards (ECCCSA’s) 2017: Gold in Medium Contact Centre of the Year, Silver in Outsourcing Partnership of the Year for work done with Sky and Silver in Outsourced Contact Centre of the Year for work done out of the Middlesbrough office in the UK. The awards recognise the team’s commitment to understanding and responding to customer needs and delivering great customer experiences.
- Awarded the ‘BPO Contract of the Year’ at the Global Sourcing Association (GSA) Awards 2017, in recognition of the on-going work with Sky. This win recognises Firstsource’s long-term partnership with Sky and the success achieved by creating a joint operational management structure, transparent culture and the innovative use of technology and approach to customer experience.
- Won the prestigious ‘Customer Service Excellence Award’ at the NASSCOM BPM Strategy Summit 2017. This award in the ‘Return on Investment (ROI)’ category recognises Firstsource’s focus on providing agile solutions across channels and creating immense RoI for its client.
- Won two awards at the UK Customer Experience Awards 2017: Gold in the Large Contact Centre category in partnership with Sky and CX Professional of the Year for Kathryn Chivers, VP – Sales Operations, UK. The wins celebrate Firstsource’s work in Cardiff office in the UK to deliver top quality customer experiences
.
About Firstsource
Firstsource Solutions Limited, a RP-Sanjiv Goenka Group company (NSE: FSL, BSE: 532809, Reuters: FISO.BO, Bloomberg: FSOL@IN), is a leading global provider of customised Business Process Management (BPM) services to the Healthcare, Telecom and Media and Banking and Financial Services industries. The company’s clients include Fortune 500, FTSE 100 and Nifty 50 companies. Firstsource has a “rightshore” delivery model with operations in India, Philippines, UK and US.
CMT REPORT (Corruption, Money Laundering & Terrorism]
The Public Notice information has been collected from various sources
including but not limited to: The Courts, India Prisons Service, Interpol,
etc.
1] INFORMATION ON
DESIGNATED PARTY
No records exist designating subject or any of its beneficial owners,
controlling shareholders or senior officers as terrorist or terrorist
organization or whom notice had been received that all financial transactions
involving their assets have been blocked or convicted, found guilty or against
whom a judgement or order had been entered in a proceedings for violating
money-laundering, anti-corruption or bribery or international economic or
anti-terrorism sanction laws or whose assets were seized, blocked, frozen or
ordered forfeited for violation of money laundering or international
anti-terrorism laws.
2] Court Declaration :
No records exist to suggest that subject is
or was the subject of any formal or informal allegations, prosecutions or other
official proceeding for making any prohibited payments or other improper
payments to government officials for engaging in prohibited transactions or
with designated parties.
3] Asset Declaration :
No records exist to suggest that the property or assets of the subject
are derived from criminal conduct or a prohibited transaction.
4] Record on Financial
Crime :
Charges or conviction
registered against subject: None
5] Records on Violation of
Anti-Corruption Laws :
Charges or
investigation registered against subject: None
6] Records on Int’l
Anti-Money Laundering Laws/Standards :
Charges or
investigation registered against subject: None
7] Criminal Records
No
available information exist that suggest that subject or any of its principals
have been formally charged or convicted by a competent governmental authority
for any financial crime or under any formal investigation by a competent
government authority for any violation of anti-corruption laws or international
anti-money laundering laws or standard.
8] Affiliation with
Government :
No record
exists to suggest that any director or indirect owners, controlling
shareholders, director, officer or employee of the company is a government
official or a family member or close business associate of a Government
official.
9] Compensation Package :
Our market
survey revealed that the amount of compensation sought by the subject is fair
and reasonable and comparable to compensation paid to others for similar services.
10] Press Report :
No press reports / filings exists on
the subject.
CORPORATE GOVERNANCE
MIRA INFORM as part of its Due Diligence do provide comments on
Corporate Governance to identify management and governance. These factors often
have been predictive and in some cases have created vulnerabilities to credit
deterioration.
Our Governance Assessment focuses principally on the interactions
between a company’s management, its Board of Directors, Shareholders and other
financial stakeholders.
CONTRAVENTION
Subject is not known to have contravened any existing local laws,
regulations or policies that prohibit, restrict or otherwise affect the terms
and conditions that could be included in the agreement with the subject.
FOREIGN EXCHANGE RATES
|
Currency |
Unit
|
INR |
|
US Dollar |
1 |
INR 64.85 |
|
UK Pound |
1 |
INR 90.58 |
|
Euro |
1 |
INR 79.97 |
INFORMATION DETAILS
|
Information
Gathered by : |
SHL |
|
|
|
|
Analysis Done by
: |
PRY |
|
|
|
|
Report Prepared
by : |
BHG |
SCORE FACTORS
|
DEMERIT POINTS |
|
|
|
--BANK CHARGES |
YES/NO |
YES |
|
--LITIGATION |
YES/NO |
NO |
|
--OTHER ADVERSE INFORMATION |
YES/NO |
NO |
|
MERIT POINTS |
|
|
|
--SOLE DISTRIBUTORSHIP |
YES/NO |
NO |
|
--EXPORT ACTIVITIES |
YES/NO |
NO |
|
--AFFILIATION |
YES/NO |
YES |
|
--LISTED |
YES/NO |
YES |
|
--OTHER MERIT FACTORS |
YES/NO |
YES |
RATING EXPLANATIONS
|
Credit Rating |
Explanation |
Rating Comments |
|
A++ |
Minimum Risk |
Business dealings permissible with minimum
risk of default |
|
A+ |
Low Risk |
Business dealings permissible with low
risk of default |
|
A |
Acceptable Risk |
Business dealings permissible with
moderate risk of default |
|
B |
Medium Risk |
Business dealings permissible on a regular
monitoring basis |
|
C |
Medium High Risk |
Business dealings permissible preferably
on secured basis |
|
D |
High Risk |
Business dealing not recommended or on
secured terms only |
|
NB |
New Business |
No recommendation can be done due to
business in infancy stage |
|
NT |
No Trace |
No recommendation can be done as the
business is not traceable |
NB is stated where there is insufficient information to facilitate rating. However, it is not to be considered as unfavourable.
This score serves as a reference to assess
SC’s credit risk and to set the amount of credit to be extended. It is
calculated from a composite of weighted scores obtained from each of the major
sections of this report. The assessed factors are as follows:
·
Financial
condition covering various ratios
·
Company
background and operations size
·
Promoters
/ Management background
·
Payment
record
·
Litigation
against the subject
·
Industry
scenario / competitor analysis
·
Supplier
/ Customer / Banker review (wherever available)
This report is issued at
your request without any risk and responsibility on the part of MIRA INFORM
PRIVATE LIMITED (MIPL) or its officials.