|
|
|


MIRA INFORM REPORT
|
Report No. : |
484460 |
|
Report Date : |
06.01.2018 |
IDENTIFICATION DETAILS
|
Name : |
KEI INDUSTRIES
LIMITED |
|
|
|
|
Registered
Office : |
D-90, Okhla Industrial Area, Phase I, New Delhi - 110020 |
|
Tel. No.: |
91-11-26818840/ 8642 |
|
|
|
|
Country : |
India |
|
|
|
|
Financials (as
on) : |
31.03.2017 |
|
|
|
|
Date of
Incorporation : |
31.12.1992 |
|
|
|
|
Com. Reg. No.: |
55-051527 |
|
|
|
|
Capital
Investment / Paid-up Capital : |
INR 155.590 Million |
|
|
|
|
CIN No.: [Company Identification
No.] |
L74899DL1992PLC051527 |
|
|
|
|
IEC No.: |
0589000110 |
|
|
|
|
GSTIN/UIN : |
Not Divulged |
|
|
|
|
TAN No.: [Tax Deduction &
Collection Account No.] |
Not Available |
|
|
|
|
PAN No.: [Permanent Account No.] |
AAACK0251C |
|
|
|
|
Legal Form : |
A Public Limited Liability Company. The Company’s Shares are Listed on
the Stock Exchanges |
|
|
|
|
Line of Business
: |
Subject is engaged in the manufacture of a range of world-class wires (stainless steel wire) and cables (cables comprising of EHV, HT and LT power cables, control and instrumentation cables, winding wires and flexible and house wires) and also engaged into Turnkey projects etc. [Registered Activity] |
|
|
|
|
No. of Employees
: |
1184 (Approximately) |
RATING & COMMENTS
(Mira Inform has adopted New Rating mechanism w.e.f. 23rd
January 2017)
|
MIRA’s Rating : |
A+ |
|
Credit Rating |
Explanation |
Rating Comments |
|
A+ |
Low Risk |
Business dealings permissible with low
risk of default |
|
Status : |
Good |
|
|
|
|
Payment Behaviour : |
Regular |
|
|
|
|
Litigation : |
Clear |
|
|
|
|
Comments : |
Subject was incorporated in the year 1992 and it is a manufacturer of electrical cables and wires. For the financial year 2017, the company has achieved 14.77% growth in its revenue as compared to previous year revenue and has maintained average profitability margin of 3.70% during the year under review. The rating takes into consideration strong financial profile of the company by healthy net worth base along with comfortable debt coverage indicators. The company has its share price trading at around INR 376.75 against the Face Value (FV) of INR 02 on BSE as on 5th January, 2018. Rating also derives strength from company’s established track record of business. However, rating strengths are partially offset by leveraged capital structure, working capital-intensive nature of operations, inherent risks associated with the exposure to volatility in raw material prices and competition in the cable industry. Business is active. Payments are reported to be regular. In view of aforesaid, the company can be considered good for business dealings at usual trade terms and condition. |
NOTES :
Any query related to this report can be made
on e-mail : infodept@mirainform.com
while quoting report number, name and date.
ECGC Country Risk Classification List
|
Country Name |
Previous Rating (30.06.2017) |
Current Rating (30.09.2017) |
|
India |
A1 |
A1 |
|
Risk Category |
ECGC
Classification |
|
Insignificant |
A1 |
|
Low Risk |
A2 |
|
Moderately Low Risk |
B1 |
|
Moderate Risk |
B2 |
|
Moderately High Risk |
C1 |
|
High Risk |
C2 |
|
Very High Risk |
D |
EXTERNAL AGENCY RATING
|
Rating Agency Name |
CARE |
|
Rating |
Long Term Bank Facilities = A- |
|
Rating Explanation |
Adequate degree of safety and low credit risk |
|
Date |
18.09.2017 |
|
Rating Agency Name |
CARE |
|
Rating |
Short Term Bank Facilities = A2+ |
|
Rating Explanation |
Strong degree of safety and low credit risk |
|
Date |
18.09.2017 |
RBI DEFAULTERS’ LIST STATUS
Subject’s name is not enlisted as a defaulter
in the publicly available RBI Defaulters’ list.
EPF (Employee Provident Fund) DEFAULTERS’ LIST STATUS
Subject’s name is not enlisted as a defaulter
in the publicly available EPF (Employee Provident Fund) Defaulters’ list as of
31-03-2016.
BIFR (Board for Industrial & Financial Reconstruction) LISTING
STATUS
Subject’s name is not listed as a Sick Unit in
the publicly available BIFR (Board for Industrial & Financial
Reconstruction) list as of 06.01.2018.
IBBI (Insolvency and Bankruptcy Board of India) LISTING STATUS
Subject’s name is not listed in the publicly
available IBBI (Insolvency and Bankruptcy Board of India) list as of report
date.
INFORMATION DENIED BY
|
Name : |
Mr. Minind |
|
Designation : |
Accounts Department |
|
Contact No.: |
91-22-28239673 |
|
|
|
|
Name : |
Not Divulged |
|
Designation : |
HR Manager |
|
Contact No.: |
8860084506 |
|
Date : |
04.01.2018 |
LOCATIONS
|
Registered/ Corporate Office : |
D-90, Okhla Industrial Area, Phase I, New Delhi – 110020, India |
|
Tel. No.: |
91-11-26818840/ 8642/ 0242 |
|
Mobile No.: |
91-8860084506 (Mr. Mukul) |
|
Fax No.: |
91-11-26817225/ 26811959 |
|
E-Mail : |
|
|
Website : |
|
|
|
|
|
Marketing Office |
Nirvan Corporate, 7th Floor, Opposite Aghadi Nagar Pump House, Rajmata Jijabai Road, Andheri (East), Mumbai – 400093, Maharashtra India |
|
Tel. No.: |
91-22-28239673/ 28375642 |
|
Fax No.: |
91-22-28258277 |
|
|
|
|
Factory 1: |
SP-919-920, 922 RIICO Industrial Area, Phase-III, Bhiwadi, District Alwar-301019, Rajasthan, India |
|
Tel. No.: |
91-1493-220106/ 220106 |
|
Fax No.: |
91-1493-221731 |
|
|
|
|
Factory 2: |
99/2/7, Madhuban Industrial Estate, Village Rakholi, Silvassa – 396240, Dadra and Nagar Haveli (U.T), India |
|
Tel. No.: |
91-260-2644404 |
|
Fax No.: |
91-260-2645896 |
|
|
|
|
Factory 3: |
Plot No. A-280-284, RIICO Industrial Area, Chopanki, District Alwar-301019, Rajasthan, India |
|
|
|
|
Branch Office 1: |
Chennai Flat No.: 10, 1st floor, Rams Apartment, New No. 68, (old No. 141), Eldams Road, Teynampet, Chennai – 6000018, Tamilnadu, India |
|
Tel. No.: |
91-44-42009120 |
|
Fax No.: |
91-44-42009130 |
|
|
|
|
Branch Office 2: |
Mumbai Nirvan Corporate, 7th floor, Opposite Aghadi Nagar, Pump House, Rajmata Jijabai Road, Andheri (East), Mumbai – 400093, Maharashtra, India |
|
Tel. No.: |
91-22-28239673/ 28375642 |
|
Fax No.: |
91-22-28258277 |
|
|
|
|
Branch Office 3: |
Kolkata Arihanth Benchmark, 4th Floor, 113-F, Matheshwartola Road Ps. Tiljala, Kolkata – 700046, West Bengal, India |
|
Tel. No.: |
91-33-40620820/ 40620822 |
|
Fax No.: |
91-33-4062032 |
|
|
|
|
Branch Offices: |
Also Located At:
|
|
|
|
|
Company Depots : |
Located at:
|
|
|
|
|
Marketing Office Overseas : |
Located At:
|
DIRECTORS
AS ON 31.03.2017
|
Name : |
Mr. Anil Gupta |
|
Designation : |
Managing Director |
|
Address : |
A-7, Puspanjali Farm Bijwasan, South West, Delhi – 110061, India |
|
Date of Birth/Age : |
24.05.1959 |
|
Date of Appointment : |
31.12.1992 |
|
DIN No.: |
00006422 |
|
|
|
|
Name : |
Mr. Vijay Bhushan |
|
Designation : |
Director |
|
Address : |
B - 5 Swasthya Vihar, Delhi – 110092, India |
|
Date of Appointment : |
02.08.1994 |
|
DIN No.: |
00002421 |
|
|
|
|
Name : |
Mrs. Archana Gupta |
|
Designation : |
Director |
|
Address : |
A-7, Puspanjali Farm Bijwasan, South West, Delhi – 110061, India |
|
Date of Birth/Age : |
23.07.1961 |
|
Date of Appointment : |
31.01.2005 |
|
DIN No.: |
00006459 |
|
|
|
|
Name : |
Mr. Vikram Bhartia |
|
Designation : |
Director |
|
Address : |
H-27/222-D, Sainik Farms, New Delhi – 110062, India |
|
Date of Appointment : |
02.08.1994 |
|
DIN No.: |
00013654 |
|
|
|
|
Name : |
Mr. Kishan Gopal Somani |
|
Designation : |
Director |
|
Address : |
163, Tagore Park, New Delhi – 110009, India |
|
Date of Appointment : |
02.08.1994 |
|
DIN No.: |
00014648 |
|
|
|
|
Name : |
Mr. Pawan Bholusaria |
|
Designation : |
Director |
|
Address : |
26/11 Shakti Nagar, New Delhi – 110007, India |
|
Date of Appointment : |
23.07.1993 |
|
DIN No.: |
00092492 |
|
|
|
|
Name : |
Mr. Rajeev Gupta |
|
Designation : |
Director |
|
Address : |
D-269, Anand Vihar, Delhi – 110092, India |
|
Date of Birth/Age : |
52 Years |
|
Date of Appointment : |
01.06.2015 |
|
PAN No : |
AEHPG4730Q |
|
DIN No.: |
00128865 |
|
|
|
|
Name : |
Mr. Akshit Diviaj Gupta |
|
Designation : |
Director |
|
Address : |
A-7, Puspanjali Farm Bijwasan, South West, Delhi – 110061, India |
|
Date of Appointment : |
10.05.2017 |
|
DIN No.: |
07814690 |
KEY EXECUTIVES
|
Name : |
Mr. Rajeev Gupta |
|
Designation : |
Chief Financial Officer |
|
Address : |
D-269, Anand Vihar, Delhi – 110092, India |
|
Date of Appointment : |
01.10.2014 |
|
PAN No.: |
AEHPG4730Q |
|
Name : |
Mr. Kishore Kunal |
|
Designation : |
Company Secretary and Compliance Officer |
|
Address : |
172C Pocket F Mayur, Vihar, New Delhi - 110092, India |
|
Date of Appointment : |
31.01.2005 |
|
PAN No.: |
AOSPK2270C |
|
|
|
|
Key Management
Personnel: |
|
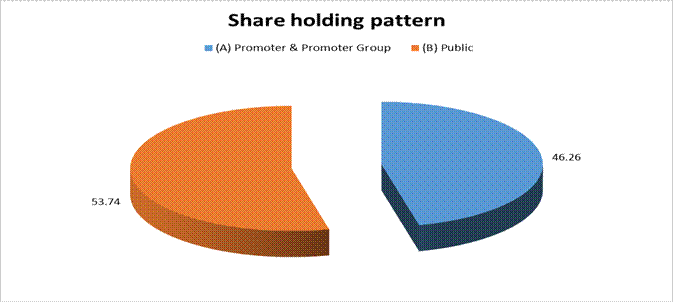
SHAREHOLDING PATTERN
AS ON September 2017
|
Category of shareholder |
Total nos. shares held |
Shareholding as a % of total no. of
shares (calculated as per SCRR 1957) As a % |
|
|
(A) Promoter & Promoter Group |
36248466 |
46.26 |
|
|
(B) Public |
42112972 |
53.74 |
|
|
Grand Total |
78361438 |
100.00 |
STATEMENT SHOWING SHAREHOLDING PATTERN OF THE PROMOTER AND PROMOTER
GROUP
|
Category of shareholder |
Total Nos. shares held |
Shareholding as a % of total no. of shares (calculated as per SCRR
1957) As a % |
|
|
A1) Indian |
|
||
|
Individuals/Hindu undivided Family |
19168466 |
24.46 |
|
|
Anil Gupta HUF |
4650375 |
5.93 |
|
|
Archana Gupta |
837315 |
1.07 |
|
|
Anil Gupta |
13680776 |
17.46 |
|
|
Any Other (specify) |
17080000 |
21.80 |
|
|
KEI Cables Private Limited |
1575000 |
2.01 |
|
|
Projection Financial and Management Consultants Private Limited |
7900000 |
10.08 |
|
|
Dhan Versha Agency Private
Limited |
1000000 |
1.28 |
|
|
Shubh Laxmi Motels and
Inns Private Limited |
3480000 |
4.44 |
|
|
Soubhagya Agency Private
Limited |
3125000 |
3.99 |
|
|
Sub Total A1 |
36248466 |
46.26 |
|
|
A2) Foreign |
0.00 |
||
|
A=A1+A2 |
36248466 |
46.26 |
STATEMENT SHOWING SHAREHOLDING
PATTERN OF THE PUBLIC SHAREHOLDER
|
egory & Name of
the Shareholders |
Total no. shares
held |
Shareholding %
calculated as per SCRR 1957 As a % |
|
|
B1) Institutions |
|
||
|
Mutual Funds/ |
10551075 |
13.46 |
|
|
Sundaram Mutual Fund A/C
Sundaram Infrastruct |
863011 |
1.10 |
|
|
Franklin Templeton Mutual
Fund A/C Franklin India High Growth Companies Fund |
4500000 |
5.74 |
|
|
Alternate Investment
Funds |
125000 |
0.16 |
|
|
Foreign Portfolio
Investors |
4342005 |
5.54 |
|
|
HSBC Global Investment
Funds-Asia Ex Japan Equity Smaller Companies |
1023951 |
1.31 |
|
|
Financial Institutions/
Banks |
157143 |
0.20 |
|
|
Sub Total B1 |
15175223 |
19.37 |
|
|
B2) Central Government/
State Government(s)/ President of India |
0.00 |
||
|
B3) Non-Institutions |
0.00 |
||
|
Individual share capital
upto INR 0.200 Million |
12506981 |
15.96 |
|
|
Individual share capital
in excess of INR 0.200 Million |
9062330 |
11.56 |
|
|
Ajay Upadyaya |
1000000 |
1.28 |
|
|
Ashish Kacholia |
2462608 |
3.14 |
|
|
Ashish Agarwal |
1327312 |
1.69 |
|
|
Madhulika Agarwal |
1137484 |
1.45 |
|
|
NBFCs registered with RBI |
740432 |
0.94 |
|
|
Any Other (specify) |
4628006 |
5.91 |
|
|
Bodies Corporate |
3072797 |
3.92 |
|
|
NRI/OCB |
743135 |
0.95 |
|
|
Clearing Members |
552864 |
0.71 |
|
|
Trusts |
500 |
0.00 |
|
|
Director or Director's
Relatives |
258710 |
0.33 |
|
|
Sub Total B3 |
26937749 |
34.38 |
|
|
B=B1+B2+B3 |
42112972 |
53.74 |
BUSINESS DETAILS
|
Line of Business : |
Subject is engaged in the manufacture of a range of world-class wires (stainless steel wire) and cables (cables comprising of EHV, HT and LT power cables, control and instrumentation cables, winding wires and flexible and house wires) and also engaged into Turnkey projects etc. [Registered Activity] |
||||||||
|
|
|
||||||||
|
Products / Services
: |
|
||||||||
|
|
|
||||||||
|
Brand Names : |
Not Available |
||||||||
|
|
|
||||||||
|
Agencies Held : |
Not Available |
||||||||
|
|
|
||||||||
|
Exports : |
Not Divulged |
||||||||
|
|
|
||||||||
|
Imports : |
Not Divulged |
||||||||
|
|
|
||||||||
|
Terms : |
Not Divulged |
PRODUCTION STATUS – (NOT AVAILABLE)
GENERAL INFORMATION
|
Suppliers : |
|
|||||||||||||||||||||||||||||||||
|
|
|
|||||||||||||||||||||||||||||||||
|
Customers : |
|
|||||||||||||||||||||||||||||||||
|
|
|
|||||||||||||||||||||||||||||||||
|
No. of Employees : |
1184 (Approximately) |
|||||||||||||||||||||||||||||||||
|
|
|
|||||||||||||||||||||||||||||||||
|
Bankers : |
· Punjab National Bank · Dena Bank · State Bank of India · State Bank of Hyderabad · Kotak Mahindra Bank Limited · ICICI Bank Limited · State Bank of Patiala · State Bank of Bikaner and Jaipur · Indian Overseas Bank · Corporation Bank · IDBI Bank Limited · Bank of India · DCB Bank Limited · The Lakshmi Vilas Bank Limited · United Bank of India ·
Standard Chartered Bank ·
Axis Bank Limited, 2nd Floor, Red Fort
Capital, Parsvnath Towers, Gole Market, Bhai Veer Singh Marg, New Delhi –
110001, India |
|||||||||||||||||||||||||||||||||
|
|
|
|||||||||||||||||||||||||||||||||
|
Facilities : |
|
|
Auditors : |
|
|
Name : |
Jagdish Chand and Company Chartered Accountants |
|
Address : |
H 20, LGF, Green Park (Main), New Delhi-110016, India |
|
Tel. No.: |
91-11-26511953/ 26533626/ 41759467 |
|
Fax No.: |
91-11-26533626 |
|
E-Mail : |
|
|
|
|
|
Memberships : |
Not Available |
|
|
|
|
Collaborators : |
Not Available |
|
|
|
|
Subsidiary Company: |
KEI Cables Australia PTY
Limited (w.e.f. 14.12.2015) |
|
|
|
|
Jointly controlled entity: |
Joint Venture KEI
Industries Limited, New Delhi and Brugg Kabel A.G. Switzerland, (Association of
Persons) |
|
|
|
|
Other related
parties in the group where common control exists: |
|
|
|
|
|
Enterprises Over
which person mentioned in (v) above are able to exercise significant control
and transactions have
taken place : |
|
CAPITAL STRUCTURE
AFTER 19.07.2017
Authorised Capital :
|
No. of Shares |
Type |
Value |
Amount |
|
|
|
|
|
|
110000000 |
Equity Shares |
INR 2/- each |
INR 220.000 Million |
|
300000 |
Preference Shares |
INR 100/- each |
INR 30.000 Million |
|
|
Total |
|
INR 250.000
Million |
Issued, Subscribed & Paid-up Capital :
|
No. of Shares |
Type |
Value |
Amount |
|
|
|
|
|
|
78361438 |
Equity Shares |
INR 02/- each |
INR 156.723
Million |
|
|
|
|
|
AS ON 31.03.2017
Authorised Capital :
|
No. of Shares |
Type |
Value |
Amount |
|
|
|
|
|
|
110000000 |
Equity Shares |
INR 2/- each |
INR 220.000 Million |
|
300000 |
Preference Shares |
INR 100/- each |
INR 30.000 Million |
|
|
Total |
|
INR 250.000
Million |
Issued, Subscribed & Paid-up Capital :
|
No. of Shares |
Type |
Value |
Amount |
|
|
|
|
|
|
77797438 |
Equity Shares |
INR 02/- each |
INR 155.590
Million |
|
|
|
|
|
Rights, preferences
and restrictions attached to shares:
Equity Shares: The company has issued one class of equity shares having face value of INR 2 per share. Each shareholder is eligible for one vote per share held. The dividend proposed by the Board of Directors is subject to the approval of the shareholders in the ensuing Annual General Meeting, except in case of interim dividend. In the event of liquidation, the equity shareholders are eligible to receive the remaining assets of the Company after distribution of all preferential amounts, in proportion to their shareholding.
Reconciliation of Number of
Equity Shares:
|
Particulars |
|
As at 31st March, 2017 |
|
|
|
|
Nos. |
(INR in Millions) |
|
Balance as at the beginning of the year |
|
77237438 |
154.470 |
|
Add: Issued during the Year |
|
560000 |
1.120 |
|
Balance as at the end of the year |
|
77797438 |
155.590 |
During the year 560000
(Previous Year NIL) Equity Shares of face value INR 2/- each were issued to
eligible employees of the Company under KEI Employees Stock Option Scheme-2015,
at an exercise price of INR 35/- per equity share.
List of Equity Shareholders holding more than 5% of the aggregate Equity
Shares:
|
Name of Shareholder |
|
As at 31st March, 2017 |
|
|
|
|
Nos. |
% age |
|
Mr. Anil Gupta |
|
13680776 |
17.59% |
|
M/s Anil Gupta HUF
beneficiary Mr. Anil Gupta |
|
4650375 |
5.98% |
|
M/s Projection
Financial and Management |
|
7900000 |
10.15% |
|
Consultants Private
Limited |
|
|
|
|
IDFC Sterling
Equity Fund |
|
1512244 |
1.94% |
|
Franklin Templeton Mutual
Fund A/c Franklin |
|
4500000 |
5.78% |
|
India High Growth
Companies Fund |
|
|
|
Shares reserved for issue
under KEI Employees Stock Option Scheme, 2015:
During the year, Share Allotment Committee of the Board has issued and allotted
560000 (Previous Year NIL) Equity Shares of face value of INR 2/- each to eligible
employees at an exercise Price of INR 35/- per share, out of total 2252000 Options granted under KEI Employees
Stock Option Scheme 2015. Accordingly 1692000 Equity shares (Previous Year
2252000) of INR 2/- each are reserved for the issue under KEI Employees Stock Option
Scheme 2015
FINANCIAL DATA
[all figures are
INR Million]
ABRIDGED
BALANCE SHEET [STANDALONE]
|
SOURCES OF FUNDS |
31.03.2017 |
31.03.2016 |
31.03.2015 |
|
|
|
|
|
|
I.
EQUITY AND LIABILITIES |
|
|
|
|
(1)Shareholders' Funds |
|
|
|
|
(a) Share Capital |
155.590 |
154.470 |
154.470 |
|
(b) Reserves &
Surplus |
4578.960 |
3511.770 |
2884.030 |
|
(c) Money received
against share warrants |
0.000 |
0.000 |
0.000 |
|
|
|
|
|
|
(2) Share Application
money pending allotment |
0.000 |
0.000 |
0.000 |
|
Total Shareholders’ Funds
(1) + (2) |
4734.550 |
3666.240 |
3038.500 |
|
|
|
|
|
|
(3) Non-Current
Liabilities |
|
|
|
|
(a) long-term borrowings |
1641.290 |
1881.490 |
1208.950 |
|
(b) Deferred tax
liabilities (Net) |
427.200 |
362.440 |
235.360 |
|
(c) Other long term
liabilities |
0.000 |
0.000 |
0.000 |
|
(d) long-term provisions |
50.620 |
40.020 |
31.970 |
|
Total Non-current
Liabilities (3) |
2119.110 |
2283.950 |
1476.280 |
|
|
|
|
|
|
(4) Current Liabilities |
|
|
|
|
(a) Short term borrowings |
4898.300 |
2489.950 |
2549.200 |
|
(b) Trade payables |
4805.210 |
4321.670 |
4809.920 |
|
(c) Other current
liabilities |
1499.930 |
1756.690 |
1453.460 |
|
(d) Short-term provisions |
52.660 |
110.780 |
90.010 |
|
Total Current Liabilities
(4) |
11256.100 |
8679.090 |
8902.590 |
|
|
|
|
|
|
TOTAL |
18109.760 |
14629.280 |
13417.370 |
|
|
|
|
|
|
II.
ASSETS |
|
|
|
|
(1) Non-current assets |
|
|
|
|
(a) Fixed Assets |
|
|
|
|
(i) Tangible assets |
4026.870 |
3262.200 |
2971.190 |
|
(ii) Intangible Assets |
27.260 |
17.170 |
9.640 |
|
(iii) Capital
work-in-progress |
31.540 |
293.360 |
43.890 |
|
(iv) Intangible assets
under development |
0.000 |
0.000 |
0.000 |
|
(b) Non-current
Investments |
31.120 |
31.120 |
31.360 |
|
(c) Deferred tax assets
(net) |
0.000 |
0.000 |
0.000 |
|
(d) Long-term Loan and Advances |
47.650 |
222.210 |
48.590 |
|
(e) Other Non-current
assets |
0.000 |
0.000 |
0.000 |
|
Total Non-Current Assets |
4164.440 |
3826.060 |
3104.670 |
|
|
|
|
|
|
(2) Current assets |
|
|
|
|
(a) Current investments |
0.000 |
0.000 |
0.000 |
|
(b) Inventories |
4989.240 |
4224.680 |
4403.170 |
|
(c) Trade receivables |
7392.350 |
5673.900 |
4798.410 |
|
(d) Cash and cash
equivalents |
369.710 |
57.670 |
46.870 |
|
(e) Short-term loans and
advances |
897.460 |
565.580 |
665.050 |
|
(f) Other current assets |
296.560 |
281.390 |
399.020 |
|
Total Current Assets |
13945.320 |
10803.220 |
10312.700 |
|
|
|
|
|
|
TOTAL |
18109.760 |
14629.280 |
13417.370 |
PROFIT
& LOSS ACCOUNT [STANDALONE]
|
|
PARTICULARS |
31.03.2017 |
31.03.2016 |
31.03.2015 |
|
|
SALES |
|
|
|
|
|
Income |
26690.930 |
23255.800 |
20309.520 |
|
|
Other Income |
104.060 |
53.480 |
23.830 |
|
|
TOTAL |
26794.990 |
23309.280 |
20333.350 |
|
|
|
|
|
|
|
Less |
EXPENSES |
|
|
|
|
|
Cost of Materials
Consumed |
18686.700 |
15682.120 |
15133.320 |
|
|
Purchases of
Stock-in-Trade |
15.960 |
9.800 |
30.960 |
|
|
Changes in inventories of
finished goods, work-in-progress and Stock-in-Trade |
(426.760) |
455.340 |
(394.730) |
|
|
Employees benefits
expense |
1109.490 |
828.370 |
620.650 |
|
|
Sub-Contractor expense
for turnkey projects |
579.290 |
595.540 |
419.060 |
|
|
Exceptional Item- Keyman
Insurance on |
0.000 |
0.000 |
(26.090) |
|
|
Other expenses |
3982.890 |
3262.07 |
2571.55 |
|
|
TOTAL |
23947.570 |
20833.240 |
18354.720 |
|
|
|
|
|
|
|
|
PROFIT/ (LOSS) BEFORE INTEREST, TAX, DEPRECIATION AND AMORTISATION
|
2847.420 |
2476.040 |
1978.630 |
|
|
|
|
|
|
|
Less |
FINANCIAL EXPENSES |
1229.250 |
1269.740 |
1203.980 |
|
|
|
|
|
|
|
|
PROFIT / (LOSS) BEFORE
TAX, DEPRECIATION AND AMORTISATION |
1618.170 |
1206.300 |
774.650 |
|
|
|
|
|
|
|
Less |
DEPRECIATION/
AMORTISATION |
280.440 |
252.860 |
245.850 |
|
|
|
|
|
|
|
|
PROFIT/ (LOSS) BEFORE TAX |
1337.730 |
953.440 |
528.800 |
|
|
|
|
|
|
|
Less |
TAX |
351.380 |
331.420 |
186.300 |
|
|
|
|
|
|
|
|
PROFIT/ (LOSS) AFTER TAX
|
986.350 |
622.020 |
342.500 |
|
|
|
|
|
|
|
|
PREVIOUS YEARS’ BALANCE
BROUGHT FORWARD |
2704.100 |
2128.560 |
1823.240 |
|
|
|
|
|
|
|
Less |
APPROPRIATIONS |
|
|
|
|
|
Proposed Dividend on Equity
Shares |
0.000 |
38.620 |
30.890 |
|
|
Dividend Distribution Tax on
Proposed Dividend |
0.000 |
7.860 |
6.290 |
|
|
Balance Carried to the
B/S |
3690.450 |
2704.100 |
2128.560 |
|
|
|
|
|
|
|
|
EARNINGS IN FOREIGN CURRENCY |
|
|
|
|
|
Sales (Exports) |
3749.640 |
1909.800 |
1495.050 |
|
|
Income from Turnkey Projects |
43.550 |
0.000 |
0.000 |
|
|
TOTAL EARNINGS |
3793.190 |
1909.800 |
1495.050 |
|
|
|
|
|
|
|
|
IMPORTS |
|
|
|
|
|
Raw Materials |
4854.670 |
2186.280 |
1151.320 |
|
|
Packing Materials |
18.650 |
6.520 |
5.010 |
|
|
Project Materials |
117.000 |
55.720 |
4.500 |
|
|
Traded Goods |
0.000 |
0.000 |
6.320 |
|
|
Stores, Spares and Consumables |
9.670 |
42.980 |
8.260 |
|
|
Capital Goods |
329.350 |
99.240 |
6.730 |
|
|
TOTAL IMPORTS |
5329.340 |
2390.740 |
1182.140 |
|
|
|
|
|
|
|
|
Earnings / (Loss) Per
Share (INR) |
|
|
|
|
|
Basic |
12.72 |
8.05 |
4.46 |
|
Diluted |
12.41 |
7.93 |
4.43 |
CURRENT MATURITIES
OF LONG TERM DEBT DETAILS
|
Particulars |
31.03.2017 |
31.03.2016 |
31.03.2015 |
|
Current Maturities of Long term debt |
|
|
|
|
From Banks |
200.000 |
236.050 |
574.990 |
|
Foreign Currency Loans from Banks |
0.000 |
124.890 |
156.900 |
|
From Others (Non-Banking Financial Company) |
378.750 |
240.000 |
30.000 |
|
Total |
578.750 |
600.940 |
761.890 |
|
Cash generated from operations |
342.53 |
2047.770 |
2071.170 |
|
Net cash flow from (used in) operations |
38.310 |
1851.660 |
1978.740 |
QUARTERLY
RESULTS
|
PARTICULARS |
|
30.06.2017 1st
Quarter |
30.09.2017 2nd
Quarter |
|
Unaudited |
|
|
|
|
Net Sales |
|
8235.380 |
7538.050 |
|
Total Expenditure |
|
7467.370 |
6775.530 |
|
PBIDT (Excl OI) |
|
768.010 |
762.520 |
|
Other Income |
|
15.590 |
10.290 |
|
Operating Profit |
|
783.600 |
772.810 |
|
Interest |
|
299.490 |
273.800 |
|
Exceptional Items |
|
0.000 |
NA |
|
PBDT |
|
484.110 |
499.010 |
|
Depreciation |
|
79.810 |
80.650 |
|
Profit Before Tax |
|
404.300 |
418.360 |
|
Tax |
|
129.570 |
133.340 |
|
Provisions and contingencies |
|
NA |
NA |
|
Profit After Tax |
|
274.730 |
285.020 |
|
Extraordinary Items |
|
NA |
NA |
|
Prior Period Expenses |
|
NA |
NA |
|
Other Adjustments |
|
NA |
NA |
|
Net Profit |
|
274.730 |
285.020 |
KEY
RATIOS
EFFICIENCY RATIOS
|
PARTICULARS |
31.03.2017 |
31.03.2016 |
31.03.2015 |
|
Average Collection Days (Sundry Debtors /Income * 365 Days) |
101.09 |
89.05 |
86.24 |
|
|
|
|
|
|
Account Receivables Turnover (Income / Sundry
Debtors) |
3.61 |
4.10 |
4.23 |
|
|
|
|
|
|
Average Payment Days (Sundry Creditors
/ Purchases * 365 Days) |
93.78 |
100.52 |
115.77 |
|
|
|
|
|
|
Inventory Turnover (Operating Income
/ Inventories) |
0.57 |
0.59 |
0.45 |
|
|
|
|
|
|
Asset Turnover (Operating Income
/ Net Fixed Assets) |
0.70 |
0.69 |
0.65 |
LEVERAGE RATIOS
|
PARTICULARS |
31.03.2017 |
31.03.2016 |
31.03.2015 |
|
Debt Ratio ((Borrowing + Current Liabilities) / Total
Assets) |
0.74 |
0.76 |
0.81 |
|
|
|
|
|
|
Debt Equity Ratio (Total Liability
/ Networth) |
1.50 |
1.36 |
1.49 |
|
|
|
|
|
|
Current Liabilities to Networth (Current
Liabilities / Net Worth) |
2.38 |
2.37 |
2.93 |
|
|
|
|
|
|
Fixed Assets to Networth (Net Fixed Assets
/ Networth) |
0.86 |
0.97 |
1.00 |
|
|
|
|
|
|
Interest Coverage Ratio (PBIT / Financial
Charges) |
2.32 |
1.95 |
1.64 |
PROFITABILITY RATIOS
|
PARTICULARS |
|
31.03.2017 |
31.03.2016 |
31.03.2015 |
|
PAT to Sales [(PAT/Sales) * 100) |
% |
3.70 |
2.67 |
1.69 |
|
|
|
|
|
|
|
Return on Total Assets ((PAT / Total
Assets) * 100) |
% |
5.45 |
4.25 |
2.55 |
|
|
|
|
|
|
|
Return on Investment (ROI) ((PAT / Networth)
* 100) |
% |
20.83 |
16.97 |
11.27 |
SOLVENCY RATIOS
|
PARTICULARS |
31.03.2017 |
31.03.2016 |
31.03.2015 |
|
Current Ratio (Current Assets / Current Liabilities) |
1.24 |
1.24 |
1.16 |
|
|
|
|
|
|
Quick Ratio ((Current Assets –
Inventories) / Current Liabilities) |
0.80 |
0.76 |
0.66 |
|
|
|
|
|
|
G-Score Ratio Financial (Networth / Total
Assets) |
0.26 |
0.25 |
0.23 |
|
|
|
|
|
|
G-Score Ratio Debt (Debts / Equity
Capital) |
45.75 |
32.19 |
29.26 |
|
|
|
|
|
|
G-Score Ratio Liquidity (Total Current
Assets / Total Current Liabilities) |
1.24 |
1.24 |
1.16 |
Total Liability = Short-term Debt + Long-term
Debt + Current Maturities of Long-term debts
STOCK
PRICES
|
Face Value |
INR 02.00/- |
|
Market Value |
INR 376.75/- |
FINANCIAL ANALYSIS
[all figures are
INR Million]
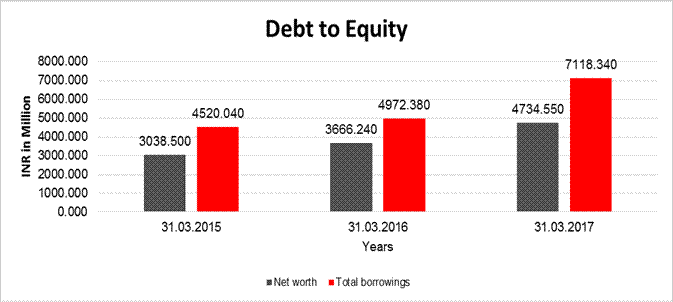
DEBT EQUITY RATIO
|
Particular |
31.03.2015 |
31.03.2016 |
31.03.2017 |
|
|
INR
In Million |
INR
In Million |
INR
In Million |
|
Share Capital |
154.470 |
154.470 |
155.590 |
|
Reserves & Surplus |
2884.030 |
3511.770 |
4578.960 |
|
Net
worth |
3038.500 |
3666.240 |
4734.550 |
|
|
|
|
|
|
Long Term borrowings |
1208.950 |
1881.490 |
1641.290 |
|
Short Term borrowings |
2549.200 |
2489.950 |
4898.300 |
|
Current Maturities of Long term debt |
761.890 |
600.940 |
578.750 |
|
Total
borrowings |
4520.040 |
4972.380 |
7118.340 |
|
Debt/Equity
ratio |
1.488 |
1.356 |
1.503 |
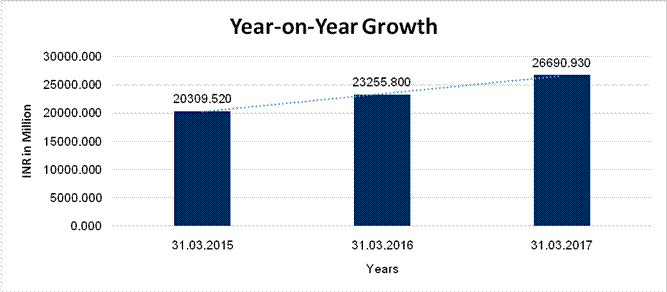
YEAR-ON-YEAR GROWTH
|
Year
on Year Growth |
31.03.2015 |
31.03.2016 |
31.03.2017 |
|
|
INR
In Million |
INR
In Million |
INR
In Million |
|
Sales
|
20309.520 |
23255.800 |
26690.930 |
|
|
|
14.507 |
14.771 |
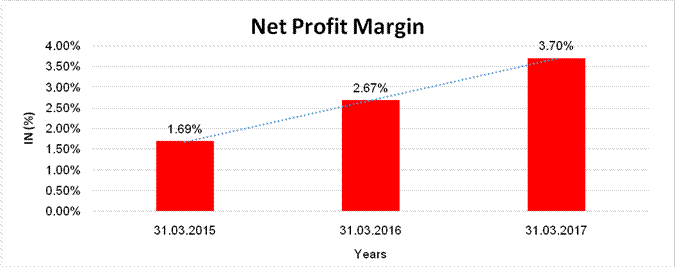
NET PROFIT MARGIN
|
Net
Profit Margin |
31.03.2015 |
31.03.2016 |
31.03.2017 |
|
|
INR
In Million |
INR
In Million |
INR
In Million |
|
Sales
|
20309.520 |
23255.800 |
26690.930 |
|
Profit |
342.500 |
622.020 |
986.350 |
|
|
1.69% |
2.67% |
3.70% |
ABRIDGED
BALANCE SHEET [CONSOLIDATED]
|
SOURCES OF FUNDS |
31.03.2017 |
31.03.2016 |
|
|
|
|
|
I.
EQUITY AND LIABILITIES |
|
|
|
(1)Shareholders' Funds |
|
|
|
(a) Share Capital |
155.590 |
154.470 |
|
(b) Reserves &
Surplus |
4579.120 |
3515.250 |
|
(c) Money received
against share warrants |
0.000 |
0.000 |
|
|
|
|
|
(2) Share Application
money pending allotment |
0.000 |
0.000 |
|
Total Shareholders’ Funds
(1) + (2) |
4734.710 |
3669.720 |
|
|
|
|
|
(3) Non-Current
Liabilities |
|
|
|
(a) long-term borrowings |
1641.290 |
1881.490 |
|
(b) Deferred tax
liabilities (Net) |
427.200 |
362.440 |
|
(c) Other long term
liabilities |
50.620 |
40.020 |
|
(d) long-term provisions |
0.000 |
0.000 |
|
Total Non-current
Liabilities (3) |
2119.110 |
2283.950 |
|
|
|
|
|
(4) Current Liabilities |
|
|
|
(a) Short term borrowings |
4898.300 |
2489.950 |
|
(b) Trade payables |
4813.480 |
4336.530 |
|
(c) Other current
liabilities |
1500.520 |
1758.570 |
|
(d) Short-term provisions |
51.470 |
101.010 |
|
Total Current Liabilities
(4) |
11263.770 |
8686.060 |
|
|
|
|
|
TOTAL |
18117.590 |
14639.730 |
|
|
|
|
|
II.
ASSETS |
|
|
|
(1) Non-current assets |
|
|
|
(a) Fixed Assets |
|
|
|
(i) Tangible assets |
4025.370 |
3264.710 |
|
(ii) Intangible Assets |
27.260 |
17.170 |
|
(iii) Capital
work-in-progress |
31.540 |
293.360 |
|
(iv) Intangible assets
under development |
0.000 |
0.000 |
|
(b) Non-current
Investments |
31.120 |
31.120 |
|
(c) Deferred tax assets
(net) |
0.000 |
0.000 |
|
(d) Long-term Loan and Advances |
47.650 |
222.210 |
|
(e) Other Non-current
assets |
0.000 |
0.000 |
|
Total Non-Current Assets |
4162.940 |
3828.570 |
|
|
|
|
|
(2) Current assets |
|
|
|
(a) Current investments |
0.000 |
0.000 |
|
(b) Inventories |
4989.240 |
4225.480 |
|
(c) Trade receivables |
7392.350 |
5681.420 |
|
(d) Cash and cash
equivalents |
377.120 |
58.390 |
|
(e) Short-term loans and
advances |
899.380 |
564.240 |
|
(f) Other current assets |
296.560 |
281.630 |
|
Total Current Assets |
13954.650 |
10811.160 |
|
|
|
|
|
TOTAL |
18117.590 |
14639.730 |
PROFIT
& LOSS ACCOUNT [CONSOLIDATED]
|
|
PARTICULARS |
31.03.2017 |
31.03.2016 |
|
|
SALES |
|
|
|
|
Income |
26705.900 |
23510.240 |
|
|
Other Income |
104.820 |
57.520 |
|
|
TOTAL |
26810.720 |
23567.760 |
|
|
|
|
|
|
Less |
EXPENSES |
|
|
|
|
Cost of Materials Consumed |
18697.860 |
15839.210 |
|
|
Purchases of Stock-in-Trade |
15.960 |
9.800 |
|
|
Changes in inventories of
finished goods, work-in-progress and Stock-in-Trade |
(426.760) |
455.340 |
|
|
Employees benefits expense |
1109.490 |
828.370 |
|
|
Sub-Contractor expense for turnkey projects |
580.010 |
638.770 |
|
|
Other expenses |
3988.730 |
3312.920 |
|
|
TOTAL |
23965.290 |
21084.410 |
|
|
|
|
|
|
|
PROFIT/ (LOSS) BEFORE INTEREST, TAX, DEPRECIATION AND
AMORTISATION |
2845.430 |
2483.350 |
|
|
|
|
|
|
Less |
FINANCIAL EXPENSES |
1229.320 |
1271.560 |
|
|
|
|
|
|
|
PROFIT / (LOSS) BEFORE TAX,
DEPRECIATION AND AMORTISATION |
1616.110 |
1211.790 |
|
|
|
|
|
|
Less |
DEPRECIATION/ AMORTISATION |
280.440 |
253.300 |
|
|
|
|
|
|
|
PROFIT/ (LOSS) BEFORE TAX |
1335.670 |
958.490 |
|
|
|
|
|
|
Less |
TAX |
352.650 |
332.990 |
|
|
|
|
|
|
|
PROFIT/ (LOSS) AFTER TAX
|
983.020 |
625.500 |
|
|
|
|
|
|
|
Earnings / (Loss) Per Share
(INR) |
|
|
|
|
Basic |
12.68 |
8.10 |
|
Diluted |
12.37 |
7.98 |
LOCAL AGENCY FURTHER INFORMATION
|
Sr. No. |
Check list by
info agents |
Available in
Report (Yes/No) |
|
1 |
Year of establishment |
Yes |
|
2 |
Constitution of the entity -Incorporation
details |
Yes |
|
3 |
Locality of the entity |
Yes |
|
4 |
Premises details |
No |
|
5 |
Buyer visit details |
-- |
|
6 |
Contact numbers |
Yes |
|
7 |
Name of the person contacted |
Yes |
|
8 |
Designation of contact person |
Yes |
|
9 |
Promoter’s background |
Yes |
|
10 |
Date of Birth of Proprietor / Partners /
Directors |
Yes |
|
11 |
Pan Card No. of Proprietor / Partners |
Yes |
|
12 |
Voter Id Card No. of Proprietor / Partners |
No |
|
13 |
Type of business |
Yes |
|
14 |
Line of Business |
Yes |
|
15 |
Export/import details (if applicable) |
No |
|
16 |
No. of employees |
Yes |
|
17 |
Details of sister concerns |
Yes |
|
18 |
Major suppliers |
No |
|
19 |
Major customers |
No |
|
20 |
Banking Details |
Yes |
|
21 |
Banking facility details |
Yes |
|
22 |
Conduct of the banking account |
-- |
|
23 |
Financials, if provided |
Yes |
|
24 |
Capital in the business |
Yes |
|
25 |
Last accounts filed at ROC, if applicable |
Yes |
|
26 |
Turnover of firm for last three years |
Yes |
|
27 |
Reasons for variation <> 20% |
-- |
|
28 |
Estimation for coming financial year |
No |
|
29 |
Profitability for last three years |
Yes |
|
30 |
Major shareholders, if available |
Yes |
|
31 |
External Agency Rating, if available |
Yes |
|
32 |
Litigations that the firm/promoter
involved in |
-- |
|
33 |
Market information |
-- |
|
34 |
Payments terms |
No |
|
35 |
Negative Reporting by Auditors in the
Annual Report |
No |
MANAGEMENT DISCUSSION
AND ANALYSIS
COMPANY OVERVIEW
Subject is a leading Indian
manufacturer and supplier of power and other industrial cables. KEI is known
for its unique product range with its portfolio of over 400 products backed by
a widespread distribution network. The Company has strong brand equity and a
robust business model that has continuously steered its growth over the years.
It is one of the most trusted brands providing wiring solutions to both retail
and institutional clients spread across the country. Through various operating
excellence drives, KEI has substantially enhanced the value of its core
offerings and is well positioned to tap the upcoming growth opportunities.
The Company is into three
business divisions namely Cables, Stainless Steel Wires and Turnkey Projects.
It offers wiring solutions and turnkey services to reputed private and public
sector clients viz. Companies engaged in the power sector, oil refineries,
railways, automobile manufacturers, cement manufacturers, steel, fertilizers,
textile and real estate. It’s products find applications in the domestic and
overseas markets making it one of the top three cable manufacturing companies
in India.
In the Cable division, the
Company has a wide mix of products, ranging from Extra High Voltage (EHV), High
Tension and Low Tension (HT & LT), Control and Instrumentation Cables,
Specialty Cables, Rubber Cables, Flexible and House Wires to Submersible
Cables. It also offers many niche products like fire survival cables, zero
halogen cables and braided cables.
The Company had entered in
EHV cables business in 2010, with a technical collaboration with Switzerland
based BruggKabel AG for producing EHV cables (ranging from 66kV to 400kV) at
its Chopanki (Rajasthan) facility. It has other state-ofthe- art manufacturing
facilities located at Bhiwadi, Chopanki, and Silvassa.
Through its Stainless Steel
Wire Division, it manufactures a distinctive range of specialty wires, which
are used for critical applications across different industries.
The Company had entered
into Engineering, Procurement and Construction (EPC) business in 2008 unfolding
another area for growth.
In this segment, it
proffers extensive turnkey solutions including design, engineering, material
procurement, field services, construction and project management services. The
offerings include execution of power transmission projects (of 66kV to 400kV
sub-stations) on a turnkey basis, EPC of EHV and HV cable systems, electrical
balance of- plant for power plants and industrial electrical projects.
ECONOMIC REVIEW :
World Economy:
Global economic activity is
picking up with a long awaited cyclical recovery in investment, manufacturing,
and trade. Economic activity gained some momentum in the second half of 2016,
especially in advanced economies. Growth picked up in the United States as
firms grew more confident about future demand, and inventories started
contributing positively to growth after five quarters of a drag. Growth also
remained solid in the United Kingdom, where spending proved resilient in the
aftermath of the June 2016 referendum in favour of leaving the European Union
(Brexit).
World growth is projected
to increase to 3.5% in CY 2017 and 3.6% in CY 2018. Together with amodest
change in the forecast for the overall global growth rate, projections of the
strength of economic activity across country groups have also shifted. Economic
activity in advanced economies is forecasted to grow by 2% in CY 2017 and at
the same rate in CY 2018. The stronger outlook in advanced economies reflects a
projected cyclical recovery in global manufacturing.
Economic performance across
emerging market and developing economies has remained mixed. China’s growth
remained strong, reflecting continued policy support, whereas, India witnessed
a slowdown in activities owing to the impact of the currency exchange
initiative. Emerging market and developing economies is forecast to grow by
about 4.5% and 4.8%,
respectively, in 2017 and 2018. This reflects a stabilisation or recovery in a
number of commodity exporters, some of which underwent painful adjustments
following the drop in commodity prices, and strengthening growth in India,
partially offset by a gradual slowdown of the Chinese economy.
Stronger activity and
expectations of more robust global demand, coupled with agreed restrictions on
oil supply, have helped commodity prices recover from their troughs in early
2016. Oil prices increased by almost 20% between August 2016 and February 2017,
in part due to the agreement by the OPEC and other producers to cut oil
production. (Source: World economic outlook Report dated April 2017)
Indian Economy:
By passing the risk of
slowdown due to demonetisation, the Indian economy is estimated to have grown at
7.1% in FY17 according to the CSO. However, this growth rate would still be
lower compared with the impressive 7.9% growth recorded in FY16. The GDP growth
of FY17 is expected to be supported by the agricultural sector growth of 4.4%
vis-à-vis 0.8% growth recorded in FY16 and a subdued growth recorded for
industry (5.8% as against 8.2% in FY16) and service (7.9% compared to 9.8%
growth in FY16) verticals.
In the fiscal year FY17,
the Gross Fixed Capital Formation (GFCF) recorded a decline to 26.9% of GDP as
against 29.2% of GDP recorded in FY16. Lower private sector spending led to low
capacity utilisation which in turn hampered the overall investment in the
economy. Also private sector investment in infra has not yet picked up.
The Indian economy is expected
to embark on a higher economic growth trajectory in FY18 owing to many
proactive measures taken by the government, complimented by favourable economic
conditions expected to prevail during the course of the year. The economy is
expected to grow at 7.5% in FY18 on the back of increased agricultural
production, owing to prediction of near normal monsoons this fiscal, increased
government spending in infrastructure, expected surge in consumer spending with
pent up demand being satiated and implementation of the Goods and Services Tax
(GST).
Investment is likely to be
driven in FY 18 mainly by the Central Government which is expected to
concentrate on spending on roads, railways and urban development. With more
than 92% of the power consumption states adopting UDAY, these state
Distribution companies (discoms) are expected to improve their T&D
infrastructure through renewed capex. Private sector investment in infra may
come with a lag while that in manufacturing would be contingent on links
between higher consumption and capacity utilisation across sectors. Although,
overall investments are likely to see an improvement, it could be marginal in
nature and as a percent of GDP is expected to continue to be below the levels
seen during FY 12-FY 16 (34.3% to 29.2%)(Source: CARE report dated May 8,
2017).
Indian Railways has
unveiled Mission 41k initiative, aimed at saving INR 410000.000 Million on its
expenditure on energy consumption over the next 10 years by doubling the annual
rate of electrification from 2,000 km to 4,000 km in the next two years.
The Ministry Of Urban
Development has approved investment of INR 28630.000 Million (US$ 433 million)
in six states under the Atal Mission for Rejuvenation and Urban Transformation
(AMRUT) scheme, for improving basic urban infrastructure over FY 2017-20.
The growth of government
infrastructural spending, increasing residential and commercial construction
activities, and industrial production are expected to propel the demand in
India manifold, thus offering new opportunities. The growth of residential and
commercial construction and the growth in infrastructure development in the
country are expected to spur growth for this segment over the coming years.
INFRASTRUCTURE & POWER SECTOR SCENARIO
Infrastructural sector is a
key driver for the Indian economy. The sector is highly responsible for
propelling India’s overall development and enjoys intense focus from Government
for initiating policies that would ensure time-bound creation of world-class
infrastructure in the country. In the Union Budget 17-18, the government has
allocated INR 0.396 Million towards infrastructure development of the country
as against INR 0.348 Million in the
previous budget. Railway
expenditure allocation has increased by 8 per cent to INR 1310000.000 Million
for laying down 3,500 km of railway lines in FY 2017-18.
Electricity demand in the
country has increased rapidly and is expected to rise further in the years to
come. In order to meet the increasing demand for electricity in the country,
massive addition to the installed generating capacity is required.
Indian power sector is
undergoing a significant change that has redefined the outlook of the industry.
Sustained economic growth continues to drive electricity demand in India. The
Government of India’s focus on attaining ‘Power for all’ has accelerated
capacity addition in the country. At the same time, the competitive intensity
is increasing at both the market and supply sides (fuel, logistics, finances,
and manpower). Total installed capacity
of power stations in India
stood at 3,26,848.53 Megawatt (MW) as of March 2017 and is well diversified as
under:
All India Installed
Capacity (MW) Region – wise as on 31.03.2017
|
Thermal |
Nuclear |
Hydro |
RES |
Grand Total |
||||
|
Region |
Coal |
Gas |
Diesel |
Total |
|
|
|
|
|
Northern |
51329.200 |
5781.26 |
0.000 |
57110.460 |
1620.000 |
19311.770 |
11539.360 |
89581.590 |
|
Western |
68293.620 |
11203.41 |
0.000 |
79497.030 |
1840.000 |
7447.500 |
18304.430 |
107088.960 |
|
Southern |
43382.020 |
6473.66 |
761.580 |
50617.260 |
3320.000 |
11739.030 |
26132.070 |
91808.360 |
|
Eastern |
28578.020 |
100.00 |
0.000 |
28678.020 |
0.000 |
4738.120 |
990.740 |
34406.870 |
|
North-East |
580.020 |
1771.05 |
36.000 |
2387.070 |
0.000 |
1242.000 |
281.120 |
3910.190 |
|
Islands |
0.000 |
0.00 |
40.050 |
40.050 |
0.000 |
0.000 |
12.520 |
52.570 |
|
ALL INDIA |
192162.880 |
25329.38 |
837.630 |
218329.880 |
6780.000 |
44478.420 |
57260.230 |
326848.530 |
UNSECURED LOANS:
|
Unsecured Loan |
31.03.2017 INR In Million |
31.03.2016 INR In Million |
|
LONG-TERM
BORROWINGS |
|
|
|
Loans and Advances from
Related Parties |
|
|
|
Loan from Related Parties |
253.000 |
4.500 |
|
Deposits from Related
Parties |
8.420 |
3.350 |
|
Deposits from Others |
|
|
|
Public Deposits |
52.390 |
35.220 |
|
SHORT-TERM
BORROWINGS |
|
|
|
Loans and Advances
from Related Parties |
|
|
|
Inter Corporate Deposits |
0.800 |
2.600 |
|
Deposits from
Others |
|
|
|
Inter Corporate Deposits |
5.500 |
5.500 |
|
Public Deposits |
1.200 |
0.000 |
|
Total |
635.120 |
94.240 |
INDEX OF CHARGE:
|
S.NO |
SRN |
CHARGE ID |
CHARGE HOLDER NAME |
DATE OF CREATION |
AMOUNT |
ADDRESS |
|
1 |
G48287353 |
100109357 |
AXIS BANK LIMITED |
30/06/2017 |
750000000.0 |
2ND FLOOR, RED FORT CAPITAL, PARSVNATH TOWERS, GOLE MARKET, BHAI VEER SINGH MARG, NEW DELHI – 110001, INDIA |
|
2 |
G44113926 |
100098249 |
THE SOUTH INDIAN BANK LIMITED |
21/04/2017 |
500000000.0 |
NEW DELHI CORPORATE BRANCH, A/301, 3RD FLOOR,STATESMAN HOUSE, 148, BARA KHAMBA ROAD, DELHI – 110001, INDIA |
|
3 |
G48775126 |
100111181 |
INDUSIND BANK LIMITED |
09/02/2017 |
250000000.0 |
2401 GEN THIMMAYYA ROAD, CONTONMENT, PUNE – 411001, MAHARASHTRA, INDIA |
|
4 |
G30827141 |
100067513 |
BAJAJ FINANCE LIMITED |
02/12/2016 |
300000000.0 |
PUNE ROAD, AKURDI, PUNE – 411035, MAHARASHTRA, INDIA |
|
5 |
G37711678 |
100081621 |
DENA BANK |
31/08/2016 |
712000.0 |
35-36, AGGARWAL BHAVAN, NEHRU PLACE, DELHI – 110019, INDIA |
|
6 |
G37711652 |
100081622 |
DENA BANK |
31/08/2016 |
712000.0 |
35-36, AGGARWAL BHAVAN, NEHRU PLACE, DELHI – 110019, INDIA |
|
7 |
G37712486 |
100081623 |
DENA BANK |
31/08/2016 |
712000.0 |
35-36, AGGARWAL BHAVAN, NEHRU PLACE, DELHI – 110019, INDIA |
|
8 |
C67807008 |
10598013 |
ICICI BANK LIMITED |
08/10/2015 |
500000000.0 |
NBCC PALACE, BHISHAM PITAMAH MARG, PRAGATI VIHAR, NEW DELHI – 110003, INDIA |
|
9 |
C45711819 |
10553268 |
IDBI BANK LIMITED |
31/01/2015 |
150000000.0 |
VIDECON TOWER, 1ST FLOOR,E-1, JHANDEWALAN EXTENSION, NEW DELHI – 110055, INDIA |
|
10 |
C34695908 |
10532975 |
STATE BANK OF BIKANER AND JAIPUR |
13/11/2014 |
250000000.0 |
SCB BRANCH, 101-102, NEW DELHI HOUSE, BARAKHAMBA ROAD, NEW DELHI – 110001, INDIA |
CONTINGENT LIABILITIES:
|
Particulars |
31.03.2017 (INR In Million) |
31.03.2016 (INR In Million) |
|
Claims Against the Company not acknowledged as Debt |
0.000 |
0.220 |
|
Guarantees: |
|
|
|
Financial Bank Guarantees outstanding |
2204.130 |
1537.080 |
|
Other money for
which Company is contingently liable: |
|
|
|
Unutilized Letter of Credits |
121.350 |
129.720 |
|
Outstanding Bills discounted |
1054.090 |
834.030 |
|
Prorata share of Company in channel finance given by banks
to others |
626.600 |
407.540 |
|
Duties and Taxes: |
|
|
|
Sales Tax / Entry Tax demands under appeal |
7.730 |
8.540 |
|
Income tax Matters: |
|
|
|
Demand due to Additions / disallowances during Assessments, which are under Appeal |
2.160 |
10.240 |
|
Excise / Service tax demands under appeal |
144.500 |
406.710 |
|
Labour Cess Demands under appeal |
0.000 |
0.000 |
|
Custom Duty demand under Appeal |
0.000 |
0.000 |
|
Total |
|
|
STANDALONE UNAUDITED
FINANCIAL RESULTS FOR THE QUARTER AND SIX MONTHS ENDED 30.09.2017
(INR In Million)
|
Particulars |
Quarter ending |
Quarter ending |
Six Months ending |
|
|
30.09.2017 |
30.06.2017 |
30.09.2017 |
|
|
Unaudited |
Unaudited |
Unaudited |
|
INCOME FROM OPERATIONS |
|
|
|
|
Sales/income From Operations |
7538.050 |
8235.360 |
15773.410 |
|
Other Income |
10.290 |
15.590 |
25.880 |
|
Total
Income from Operations |
7548.340 |
8250.950 |
15799.290 |
|
|
|
|
|
|
EXPENSES |
|
|
|
|
Cost of materials consumed |
5778.300 |
5976.490 |
11754.790 |
|
Purchase of Stock in Trade |
0.910 |
3.360 |
4.270 |
|
Changes in inventories of finished goods and
work-in-progress |
(537.640) |
(479.680) |
(1017.500) |
|
Sub-contractor Expenses for tumkey projects |
169.230 |
257.970 |
427.200 |
|
Employee benefits expense |
345.090 |
344.830 |
689.920 |
|
Finance Cost |
273.800 |
299.490 |
573.290 |
|
Depreciation and Amortization expenses |
80.650 |
79.810 |
160.460 |
|
Excise Duty |
49.760 |
326.440 |
376.200 |
|
Other Expenditure |
969.880 |
1038.120 |
2008.000 |
|
Total
Expenses |
7129.980 |
7846.680 |
14976.630 |
|
|
|
|
|
|
Profit/(Loss)
before exceptional items and Extraordinary Items |
418.360 |
404.300 |
822.660 |
|
Exceptional Items |
-- |
-- |
-- |
|
Profit
/ (Loss) before Exceptional income / (Expenditure) |
418.360 |
404.300 |
822.660 |
|
Extraordinary Items |
-- |
-- |
-- |
|
Profit
/ (Loss) before Tax |
418.360 |
404.300 |
822.660 |
|
Tax
Expense |
|
|
|
|
Current Tax |
113.340 |
109.570 |
222.910 |
|
Deferred Tax |
20.000 |
20.000 |
40.000 |
|
Total
Tax Expenses |
133.340 |
129.570 |
262.910 |
|
Profit
/ (Loss) after Tax |
285.020 |
274.730 |
559.750 |
|
Other Comprehensive Income |
(1.810) |
4.540 |
2.730 |
|
Total
Comprehensive Income |
283.210 |
279.270 |
562.480 |
|
Paid-up Equity Share Capital (Face value INR 02/- per
share) |
156.720 |
155.590 |
156.720 |
|
Reserves (excluding Revaluation Reserve) |
-- |
-- |
-- |
|
Earnings per Share (EPS) - INR |
|
|
|
|
Basic
|
3.66 |
3.53 |
7.19 |
|
Diluted |
3.59 |
3.48 |
7.04 |
Segment –wise
Revenue, Results and Capital Employed
(INR In Million)
|
Particulars |
Quarter ending |
Quarter ending |
Six Months ending |
|
|
30.09.2017 |
30.06.2017 |
30.09.2017 |
|
|
Unaudited |
Unaudited |
Unaudited |
|
|
|
|
|
a)
Segment – Cables |
5966.740 |
6169.980 |
12136.720 |
|
b)
Segment – Stainless Steel Wire |
301.870 |
290.680 |
592.550 |
|
c)
Segment – Turnkey Projects |
1670.930 |
2951.830 |
4622.760 |
|
d)
Unallocable Segment |
0.000 |
0.000 |
0.000 |
|
Total
|
7939.540 |
9412.490 |
17352.030 |
|
Less : Inter Segment Ellmination |
71.440 |
79.350 |
150.790 |
|
Total |
7868.100 |
9333.140 |
17201.240 |
|
Less : Inter Segment Revenue |
330.050 |
1097.780 |
1427.830 |
|
Sales
/ Income from Operations |
7538.050 |
8235.360 |
15773.410 |
|
|
|
|
|
|
|
|
|
|
Before tax and Interest from each segment |
|
|
|
|
a)
Segment - Cables |
770.470 |
688.700 |
1459.170 |
|
b)
Segment – Stainless Steel Wire |
26.060 |
1.380 |
27.440 |
|
C)
Segment – Turnkey Projects |
306.470 |
313.710 |
620.180 |
|
Total |
1103.000 |
1003.790 |
2106.790 |
|
Less : Inter Segment Results |
185.160 |
79.350 |
264.510 |
|
Net
Segment Results |
917.840 |
924.440 |
1842.280 |
|
Less : i) Interest |
273.800 |
299.490 |
573.290 |
|
ii) Other Un-allocable expenditure net off un-allocable
Income |
225.680 |
220.650 |
446.330 |
|
Total
Profit Before Tax |
418.360 |
404.300 |
822.660 |
|
|
|
|
|
|
Segment Assets |
|
|
|
|
a)
Segment – Cables |
14704.320 |
13197.270 |
14704.320 |
|
b)
Segment – Stainless Steel Wire |
593.410 |
588.700 |
593.410 |
|
c)
Segment – Turnkey Projects |
5096.950 |
4968.770 |
5096.950 |
|
d)
Unallocable Segment |
409.500 |
428.910 |
409.500 |
|
Total |
20804.180 |
19183.650 |
20804.180 |
|
|
|
|
|
|
Segment Liabilities |
|
|
|
|
a)
Segment – Cables |
5013.870 |
5122.360 |
5013.870 |
|
b)
Segment – Stainless Steel Wire |
182.420 |
418.420 |
182.420 |
|
c)
Segment – Turnkey Projects |
1547.260 |
1229.620 |
1547.260 |
|
d)
Unallocable Segment |
6720.490 |
5624.720 |
6720.490 |
|
Total |
13464.040 |
12395.120 |
13464.040 |
|
|
|
|
|
|
|
|
|
|
(segment
Assets – Segment Liabilities) |
|
|
|
|
a)
Segment – Cables |
9690.450 |
8074.910 |
9690.450 |
|
b)
Segment – Stainless Steel Wire |
410.990 |
170.280 |
410.990 |
|
c)
Segment – Turnkey Projects |
3549.690 |
3739.150 |
3549.690 |
|
d)
Unallocable Segment |
(6310.990) |
(5195.810) |
(6310.990) |
|
Total |
7340.140 |
6788.530 |
7340.140 |
Notes:
1) The above results have been reviewed by the Audit Committee at their meeting held on November 13, 2017 and thereafter approved by the Board of Directors at their meeting held on November 13, 2017.
2) This statement has been prepared in accordance with the Companies (Indian
Accounting Standard) Rules, 2015 (Ind AS) prescribed under section 133 of the
Companies Act, 2013 and other recognised accounting practices and policies to
the extent applicable. The Company has adopted Ind AS foe the first time w.e.f
April 1, 2017 with a transition date of April 1, 2016.
3) The statutory auditors have carried out a limited review of the results for
the quarter and six months ended September 30, 2017. The Ind AS results of the quarter
and six months ended September 30, 2016 have not been subject to limited
review/audit. However. Management has exercised necessary due diligence to
ensure that the standalone financial results provide a true and fair view of
its affairs.
4) The Share Allotment Committee of the Board at its meeting held on September
25, 2017 allotted 5,64,000 Equity Shares to eligible employees of the Company
pursuant to "KEI Employee Stock Option Scheme-2015" (2nd Year).
5) Post the applicability of Goods and Service Tax (GST) with effect from July
01, 2017, revenue from operations is disclosed net of GST. Accordingly, the
revenue from operations and other expenses for the quarter/ six months ended on
September 30, 2017 are not comparable with the previous periods presented in
the result to the extent.
6) Reconciliation of the net profit for the quarter and six months ended
September 30, 2016, as reported under previous GAAP
STATEMENT OF ASSETS AND LIABILITIES
|
SOURCES OF FUNDS |
|
|
30.09.2017 |
|
|
|
|
|
|
I.
EQUITY AND LIABILITIES |
|
|
|
|
(1)Shareholders' Funds |
|
|
|
|
(a) Share Capital |
|
|
156.720 |
|
(b) Reserves &
Surplus |
|
|
4910.790 |
|
(c) Money received
against share warrants |
|
|
0.000 |
|
|
|
|
|
|
(2) Share Application
money pending allotment |
|
|
0.000 |
|
Total Shareholders’ Funds
(1) + (2) |
|
|
5067.510 |
|
|
|
|
|
|
(3) Non-Current
Liabilities |
|
|
|
|
(a) long-term borrowings |
|
|
1497.810 |
|
(b) Deferred tax
liabilities (Net) |
|
|
511.440 |
|
(c) Other long term
liabilities |
|
|
0.000 |
|
(d) long-term provisions |
|
|
58.670 |
|
Total Non-current
Liabilities (3) |
|
|
2067.920 |
|
|
|
|
|
|
(4) Current Liabilities |
|
|
|
|
(a) Short term borrowings |
|
|
6902.490 |
|
(b) Trade payables |
|
|
5557.410 |
|
(c) Other current
liabilities |
|
|
1148.830 |
|
(d) Short-term provisions |
|
|
60.020 |
|
Total Current Liabilities
(4) |
|
|
13668.750 |
|
|
|
|
|
|
TOTAL |
|
|
20804.180 |
|
|
|
|
|
|
II.
ASSETS |
|
|
|
|
(1) Non-current assets |
|
|
|
|
(a) Fixed Assets |
|
|
|
|
(i) Tangible assets |
|
|
4017.560 |
|
(ii) Intangible Assets |
|
|
31.200 |
|
(iii) Capital
work-in-progress |
|
|
65.120 |
|
(iv) Intangible assets under
development |
|
|
0.000 |
|
(b) Non-current
Investments |
|
|
32.200 |
|
(c) Deferred tax assets
(net) |
|
|
0.000 |
|
(d) Long-term Loan and Advances |
|
|
33.390 |
|
(e) Other Non-current
assets |
|
|
63.720 |
|
Total Non-Current Assets |
|
|
4243.190 |
|
|
|
|
|
|
(2) Current assets |
|
|
|
|
(a) Current investments |
|
|
0.000 |
|
(b) Inventories |
|
|
5714.120 |
|
(c) Trade receivables |
|
|
9139.170 |
|
(d) Cash and cash
equivalents |
|
|
66.040 |
|
(e) Short-term loans and advances |
|
|
5.040 |
|
(f) Other current assets |
|
|
1636.620 |
|
Total Current Assets |
|
|
16560.990 |
|
|
|
|
|
|
TOTAL |
|
|
20804.180 |
FIXED ASSETS:
- Land
- Building
- Plant and Equipment
- Furniture and Fixtures
- Leasehold Building Improvement
- Vehicles
- Office Equipment
- Computers
CMT REPORT (Corruption, Money Laundering & Terrorism]
The Public Notice information has been collected from various sources
including but not limited to: The Courts,
1] INFORMATION ON
DESIGNATED PARTY
No exist designating subject or any of its beneficial owners,
controlling shareholders or senior officers as terrorist or terrorist
organization or whom notice had been received that all financial transactions
involving their assets have been blocked or convicted, found guilty or against
whom a judgement or order had been entered in a proceedings for violating
money-laundering, anti-corruption or bribery or international economic or
anti-terrorism sanction laws or whose assets were seized, blocked, frozen or
ordered forfeited for violation of money laundering or international
anti-terrorism laws.
2] Court Declaration :
No records exist to suggest that subject is
or was the subject of any formal or informal allegations, prosecutions or other
official proceeding for making any prohibited payments or other improper
payments to government officials for engaging in prohibited transactions or
with designated parties.
3] Asset Declaration :
No records exist to suggest that the property or assets of the subject
are derived from criminal conduct or a prohibited transaction.
4] Record on Financial
Crime :
Charges or conviction
registered against subject: None
5] Records on Violation of
Anti-Corruption Laws :
Charges or investigation
registered against subject: None
6] Records on Int’l
Anti-Money Laundering Laws/Standards :
Charges or
investigation registered against subject: None
7] Criminal Records
No available
information exist that suggest that subject or any of its principals have been
formally charged or convicted by a competent governmental authority for any
financial crime or under any formal investigation by a competent government
authority for any violation of anti-corruption laws or international anti-money
laundering laws or standard.
8] Affiliation with
Government :
No record
exists to suggest that any director or indirect owners, controlling
shareholders, director, officer or employee of the company is a government
official or a family member or close business associate of a Government
official.
9] Compensation Package :
Our market
survey revealed that the amount of compensation sought by the subject is fair
and reasonable and comparable to compensation paid to others for similar
services.
10] Press Report :
No press reports / filings exists on
the subject.
CORPORATE GOVERNANCE
MIRA INFORM as part of its Due Diligence do provide comments on
Corporate Governance to identify management and governance. These factors often
have been predictive and in some cases have created vulnerabilities to credit
deterioration.
Our Governance Assessment focuses principally on the interactions
between a company’s management, its Board of Directors, Shareholders and other
financial stakeholders.
CONTRAVENTION
Subject is not known to have contravened any existing local laws,
regulations or policies that prohibit, restrict or otherwise affect the terms
and conditions that could be included in the agreement with the subject.
FOREIGN EXCHANGE RATES
|
Currency |
Unit
|
INR |
|
US Dollar |
1 |
INR 63.38 |
|
|
1 |
INR 86.02 |
|
Euro |
1 |
INR 76.50 |
INFORMATION DETAILS
|
Information
Gathered by : |
SHL |
|
|
|
|
Analysis Done by
: |
VRS |
|
|
|
|
Report Prepared
by : |
GEET |
SCORE FACTORS
|
DEMERIT POINTS |
|
|
|
--BANK CHARGES |
YES/NO |
YES |
|
--LITIGATION |
YES/NO |
NO |
|
--OTHER ADVERSE INFORMATION |
YES/NO |
NO |
|
MERIT POINTS |
|
|
|
--SOLE DISTRIBUTORSHIP |
YES/NO |
NO |
|
--EXPORT ACTIVITIES |
YES/NO |
NO |
|
--AFFILIATION |
YES/NO |
YES |
|
--LISTED |
YES/NO |
YES |
|
--OTHER MERIT FACTORS |
YES/NO |
YES |
RATING EXPLANATIONS
|
Credit Rating |
Explanation |
Rating Comments |
|
A++ |
Minimum Risk |
Business dealings permissible with minimum
risk of default |
|
A+ |
Low Risk |
Business dealings permissible with low
risk of default |
|
A |
Acceptable Risk |
Business dealings permissible with
moderate risk of default |
|
B |
Medium Risk |
Business dealings permissible on a regular
monitoring basis |
|
C |
Medium High Risk |
Business dealings permissible preferably
on secured basis |
|
D |
High Risk |
Business dealing not recommended or on
secured terms only |
|
NB |
New Business |
No recommendation can be done due to
business in infancy stage |
|
NT |
No Trace |
No recommendation can be done as the
business is not traceable |
NB is stated where there is insufficient information to facilitate rating. However, it is not to be considered as unfavourable.
This score serves as a reference to assess
SC’s credit risk and to set the amount of credit to be extended. It is
calculated from a composite of weighted scores obtained from each of the major sections
of this report. The assessed factors are as follows:
·
Financial
condition covering various ratios
·
Company
background and operations size
·
Promoters
/ Management background
·
Payment
record
·
Litigation
against the subject
·
Industry
scenario / competitor analysis
·
Supplier
/ Customer / Banker review (wherever available)
This report is issued at
your request without any risk and responsibility on the part of MIRA INFORM
PRIVATE LIMITED (MIPL) or its officials.