|
|
|


MIRA INFORM REPORT
|
Report No. : |
484567 |
|
Report Date : |
10.01.2018 |
IDENTIFICATION DETAILS
|
Name : |
GENERIS-FARMACEUTICA SA |
|
|
|
|
Registered Office : |
Rua João De Deus, No. 19 2700-487- Amadora Lisboa |
|
|
|
|
Country : |
Portugal |
|
|
|
|
Financials (as on) : |
2016 |
|
|
|
|
Date of Incorporation : |
18.09.2007 |
|
|
|
|
Legal Form : |
Joint Stock Company |
|
|
|
|
Line of Business : |
Subject is engaged in manufacture of medicines. |
|
|
|
|
No. of Employees : |
222 |
RATING & COMMENTS
(Mira Inform has adopted New Rating mechanism w.e.f. 23rd
January 2017)
|
MIRA’s Rating : |
A |
|
Credit Rating |
Explanation |
Rating Comments |
|
A |
Acceptable Risk |
Business dealings permissible with moderate
risk of default |
|
Status : |
Satisfactory |
|
|
|
|
Payment Behaviour : |
Slow but Correct |
|
|
|
|
Litigation : |
Clear |
NOTES :
Any query related to this report can be made
on e-mail : infodept@mirainform.com
while quoting report number, name and date.
ECGC Country Risk Classification List
|
Country Name |
Previous Rating (30.06.2017) |
Current Rating (30.09.2017) |
|
Portugal |
B1 |
B1 |
|
Risk Category |
ECGC
Classification |
|
Insignificant |
A1 |
|
Low Risk |
A2 |
|
Moderately Low Risk |
B1 |
|
Moderate Risk |
B2 |
|
Moderately High Risk |
C1 |
|
High Risk |
C2 |
|
Very High Risk |
D |
PORTUGAL - ECONOMIC OVERVIEW
Portugal has become a diversified and increasingly service-based economy since joining the European Community - the EU's predecessor - in 1986. Over the following two decades, successive governments privatized many state-controlled firms and liberalized key areas of the economy, including the financial and telecommunications sectors. The country joined the Economic and Monetary Union in 1999 and began circulating the euro on 1 January 2002 along with 11 other EU members.
The economy grew by more than the EU average for much of the 1990s, but the rate of growth slowed in 2001-08. The economy contracted in 2009, and fell again from 2011 to 2013, as the government implemented spending cuts and tax increases to comply with conditions of an EU-IMF financial rescue package, signed in May 2011. Portugal successfully exited its EU-IMF program in May 2014. A modest recovery gathered steam in 2015 due to strong export performance and a rebound in private consumption. Growth slowed slightly in the first half of 2016, but rebounded in the last two quarters of the year to register at 1.4 percent for the year. Unemployment remains high, at 10.2%, at the end of 2016, but has improved steadily since peaking at 18% in 2013.
The center-left minority Socialist government has unwound some unpopular austerity measures while managing to remain within most EU fiscal targets. The budget deficit fell from 11.2% of GDP in 2010 to 2.0% in 2016, the country’s lowest since democracy was restored in 1974, and surpassing the EU and IMF projections of 3%. Portugal is expected to exit the EU’s excessive deficit procedure by mid-2017.
|
Source
: CIA |
Company
name
GENERIS-FARMACEUTICASA
FINANCIAL
HIGHLIGHTS
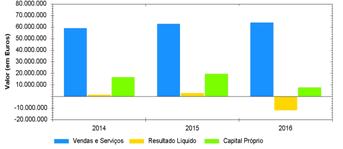
|
2014 |
2015 |
2016 |
|
|
net sales |
59.130.240,65 |
62.716.573,18 |
63.776.317,80 |
net
income for 1.520.421,31 2.821.351,00 (11.645.627,85) shareholders 16.584.505,25 19.405.856,25 7.760.228,40 stocks 14.763.759,41 21.180.293,95 15.994.933,08 liability 150.016.558,40 161.980.915,32 157.411.259,50 assets 166.601.063,65 181.386.771,57 165.171.487,90
![]()
![]()
![]()
![]()
![]()
![]()
![]() the year funds
the year funds
![]()
![]()
SUMMARY
Legal Form Joint Stock Company
|
Constitution 18-09-2007 |
V.A.T. Number / NIF 508107997
|
Employees 222 |
Capital 129.993.868,00
|
Sales in :
31-12-2016 63.776.317,80 |
Shareholders Funds in: 31-12-2016 7.760.228,40
|
Actual Condition In activity |
Import/Export Sim
/ Sim
On this date the subject is Not registered in the
debtors list of the tax authorities
CONTRIBUTIVE SITUATION (SOCIAL SECURITY)
At present date, the company is not in Social
Security debt list
INSOLVENCIES / REVITALIZATION PROCESSES
NO
SUMMARY OF CLAIMS (LAST 5 YEARS)
|
YEAR QUANTITY TOTAL |
|
€ |
2017 1 30.000,01
|
2016 1 30.000,01 |
2014 2 59.927,91
|
Total 4 119.927,93 |
IDENTIFICATION
Name GENERIS-FARMACEUTICA SA
|
Trust Nº. 1189499 |
V.A.T. Number / NIF 508107997
|
Address Rua João de
Deus, nº 19 |
Postal Code 2700-487-AMADORA
|
Municipality AMADORA |
District LISBOA
|
Country Portugal |
Telephone 219248210,
214967120, 219849300
|
Fax 214967129, 219248214 |
E-Mail generis@generis.pt
|
Web Site www.generis.pt |
CAE Main 21201- Manufacture
of medicines
GOVERNING
BODIES
|
Board of Director's |
SANJEEV INDRAVADAN DANI Board of
Director's President
|
VENUGOPALAN MURALIDHARAN Board
of Director's Member |
MANOJ PRAKASH Board of Director's Member
|
PAULO MIGUEL CLIMACO
LILAIA Board of Director's
Member |
PHANAHEEDRA PRASAD GORLA Board of Director's Member
Fiscal Board
|
JOSE MANUEL GONCALVES MORAIS CABRAL Fiscal Board President |
DELOITTE & ASSOCIADOS, SROC SA Account Official Reviser
|
BRUNO MIGUEL AREZ MARTINS Fiscal Board
Vice-President |
BAKER TILLY, PG & ASSOCIADOS, SROC SA Fiscal Board
Vice-President
|
CARLOS LUIS
OLIVEIRA DE MELO LOUREIRO Fiscal
Board Substitute |
LEGAL
STRUCTURE
Registed on the Register Record Office of Amadora
with the Register Number 508107997 in 06-01-2011
|
Constitution celebrated in 18-09-2007 published on Portal MJ of 20-09-2007 |
To oblige the company it is necessary 2 signature
CHANGES
TO SOCIETY
In 07-08-2017 on Portal MJ of 07-08-2017 annual financial
statements
In 08-05-2017 on Portal MJ of 08-05-2017 increase
of capital
In 28-04-2017 on Portal MJ of 28-04-2017 resignation
of board
of directors
In 28-04-2017 on Portal MJ of 28-04-2017 appointment
of board
of directors
In 29-12-2016 on Portal MJ of 29-12-2016 resignation
of board
of directors
In 03-10-2016 on Portal MJ of 03-10-2016 resignation
of board
of directors
In 23-07-2016 on Portal MJ of 23-07-2016 annual financial statements
In 17-07-2015 on Portal MJ of 17-07-2015 annual financial
statements
In 16-07-2014 on Portal MJ of 16-07-2014 annual financial
statements
In 10-01-2014 on Portal MJ of 10-01-2014 social
change
CAPITAL
The Capital is 129.993.868,00 , divided in
2668750000 shares , with a nominal value of 0,01
with the following shareholders
Source: IES
GENERIS II SARL 129.993.868,00 100,00%
BIOGRAPHIES
Name JOSE MANUEL GONCALVES
MORAIS CABRAL
|
Funtion Fiscal Board President |
Historical of Professional Connections and Participations
The subject had links with the following
company(ies):
|
LISRESTAL R.C.- RESTAURACAO COMERCIAL SA. |
AICEP CAPITAL GLOBAL-SOCIEDADE DE CAPITAL DE RISCO
SA como Membro do Conselho de Administração.
|
CUF-COMPANHIA UNIAO FABRIL, SGPS SA como Membro do
Conselho de Administração. |
EFACEC CAPITAL, SGPS SA como Membro do Conselho de
Administração.
|
BANCO CTT SA como Administrador. |
EFACEC POWER SOLUTIONS, SGPS SA como Presidente do
Conselho Fiscal.
|
SOPONATA INTERNACIONAL - SGPS (MADEIRA)
- SOCIEDADE UNIPESSOAL LDA (ZONA FRANCA DA
MADEIRA) como Gerente. |
ESCALA BRAGA-SOCIEDADE GESTORA DO ESTABELECIMENTO SA
como Vogal do Conselho de Administração.
|
JOSE DE MELLO ENERGIA SA (ZONA FRANCA DA MADEIRA)
como Vogal do Conselho de Administração. |
JOSE DE MELLO IMOBILIARIA, SGPS SA como Vogal do
Conselho de Administração.
|
Links to others companies The subject has connections
with the following
company (ies) |
JOSE DE MELLO SAUDE SA as Fiscal Board President .
|
EFACEC POWER SOLUTIONS, SGPS SA as Fiscal Board
President . |
Name PAULO MIGUEL CLIMACO LILAIA
|
Funtion Board of Director's Member |
Links to others companies The subject has connections
with the following company (ies)
|
FARMA APS-PROMOCAO DE MEDICAMENTOS UNIPESSOAL LDA
as Manager . |
GENERIS PHAR UNIPESSOAL LDA as Manager .
|
UNIK PREMIUM INVESTMENTS
UNIPESSOAL LDA as Managing-Partner with
a participation of 5.000,00 , in a capital of 5.000,00 . |
Name PHANAHEEDRA PRASAD GORLA
|
Funtion Board of Director's Member |
Historical of Professional Connections and Participations
The subject had links with the following
company(ies):
|
AUROBINDO PHARMA (PORTUGAL), UNIPESSOAL LDA como
.. |
Links to others companies The subject has connections
with the following company (ies)
|
AUROVITAS UNIPESSOAL LDA as Manager . |
Name VENUGOPALAN MURALIDHARAN
Funtion Board of Director's Member
Historical of Professional Connections and Participations
The subject had links with the following
company(ies):
|
AUROBINDO PHARMA (PORTUGAL), UNIPESSOAL LDA como
Gerente. |
Links to others companies The subject has connections
with the following company (ies)
|
MER MEDICAMENTOS LDA as Manager . |
FARMA APS-PROMOCAO DE MEDICAMENTOS UNIPESSOAL LDA as
Manager .
|
GENERIS PHAR UNIPESSOAL LDA as Manager . |
AUROVITAS UNIPESSOAL LDA as Manager .
|
Name MANOJ PRAKASH |
Funtion Board of Director's Member
|
Historical of Professional The subject had links with the following company(ies): Connections and Participations |
AUROBINDO PHARMA (PORTUGAL), UNIPESSOAL LDA como
Gerente.
|
Links to others companies The subject has connections
with the following
company (ies) |
MER MEDICAMENTOS LDA as Manager .
|
FARMA APS-PROMOCAO DE MEDICAMENTOS UNIPESSOAL LDA
as Manager . |
GENERIS PHAR UNIPESSOAL LDA as Manager .
|
AUROVITAS UNIPESSOAL LDA as Manager . |
Name SANJEEV INDRAVADAN DANI
|
Funtion Board of Director's President |
ACTIVITIES
Main CAE 21201-
Manufacture of medicines
BUSINESS DESCRIPTION
Fabrico, comercialização, importação e exportação de medicamentos, especialidades farmacêuticas, produtos químicos, produtos de higiene corporal, cosmética, dietética, produtos de uso clínico, hospitalar e cirúrgico, produtos de biotecnologia, biogenéricos, diagnósticos e material clínico e hospitalar, activos farmacêuticos e restantes componentes destinados ao fabrico de especialidades farmacêuticas, prestação de serviços de promoção de medicamentos e outros produtos farmacêuticos
Type of Clients Hospitals/Pharmacies
|
Sales Conditions Contract |
GEOGRAPHIC
DISTRIBUTION OF SALES
|
|
INTERNAL MARKET |
|
INTERNATIONAL MARKET |
|
|
YEAR |
|
EU |
EXTRA-EU |
TOTAL |
2016 60.238.798,10 94,45% 843.789,67 1,32% 2.693.730,03 4,22% 63.776.317,80
|
2015 60.190.830,94 95,97% 998.541,36 1,59% 1.527.200,88 2,44% 62.716.573,18 |
2014 55.899.840,58 94,54% 1.905.741,61 3,22% 1.324.658,46 2,24% 59.130.240,65
|
2013 54.872.811,00 94,42% 2.278.207,36 3,92% 963.347,82 1,66% 58.114.366,18 |
2012 49.713.098,00 93,73% 2.076.647,00 3,92% 1.250.416,00 2,36% 53.040.161,00
GEOGRAPHIC
DISTRIBUTION OF PURCHASES
|
|
INTERNAL MARKET |
|
INTERNATIONAL MARKET |
|
|
|
YEAR |
|
EU |
|
EXTRA-EU |
TOTAL |
2016 16.343.911,60 43,13% 16.445.326,61 43,40% 5.107.280,20 13,48% 37.896.518,41
|
2015 17.842.737,89 40,08% 21.426.741,32 48,13% 5.249.196,77 11,79% 44.518.675,98 |
2014 12.833.099,05 36,18% 17.063.230,59 48,11% 5.574.198,80 15,72% 35.470.528,44
|
2013 12.722.562,80 36,75% 17.215.482,36 49,72% 4.684.396,23 13,53% 34.622.441,39 |
2012 11.877.564,00 34,73% 17.536.216,00 51,27% 4.789.905,00 14,00% 34.203.685,00
TRADE MARKS
Generis
BANKS
AND FINANCIAL INSTITUTIONS
CAIXA GERAL DE DEPOSITOS, SA Lisboa
|
MILLENNIUM BCP Lisboa |
INCIDENTS
INSOLVENCIES / REVITALIZATION PROCESSES
NO
TAX SITUATION
On this date the subject is Not registered in the debtors list of the tax authorities
CONTRIBUTIVE SITUATION (SOCIAL SECURITY)
At present date, the company is not in Social Security debt list
SUMMARY OF CLAIMS (LAST 5 YEARS)
|
YEAR QUANTITY TOTAL |
|
€ |
2017 1 30.000,01
|
2016 1 30.000,01 |
2014 2 59.927,91
|
Total 4 119.927,93 |
LEGAL ACTIONS
|
Date |
18-01-2017 |
|
Process |
23363/09.8T2SNT |
|
Author |
Helm Ag |
|
Type |
Action of Ordinary Process |
|
Amount |
30.000,01 |
|
Judicial Distric |
t Lisboa - Tribunal da Propriedade Intelectual |
|
Date |
29-01-2016 |
|
Process |
27526/11.8T2SNT |
|
Author |
Sanofi Aventis Produtos Farmaceuticos, Sa |
|
Type |
Action of Ordinary Process |
|
Amount |
30.000,01 |
|
Judicial Distric |
t Lisboa - Tribunal da Propriedade Intelectual |
|
Date |
29-01-2016 |
Process 27526/11.8T2SNT
|
Author |
Aventis Pharma S.A. |
|
Type |
Action of Ordinary Process |
|
Amount |
30.000,01 |
|
Judicial Distric |
t Lisboa - Tribunal da Propriedade Intelectual |
|
Date |
09-10-2014 |
|
Process |
1297/06.8TYLSB |
|
Author |
Astrazeneca Uk Limited |
|
Type |
Action of Ordinary Process |
|
Amount |
29.927,90 |
|
Judicial Distric |
t Lisboa - Tribunal da Propriedade Intelectual |
|
Date |
09-10-2014 |
|
Process |
1297/06.8TYLSB |
|
Author |
Astrazeneca - Produtos Farmacêuticos, Ldª. |
|
Type |
Action of Ordinary Process |
|
Amount |
29.927,90 |
|
Judicial Distric |
t Lisboa - Tribunal da Propriedade Intelectual |
|
Date |
09-10-2014 |
|
Process |
904/09.5TYLSB |
|
Author |
Merck & Cº, Inc. |
|
Type |
Action of Ordinary Process |
|
Amount |
30.000,01 |
|
Judicial Distric |
t Lisboa - Tribunal da Propriedade Intelectual |
|
Date |
09-10-2014 |
|
Process |
904/09.5TYLSB |
|
Author |
Laboratórios Químicos Farmacêuticos Chibret, Lda |
|
Type |
Action of Ordinary Process |
|
Amount |
30.000,01 |
Judicial District Lisboa
- Tribunal da Propriedade Intelectual
EMPLOYEES
|
YEAR |
TOTAL |
MEN |
|
WOMEN |
|
|
2016 |
222 |
86 |
39% |
136 |
61% |
2015 234 87 37% 147 63%
|
2014 233 84 36% 149 64% |
2013 228 83 36% 145 64%
|
2012 295 109 37% 186 63% |
HEAD
OFFICE AND INSTALLATIONS
Has head office Rua João de Deus, nº 19, 2700-487,
AMADORA
|
Had head office Beloura Office Park - Edifício 4,
Piso 1 - Escritório 8, 2710-693, SINTRA |
PARTICIPATIONS
DIRECT PARTICIPATIONS
NAME MER MEDICAMENTOS LDA
|
Trust Nº. 1223438 |
Address Rua João de Deus, nº19
|
Locality 2700-487 AMADORA |
Country PORTUGAL
|
C.A.E. 21201- Manufacture of medicines |
Capital 5.000,00
|
Participation 100% |
NAME GENERIS PHAR UNIPESSOAL LDA
|
Trust Nº. 1277287 |
Address Rua João de Deus, nº 19
|
Locality 2700-487 AMADORA |
Country PORTUGAL
|
E-Mail generis@generis.pt |
Web Site http://www.generis.pt
|
C.A.E. 21201- Manufacture of medicines |
Capital 5.000,00
|
Participation 100,00% |
FINANCIAL
DEMONSTRATION SNC
|
BALANCE SHEET SNC COINEUROS YEAR:2016 |
|
2016 2015 2014 %VAR.2016/15 |
ASSET
|
NON-CURRENT ASSETS |
||||
|
Tangible fixed assets |
17.704.356,07 |
17.812.191,18 |
13.918.928,41 |
(0,61)% |
|
Investment properties |
1.145.040,86 |
1.338.999,79 |
1.550.999,38 |
(14,49)% |
|
Goodwill |
101.949.581,91 |
113.277.313,24 |
113.277.313,24 |
(10,00)% |
|
Intangible assets |
12.313.606,00 |
13.326.016,99 |
2.649.523,50 |
(7,60)% |
|
Biological assets |
- |
- |
- |
- |
|
Financial participations - patrimonial equity
method |
26.790,81 |
27.068,25 |
27.672,08 |
(1,02)% |
|
Financial participations - other methods |
5.514,40 |
5.514,40 |
5.514,40 |
- |
|
Shareholders/partners |
- |
- |
- |
- |
|
Other financial assets |
- |
- |
- |
- |
|
Deferred tax assets |
1.898.960,12 |
2.531.450,64 |
2.697.068,83 |
(24,99)% |
|
Financial investments(exclusive use by small entities
and micro entities) |
- |
- |
- |
- |
|
Total |
135.043.850,17 |
148.318.554,49 |
134.127.019,84 |
(8,95)% |
|
CURRENT ASSETS |
||||
|
Inventories |
15.994.933,08 |
21.180.293,95 |
14.763.759,41 |
(24,48)% |
|
Biological assets |
- |
- |
- |
- |
|
Costumers |
7.251.596,24 |
8.103.909,30 |
9.255.837,91 |
(10,52)% |
|
Advances to suppliers |
433.607,35 |
1.128.277,25 |
507.306,36 |
(61,57)% |
|
State and other public entities |
2.246.213,61 |
1.487.491,37 |
310.500,01 |
51,01% |
|
Shareholders/partners |
- |
- |
- |
- |
|
Other accounts receivable |
74.419,29 |
106.630,93 |
93.129,22 |
(30,21)% |
|
Deferrals |
211.841,40 |
173.143,09 |
240.008,75 |
22,35% |
|
Financial assets held for trading |
- |
445,12 |
1.005,61 |
- |
|
Other financial assets |
- |
- |
- |
- |
|
Non-current assets held for sale |
- |
- |
- |
- |
|
Other current assets |
- |
- |
- |
- |
|
Cashier and bank deposits |
3.915.026,76 |
888.026,07 |
7.302.496,54 |
340,87% |
|
Total |
30.127.637,73 |
33.068.217,08 |
32.474.043,81 |
(8,89)% |
|
TOTAL ASSET |
165.171.487,90 |
181.386.771,57 |
166.601.063,65 |
(8,94)% |
SHAREHOLDERS
FUNDS AND LIABILITIES
SHAREHOLDERS FUNDS
|
Capital |
26.687.500,00 |
26.687.500,00 |
26.687.500,00 |
- |
|
Own shares |
- |
- |
- |
- |
|
Other shareholders funds instruments |
6.100.000,00 |
6.100.000,00 |
6.100.000,00 |
- |
|
Emission premiuns |
- |
- |
- |
- |
|
Legal reserves |
365.463,99 |
224.396,44 |
148.375,38 |
62,87% |
|
Other reserves |
351.850,85 |
351.850,85 |
351.850,85 |
- |
|
Net retained |
(14.137.161,59) |
(16.817.445,04) |
(18.261.845,29) |
(15,94)% |
|
Adjustments on financial assets |
- |
- |
- |
- |
|
Revaluation surplus |
- |
- |
- |
- |
|
Other shareholders funds changes |
38.203,00 |
38.203,00 |
38.203,00 |
- |
|
Total |
19.405.856,25 |
16.584.505,25 |
15.064.083,94 |
17,01% |
|
Net income for the period |
(11.645.627,85) |
2.821.351,00 |
1.520.421,31 |
(512,77)% |
|
Antecipated dividends |
- |
- |
- |
- |
|
TOTAL OF SHAREHOLDERS FUNDS |
7.760.228,40 |
19.405.856,25 |
16.584.505,25 |
(60,01)% |
LIABILITY
NON-CURRENT LIIABILITIES
|
Provisions |
543.074,95 |
543.074,95 |
512.231,61 |
- |
|
Financing obtained |
31.500.000,00 |
40.500.000,00 |
20.500.000,00 |
(22,22)% |
|
Responsability for post-employment beneficts |
- |
- |
- |
- |
|
Diferred taxes liabilities |
130.207,50 |
144.675,00 |
159.142,50 |
(10,00)% |
|
Other payable accounts |
95.488.294,00 |
91.758.515,44 |
70.612.500,00 |
4,06% |
|
Total |
127.661.576,45 |
132.946.265,39 |
91.783.874,11 |
(3,98)% |
CURRENT LIABILITIES
|
Suppliers |
10.655.532,90 |
14.655.952,95 |
7.364.376,03 |
(27,30)% |
|
Advances from costumers |
- |
- |
- |
- |
|
State and other public entities |
432.934,78 |
578.275,77 |
440.648,97 |
(25,13)% |
|
Shareholders/partners |
- |
- |
- |
- |
|
Financing obtained |
11.450.000,00 |
3.750.000,00 |
1.500.000,00 |
205,33% |
|
Other payable accounts |
7.211.215,37 |
10.050.421,21 |
48.927.659,29 |
(28,25)% |
|
Deferrals |
- |
- |
- |
- |
|
Financial liabilities held for trading |
- |
- |
- |
- |
|
Other financial liabilities |
- |
- |
- |
- |
|
Non-current liabilities held for sale |
- |
- |
- |
- |
|
Other current liabilities |
- |
- |
- |
- |
|
Total |
29.749.683,05 |
29.034.649,93 |
58.232.684,29 |
2,46% |
|
TOTAL LIABILITIES |
157.411.259,50 |
161.980.915,32 |
150.016.558,40 |
(2,82)% |
|
TOTAL SHAREHOLDERS FUNDS AND LIABILITIES |
165.171.487,90 |
181.386.771,57 |
166.601.063,65 |
(8,94)% |
INCOME STATEMENT
|
INCOME AND EXPENSES |
||||
|
Sales and services |
63.776.317,80 |
62.716.573,18 |
59.130.240,65 |
1,69% |
|
Operating government grants |
- |
- |
- |
- |
|
Gains/losses allocated subsidiaries, associates
and joint ventures |
(277,44) |
(603,83) |
(388,65) |
(54,05)% |
|
Variation in production inventories |
(899.498,27) |
1.035.131,50 |
478.454,08 |
(186,90)% |
|
Work for the entity itself |
- |
- |
- |
- |
|
Cost of goods sold and materials consumed |
31.166.130,06 |
29.277.644,02 |
26.974.677,30 |
6,45% |
|
Suppliers and external services |
7.760.508,35 |
8.364.631,48 |
8.249.519,87 |
(7,22)% |
|
Personnel costs |
9.476.043,72 |
9.861.040,77 |
9.174.847,45 |
(3,90)% |
|
Impairment of inventories (losses/revearsals) |
3.223.033,40 |
1.464.999,92 |
865.000,00 |
120,00% |
|
Impairment of receivables (losses/revearsals) |
65.855,79 |
452.223,63 |
(134.620,97) |
(85,44)% |
|
Provisions (increases/reductions) |
265.769,14 |
30.843,34 |
(4.015,32) |
761,67% |
|
Impairment of investments not
depreciable/amortizable (losses/reversals) |
- |
- |
- |
- |
|
Other impairments (losses/reversals)/impairments
(losses/reversals) (exclusive use by small
entities and microentities) |
- |
- |
- |
- |
|
Increases/decreases in fair value |
- |
- |
- |
- |
|
Other income and gains |
231.235,81 |
1.252.043,79 |
549.203,20 |
(81,53)% |
|
Other expenses and losses |
1.178.428,00 |
1.272.248,77 |
1.026.986,89 |
(7,37)% |
|
Result before depreciation, financing costs and taxes |
9.972.009,44 |
14.279.512,71 |
14.005.114,06 |
(30,17)% |
|
Expenses/reversals of depreciation and
amortization |
15.246.749,56 |
3.158.042,68 |
3.471.490,66 |
382,79% |
|
Impairment of investments depreciable/amortizable
(losses/reversals) |
234.602,28 |
363.309,56 |
577.796,13 |
(35,43)% |
|
Operating result (before financing costs and taxes) |
(5.509.342,40) |
10.758.160,47 |
9.955.827,27 |
(151,21)% |
|
Interest and similar income obtained |
- |
13.777,60 |
44.234,59 |
- |
|
interest and similar expenses incurred |
5.272.898,40 |
7.416.255,31 |
8.241.358,45 |
(28,90)% |
|
Net before taxes |
(10.782.240,80) |
3.355.682,76 |
1.758.703,41 |
(421,31)% |
|
Income tax of the period |
863.387,05 |
534.331,76 |
238.282,10 |
61,58% |
|
Net profit for the period |
(11.645.627,85) |
2.821.351,00 |
1.520.421,31 |
(512,77)% |
|
Results of discontinued operations (net of taxes) included in the net
icome of the period |
- |
- |
- |
- |
RATIOS
SNC
|
YEAR |
2016 |
2015 |
2014 |
TURNOVER RATIOS
|
Shareholder's Funds Profitability (Net Income
/ Shareholders Funds) (%) (150,07) 14,54 9,17 |
Return on Assets (Operating Result
/ Total Asset)(%) (3,34) 5,93 5,98
|
Sales Net Profitability (Net Income
/ Sales) (%) (18,26) 4,50 2,57 |
EFFICIENCY RATIOS
|
Medium Term Receivable
(Costumers / Sales) *
365 (d) 41,50 47,16 57,13 |
Medium Term Payable (Suppliers / Purchases + Suppliers
and external services)*365 (d) 102,63 120,16 75,78
|
Asset Rotation (Sales / Toral Asset) (%) 38,61 34,58 35,49 |
PRODUCTIVITY RATIOS
|
Gross Added Value / Employee (#) 103.617,07 111.492,41 102.603,92 |
Sales / Employee (#) 287.280,71 268.019,54 253.777,86
|
Productivity (Gross
Added Value / Personnel costs) (#) 2,43 2,65 2,61 |
SHORT TERM RATIOS
|
General Liquidity
(Current Assets
/ Current Liabilities) (#) 1,01 1,14 0,56 |
Reduced Liquidity (Current Assets - Inventories / Current Liabilities) (#) 0,48 0,41 0,30
|
Immediate Liquidity (Cashier
and bank deposits / Current
Liabilities) (#) 0,13 0,03 0,13 |
MEDIUM LONG TERM RATIOS
|
OPERATIONAL AND FINANCIAL RISK |
Operational Leverage
Level (OLL)
(Gross Margin / Operating Result) (#) (5,92) 3,11 3,23
|
Financial Leverage Level
(FLL) (Gross Operating Profit / Operating Result) (#) 0,51 3,21 5,66 |
Combined Leverage Level
(OLL x FLL) (#) (3,02) 9,96 18,28
CASH
FLOW STATEMENT
|
RUBRICS |
2016 |
2015 |
PERIODS |
CASH FLOWS FROM OPERATIONAL ACTIVITIES
|
Customers receipts 67.839.706,19 66.734.027,74 1,66% |
Payments to suppliers 45.855.824,43 44.873.812,98 2,19%
|
Payments to employees 8.662.095,20 8.804.739,82 (1,62)% |
Cash at bank generated from operations 13.321.786,56 13.055.474,94 2,04%
|
Payment/receipt of income tax (415.920,12) (234.608,87) (77,28)% |
Other receipts/payments (565.114,22) (841.912,07) 32,88%
|
Cash Flows from Operational Activities (A) 12.340.752,22 11.978.954,00 3,02% |
CASH FLOWS' INVESTMENT ACTIVITIES
|
Payments regarding: |
Fixed tangible assets 1.483.942,45 6.612.030,30 (77,56)%
|
Intangible assets 5.358.459,63 4.970.584,92 7,80% |
Financial investments - - -
|
Other assets - - - |
Receipts from:
|
Fixed tangible assets - 2.737.280,00 - |
Intangible assets 2.680,00 - -
|
Financial investments 420,33 - - |
Other assets - - -
|
Investment subsidies - - - |
|
Interest and similar income |
- |
23.635,93 |
- |
|
Dividends |
- |
- |
- |
|
Cash Flows' Investments Activities (B) |
(6.839.301,75) |
(8.821.699,29) |
22,47% |
|
CASH FLOWS' INVESTMENT ACTIVITIES |
|
|
|
|
Receipts from: |
|
|
|
|
Obtained financing 950.000,00 1.500.000,00 (36,67)% |
Paying-up of capital and
other equity instruments - - -
|
Coverage of losses - - - |
Donations - - -
|
Other financing operations - 45.000.000,00 - |
Payments regarding:
|
Obtained financing - 22.000.000,00 - |
Interests and similar expenses 1.148.097,26 1.762.461,01 (34,86)%
|
Dividends - - - |
Capital's redution and other equity instruments - - -
|
Other financing operations 2.250.000,00 32.250.000,00 (93,02)% |
Cash Flows' Financing Activities © (2.448.097,26) (9.512.461,01) 74,26%
|
Variation in cash at bank and
its equivalents (A+B+C) 3.053.353,21 (6.355.206,30) 148,04% |
Effect of exchange
|
Cash at bank and its equivalents at
the start of period 888.026,07 7.302.496,96 (87,84)% |
Cash at bank and its equivalents at the end of period 3.915.026,76 888.026,49 340,87%
CASH
FLOWS
|
RUBRICS |
MOVIMENTOS DO PERIODO DE 2016 INITIAL BALANCE DEBITS |
CREDITS |
FINAL BALANCE |
PERIOD'S CARRYING AMOUNT AND MOVEMENTS
|
Cash in hand 1.359,62 17.924,79 18.603,17 681,24 |
Order deposits 886.666,45 133.349.518,51 130.321.839,44 3.914.345,52
|
Other bank deposits - - - 0,00 |
Total cash at bank and bank deposits 888.026,07 133.367.443,30 130.340.442,61 3.915.026,76
|
Of which: Bank deposits abroad |
- |
- |
- |
0,00 |
|
RUBRICS |
VALUE |
|||
OTHER INFORMATION
Receipts from:
Non-life insurance claims -
|
Operating subsidies - |
Cash at bank and its equivalents not available for use -
ASSETS
IMPAIRMENT
|
|
MOVIMENTOS DO PERIODO DE 2016 IMPAIRMENT LOSSES IMPAIRMENT LOSSES REVERSALS
RECOGNIZED IN ON REVALUED RECOGNIZED IN RUBRICS PROFIT AND RECOGASSETS TOTAL PROFIT AND RECOGNIZED IN TOTAL LOSS NIZED IN LOSS EQUITY EQUITY |
Individual assets
|
Fixed tangible assets 53.010,08 - 53.010,08 0,00 - - |
Goodwill - - - 0,00 - -
|
Intangible assets 0,00 - - 0,00 - - |
Investment properties (cost model) 0,00 - - 150.000,00 - 150.000,00
|
Investments in progress 0,00 - - 137.612,36 - 137.612,36 |
Financial investments 0,00 - - 0,00 - -
|
TOTAL 53.010,08 0,00 53.010,08 287.612,36 0,00 287.612,36 |
of which: cash-generating units 0,00 - - 0,00 - -
GOVERNMENT
GRANTS AND GOVERNMENT ASSISTANCE
|
|
GRANTS FROM STATE AND OTHER GRANTS FROM
OTHER ENTITIES PUBLIC BODIES VALUE ASSIGNED VALUE ASSIGNED |
RUBRICS IN THE PERIOD OR
VALUE ATTRIBUTED IN THE PERIOD OR ATTRIBU VALUE
IN PREVIOUS TO THE PERIOD IN PREVIOUS THE TED TO
PERIODS PERIODS PERIOD
Grants related to assets/investment: - 0,00 - 0,00
|
Fixed tangible assets - 0,00 - 0,00 |
Land and Natural Resources - - - -
|
Buildings and other structures - - - - |
Basic equipment - - - -
|
Transport equipment - - - - |
Office equipment - - - -
|
Biological equipment - - - - |
Others - - - -
|
Intangible assets - 0,00 - 0,00 |
Development projects - - - -
|
Computer programmes - - - - |
Industrial property - - - -
|
Others - - - - |
Other assets - - - -
|
Grants related to income
/ operating - - - - |
Value of repayments
in the period: - 0,00 - 0,00
|
Grants related to assets/investment - - - - |
Grants related to income
/ operating - - - -
|
TOTAL - 0,00 - 0,00 |
IMPAIRMENT
LOSSES IN FINANCIAL ASSETS AT COST OR AT AMORTIZED COST
|
|
MOVIMENTOS DO PERIODO DE 2016 RUBRICS IMPAIRMENT LOSSES
IMPAIRMENT LOSSES TOTAL REVERSALS |
Receivable debts from customers 171.548,60 105.692,81 65.855,79
|
Other receivables - - 0,00 |
Equity instruments and other securities - - 0,00
|
Others - - 0,00 |
TOTAL 171.548,60 105.692,81 65.855,79
DEBTS
REGISTERED AS DOUBTFUL
|
|
RUBRICS VALUE |
Regarding insolvency and company recovery procedures or enforcement procedures -
|
Claimed in court - |
In arrears: 65.855,79
|
Over six months and up to twelve
months - |
Over twelve months and up to eighteen months -
|
Over eighteen months
and up to twenty four months - |
Over twenty four months 65.855,79
|
TOTAL |
|
65.855,79 |
EMPLOYEE
BENEFITS, COMPANY EMPLOYEES AND PERSONNEL COSTS
|
||
|
RUBRICS |
AVERAGE NUMBER OF EMPLOYEES |
AVERAGE NUMBER OF HOURS WORKED |
EMPLOYEE
BENEFITS, COMPANY EMPLOYEES AND PERSONNEL COSTS
|
||
|
|
AVERAGE
NUMBER OF |
AVERAGE
NUMBER OF |
|
RUBRICS |
|
|
|
|
EMPLOYEES |
HOURS
WORKED |
|
Company employees, paid and unpaid |
222 |
430.223 |
|
Paid
company employees |
222 |
430.223 |
|
Company
UNPAID employees |
0 |
- |
|
Company
employees, by type of working hours |
|
|
|
Full
time company employees |
222 |
430.223 |
|
Of
which: Full time company employees |
222 |
430.223 |
|
Part time company employees |
- |
- |
|
Of
which: Part time company employees |
- |
- |
|
Company
employees, by gender: |
|
|
|
Men |
86 |
166.663 |
|
Women |
136 |
263.560 |
|
Company
employees, of which: |
|
|
|
Company employees assigned to Research and
Development |
66 |
- |
|
Service
providers |
32 |
79.523 |
|
People
placed through temporary employment agencies |
39 |
- |
|
STAFF
COSTS |
|
|
|
RUBRICS |
|
VALUE |
|
Staff
costs |
|
9.476.043,72 |
|
Governance
Bodies Remuneration |
|
340.603,60 |
|
Of
which: Profit-sharing |
|
- |
|
Employees
remuneration |
|
6.461.554,09 |
|
Of
which: Profit-sharing |
|
- |
|
Post-employment
benefits |
|
0,00 |
|
Pension
premiums |
|
- |
|
Other
benefits |
|
- |
|
Of
which: |
|
|
|
For
defined contribution plans - corporate bodies |
|
- |
|
For
defined contribution plans - others |
|
- |
|
Compensations |
|
22.298,36 |
|
Charges
on remunerations |
|
1.569.955,80 |
|
Insurance
for accidents at work and professional
diseases |
|
200.763,92 |
|
Social
security expenses |
|
|
|
0,00 |
|
Other
staff costs |
|
|
|
880.867,95 |
|
Of
which: |
|
|
|
|
|
Expenditure
on education |
|
|
|
98.286,00 |
|
Expenditure
on uniforms |
|
|
|
- |
INFORMATION
BY GEOGRAPHIC MARKETS
|
|
|
GEOGRAPHIC
MARKETS |
|
|
|
RUBRICS |
INTERNAL |
EU |
EXTRA-EU |
TOTAL |
|
Sales |
60.174.604,08 |
814.276,53 |
2.615.384,94 |
63.604.265,55 |
|
Services
provided |
64.194,02 |
29.513,14 |
78.345,09 |
172.052,25 |
|
Purchases |
9.028.627,95 |
16.152.591,25 |
4.954.790,86 |
30.136.010,06 |
|
Supplies and external services |
7.315.283,65 |
292.735,36 |
152.489,34 |
7.760.508,35 |
|
Acquisition
of fixed tangible assets |
1.707.643,94 |
29.383,19 |
- |
1.737.027,13 |
|
Acquisition
of investment properties |
- |
- |
- |
0,00 |
|
Acquisition
of intangible assets |
863.535,54 |
201.428,56 |
40.000,00 |
1.104.964,10 |
|
Supplementary
income: |
86.529,06 |
35.479,74 |
0,00 |
122.008,80 |
|
Social
services |
- |
- |
- |
0,00 |
|
Equipment
rental |
- |
- |
- |
0,00 |
|
Studies, projects and technological assistance |
- |
- |
- |
0,00 |
|
Royalities |
- |
- |
- |
0,00 |
|
Others |
86.529,06 |
35.479,74 |
- |
122.008,80 |
|
Memorandum: Sales and services provided (undiscounted
values) |
- |
- |
- |
0,00 |
|
Memorandum:
Purchases and supplies and external services (undiscounted values) |
- |
- |
- |
0,00 |
|
RECEIVABLE AND PAYABLE ACCOUNTS |
|
|
|
|
RUBRICS |
2016 |
2015 |
PERIODS |
|
CUSTOMERS |
|
|
|
|
Trade accounts receivable |
7.317.452,03 |
8.556.132,93 |
(14,48)% |
|
Trade notes receivable |
- |
- |
- |
|
Advances received from customers |
- |
- |
- |
|
SUPPLIERS |
|
|
|
|
Trade accounts payable |
10.655.532,90 |
14.655.952,95 |
(27,30)% |
|
Trade notes payable |
- |
- |
- |
|
Trade accounts payable - unchecked
invoices |
- |
- |
- |
|
Advances to suppliers |
433.607,35 |
1.128.277,25 |
(61,57)% |
|
STAFF |
|
|
|
|
Payable remunerations |
1.447,59 |
199.256,22 |
(99,27)% |
|
Advanced payments |
35.500,00 |
37.450,00 |
(5,21)% |
|
Bonds |
- |
- |
- |
|
Other operations |
- |
- |
- |
|
STATE
AND OTHER PUBLIC SECTOR INSTITUTIONS |
|
|
|
|
Income
Tax |
293.742,88 |
97.196,22 |
202,22% |
|
Deductible
IVA (debt cumulative amounts) |
5.946.174,19 |
7.687.546,88 |
(22,65)% |
|
Paid
IVA (credit cumulative amounts) |
6.317.697,22 |
7.549.528,67 |
(16,32)% |
|
SHAREHOLDERS
/ PARTNERS |
|
|
|
|
Shareholders
with subscription |
- |
- |
- |
|
Unreleased
quotas |
- |
- |
- |
|
Advances
for profits |
- |
- |
- |
|
ALLOCATED
RESULTS |
|
|
|
|
From
the perspective of the entity distributing profits |
- |
- |
- |
|
From
the perspective of the entity with allocated profits |
- |
- |
- |
|
AVAILABLE
PROFITS |
|
|
|
|
From
the perspective of the entity distributing profits |
- |
- |
- |
|
From
the perspective of the entity with allocated profits |
- |
- |
- |
|
Granted
loans - parent company |
- |
- |
- |
|
Granted
loans - subsidiary companies, associated
companies and joint |
|
|
|
|
|
- |
- |
- |
|
ventures |
|
|
|
|
Granted
loans - other shareholders/partners |
- |
- |
- |
|
Of
which: Participating companies |
- |
- |
- |
|
OTHER
OPERATIONS |
|
|
|
|
Debit
status |
- |
- |
- |
|
Credit
status |
- |
- |
- |
|
OTHER
RECEIVABLE AND PAYABLE ACCOUNTS |
|
|
|
|
Investment providers - general accounts |
- |
- |
- |
|
Trade
accounts payable - unchecked invoices |
- |
- |
- |
|
Advanced
payments to investment providers |
- |
- |
- |
|
additional
income - Debtors |
- |
- |
- |
|
additional expenses - Creditors |
56.573.542,77 |
52.590.446,51 |
7,57% |
|
Deferred
tax assets |
1.898.960,12 |
2.531.450,64 |
(24,99)% |
|
Deferred
tax liabilities |
130.207,50 |
144.675,00 |
(10,00)% |
|
Unreleased
subscriptions - Creditors |
- |
- |
- |
|
Advances received on account of sales |
- |
- |
- |
|
OTHER
DEBTORS AND CREDITORS |
|
|
|
|
Other
debtors |
36.879,40 |
69.139,37 |
(46,66)% |
|
Other
creditors |
3.007.180,09 |
8.004.258,91 |
(62,43)% |
EXPENSE
ACCOUNTS
|
|
|
|
|
RUBRICS |
2016 |
2015 |
PERIODS |
|
Supplies and external services |
7.760.508,35 |
8.364.631,48 |
(7,22)% |
|
Subcontracts |
1.307.151,80 |
1.245.817,43 |
4,92% |
|
Specialized
services |
3.190.382,94 |
3.615.769,68 |
(11,76)% |
|
Specialized
works |
1.770.041,56 |
1.712.984,88 |
3,33% |
|
Of
which: Payments to workers placed through agencies |
- |
- |
- |
|
Advertising
and promotion |
306.303,16 |
252.770,56 |
21,18% |
|
Surveillance
and security |
74.135,65 |
144.335,66 |
(48,64)% |
|
Fees |
- |
2.160,00 |
- |
|
Comissions |
- |
- |
- |
|
Maintenance
and repairs |
646.438,21 |
724.570,84 |
(10,78)% |
|
Others |
393.464,36 |
778.947,74 |
(49,49)% |
|
Materials |
470.520,32 |
457.104,75 |
2,93% |
|
Fast
wear tools and utensils |
141.246,16 |
122.038,48 |
15,74% |
|
Books and technical documentation |
7.252,15 |
12.417,81 |
(41,60)% |
|
Office
material |
31.270,06 |
44.696,31 |
(30,04)% |
|
Gift
items |
14.865,95 |
17.529,79 |
(15,20)% |
|
Others |
275.886,00 |
260.422,36 |
5,94% |
|
Energy
and fluids |
769.215,77 |
929.549,00 |
(17,25)% |
|
Electricity |
408.008,81 |
516.772,87 |
(21,05)% |
|
Fuels |
200.449,42 |
197.321,16 |
1,59% |
|
Water |
50.089,37 |
87.721,78 |
(42,90)% |
|
Others |
110.668,17 |
127.733,19 |
(13,36)% |
|
Travel, lodging and transportation |
407.780,95 |
419.391,05 |
(2,77)% |
|
Travel
and lodging |
197.898,04 |
192.255,59 |
2,93% |
|
Transport
of personnel |
87.615,15 |
84.815,00 |
3,30% |
|
Transport
of goods |
107.020,67 |
122.228,04 |
(12,44)% |
|
Others |
15.247,09 |
20.092,42 |
(24,12)% |
|
Different
services |
1.615.456,57 |
1.696.999,57 |
(4,81)% |
|
Rents
and leases |
703.545,75 |
814.200,30 |
(13,59)% |
|
Of
which: Rents from land |
- |
- |
- |
|
Communication |
147.031,23 |
148.798,14 |
(1,19)% |
|
Insurance |
147.393,62 |
123.857,46 |
19,00% |
|
Royalties |
- |
- |
- |
|
Litigation
and Notaries |
97.895,50 |
119.491,39 |
(18,07)% |
|
Representation
expenses |
195.852,28 |
144.792,93 |
35,26% |
|
Cleaning, hygiene and comfort |
289.995,56 |
306.722,15 |
(5,45)% |
|
Other
services |
33.742,63 |
39.137,20 |
(13,78)% |
DELIBERATION
OF APPROVAL OF ACCOUNTS
Were
the financial year's accounts approved?
YES
Data
da Aprovação: 30-05-2017 By (Unanimity/Majority):
Unanimity
Percentage
of issued votes related to the share capital subscribed with voting right
100
The
accounts were approved:
In
universal meeting
Through
deliberation by writing vote
The
accounts were approved:
In
POC/SNC/NCM (National Plan of Accounts/Accounting Normalization System/Accounting
Normalization for micro entities)
PROFIT
APLICATION ACCORDING TO THE DELIBERATION THAT APPROVED THE FINANCIAL YEAR'S
ACCOUNTS
|
RUBRICS |
2016 |
2015 |
|
Retained
earnings |
(25.782.789,44) |
(13.996.094,04) |
|
Allocated
results / Available profits |
0,00 |
0,00 |
|
Percentages
or bonuses to managing bodies |
- |
- |
|
Ditto
to staff |
- |
- |
|
Reserves |
- |
- |
|
Coverage
of losses |
- |
- |
|
7.
Others |
- |
- |
|
BALANCE
(1-2-3-4-5-6-7) |
(25.782.789,44) |
(13.996.094,04) |
MANAGEMENT
REPORT / ASSESSMENT OF THE INSPECTION BODY / LEGAL CERTIFICATION OF ACCOUNTS
MANAGEMENT
REPORT
Were
the Management Report and financial year's accounts prepared?
YES
Were
the management report and the financial year's accounts signed by all members
of the management / administration?
YES
ASSESSMENT
OF THE INSPECTION BODY
The
entity has an inspection body?
YES
Has
the inspection body issued an assessment?
YES
The
inspection body pronounced:
In
favour of the approval of accounts
LEGAL
CERTIFICATION OF ACCOUNTS (CLC)
Is
the entity required to have certified accounts by a Statutory Auditor/Statutory
Audit Firm?
YES
Identificação
do ROC: 501776311
Was
the Legal certification of accounts issued?
YES
With
emphasis
FOREIGN EXCHANGE RATES
|
Currency |
Unit
|
Indian Rupees |
|
US Dollar |
1 |
INR 63.46 |
|
|
1 |
INR 86.15 |
|
Euro |
1 |
INR 75.91 |
|
EURO |
1 |
INR 76.12 |
Note :
Above are approximate rates obtained from sources believed to be correct
INFORMATION DETAILS
|
Analysis Done by
: |
NIS |
|
|
|
|
Report Prepared
by : |
DNS |
RATING EXPLANATIONS
|
Credit Rating |
Explanation |
Rating Comments |
|
A++ |
Minimum Risk |
Business dealings permissible with minimum
risk of default |
|
A+ |
Low Risk |
Business dealings permissible with low
risk of default |
|
A |
Acceptable Risk |
Business dealings permissible with
moderate risk of default |
|
B |
Medium Risk |
Business dealings permissible on a regular
monitoring basis |
|
C |
Medium High Risk |
Business dealings permissible preferably
on secured basis |
|
D |
High Risk |
Business dealing not recommended or on
secured terms only |
|
NB |
New Business |
No recommendation can be done due to
business in infancy stage |
|
NT |
No Trace |
No recommendation can be done as the
business is not traceable |
NB is stated where there is insufficient information to facilitate rating. However, it is not to be considered as unfavourable.
This score serves as a reference to assess
SC’s credit risk and to set the amount of credit to be extended. It is
calculated from a composite of weighted scores obtained from each of the major
sections of this report. The assessed factors are as follows:
·
Financial
condition covering various ratios
·
Company
background and operations size
·
Promoters
/ Management background
·
Payment
record
·
Litigation
against the subject
·
Industry
scenario / competitor analysis
·
Supplier
/ Customer / Banker review (wherever available)
This report is issued at
your request without any risk and responsibility on the part of MIRA INFORM
PRIVATE LIMITED (MIPL) or its officials.